WO2010071158A1 - 貯水施設運用支援システム、貯水施設運用支援方法およびプログラム - Google Patents
貯水施設運用支援システム、貯水施設運用支援方法およびプログラム Download PDFInfo
- Publication number
- WO2010071158A1 WO2010071158A1 PCT/JP2009/070996 JP2009070996W WO2010071158A1 WO 2010071158 A1 WO2010071158 A1 WO 2010071158A1 JP 2009070996 W JP2009070996 W JP 2009070996W WO 2010071158 A1 WO2010071158 A1 WO 2010071158A1
- Authority
- WO
- WIPO (PCT)
- Prior art keywords
- water level
- unit
- inflow
- unit period
- amount
- Prior art date
- Legal status (The legal status is an assumption and is not a legal conclusion. Google has not performed a legal analysis and makes no representation as to the accuracy of the status listed.)
- Ceased
Links
Images
















Classifications
-
- G—PHYSICS
- G06—COMPUTING OR CALCULATING; COUNTING
- G06Q—INFORMATION AND COMMUNICATION TECHNOLOGY [ICT] SPECIALLY ADAPTED FOR ADMINISTRATIVE, COMMERCIAL, FINANCIAL, MANAGERIAL OR SUPERVISORY PURPOSES; SYSTEMS OR METHODS SPECIALLY ADAPTED FOR ADMINISTRATIVE, COMMERCIAL, FINANCIAL, MANAGERIAL OR SUPERVISORY PURPOSES, NOT OTHERWISE PROVIDED FOR
- G06Q50/00—Information and communication technology [ICT] specially adapted for implementation of business processes of specific business sectors, e.g. utilities or tourism
- G06Q50/06—Energy or water supply
Definitions
- the present invention relates to a water storage facility operation support system, a water storage facility operation support method, and a program.
- Patent Document 1 Japanese Patent Laid-Open No. 2006-39838
- a power generation operation plan is created by displaying and accepting corrections as necessary.
- This invention is made in view of such a background, and it aims at providing the system, method, and program which support operation of a water storage facility so that the electric power generation amount by hydroelectric power generation can be enlarged. To do.
- a main invention of the present invention for solving the above problems is a system for supporting the operation of a water storage facility for hydroelectric power generation, wherein the water level at the start of a unit period constituting a predetermined operation period, and the unit
- the optimum water level table that stores the optimum water level that is the optimum water level at the end of the unit period in association with the inflow amount to the water storage facility during the period, and the water level of the water storage facility at the start of the operation period
- a water level acquisition unit to acquire, a predicted inflow amount acquisition unit to acquire a predicted value of the inflow amount in each unit period, and a water level at the start time and a predicted value of the inflow amount in the unit period for each unit period.
- the corresponding optimum water level is read from the optimum water level table, and the read optimum water level is the start time of the next unit period of the unit period.
- a water level plan storage unit that stores the optimum water level for each unit period, and at the end of each unit period, the water level acquisition unit is configured to store the water storage facility at the current time point.
- the predicted inflow amount acquisition unit acquires a predicted value of the inflow amount after the next unit period of the unit period, and the water level planning unit acquires the current water level after the next unit period.
- the optimum water level is read from the optimum water level table for each unit period after the next unit period, and the water level plan storage unit is updated with the read optimum water level.
- the predicted inflow amount acquisition unit acquires a plurality of predicted values of the inflow amount in each unit period and the occurrence probability of the predicted value, and the optimum water level table Is generated by probabilistic dynamic programming based on each water level that the water storage facility can take, the predicted value of the inflow amount in each unit period, and the occurrence probability of the predicted value of the inflow amount. It may be.
- a database that stores the actual value of the inflow amount, the inflow amount in a second unit period immediately before a certain first unit period, and a predetermined constant
- a model storage unit for storing a statistical model having a difference from the equilibrium inflow amount as an explanatory variable and an increase amount of the inflow amount from the second unit period to the first unit period as a target variable
- An inflow amount model estimation unit that performs regression analysis based on the stored actual value of the inflow amount and the statistical model, and estimates a regression coefficient for the explanatory variable and the equilibrium inflow amount, and each unit period
- the first actual value of the inflow amount corresponding to the second unit period immediately before the first unit period, which is the unit period, and the second actual result of the inflow amount corresponding to the first period Is obtained by subtracting the value obtained by subtracting the second actual value from the estimated equilibrium inflow amount and the regression coefficient, and subtracting the difference between the first and second actual values.
- a residual term frequency distribution generation unit that calculates a residual term and generates a frequency distribution of the residual term; and for each unit period, a first actual value of the inflow corresponding to the second unit period And a drift obtained by reading the second actual value of the inflow corresponding to the first unit period from the database, and subtracting the second actual value from the estimated balanced inflow, and multiplying by the regression coefficient.
- a drift term frequency distribution generation unit that generates a frequency distribution of the drift term and adds the frequency distribution of the residual term and the frequency distribution of the drift term to generate the frequency distribution of the inflow amount.
- Frequency of the inflow A probability distribution generation unit that generates the occurrence probability distribution of the inflow amount from a cloth, and the predicted inflow amount acquisition unit uses each value in a predetermined range that the inflow amount can take as a predicted value of the inflow amount.
- the occurrence probability of the predicted value of the inflow amount may be calculated based on the occurrence probability distribution.
- Another aspect of the present invention is a method for supporting the operation of a water storage facility for hydroelectric power generation, wherein the water level at the start of a unit period constituting a predetermined operation period, and the water storage facility in the unit period
- a computer having an optimum water level table that stores an optimum water level that is an optimum water level at the end of the unit period in association with the amount of inflow into the unit period acquires the water level of the water storage facility at the start of the operation period.
- the optimal value corresponding to the water level at the start time and the predicted value of the inflow amount in the unit period The water level is read from the optimum water level table, and the read optimum water level is used as the water level at the start of the unit period next to the unit period.
- the optimum water level for each unit period is stored in a memory, and at the end of each unit period, a current water level that is the water level of the water storage facility at the current time point is acquired, and after the next unit period of the unit period The predicted value of the inflow amount at the time is acquired, the current water level is set as the water level at the start of the next unit period, and the optimum water level is read from the optimum water level table for each unit period after the next unit period. Then, the memory is updated with the read optimum water level.
- another aspect of the present invention is a program for supporting the operation of a water storage facility for hydroelectric power generation, wherein the water level at the start of a unit period constituting a predetermined operation period, and the above-described unit period
- An optimal water level table that stores an optimal water level that is an optimal water level at the end of the unit period in association with an inflow amount to the water storage facility, and a computer comprising the optimal water level table that stores the optimal water level at the end of the unit period.
- a step of acquiring a water level a step of acquiring a predicted value of an inflow amount in each unit period before the start of the operation period, and a water level at the start time and the inflow amount in the unit period for each unit period.
- the optimum water level corresponding to the predicted value is read from the optimum water level table, and the read optimum water level is read for the unit period. And the step of storing the optimum water level for each unit period in a memory is performed, and at the end of each unit period, the water level of the water storage facility at the present time is executed. Obtaining a current water level, obtaining a predicted value of the inflow after the next unit period of the unit period, and setting the current water level as a water level at the start of the next unit period. The step of reading the optimum water level from the optimum water level table for each of the unit periods after the unit period and the step of updating the memory with the read optimum water level are executed.
- the amount of electric power generated by hydroelectric power generation can be increased.
- FIG. 1 It is a figure which shows the flow of the creation process of the weather pattern information based on a weather forecast. It is a graph which shows the change of inflow when there is no precipitation. It is a graph which shows the change of inflow when there is precipitation. It is a graph which shows the change of inflow when there is snow melting. It is a figure which shows the hardware constitutions of the inflow amount prediction system 20 of this embodiment. It is a figure which shows the software structure of the inflow amount prediction system 20 of this embodiment. It is a figure which shows the structural example of the weather performance information memorize
- FIG. 2 is a diagram illustrating a hardware configuration of an operation planning system 30.
- FIG. 2 is a diagram illustrating a software configuration of an operation planning system 30.
- FIG. It is a figure which shows the structural example of the specification information memorize
- FIG. It is a figure which shows the structural example of the optimal water level database 334.
- FIG. It is a figure for demonstrating the method of calculating
- the operation support system of the present embodiment provides support for appropriately operating the water level in a water storage facility such as a dam.
- precipitation is predicted using past weather patterns, and the amount of water flowing into the water storage facility due to rivers, precipitation, etc. using a statistical model (hereinafter simply referred to as inflow).
- the water level plan is formulated so as to calculate the probability distribution and maximize the amount of power generated.
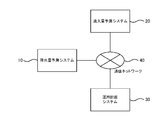
- FIG. 1 is a diagram showing the overall configuration of the operation support system of the present embodiment.
- the operation support system according to the present embodiment includes a precipitation prediction system 10, an inflow prediction system 20, and an operation planning system 30.
- the precipitation prediction system 10, the inflow prediction system 20, and the operation planning system 30 are each connected to a communication network 40 and can communicate with each other.
- the communication network 40 is, for example, the Internet or a LAN (Local Area Network), and is constructed by Ethernet (registered trademark), a public telephone line network, a wireless communication network, or the like.
- the precipitation prediction system 10 is a computer that predicts precipitation.
- the inflow amount prediction system 20 is a computer that predicts the inflow amount to the water storage facility. In the present embodiment, the inflow amount prediction system 20 calculates the inflow amount and the probability distribution of the inflow amount.
- the operation planning system 30 creates an optimal water level plan in the water storage facility.
- various computers such as a personal computer, a workstation, a PDA (Personal Digital Assistant), and a mobile phone terminal can be employed.
- the precipitation prediction system 10 patterns the past weather conditions in advance, patterns the future weather forecast, and uses the percentile value of the precipitation of the past date of the same pattern to calculate the precipitation amount. Make a prediction.
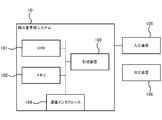
- FIG. 2 is a diagram illustrating a hardware configuration of the precipitation prediction system 10.
- the precipitation prediction system 10 includes a CPU 101, a memory 102, a storage device 103, a communication interface 104, an input device 105, and an output device 106.
- the storage device 103 stores various programs and data, for example, a hard disk drive, a flash memory, a CD-ROM drive, and the like.
- the CPU 101 implements various functions by reading a program stored in the storage device 103 into the memory 102 and executing it.
- the communication interface 104 is an interface for connecting to the communication network 40.
- the communication interface 104 is constructed by, for example, Ethernet (registered trademark), a public telephone line network, or a wireless communication network.
- the input device 105 is, for example, a keyboard, a mouse, a touch panel, or a microphone that receives data input from a user.
- the output device 106 is, for example, a display, a printer, or a speaker that outputs data.
- FIG. 3 is a diagram showing a software configuration of the precipitation prediction system 10.
- the precipitation prediction system 10 includes a weather overview acquisition unit 111, a weather pattern registration unit 112, a predicted precipitation acquisition request reception unit 113, a weather forecast acquisition unit 114, a precipitation prediction unit 115, a predicted precipitation transmission unit 116, and a weather overview database. 131 and a weather pattern database 132 are provided.
- the weather forecast acquisition unit 111, the weather pattern registration unit 112, the predicted precipitation acquisition request reception unit 113, the weather forecast acquisition unit 114, the precipitation prediction unit 115, and the predicted precipitation transmission unit 116 are provided in the precipitation prediction system 10. This is realized by the CPU 101 reading out the program stored in the storage device 103 to the memory 102 and executing it.
- the weather overview database 131 and the weather pattern database 132 are realized as storage areas provided by the memory 102 and the storage device 103 provided in the precipitation prediction system.
- the weather overview database 131 stores information (hereinafter referred to as weather overview information) indicating the weather of past dates and the results of precipitation.
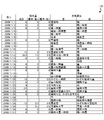
- FIG. 4 is a diagram illustrating a configuration example of weather summary information stored in the weather summary database 131.
- the weather summary information includes the date, the total precipitation amount of the day, the maximum precipitation amount in the daytime period (06: 00-18: 00), and the night time period (18 0: 00 to the next day 06:00), the text information indicating the weather in the daytime period (hereinafter referred to as the weather overview), and the weather overview in the night time zone.
- the weather overview information is generally provided by the Japan Meteorological Agency or weather companies.
- the weather overview acquisition unit 111 acquires weather overview information.
- the weather overview acquisition unit 111 can, for example, access a server operated by the Japan Meteorological Agency or a private weather company to acquire weather overview information. Moreover, you may make it the weather general condition acquisition part 111 receive the input of weather general condition information from a user.
- the weather pattern database 132 stores information (hereinafter referred to as weather pattern information) in which weather conditions are patterned for each date.
- FIG. 5 is a diagram illustrating a configuration example of weather pattern information stored in the weather pattern database 132.
- a term hereinafter referred to as a weather word
- a time word indicating a time when the weather occurs
- the term indicating the weather is any one of “sunny”, “cloudy”, “snow”, “rain”, and “heavy rain”, and the time word is “sometimes” “sometimes”. It shall be either “temporary” or “after”.
- the time word includes a null character (indicating that no time is specified). That is, as shown in FIG.
- the weather pattern is “sunny”, “cloudy”, “snow”, “rain”, “heavy rain”, “sometimes heavy rain”, “temporarily heavy rain”, “after heavy rain”, “sometimes rain”, “ “Temporary rain”, “After rain”, “Sometimes snow”, “Temporary snow”, “After snow”, “Sometimes cloudy”, “Temporarily cloudy”, “After cloudy”, “Sometimes sunny”, “Temporarily sunny”, and “God sunny”.
- the weather pattern registration unit 112 generates weather pattern information based on the weather overview information and registers it in the weather pattern database 132.
- FIG. 6 is a diagram showing a flow of weather pattern information registration processing.
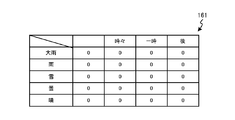
- FIG. 7 is a diagram showing a configuration of a table (hereinafter referred to as a pattern table 161) used for weather pattern information registration processing.
- the pattern table 161 is a table with weather as a row and time words as a column. Further, in the matrix of the pattern table 161, items having a high degree of precipitation are arranged so as to be above and to the left. In the example of the pattern table 161 in FIG. 7, the rows are arranged in the order of “heavy rain”, “rain”, “snow”, “cloudy”, and “clear”, and the columns are arranged in the order of “temporary”, “sometimes”, and “after”. Yes.
- the weather overview acquisition unit 111 first acquires weather overview information (S1511).
- the weather pattern registration unit 112 generates a pattern table 161 in which “0” is set in each cell (S1512).
- the weather pattern registration unit 112 performs the following processing for each of the daytime weather overview and the nighttime weather overview included in the weather overview information.
- the weather pattern registration unit 112 deletes words other than weather words and time words from the weather overview (S1513), divides the weather overview immediately after the term indicating weather, and sets the divided words as weather chunks (S1514). .
- the weather pattern registration unit 112 sets the value of the pattern table 161 corresponding to the time word and the weather included in the weather chunk to “1” for each divided weather chunk (S1515).
- the weather pattern registration unit 112 After the weather pattern registration unit 112 performs the above process for each of the weather conditions in the daytime period and the weather conditions in the nighttime period, a cell in which “1” is set for each row of the pattern table 161 is displayed. The leftmost cell is searched, and “0” is set in all the cells to the right of the searched cell (S1516). For each column of the pattern table 161, the weather pattern registration unit 112 searches for the uppermost cell in which “1” is set, and sets “0” to all cells below the searched cell. Is set (S1517).
- the weather pattern registration unit 112 creates weather pattern information including a combination of a time word and a weather word and a date from the pattern table 161 created as described above, and registers it in the weather pattern database 132 (S1518). .
- FIG. 8 is a diagram for explaining a specific example of the registration process of the weather pattern information based on the weather overview information.
- the weather overview 1711 for the noon time zone included in the weather overview information is “cloudy after a cloudy rain” and the weather overview 1712 for a night time zone is “temporarily cloudy after the sky”.
- the weather pattern registration unit 112 divides the daytime weather overview 1711 immediately after the weather word, that is, after “cloudy”, “rainy”, and “sunny”, and displays “cloudy”, “temporarily raining”, and “afternoon”. A weather chunk is created (S1514).
- the weather pattern registration unit 112 corresponds to a weather word and a time word included in each weather chunk, that is, a cell 1721 corresponding to “cloudy” and an empty character, and a cell corresponding to “rain” and “temporary”. 1722, and “1” is set in the cell 1723 corresponding to “clear” and “after” (S1515).
- the weather pattern registration unit 112 also divides the weather overview 1712 for the night time zone into weather chunks of “sunny” and “temporarily cloudy after” (S1514), and cells corresponding to “sunny” and sky characters. 1731, and “1” is set in the cells 1732 and 1733 corresponding to “cloudy”, “temporary”, and “after”, respectively (S1515).
- the weather pattern registration unit 112 sets “0” in other cells, leaving only the leftmost “1” in each row of the pattern table 161 (S1516). In the row 174, the leftmost cell 1741 among the cells in which “1” is set is left, and “0” is set in the other cells 1742 and 1743.
- the weather pattern registration unit 112 sets “0” in the other cells, leaving only the top “1” in each column of the pattern table 161 (S1517). In the column 175, the cell 1751 at the top of the cells set with “1” is left, and “0” is set in the other cells 1752.
- the pattern table 161 in FIG. 8 indicates that “1” is set only in the cell 1751 corresponding to “cloudy” and blank and the cell 1753 corresponding to “rain” and “temporary”. Become. Based on the pattern table 161, weather pattern information 177 in which “1” is set only for “cloudy” and “temporary rain” is generated and registered in the weather pattern database 132.
- the predicted precipitation acquisition request receiving unit 113 receives a command (hereinafter referred to as predicted precipitation acquisition) for acquiring a predicted precipitation value (hereinafter also referred to as predicted precipitation) from another computer connected to the communication network 40. Request).
- a percentile setting value (hereinafter referred to as a percentile setting value) is set in the predicted precipitation acquisition request.
- the percentile setting value for example, an arbitrary numerical value (0 ⁇ percentile setting value ⁇ 1) such as 5% or 10% can be set.
- the weather forecast acquisition unit 114 acquires information describing the weather forecast (hereinafter referred to as weather forecast information).
- the weather forecast acquisition unit 114 may acquire weather forecast information from, for example, the Japan Meteorological Agency or a weather company, or may accept input of weather forecast information from the user.
- the weather forecast information includes a date and a weather forecast on that date. Unlike the weather overview information, the weather forecast information describes the weather on a daily basis. On the other hand, the weather forecast information describes the weather and, if necessary, a time word, like the weather overview.
- the precipitation prediction unit 115 calculates the predicted precipitation, and the predicted precipitation transmission unit 116 transmits the predicted precipitation calculated by the precipitation prediction unit 115 to the transmission source of the predicted precipitation acquisition request.
- the precipitation forecasting unit 115 patterns the weather forecast obtained by the weather forecast obtaining unit 114, obtains and sorts the precipitation of the same day in the past, obtains the percentile value based on the percentile setting value, and predicts the precipitation Amount.
- FIG. 9 is a diagram showing a flow of precipitation prediction processing.
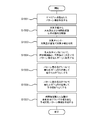
- FIG. 10 is a diagram showing a flow of processing for creating weather pattern information based on the weather forecast.
- the precipitation prediction unit 115 creates the pattern table 161 of FIG. 7 and sets “0” in all the cells (S1551).
- the precipitation prediction unit 115 deletes words other than the weather word and the time word from the weather forecast (S1552), divides the weather forecast immediately after each weather word, and sets the divided character string as a weather chunk (S1553). ).
- the precipitation amount prediction unit 115 sets “1” in the cell of the pattern table 161 corresponding to the time word and the weather word included in the weather chunk for each weather chunk (S1554). For each row of the pattern table 161, the precipitation amount prediction unit 115 selects the leftmost cell among the cells set with “1”, and sets “0” to all the cells to the right of the selected cell. Set (S1555). In addition, for each column of the pattern table 161, the precipitation amount predicting unit 115 selects the uppermost cell among the cells in which “1” is set, and assigns “all” to all the cells below the selected cell. "0” is set (S1556).
- the precipitation prediction unit 115 extracts the cell value corresponding to each combination of the time designation word and the weather word from the pattern table 161, and creates forecast weather pattern information in which the extracted value is set ( S1557).
- the precipitation prediction unit 115 searches the weather pattern database 132 for a date that matches the created forecast weather pattern information that is in the same month as the date included in the weather forecast information (S1533). ), The precipitation corresponding to the searched date is acquired from the weather overview database 131 (S1534).
- the precipitation prediction unit 115 sorts the acquired precipitations in ascending order (S1535), and converts the value obtained by multiplying the number of acquired precipitations by the percentile setting value included in the predicted precipitation acquisition request to an integer value. Is set to n (S1536).
- the precipitation prediction unit 115 sets the n-th precipitation from the top of the sorted precipitations as the predicted precipitation (S1537).
- past weather conditions are patterned and stored in association with precipitation, future weather forecasts are patterned, and past of the same pattern is stored. Can be used as a forecast for the future. Weather and precipitation are known to correlate, and precipitation can be predicted with high accuracy. Moreover, according to the precipitation prediction system 10 of this embodiment, since the character string contained in a weather general condition can be patterned and memorize
- the date matching the forecast weather pattern information is searched for the same month as the date included in the weather forecast information.
- the weather pattern information Includes typhoon information indicating whether or not a typhoon has occurred in the forecasted area and rainy season information indicating whether or not a rainy season has occurred. You may make it search the thing of the same month as a forecast day among the dates with which information or rainy season information matches.
- the pattern of precipitation differs depending on whether a typhoon is occurring or not, whether it is rainy season, or not.
- Precipitation can be predicted based on the value. Therefore, more accurate precipitation can be predicted.
- the inflow amount prediction system 20 predicts the inflow amount to the water storage facility.
- the inflow prediction system 20 estimates a regression coefficient by performing regression analysis on past temperature, precipitation, snowfall, snow cover, snowmelt, and inflow using a statistical model described later, Predicted values of temperature and precipitation (for example, predicted values from weather forecasts) and estimated regression coefficients are applied to a statistical model to predict inflow.
- the inflow amount is predicted in a predetermined first unit period (in this embodiment, one day), and the probability distribution of the inflow amount is a second unit period (this embodiment) longer than the first unit period. In the form, it is one month.) It shall be done in units.
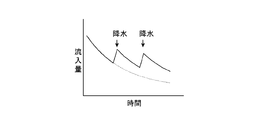
- FIGS. 11 to 13 are graphs showing changes in the inflow amount. Even when there is no precipitation or snowmelt, there is a predetermined inflow due to, for example, oozing from a forest. Therefore, if there is no precipitation or snowmelt, the inflow will gradually decrease to a predetermined equilibrium value (hereinafter referred to as equilibrium inflow) (FIG. 11). On the other hand, if there is precipitation, the amount of water flowing temporarily increases accordingly, but the precipitation stops and starts decreasing again toward the equilibrium inflow (Fig. 12). On the other hand, when the temperature rises, snow melts and the amount of water flowing increases accordingly, but the effect of snow melt on the inflow is more gradual than that of precipitation (FIG. 13). This is a case where, for example, snow melting continuously occurs when the average temperature rises during the period from winter to spring.
- the inflow is predicted using a regression model that calculates the inflow.
- the inflow prediction system 20 of this embodiment estimates parameters based on actual values of weather data such as past temperature and precipitation and a regression model to be described later, and is obtained from the estimated parameters and, for example, weather forecasts.
- the predicted value of inflow is calculated by applying the predicted value of temperature (hereinafter referred to as predicted temperature) and the predicted precipitation obtained by the precipitation prediction system to the regression model. Details will be described below.
- FIG. 14 is a diagram illustrating a hardware configuration of the inflow amount prediction system 20 of the present embodiment.
- the inflow amount prediction system 20 includes a CPU 201, a memory 202, a storage device 203, a communication interface 204, an input device 205, and an output device 206.
- the storage device 204 stores various programs and data, for example, a hard disk drive, a flash memory, a CD-ROM drive, or the like.
- the CPU 201 implements various functions by reading a program stored in the storage device 203 into the memory 202 and executing it.
- the communication interface 204 is an adapter for connecting to the communication network 40.
- the communication interface 204 is constructed by, for example, Ethernet (registered trademark), a public telephone line network, or a wireless communication network.
- the input device 205 is, for example, a keyboard, a mouse, a touch panel, or a microphone that receives data input from a user.
- the output device 206 is, for example, a display, a printer, or a speaker that outputs data.
- FIG. 15 is a diagram showing a software configuration of the inflow amount prediction system 20 of the present embodiment.
- the inflow prediction system 20 of this embodiment includes a snowfall temperature estimation unit 211, a snowmelt amount model estimation unit 212, an inflow amount model estimation unit 213, a predicted temperature acquisition unit 214, a predicted precipitation amount acquisition unit 215, and a predicted inflow amount acquisition request reception.
- the predicted inflow amount transmission unit 218, the inflow amount distribution acquisition request reception unit 219, the inflow amount occurrence probability model estimation unit 220, the inflow amount distribution generation unit 221, and the inflow amount distribution transmission unit 222 are stored in the CPU 11 of the inflow amount prediction system 20. This is realized by reading the program stored in the device 13 into the memory 12 and executing it.
- the model storage unit 231, parameter storage unit 232, and weather performance database 233 are realized as storage areas provided by the memory 202 and the storage device 203 of the inflow amount prediction system 20.
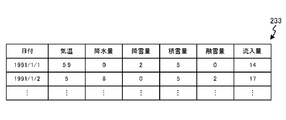
- the meteorological record database 233 stores a history of information including various meteorological record values (hereinafter referred to as meteorological record information).
- FIG. 16 is a diagram illustrating a configuration example of weather performance information stored in the weather performance database 233.
- the weather result information includes temperature, precipitation, snowfall, snow cover, snowmelt, and inflow in association with the date.
- the temperature is the average daily temperature.
- Precipitation, snowfall and snowmelt are cumulative values of daily precipitation, snowfall and snowmelt.
- the snow cover is the snow cover observed on that day.
- the inflow is the cumulative amount of water that has flowed into a water storage facility such as a dam per day.
- the temperature, precipitation amount, snowfall amount, and snowfall amount are data provided by, for example, the Japan Meteorological Agency or a private weather company.
- the inflow is a measured value measured at the water storage facility.
- the inflow amount may be, for example, a measurement value of a river flow rate provided by a local government that manages the river.
- the amount of snowmelt may be measured by the Japan Meteorological Agency, a private weather company, a surveying company, or the like, or a value calculated by a model described later may be recorded as an actual value.
- the model storage unit 231 stores various statistical models based on weather performance information, and the parameter storage unit 232 stores parameters such as regression coefficients and constants applied to the models stored in the model storage unit 231. Is done.
- the model storage unit 231 includes a precipitation statistical model (hereinafter referred to as precipitation model A1), a snowfall statistical model (hereinafter referred to as snowfall model A2), and a snowfall statistical model (hereinafter referred to as snowfall model).
- snowmelt model A4 a statistical model of snowmelt
- inflow model A5 a statistical model related to the increase in inflow from the previous day
- inflow model A5 a statistical model related to the increase in inflow from the previous day
- inflow probability model A6 the probability of occurrence of inflow Is stored
- the temperature at which the rain changes to snow hereinafter referred to as snow temperature
- the daily equilibrium inflow ⁇ 1 the daily equilibrium inflow ⁇ 1
- the monthly inflow ⁇ 3 the temperature at which snow melting starts ⁇ 2
- regression coefficient ⁇ 1 to ⁇ 4 , ⁇ 1 , ⁇ 2 are stored in the parameter storage unit 32. It is assumed that the daily inflow ⁇ 1 and the temperature ⁇ 2 at which snow melting starts are stored in the parameter storage unit 132 in advance as predetermined constants.
- the temperature at the date t, rainfall, snowfall, snowfall, snowmelt and inflow respectively, T t, and P t, S t, D t, M t, and F t.
- ⁇ Ft be the increase in the inflow from the previous day.
- the precipitation when the temperature Tt is higher than ⁇ is P1 t
- the precipitation when the temperature T t is ⁇ or less is P2 t .
- the inflow of month m and F m the average of the past inflow for month m and I m.
- An inflow amount normalized by dividing F m by I m is defined as F m *
- an increase amount of the inflow amount is normalized as ⁇ F m * .
- Precipitation Model A1 is precipitation P t is, the boundary of snow temperature [delta], is a model that indicates that the P1 t or P2 t, is expressed by the following equation.
- the snowfall model A2 is a regression model in which the precipitation P2t when the temperature Tt is equal to or less than ⁇ is an explanatory variable and the snowfall St is an objective variable, and is represented by the following equation.
- Snowfall model A3 snowfall D t is a model showing the relationship of addition of the day of snowfall S t in snowfall D t-1 of the previous day, matches therefrom minus snowmelt M t Yes, it is expressed by the following formula.
- Snowmelt model A4 is a regression model and a value obtained by multiplying the snow accumulation D t to the value obtained by subtracting the temperature mu 2 that snow melting starts at temperature T t, as explanatory variables and P1 t, snow melting amount M t aimed variable And is represented by the following equation.
- the first term becomes 0 if the temperature T t is lower than ⁇ 2
- the snow melting amount M t becomes 0 if the snow accumulation amount D t ⁇ 1 up to the previous day is 0.
- Inflow model A5 is a value obtained by subtracting the inflow F t-1 of the previous day from equilibrium inflow mu 1, and precipitation P1 t where temperature T t of the day is higher than [delta], and the day of snowmelt M t Is an regression variable, and an inflow increase ⁇ F t is a target variable, which is expressed by the following equation.
- the inflow probability model A6 describes the monthly inflow ⁇ 3 , the balance inflow ⁇ 3 minus the previous month's normalized inflow F m ⁇ 1 * , and the residual term u m This is a model in which the increase amount ⁇ F m * of the normalized inflow amount is a target variable, and is expressed by the following equation.
- the snowfall temperature estimation unit 211 estimates the snowfall temperature ⁇ based on the precipitation model A1 and the weather record information, and registers the estimated snowfall temperature ⁇ in the parameter storage unit 232. The details of the process of estimating ⁇ by the snow temperature estimating unit 211 will be described later.
- the snow temperature estimation unit 211 reads out the weather record information corresponding to the date t from the weather record database 233 for each date t, and calculates the precipitation amount and temperature of the read weather record information and the estimated snowfall temperature ⁇ as described above.
- P2 t is calculated by applying it to precipitation model 1.
- the snowfall temperature estimation unit 211 performs regression analysis based on the weather record information, P2 t , and the snowfall amount model A2, and estimates the regression variable ⁇ .
- the snowfall temperature estimation unit 211 registers the estimated regression variable ⁇ in the parameter storage unit 32.
- the snow melting amount model estimation unit 212 is an equation in which the snow accumulation amount model A3 is substituted into the snow melting amount model A4. And regression coefficients ⁇ 2 , ⁇ 3 and ⁇ 2 are estimated. The snow melting amount model estimation unit 212 registers the estimated regression coefficients ⁇ 2 , ⁇ 3, and ⁇ 2 in the parameter storage unit 232.
- the inflow amount model estimation unit 213 estimates the regression coefficients ⁇ 1 , ⁇ 1 , and ⁇ 2 based on the inflow amount model A5 and the actual weather information. Specifically, the inflow amount model estimating unit 213 calculates P1 t for each date t based on the precipitation amount of the precipitation model 1, ⁇ , and the weather performance information corresponding to the date t, and the meteorology for each date t.
- the inflow model A5 is subjected to regression analysis using the actual information and the corresponding P1 t , and the regression coefficients ⁇ 1 , ⁇ 1 , ⁇ 2 and ⁇ 1 are estimated.
- the inflow model A5 It is also possible to estimate regression coefficients ⁇ 1 , ⁇ 1 , ⁇ 2 and ⁇ 1 by performing regression analysis.
- the inflow amount model estimation unit 23 registers the estimated regression coefficients ⁇ 1 , ⁇ 1 , ⁇ 2, and ⁇ 1 in the parameter storage unit 232.
- the predicted temperature acquisition unit 214 acquires a predicted temperature value (hereinafter referred to as a predicted temperature).
- the predicted temperature acquisition unit 214 may receive an input of the predicted temperature from the user, or may access the computer of the Japan Meteorological Agency or a private weather company to acquire the predicted temperature.
- a statistical model used for general temperature prediction is stored in the model storage unit 31, and the predicted temperature acquisition unit 214 performs regression analysis based on the statistical model and the weather performance information to set the parameter
- the estimated temperature can be calculated by applying the estimated parameter and the weather performance information to the statistical model.
- the predicted precipitation acquisition unit 215 acquires the predicted precipitation.
- the predicted precipitation acquisition unit 215 transmits a predicted precipitation acquisition request to the precipitation prediction system 10, and the predicted precipitation returned from the precipitation prediction system 10 according to the predicted precipitation acquisition request. By receiving the amount, the predicted precipitation shall be obtained.
- the predicted precipitation acquisition unit 215 transmits a predicted precipitation acquisition request in which a predetermined percentile setting value (for example, 10% or 90%) is set to the precipitation prediction system.
- a predetermined percentile setting value for example, 10% or 90%
- the predicted precipitation acquisition unit 215 may receive an input of predicted precipitation from a user, or may access a computer of the Japan Meteorological Agency or a private weather company to acquire the predicted precipitation.
- the predicted precipitation amount acquiring unit 215 may perform the prediction of the precipitation amount based on the weather performance information, similarly to the predicted temperature acquiring unit 214.
- the predicted flow input acquisition request receiving unit 216 receives a command (hereinafter referred to as a predicted inflow amount acquisition request) for acquiring a predicted value of the inflow amount (hereinafter referred to as a predicted inflow amount) from another computer connected to the communication network 40. Is received.
- a predicted inflow amount acquisition request a command for acquiring a predicted value of the inflow amount (hereinafter referred to as a predicted inflow amount) from another computer connected to the communication network 40. Is received.
- the inflow amount prediction unit 217 includes the predicted temperature acquired by the predicted temperature acquisition unit 214, the predicted precipitation acquired by the predicted precipitation acquisition unit 215, the parameters estimated by the snowfall temperature estimation unit 211, the actual weather information, and the inflow amount model A5. Is used to calculate the predicted inflow. Details of the predicted inflow calculation process will be described later.
- the predicted inflow amount transmission unit 218 transmits the predicted inflow amount calculated by the inflow amount prediction unit 217 to the transmission source of the predicted inflow amount acquisition request.
- the inflow amount distribution acquisition request receiving unit 219 receives a command (hereinafter referred to as an inflow amount distribution acquisition request) for acquiring an inflow amount occurrence probability distribution from another computer connected to the communication network 40.
- the inflow rate probability model estimation unit 219 performs regression analysis on the inflow rate probability model A6 to estimate the parameters ⁇ 4 and ⁇ 3 .
- the inflow rate probability model estimation unit 219 may register the estimated parameters ⁇ 4 and ⁇ 3 in the parameter storage unit 232, but in this embodiment, the inflow rate distribution acquisition request is received. Accordingly, the parameters of the inflow rate probability model A6 are estimated.
- the inflow amount distribution generation unit 221 generates an inflow amount occurrence probability distribution (hereinafter referred to as an inflow amount distribution).
- the inflow amount distribution is a distribution of conditional probability Pr (F m
- the inflow amount distribution transmission unit 222 transmits the inflow amount distribution generated by the inflow amount distribution generation unit 221.
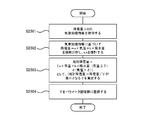
- FIG. 17 is a diagram showing the flow of the process of estimating the snow temperature ⁇ by the snow temperature estimator 211.
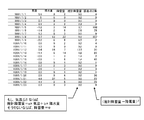
- the snowfall temperature estimation unit 211 acquires weather record information whose snowfall amount is greater than 0 from the weather record database 233 (S2501). Thereby, as shown in FIG. 18, only the snowfall amount larger than 0 is extracted among the weather performance information stored in the weather performance database 233.
- the snowfall temperature estimation unit 211 sets “a ⁇ weather performance information temperature + b ⁇ rainfall of weather performance information” when the temperature is ⁇ or less, and “0” when the temperature is higher than ⁇ as the estimated snowfall amount. ⁇ that minimizes the value obtained by squaring the difference between the estimated amount of snowfall and the amount of snowfall in the weather information is calculated (S2503).
- the snowfall temperature estimation unit 211 increases the regression coefficient a to the temperature if the temperature is higher than ⁇ for each meteorological record information as shown in FIG.
- the sum of the value multiplied by the above and the value obtained by multiplying the above-mentioned area coefficient b by the amount of precipitation is calculated as the estimated snowfall, and the value obtained by squaring the difference between the estimated snowfall and the snowfall in the weather information is an error.
- a general statistical method can be used for the process of determining ⁇ so that the square of the error is minimized.
- the snow temperature estimation unit 211 registers ⁇ determined as described above in the parameter storage unit 32 (S2504).
- the snow melting temperature ⁇ is determined as described above.
- FIG. 20 is a diagram illustrating a flow of the inflow amount prediction process in the inflow amount prediction system 20 of the present embodiment. In the process of FIG. 20, it is assumed that the date t is the date to be predicted.
- Predicting temperature acquiring unit 214 acquires the prediction temperature T t (S2521). As described above, the predicted temperature acquisition unit 214 can acquire T t by receiving data input from a user or accessing a computer of the Japan Meteorological Agency or a private weather company to acquire data, for example.
- Predicted rainfall obtaining unit 215 obtains the predicted rainfall P t (S2522). As described above, the predicted precipitation acquisition unit 215 transmits a predicted precipitation acquisition request in which a predetermined percentile setting value is set to the precipitation prediction system 10 and receives the predicted precipitation returned from the precipitation prediction system 10. To obtain the predicted precipitation.
- the inflow amount predicting unit 217 reads ⁇ 1 to ⁇ 3 , ⁇ 1 , ⁇ 2 , ⁇ 1 , and ⁇ 2 from the parameter storage unit 32 (S2525).
- the inflow amount predicting unit 217 reads the weather performance information corresponding to the previous day t-1 from the weather performance database 233, sets the snow accumulation amount of the read weather performance information as D t-1 (S2526), The inflow amount is set to F t-1 (S2527).
- the inflow amount prediction unit 217 substitutes ⁇ 2 , T t , ⁇ 2 , D t ⁇ 1 , ⁇ 3 , and P1 t into the snow melting amount model A4, and calculates the predicted value M t of the snow melting amount (S2528). Then, ⁇ 1 , ⁇ 1 , F t ⁇ 1 , ⁇ 1 , P 1 t , ⁇ 2 , and M t are substituted into the inflow amount model A5 to calculate a predicted value ⁇ F t of the inflow increase amount (S2529). The inflow amount predicting unit 217 adds ⁇ F t to F t ⁇ 1 to calculate the predicted inflow amount F t (S2530).
- the inflow amount is predicted in consideration of the precipitation amount and the snowmelt amount, based on the predicted temperature, the predicted precipitation amount, and the actual weather information. Can do. Even when there is no precipitation, the amount of inflow increases due to snow melting, so the prediction accuracy can be improved by predicting the amount of inflow taking into account the amount of snow melting.
- the amount of snowmelt can be calculated from precipitation and temperature. Prediction of precipitation and temperature are easily available because there are various methods for weather forecasting. Therefore, even if it is difficult to predict the amount of snowmelt, it is possible to easily predict the inflow amount in consideration of the amount of snowmelt by predicting the amount of snowmelt based on the easily obtained precipitation and temperature predicted values. can do.
- the first term is the difference between the balanced inflow and the inflow, and the balanced inflow is taken into account. Compared to the case where the inflow is simply used as an explanatory variable, More accurate inflow prediction can be performed.
- the inflow amount prediction system of the present embodiment the amount of water flowing into the water storage facility such as a dam is predicted from the river.
- the inflow amount prediction system can be easily applied to a system that predicts the amount of water flowing through the river. it can. In this case, forecast and actual values of temperature and precipitation in the upstream area of the river are acquired and recorded.
- the equilibrium inflow amount ⁇ 1 and the temperature ⁇ 2 at which snow melting starts are stored in the parameter storage unit 32 in advance.
- the present invention is not limited to this, and based on past weather record information. A good value may be estimated.
- the inflow amount model A5 may not consider the snowmelt amount M.
- the inflow amount model A5 is expressed by the following equation.
- the snow temperature estimation unit 211 may estimate the parameters by the Prais-Winstein transformation or the Cochrane ocut method.
- the inflow distribution is a conditional probability distribution with the inflow of the previous month as a condition.
- inflow F m is inflow F m is a predetermined minimum value (hereinafter, referred to as a minimum flow rate, expressed as F min.) Maximum value (hereinafter, referred to as the maximum flow rate, F denoted as max between up.), the unit amount (e.g., 1 or cubic meter 10 cu.m., 1000 cubic meters, and the like.
- each assumed to be discrete value to increase or decrease, inflow The distribution is assumed to be a table in which probabilities are described in association with the inflow amount for each unit inflow amount from the minimum inflow amount Fmin to the maximum inflow amount Fmax .
- the inflow rate probability model A6 When the inflow rate probability model A6 is applied to the conditional probability Pr (F m
- A6 ′ can be further transformed as the following equation. That is, the conditional probability Pr (F m
- conditional probability is conditional on the inflow of the previous month, but is conditional conditional on the inflow of the previous month and the previous month, that is, Pr (F m
- FIG. 21 is a diagram for explaining the flow of the inflow amount distribution creation process.
- the inflow rate probability model estimation unit 219 performs the following processing, where m is each month (January to December). Inflow probability model estimation unit 219, the actual weather database 233, and an average inflow amount corresponding to the date of the month m of all the year to calculate the I m (S2541), all year m-1 month I m ⁇ 1 is calculated by averaging the inflows corresponding to the dates (S2542).
- Inflow probability model estimation unit 219 for each date belongs year actual weather information stored in the actual weather database 233, F by averaging the flow rate of the date corresponding to the date of the month m of the year m calculating the (S2543), the F m normalized by dividing by I m, and calculates the F m * (S2544). Further, inflow probability model estimation unit 219 calculates the actual weather database 233, of m-1_Tsukinohizukenitaiosururyunyuryouoheikinshite F m-1 of the year (S2545), F m-1 Is divided by I m-1 to calculate F m-1 * (S2546).
- the inflow rate probability model estimation unit 219 After performing the above process for each year, the inflow rate probability model estimation unit 219 performs regression analysis on the inflow rate probability model A6 ′′ to estimate ⁇ 4 and ⁇ 3 (S2547), and the inflow rate probability model estimation unit 219. Calculates the drift term ⁇ 4 ( ⁇ 3 ⁇ F m ⁇ 1 * ) I m (S2548). Further, inflow probability model estimation unit 219, a residual u m of inflow probability model A6 "calculated by the following equation (S2549). The inflow rate probability model estimation unit 219 calculates a residual term u m I m (S2550).
- the inflow rate probability model estimation unit 219 calculates the drift term and the residual term for each month by repeating the above processing for each month, and then the drift term drift term ⁇ 4 ( ⁇ 3 ⁇ F m ⁇ 1 * ). generates a frequency distribution of I m (S2551), generates a frequency distribution of Zansako u m I m (S2552), it creates a frequency distribution of inflow F m and the sum of these (S2553).
- Inflow probability model estimation unit 219 based on the frequency distribution of inflow F m, inflow of conditional probability Pr
- the inflow distribution may be described as a probability distribution calculation formula.
- the water level in the water storage facility is assumed to be a discrete value for each predetermined unit amount (for example, 1 meter, 5 meters, etc., hereinafter referred to as a unit water level).
- the water level in the medium-term operation period that maximizes the amount of power generated in the long-term operation period is obtained by Stochastic Dynamic Programming (SDP).
- SDP Stochastic Dynamic Programming
- the water level of each unit period in the short-term operation period is subject to restrictions such as the maximum and minimum values of the water level in the water storage facility and the maximum and minimum values of the amount of water used for hydropower generation (hereinafter referred to as water intake, Q).
- the water level of each day is simulated by changing the unit water level, and the water level that maximizes the amount of power sales is calculated.
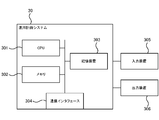
- FIG. 22 is a diagram showing a hardware configuration of the operation planning system 30.
- the operation planning system 30 includes a CPU 301, a memory 302, a storage device 303, a communication interface 304, an input device 305, and an output device 306.
- the storage device 303 stores various data and programs, for example, a hard disk drive, a flash memory, a CD-ROM drive, and the like.
- the CPU 301 implements various functions by reading the program stored in the storage device 303 into the memory 302 and executing it.
- the communication interface 304 is an interface for connecting to the communication network 40.
- an adapter for connecting to Ethernet (registered trademark), a modem for connecting to a public telephone line network, and a communication for performing wireless communication
- a vessel Such as a vessel.
- the input device 305 is a keyboard, a mouse, a touch panel, a microphone, or the like that accepts data input.
- the output device 306 is, for example, a display, a printer, or a speaker that outputs data.
- FIG. 23 is a diagram showing a software configuration of the operation planning system 30.
- the operation planning system 30 includes a specification input unit 311, a stored water amount set value input unit 312, an inflow amount distribution acquisition unit 313, a medium-term plan unit 314, a predicted inflow amount acquisition unit 315, and a short-term plan unit 316.
- the specification input unit 311, the stored water amount set value input unit 312, the inflow amount distribution acquisition unit 313, the medium-term plan unit 314, the predicted inflow amount acquisition unit 315, and the short-term plan unit 316 are included in the CPU 201 included in the operation planning system 30.
- the specification storage unit 331, the power price database 333, and the optimum water level database 334 are realized as storage areas provided by the memory 202 and the storage device 203 provided in the operation planning system 30.
- the specification storage unit 331, the model storage unit 332, the power price database 333, and the optimum water level database 334 are managed by a database server different from the operation planning system 30, and the operation planning system 30 accesses the database server. It may be.
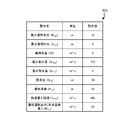
- the specification storage unit 331 stores information (hereinafter referred to as specification information) including setting values of various specifications such as water storage facilities, rivers, and power generation facilities.
- FIG. 24 is a diagram illustrating a configuration example of the specification information stored in the specification storage unit 331. As shown in the figure, the specification information includes a specification name, a unit, and a set value.
- the specification input unit 311 receives input of specification information and registers the received specification information in the specification storage unit 331.
- the specification input unit 311 may receive input of each item of specification information from the input device 205 such as a keyboard and a mouse, for example, or access the specification information by accessing the host computer of the power company, for example. You may make it acquire.
- the specification input unit 331 has, as specifications relating to the water storage facility, the maximum value of the water level (maximum operating water level; hereinafter referred to as H max .
- the unit is m), and the minimum value of the water level (minimum). Operational water level; hereinafter referred to as H min .
- the unit is m.
- the specification information including the highest operational water level received and the specification information including the lowest operational water level are created and specifications are created.
- S0 a maintenance flow rate
- the unit is m 3 / s) as specifications relating to the river, and creates specification information including the received maintenance flow rate Then, the maximum amount of water that can be used for power generation (maximum water intake; hereinafter referred to as Q max .
- the unit is m 3 / s. ), The minimum amount of water available for power generation (minimum water intake; Q min .
- the unit is m 3 / s.)
- the height of water discharge after power generation water discharge level; hereinafter referred to as H out .
- the unit is m.), And the loss drop (hereinafter, (It is expressed as H los .
- the unit is m.)
- the specification information including the maximum water intake received, the specification information including the minimum water intake, the specification information including the discharge level, and the loss head Is created and registered in the specification storage unit 331.
- the power price database 333 stores the power price for each date.
- FIG. 25 is a diagram illustrating a configuration example of the power price database 333. As shown in the figure, the power price database 333 stores a power price (unit: yen / kWh) in association with the date. In this embodiment, it is assumed that the power price can be changed for each date, and the power price for each day is input in advance by the user and registered in the power price database 333.
- the stored water amount set value input unit 312 accepts an input of a scheduled value of the stored water amount (hereinafter referred to as an initial stored water amount) at the start time (0:00) of the first day of the short-term operation period.
- the water storage amount setting value input unit 312 may acquire the water storage amount of the current water storage facility and set it as the initial water storage amount, for example. Further, the water storage amount set value input unit 312 may predict the initial water storage amount from the past water level.
- the optimum water level database 334 stores the water level after the optimum medium-term operation period corresponding to the month, the water level at the start of the month, and the inflow amount in the month.
- FIG. 26 is a diagram illustrating a configuration example of the optimum water level database 334. As shown in the figure, the optimum water level database 334 is associated with the water level H m and the inflow amount F m for each month m during the long-term operation period, and the optimum water level in the following month (the optimum water level after one month). H m + 1 ) is stored as a target water level table 351 for each water level inflow.
- the target water level at the final time of the month is obtained by reading out the optimal water level after one month corresponding to the month, the water level at the start of the month, and the predicted inflow from the optimal water level database 334. be able to.
- the inflow amount distribution acquisition unit 313 acquires the inflow amount distribution.
- the inflow amount distribution acquisition unit 313 transmits an inflow amount distribution acquisition request to the inflow amount prediction system 20 and receives the inflow amount distribution transmitted by the inflow amount prediction system 20 in response to the inflow amount distribution acquisition request.
- the inflow amount distribution acquisition unit 313 may receive an input of the inflow amount distribution from the user.
- the mid-term planning unit 314 creates an optimal water level plan for each mid-term operation period.
- the medium-term plan unit 314 uses the inflow amount distribution and a statistical model stored in the model storage unit 332 described later to create an optimal water level plan by probabilistic dynamic programming, and an optimal water level database Register at 334. Details of the process for creating the optimum water level plan by the medium-term plan unit 314 will be described later.
- the predicted inflow amount acquisition unit 313 accesses the inflow amount prediction system 20 and acquires a predicted value (predicted inflow amount) of the inflow amount R for each day in the short-term operation period predicted by the inflow amount prediction system 20. .
- the predicted inflow amount acquisition unit 313 may accept an input of the predicted inflow amount from the input device 205 such as a keyboard or a mouse.
- the short-term planning unit 316 calculates the optimum water level (hereinafter referred to as short-term operation water level, referred to as H) on each day during the short-term operation period by simulation, and calculates each day The short-term operational water level is output to the output device.
- the short-term planning unit 316 performs a simulation using a statistical model stored in a model storage unit 332 described later.
- the model storage unit 332 stores the following models B1 to B11.
- Model B1 is for calculating the operational water level H based on the water storage amount V (water level calculation model), and is represented by the following equation. Note that a is a constant specific to the water storage facility.
- the model B2 is for calculating the upper limit of the water storage amount (hereinafter referred to as the upper limit water storage amount and expressed as V max ) based on the maximum operational water level Hmax , and is represented by the following equation.
- Model B3 is for calculating the lower limit of the water storage amount (hereinafter referred to as the lower limit water storage amount and expressed as V min ) based on the minimum operating water level Hmin , and is represented by the following equation.
- Model B4 is based on the amount of stored water from 0:00 to 24:00 on the day (that is, 0:00 on the next day), and the difference in the amount of stored water from the start point to the end point of the unit period (hereinafter referred to as the stored water amount difference). , And expressed as ⁇ V), and is expressed by the following equation, where V t is the amount of water stored at 0:00 on a certain date t.
- the model B5 is for calculating a water amount (R0) obtained by subtracting the maintenance flow rate S0 and the stored water amount difference ⁇ V from the inflow amount R, and is represented by the following equation.
- the model B6 is for determining the water intake Q based on the minimum water intake Q min , the maximum water intake Q max , the minimum operation output Q0 min and R0 (water intake calculation model), and is expressed by the following equation.
- R0 is, and the minimum intake quantity Q min or more, and equal to or less than the maximum intake amount Q max is, R0 is intake amount Q, and the minimum intake if R0 is smaller than the minimum intake quantity Q min
- the amount Q min becomes the water intake amount Q
- R0 is larger than the maximum water intake amount
- the maximum water intake amount Q max becomes the water intake amount Q.
- the water intake Q is 0.
- Model B7 is for calculating the amount of water discharged in the water storage facility on the basis of R0 and the amount of water intake Q (hereinafter referred to as normal discharge flow rate, expressed as S). expressed.
- Model B8 is for calculating the effective head hn based on the operating water level at the end of the day, the discharge water level H out and the loss head H los , and the operating water level at 0:00 on date t is H t.
- b is a predetermined constant for converting the water level to the sea level, and is expressed by the following equation.
- the model B9 is for calculating the generated power Pn generated on the basis of the water intake amount Q and the effective head hn, where c is a coefficient relating to the conversion efficiency of power generation and g is a gravitational acceleration. It is represented by Model B10 is for calculating the amount of generated power En generated per day based on the generated power Pn (power amount calculation model), and is represented by the following equation. The model B11 is for calculating the amount of power sold based on the amount of generated power En for a certain date and the power price corresponding to the date, and is represented by the following equation.
- the medium-term plan unit 314 calculates an optimal water level by probabilistic dynamic programming using the inflow distribution and the statistical model. Specifically, the medium-term plan unit 314 obtains a combination of water levels that satisfies the following equation.
- GE H m , H m + 1 , F m
- m + 1 H m + 1 .
- this is the generated electric energy En when the inflow amount of month m is F m .
- the generated power amount in the month m is calculated by multiplying the generated power amount En per day calculated by the model B10 by the number of days in the month m.
- FIGS. 27 to 29 are diagrams for explaining a method for obtaining an optimum water level by probabilistic dynamic programming.
- the long-term operation period is four months, and the water level of the water storage facility takes only one of the values h1 to h3.
- the medium-term plan unit 314 performs the following processing when the water level at the end time point m5 is h1 to h3.
- the medium-term plan unit 314 sets the total amount of generated power E (1, H 1 , F 1 ) in the previous period (stage) to 0, for each water level at the start time m4 of the fourth month. Calculates the amount of generated power for each inflow in the fourth month, and adds the expected value for each water level calculated by multiplying the calculated amount of generated power by the occurrence probability of the inflow in the first month (here, Since the total power generation amount is 0, the expected value is also 0.) is calculated as the expected value for the fourth month. The medium-term plan unit 314 selects the one with the highest expected value for the fourth month (indicated by a bold line in the figure) (step 1).
- the medium-term plan unit 314 calculates the amount of generated power in the third month for each combination of the water level at the time point m4 and the water level at the time point m3, and is calculated by multiplying the calculated value by the occurrence probability of the inflow amount in the fourth month. The sum of the expected values for each water level is calculated as the expected value for the third and subsequent months.
- the medium-term plan unit 314 selects a combination (indicated by a thick line in the figure) having the largest expected value after the third month (step 2).
- the medium-term plan unit 314 calculates the generated power amount in the second month by the occurrence probability of the inflow amount in the third month.
- the expected value of the amount of generated power after the second month is calculated, and a combination (indicated by a bold line in the figure) that maximizes the expected value after the second month is selected (step 3). ).
- the medium-term plan unit 314 calculates the combination of the water level at the time point m2 and the water level at the time point m1 by multiplying the generated power amount in the first month by the occurrence probability of the inflow amount in the second month.
- the expected value of the amount of generated power after the first month is calculated by adding the expected values for each water level, and a combination (indicated by a bold line in the figure) that maximizes the expected value after the first month is selected. (Step 4).
- the optimum water level is determined as described above.
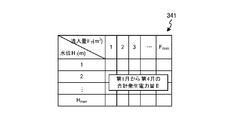
- Term plan unit 3144 every time the processes described above the (stage) is completed, the total value of the amount of power generated from the first month to the fourth month, inflow of water level H 1 and the first month of the first month F
- the power level table 341 for each water level inflow amount managed in association with 1 is created.
- FIG. 28 shows a configuration example of the power amount table 341 for each water level inflow amount.
- the medium-term plan unit 314 reads the total power generation amount of the previous stage from the power amount table 341 by the water level inflow amount and performs the above processing (see FIG. 29).
- the medium-term plan unit 314 repeats the above processing until the difference between the total power amount in the previous stage and the total power amount in the current stage is equal to or less than a predetermined value.
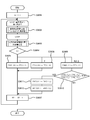
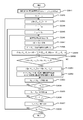
- FIG. 30 is a diagram showing the flow of the optimum water level planning process in the long-term operation period.
- the medium-term plan unit 314 sets 1 to ST indicating the stage of processing (S3601), and for each month from the last month (the 12th month in this embodiment) to the 1st month, the water level by the stochastic dynamic programming method
- the planning process is performed (S3602).
- FIG. 31 is a diagram showing a configuration of a generated power amount table 352 for each water level inflow, which is a table used for water level planning processing by probabilistic dynamic programming.
- the water level inflow by generated power table 352 shown in FIG. 31, the water level H 12 of the December, in association with the inflow F 12 of the December, generated power amount in the December is registered .
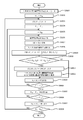
- FIG. 32 and FIG. 33 are diagrams showing the flow of water level planning processing by probabilistic dynamic programming.
- FIG. 32 is a diagram showing the flow of the water level planning process for the last month (December).
- the mid-term planning unit 314 performs processing for each month from the 12th month to the 1st month, which is the month related to the previous processing. month according the first month.) until the total power generation amount E (1, H 1, F 1) was used as a 0 (S3621), the water level H 12 of the last month, sets the minimum water level H min (S3622 ).
- the medium-term planning unit 314 sets 0 to the accumulated power generation amount E (12, H 12 , F 12 ) until December (S3623), and sets the minimum inflow amount F min to the inflow amount F 12 in December. (S3624).
- the medium-term plan unit 314 sets the minimum water level H min to the water level H 1 in January (S3625), applies each item stored in the item storage unit 331 to the above-described model, and generates power generation amount En Is calculated (S3626).
- the medium-term plan unit 314 multiplies En by 31 (the number of days in December) to calculate an expected value GE of the generated power amount for one month (S3627).
- the mid-term plan unit 314 acquires the occurrence probability of the inflow amount F 1 in January (S3628), and for each F 1 , the conditional probability of F 1 on the condition of F 12 is calculated as the accumulated power generation amount E (12, H 12 , F 12 ) are summed and added to GE to calculate E1 (12, H 12 , F 12 ) (S3629).
- Term plan unit 3144 if E1 (12, H 12, F 12) is in E (12, H 12, F 12) or more (S3630: YES), the E (12, H 12, F 12) E1 (12, H 12 , F 12 ) is set (S3631), and the month 12, H 12 , H 1 , F 12 are registered in the target water level table 351 and the water level inflow amount generated power amount table 352 by water level inflow amount ( S3632).
- the medium-term plan unit 314 adds the unit water level to H 1 (S3633), and if the added H 1 is not larger than the maximum water level H max (S3634: NO), the process from step S3626 is repeated. If the water level H 1 after the addition is greater than the highest water level H max is (S3634: YES), the medium-term planning unit 314 adds the unit inflow into the inflow F 12 (S3635). If the inflow F 12 does not exceed the maximum inflow F max is (S3636: NO), the process is repeated from step S3625.
- step S3636 If inflow F 12 exceeds the maximum flow rate F max (S3636: YES), the medium-term planning unit 314, the water level H 12 in adding the unit level (S3637), the water level H 12 up to level H max after addition If it is not larger (S3638: NO), the processing from step S3623 is repeated.
- the medium-term plan unit 314 calculates the accumulated power generation amount E (m + 1, H m + 1 , F m + 1 ) up to the month m + 1 related to the previous process from the power generation amount table 352 for each water level inflow amount (S3641). .
- the calculation was performed with the accumulated power generation amount E (1, H 1 , F 1 ) set to 0 (FIG. 32, S3621). This is because when the process of FIG. 32 is executed, no value is registered in the generated power amount table 352 for each water level inflow amount.
- the medium-term plan unit 314 sets the minimum water level H min to the water level H m of the month m (S3642), as in the process of FIG. 32, and the accumulated power generation amount E (m, H m up to the month m. , F m ) is set to 0 (S3643), and the minimum inflow amount F min is set to the inflow amount F m of month m (S3644).
- the medium-term plan unit 314 sets the minimum water level H min to the water level H m + 1 of the previous month m + 1 (S3645), and applies each item stored in the item storage unit 331 to the above-described model, The amount of generated power En is calculated (S3646).
- the medium-term plan unit 314 multiplies En by the number of days in month m to calculate an expected value GE of the generated power amount for one month (S3647).
- the medium-term plan unit 314 acquires the occurrence probability of the inflow amount F m + 1 of the previous month m + 1 in the previous period (S3648), and for each F m + 1 , the conditional probability of F m on the condition of F m + 1 is the accumulated power generation amount E (m + 1).
- H m + 1 , F m + 1 ) are summed and added to GE to calculate E1 (m, H m , F m ) (S3649).
- E1 (m, H m, F m) is, E (m, H m, F m) is greater than or equal (S3650: YES), E ( m, H m, F m) in E1 (M, H m , F m ) is set (S3651), and the months m, H m , H m + 1 , and F m are registered in the target water level table 351 and the water level inflow amount generated power amount table 352 by water level inflow amount ( S3652).
- the medium-term plan unit 314 adds the unit water level to H m + 1 (S3653). If H m + 1 after the addition is not larger than the maximum water level H max (S3654: NO), the process from step S3646 is repeated. If the water level H m + 1 after the addition is greater than the highest water level H max is (S3654: YES), the medium-term planning unit 314 adds the unit inflow into the inflow F m (S3655). If the inflow F m does not exceed the maximum inflow F max is (S3656: NO), the process is repeated from step S3645.
- step S3643 the medium-term planning unit 314 ends the process.
- the medium-term planning unit 314 After performing the water level planning process by the above stochastic dynamic programming for each month from the 12th month to the 1st month, the medium-term planning unit 314 performs the calculation process of the expected total generated electric energy shown in FIG. 34 (S3603). ). The medium-term planning unit 314 sets H min to H 1 (S3661), and acquires the occurrence probability of each F 1 for each unit inflow (S3662). The medium-term plan unit 314 calculates the accumulated power generation amount E (1, H 1 , F 1 ) up to the first month from the power generation amount table 352 for each water level inflow amount (S3663), and F 12 is calculated for each F 1.
- the value obtained by multiplying E by the conditional probability of F 1 as a condition is summed to calculate the expected total generated power EE (1, H 1 ) of the stage (S3664).
- the medium-term planning unit adds the unit water level to H 1 (S3665), and if H 1 does not exceed H max (S3666: NO), repeats the processing from step S3663.
- the medium-term plan unit 314 sets the expected total generated power EE (1, H 1 ) as E02 (1, H 1 ) (S3605), When ST is 2 (S3604: 2), the expected total power generation amount EE (1, H 1 ) is set as E01 (1, H 1 ) (S3606).
- the medium-term plan unit 314 increments ST (S3607), and repeats the process from the water level planning process by the probabilistic planning method from the last month to the first month in step S3602.
- the medium-term plan unit 314 sets the expected total power generation amount EE (1, H 1 ) as E00 (1, H 1 ) (S3609). , a first value obtained by subtracting the E01 (1, H 1) from E02 (1, H 1), divided by a second value obtained by subtracting the E01 (1, H 1) from E00 (1, H 1) Convergence is determined based on whether the quotient does not exceed a predetermined threshold.
- the threshold value S3610: YES
- the medium-term plan unit 314 sets E01 (1, H 1 ) in E02 (1, H 1 ) (S3611), and E01 (1, H 1 ). Is set to E00 (1, H 1 ) (S3612), and the process proceeds to step S3607 described above. If the quotient does not exceed the threshold (S3610: NO), the medium-term plan unit 314 ends the process.
- the water level inflow target water level table 351 for each month stored in the optimal water level database 334 is updated.
- the predicted value of the future inflow amount is used to increase the expected value of the power generation amount in the long-term operation period, and the combination of the water levels at the start time and end time of the medium-term operation period Can be requested. Therefore, the operator of the water storage facility should operate the water storage facility at the start of the medium-term operation period with reference to the optimum water level database 334 and using the water level one month later corresponding to the water level at that time as the target water level. As a result, it is possible to increase the amount of generated power for one year. Therefore, even if the experience of the water storage facility operator is shallow, it can be easily adjusted to the optimum water level.
- the operation planning system 30 of the present embodiment it is possible to formulate a water level plan based on objective data as compared with the case where the water level is planned based on the intuition and experience of the operator of the water storage facility. Further, in the operation planning system 30 of the present embodiment, by using the stochastic dynamic programming method, even when the predicted value of the future inflow is obtained as a probability distribution, the expected value of the generated power in the water storage facility is obtained. The optimal water level plan to be increased can be easily derived.
- the short-term planning unit 316 sets the initial water storage amount received by the water storage amount setting value input unit 312 as V 1 on the first day of the short-term operation period, applies V 1 to the model B1, and calculates the water level H 1 on the first day.
- the short-term planning unit 316 reads the optimum water level after one month corresponding to the month to which the short-term operation period belongs and H 1, and the water level H 2 at the end of the short-term operation period (also the start point on the seventh day). To do.
- Short-term planning unit 316 by using the water level H 2 and model B2 or B3, a target value of the water volume in the end of the short operation period (hereinafter, referred to as final target storage volume.) To calculate the V 7.
- the short-term planning unit 316 uses dynamic programming in this simulation. By using dynamic programming, it can be quickly calculated optimal combination of V t.
- FIG. 35 is a diagram illustrating an example of a screen 60 used for the simulation of the operational water level.
- the screen 60 is provided with an operation period input field 611, an initial storage water volume input field 612, a final target water storage volume input field 613, and various specifications display fields 621 to 627.
- the short-term planning unit 316 reads setting values (H min and H max ) corresponding to the minimum operating water level and the maximum operating water level from the specification storage unit 331, and displays the read H min and H max in the display column 621 and the display column 622. To display.
- the short-term planning unit 316 reads the set value (S0) corresponding to the maintenance flow rate from the specification storage unit 331, and displays the read S0 in the display column 623.
- the short-term planning unit 316 reads the set values (Q min and Q max ) corresponding to the minimum water intake and the maximum water intake from the specification storage unit 331, and the read Q min and Q max are displayed in the display columns 624 and 625, respectively. indicate.
- the short-term planning unit 316 reads the set value (H out ) corresponding to the water discharge level from the specification storage unit 331, and displays the read H out in the display column 626.
- the short-term planning unit 316 reads the setting value (H los ) corresponding to the loss drop from the specification storage unit 331, and displays the read H los in the display field 627.
- the short-term planning unit 316 calculates V max and V min using the above-described model B2 and model B3, and displays the calculated V max and V min in the display column 631 and the display column 632, respectively.
- the predicted inflow amount acquisition unit 313 accesses the inflow amount prediction system 20, acquires the predicted value of the inflow amount R for each day in the operation period predicted by the inflow amount prediction system 20, and displays the acquired R This is displayed in the column 633.
- the water storage amount setting value input unit 312 is input to the input fields 611, 612 and 613.
- the short-term planning unit 316 simulates the water storage amount V for each day during the operation period, receiving the input of the operation period, the initial water storage amount, and the final target water storage amount.
- Short-term planning unit 316 the initial water amount inputted in the input column 612 and the first day of water storage V 1, and the final purpose water amount that has been input to the input field 613 and the seventh day of storage volume V 7
- the water storage amount V t from the first day to the sixth day is simulated, and the water storage amount V is displayed in the display column 651.
- the short-term planning unit 316 calculates the operating water level H by applying the water storage amount V for each date to the model B1, and displays the calculated operating water level H in the display column 652.
- the short-term planning unit 316 calculates the water storage amount difference ⁇ V t for each date t by applying V t and V t + 1 to the model B4 for the date t on the first to sixth days, and calculates the calculated water storage amount difference ⁇ V t. Is displayed in the display field 653.
- the short-term planning unit 316 calculates the R0 by applying the predicted value R of the inflow rate, the maintenance flow rate S0, and the water storage amount difference ⁇ V to the model B5, and determines the water intake amount Q corresponding to R0 by the model B6.
- the amount of water intake Q is displayed in the display column 654.
- the short-term planning unit 316 calculates the normal discharge flow rate S by applying R0 and the water intake amount Q to the model B7, and displays the calculated S in the display column 655.
- the short-term planning unit 316 calculates the effective head hn for each day t of the first to sixth days by applying the calculated operational water level H t + 1 , the water discharge level H out and the loss head H los to the model B8. Hn is displayed in the display column 656.
- the short-term planning unit 316 applies the water intake amount Q and the effective head hn to the model B9, calculates the generated power Pn and displays it in the display column 657, and applies the calculated Pn to the model B10 to generate the generated power amount En. And the calculated En is displayed in the display field 660.
- the short-term planning unit 316 reads the power price corresponding to the date of each day during the operation period from the power price database 333 and displays it on the display column 659, and applies the En and the read power price to the model B11.
- the power sale amount is calculated, and the calculated power sale amount is displayed in the display field 658.
- the short-term plan part 316 can determine the optimal water storage amount efficiently by determining the combination of the water storage amount V by a dynamic programming method.
- the short-term planning unit 316 displays the display columns 651 to 660 so as to correspond to the determined combination of the stored water amount V.
- FIG. 36 is a graph showing a result of a simulation of a past actual water level in a certain water storage facility.
- FIG. 36 (a) is a graph showing changes in water intake and operation water level in July 2003, which is known as a relatively high water season.
- the operational water level is determined by the experience of the operator, and the actual value of the amount of electricity sold in the July 2003 period was about 258 (million yen).
- the amount of power sold corresponding to the combination of the water storage amount V as a result of the simulation was about 269 (million yen). In other words, there was an increase in power sales by about 4%.
- Fig. 36 (b) is a graph showing changes in water intake and operating water level in April 2007, which is known as a relatively dry season.
- the actual value of power sales in the April 2007 period was 107 (million yen), and the power sales price corresponding to the combination of the amount of stored water V as a result of the simulation was 114 (million yen). There was a 6% increase.
- the amount of electric power sold is increased compared to the operation based on the experience of the operator. It was confirmed that it would be possible.
- the water level operation support system of the present embodiment it is possible to present an operation water level that maximizes the amount of power sold according to the initial water storage amount and the final target water storage amount. Therefore, the operator of the water storage facility can perform hydropower generation more efficiently and effectively by operating the water level of the water storage facility with reference to the presentation from the water level operation support system.
- the precipitation prediction system 10, the inflow prediction system 20, and the operation planning system 30 are different computers. However, they can be realized by a single computer. In addition, any one of the precipitation prediction system 10, the inflow prediction system 20, and the operation planning system 30 can be realized by a plurality of computers.
- the weather is assumed to be one of “sunny”, “cloudy”, “snow”, “rain”, and “heavy rain”.
- “sleet” or “hyo” Etc. may be included.
- the time word is “sometimes”, “temporary”, or “after”, but may include “gradually”, “start”, and the like.
- the weather summary information includes the weather summary in the day time zone and the night time zone.
- the present invention is not limited to this. May be included, or weather conditions for three or more time zones such as morning, afternoon, and night may be included.
- the weather words and the time words are arranged in descending order of the degree of precipitation in the matrix of the pattern table 161. You may make it provide the priority memory
- the weather pattern registration unit 112 generates a list of weather chunks in step S1514 of FIG. 6 without using the pattern table 161, and the degree corresponding to the weather word included for each weather chunk included in the list The degree corresponding to the included time word is acquired from the priority storage unit, and the total value of the acquired degrees is set as the priority of the weather chunk.
- the weather pattern registration unit 112 For each weather word, the weather pattern registration unit 112 identifies a weather chunk that includes the weather word, leaves the highest priority among the identified weather chunks, and deletes the others from the list.
- the weather pattern registration unit 112 can create weather pattern information and register it in the weather pattern database 132 based on the weather chunks remaining in the list.
- the weather pattern database 132 registers the date and the flag value corresponding to the weather chunk.
- the present invention is not limited to this, for example, in association with the date, A list of weather chunks may be registered. Further, the precipitation amount included in the weather summary information may be stored in the weather pattern database 132 in association with the date.
- the predicted precipitation is determined using the percentile value, but the present invention is not limited to this, and may be an average value, a median, or the like.
- the inflow amount and the water level are discrete values for each unit inflow amount and unit water level, but may be continuous values of real numbers.
- the inflow amount distribution created in the inflow amount prediction system 20 is described as a function for obtaining a probability corresponding to the inflow amount
- the optimum water level database 334 of the operation planning system 30 includes the month, the water level, and the inflow amount. Is used as an argument and is described as a function for obtaining the optimum water level after one month.
- the long-term operation period is one year
- the medium-term operation period is one month
- the short-term operation period is six days.
- the length can be set.
- the long-term operation period may be six months or three months
- the medium-term operation period may be three months, seasonal (10 days), or one week.
- the short-term operation period may be 2 weeks, 1 week, 4 days, or the like.
- the optimal combination of water levels at the start time and end time of the medium-term operation period is determined by the stochastic dynamic programming method.
- the water level can be calculated using various optimum route search methods that maximize the expected value of the amount of generated power in
- the combination of the water storage amount V is determined so that the amount of electric power sold is maximized, but the combination that maximizes the generated electric energy En is determined. May be. In this case, more efficient power generation can be performed regardless of price fluctuations.
- the operation planning system 30 may perform simulation by providing an upper limit of the normal discharge flow rate S.
- the short-term planning unit 316 receives the input of the upper limit value from the user, and determines the combination of the water storage amount V in which the normal discharge flow rate S does not exceed the upper limit value to maximize the amount of power sales.
- FIG. 37 shows the actual value of the discharge flow rate S in the above-mentioned July 2003 period, the theoretical value of the discharge flow rate S when the power sales amount is maximum when no upper limit value is provided, and the upper limit value of 15 m 3 / It is the graph which compared with the theoretical value of the discharge flow rate S when the amount of power sales becomes the maximum when it sets with s. As shown in FIG.
- discharge amount S is increased to 25 (m 3/2) close.
- the amount of electricity sold in this case was also about 269 million yen, an increase of about 4%. Therefore, when operating an actual water storage facility, an upper limit is set for the discharge flow rate in consideration of the downstream impact, such as when there are fishermen or camping people. Even if an upper limit value is set, more efficient power generation can be performed by operating the water level of the water storage facility according to the result of the simulation.
- the inflow amount prediction system 20 of the present embodiment the amount of water flowing from the river into a water storage facility such as a dam is predicted.
- the inflow amount prediction system 20 can be easily applied to a system that predicts the amount of water flowing through the river. Can do. In this case, forecast and actual values of temperature and precipitation in the upstream area of the river are acquired and recorded.
- the inflow amount R is acquired from the inflow amount prediction system 20, but not limited thereto, for example, an input of the inflow amount R may be received from the user. .
- the past actual value of the inflow amount may be stored in a database, and the past actual value may be read as R and simulated.
- the power price is assumed to be stored in advance in the power price database 333.
- the power price (JEPX price) at the Japan Wholesale Power Exchange is automatically acquired. You may do it.
- the electric power price database 333 may be omitted, and the JEPX price may be acquired every time the short-term planning unit 316 performs the simulation.
Landscapes
- Business, Economics & Management (AREA)
- Health & Medical Sciences (AREA)
- Engineering & Computer Science (AREA)
- Economics (AREA)
- Public Health (AREA)
- Water Supply & Treatment (AREA)
- General Health & Medical Sciences (AREA)
- Human Resources & Organizations (AREA)
- Marketing (AREA)
- Primary Health Care (AREA)
- Strategic Management (AREA)
- Tourism & Hospitality (AREA)
- Physics & Mathematics (AREA)
- General Business, Economics & Management (AREA)
- General Physics & Mathematics (AREA)
- Theoretical Computer Science (AREA)
- Management, Administration, Business Operations System, And Electronic Commerce (AREA)
Abstract
【課題】水力発電による発電電力量を大きくすることができる。 【解決手段】運用計画システム30は、各月の開始時点における水位Hmと、1ヶ月の流入量とに対応づけて、前記月末における最適な水位である最適水位を記憶する最適水位データベース334を備える。運用計画システム30は、各月の開始時点における水位および流入量の予測値に対応する最適水位を最適水位データベース334から読み出すとともに、読み出した最適水位を次月の開始時点における水位としていく。また、運用計画システム30は、各月の終了時に、現在時点における水位と、次月以後における流入量の予測値を取得し、現在の水位を次月の開始時点における水位として、次月以後の各月について最適水位を最適水位データベース334から読み出していき、読み出した最適水位により水位計画を更新する。
Description
本発明は、貯水施設運用支援システム、貯水施設運用支援方法およびプログラムに関する。
水力発電を効率的に行うために、コンピュータによる運用支援システムが用いられている。例えば、特許文献1(特開2006-39838号公報)では、1日の放水水量に基づいて自動計算した発電機運転計画及び水位計画や、過去の発電機運転計画及び水位計画の実績データなどを表示し、必要に応じて修正を受け付けて発電運用計画を作成している。
しかしながら、特許文献1に記載の装置では、放水量や実績に応じて水位を計画しているものの、水位計画と発電電力との関係に着目しておらず、発電電力を増加させるような水位の計画を行うことはできない。
本発明は、このような背景を鑑みてなされたものであり、水力発電による発電電力量を大きくすることができるように貯水施設の運用を支援するシステム、方法及びプログラムを提供することを目的とする。
上記課題を解決するための本発明のうち主たる発明は、水力発電のための貯水施設の運用を支援するシステムであって、所定の運用期間を構成する単位期間の開始時点における水位と、前記単位期間における前記貯水施設への流入量とに対応づけて、前記単位期間の終了時点における最適な水位である最適水位を記憶する最適水位テーブルと、前記運用期間の開始時点における前記貯水施設の水位を取得する水位取得部と、前記各単位期間における流入量の予測値を取得する予測流入量取得部と、前記各単位期間について、前記開始時点における水位および当該単位期間における前記流入量の予測値に対応する前記最適水位を前記最適水位テーブルから読み出すとともに、読み出した前記最適水位を当該単位期間の次の単位期間の開始時点における水位としていく水位計画部と、前記各単位期間についての前記最適水位を記憶する水位計画記憶部と、を備え、前記各単位期間の終了時に、前記水位取得部は、現在時点における前記貯水施設の水位である現在水位を取得し、前記予測流入量取得部は、当該単位期間の次の単位期間以後における前記流入量の予測値を取得し、前記水位計画部は、前記現在水位を前記次の単位期間の開始時点における水位として、前記次の単位期間以後の前記各単位期間について前記最適水位を前記最適水位テーブルから読み出していき、前記読み出した最適水位により前記水位計画記憶部を更新することとする。
また、本発明の貯水施設運用支援システムでは、前記予測流入量取得部は、前記各単位期間における複数の前記流入量の予測値と、当該予測値の発生確率とを取得し、前記最適水位テーブルは、前記貯水施設がとりうる各水位と、前記各単位期間における前記流入量の予測値と、前記流入量の予測値の発生確率とに基づいて、確率的動的計画法により作成されるようにしてもよい。
また、本発明の貯水施設運用支援システムでは、前記単位期間ごとに、前記流入量の実績値を記憶するデータベースと、ある第1単位期間の直前の第2単位期間における前記流入量と所定の定数である均衡流入量との差を説明変数とし、前記第2単位期間から前記第1単位期間までの前記流入量の増加量を目的変数とする統計モデルを記憶するモデル記憶部と、前記データベースに記憶されている前記流入量の実績値、および前記統計モデルに基づいて回帰分析を行い、前記説明変数についての回帰係数および前記均衡流入量を推計する流入量モデル推計部と、前記各単位期間について、当該単位期間である第1単位期間の直前の第2単位期間に対応する前記流入量の第1の実績値、および前記第1期間に対応する前記流入量の第2の実績値を前記データベースから読み出し、前記推計した均衡流入量から前記第2の実績値を引いたものに前記回帰係数を乗じた値を、前記第1および第2の実績値の差から引いた値である残差項を算出して、前記残差項の頻度分布を生成する残差項頻度分布生成部と、前記各単位期間について、前記第2単位期間に対応する前記流入量の第1の実績値、および前記第1単位期間に対応する前記流入量の第2の実績値を前記データベースから読み出し、前記推計した均衡流入量から前記第2の実績値を引いたものに前記回帰係数を乗じたドリフト項を算出して、前記ドリフト項の頻度分布を生成するドリフト項頻度分布生成部と、前記残差項の頻度分布および前記ドリフト項の頻度分布を加算して前記流入量の頻度分布を生成し、前記流入量の頻度分布から前記流入量の発生確率分布を生成する確率分布生成部と、を備え、前記予測流入量取得部は、前記流入量がとりうる所定の範囲の値のそれぞれを前記流入量の予測値として、前記発生確率分布に基づき前記流入量の予測値の発生確率を算出するようにしてもよい。
また、本発明の他の態様は、水力発電のための貯水施設の運用を支援する方法であって、所定の運用期間を構成する単位期間の開始時点における水位と、前記単位期間における前記貯水施設への流入量とに対応づけて、前記単位期間の終了時点における最適な水位である最適水位を記憶する最適水位テーブルを備えるコンピュータが、前記運用期間の開始時点における前記貯水施設の水位を取得し、前記運用期間の開始前に、前記各単位期間における流入量の予測値を取得し、前記各単位期間について、前記開始時点における水位および当該単位期間における前記流入量の予測値に対応する前記最適水位を前記最適水位テーブルから読み出すとともに、読み出した前記最適水位を当該単位期間の次の単位期間の開始時点における水位としていき、前記各単位期間についての前記最適水位をメモリに記憶し、前記各単位期間の終了時に、現在時点における前記貯水施設の水位である現在水位を取得し、当該単位期間の次の単位期間以後における前記流入量の予測値を取得し、前記現在水位を前記次の単位期間の開始時点における水位として、前記次の単位期間以後の前記各単位期間について前記最適水位を前記最適水位テーブルから読み出していき、前記読み出した最適水位により前記メモリを更新することとする。
また、本発明の他の態様は、水力発電のための貯水施設の運用を支援するためのプログラムであって、所定の運用期間を構成する単位期間の開始時点における水位と、前記単位期間における前記貯水施設への流入量とに対応づけて、前記単位期間の終了時点における最適な水位である最適水位を記憶する最適水位テーブルと、を備えるコンピュータに、前記運用期間の開始時点における前記貯水施設の水位を取得するステップと、前記運用期間の開始前に、前記各単位期間における流入量の予測値を取得するステップと、前記各単位期間について、前記開始時点における水位および当該単位期間における前記流入量の予測値に対応する前記最適水位を前記最適水位テーブルから読み出すとともに、読み出した前記最適水位を当該単位期間の次の単位期間の開始時点における水位としていくステップと、前記各単位期間についての前記最適水位をメモリに記憶するステップと、を実行させ、前記各単位期間の終了時に、現在時点における前記貯水施設の水位である現在水位を取得するステップと、当該単位期間の次の単位期間以後における前記流入量の予測値を取得するステップと、前記現在水位を前記次の単位期間の開始時点における水位として、前記次の単位期間以後の前記各単位期間について前記最適水位を前記最適水位テーブルから読み出していくステップと、前記読み出した最適水位により前記メモリを更新するステップと、を実行させることとする。
その他本願が開示する課題やその解決方法については、発明の実施形態の欄および図面により明らかにされる。
本発明によれば、水力発電による発電電力量を大きくすることができる。
==システム構成==
以下、本発明の一実施形態に係る貯水施設の運用支援システムについて説明する。本実施形態の運用支援システムは、ダムなどの貯水施設における水位を適切に運用するための支援を行う。本実施形態の運用支援システムでは、過去の気象のパターンを用いて降水量を予測し、統計モデルを用いて貯水施設に河川や降水などにより流入する水の量(以下、単に流入量という。)の確率分布を算出し、発電電力量を最大化するように、水位の計画を策定する。
以下、本発明の一実施形態に係る貯水施設の運用支援システムについて説明する。本実施形態の運用支援システムは、ダムなどの貯水施設における水位を適切に運用するための支援を行う。本実施形態の運用支援システムでは、過去の気象のパターンを用いて降水量を予測し、統計モデルを用いて貯水施設に河川や降水などにより流入する水の量(以下、単に流入量という。)の確率分布を算出し、発電電力量を最大化するように、水位の計画を策定する。
図1は、本実施形態の運用支援システムの全体構成を示す図である。本実施形態の運用支援システムは、降水量予測システム10、流入量予測システム20、および運用計画システム30を含んで構成される。降水量予測システム10、流入量予測システム20および運用計画システム30は、それぞれ通信ネットワーク40に接続されており、互いに通信可能となっている。通信ネットワーク40は、例えば、インターネットやLAN(Local Area Network)であり、イーサネット(登録商標)や公衆電話回線網、無線通信網などにより構築される。
降水量予測システム10は、降水量を予測するコンピュータである。流入量予測システム20は、貯水施設への流入量を予測するコンピュータである。本実施形態では、流入量予測システム20は、流入量および流入量の確率分布を算出する。運用計画システム30は、貯水施設における最適な水位の計画を作成する。降水量予測システム10、流入量予測システム20および運用計画システム30には、例えばパーソナルコンピュータやワークステーション、PDA(Personal Digital Assistant)、携帯電話端末など各種のコンピュータを採用することができる。
==降水量予測システム10==
降水量予測システム10は、降水量を予測する。本実施形態では、降水量予測システム10は、過去の天気の概況をパターン化しておき、将来の天気予報をパターン化して、同じパターンの過去の日付の降水量のパーセンタイル値を用いて降水量の予測を行う。
降水量予測システム10は、降水量を予測する。本実施形態では、降水量予測システム10は、過去の天気の概況をパターン化しておき、将来の天気予報をパターン化して、同じパターンの過去の日付の降水量のパーセンタイル値を用いて降水量の予測を行う。
図2は、降水量予測システム10のハードウェア構成を示す図である。降水量予測システム10は、CPU101、メモリ102、記憶装置103、通信インタフェース104、入力装置105および出力装置106を備える。記憶装置103は、各種のプログラムやデータを記憶する、例えば、ハードディスクドライブやフラッシュメモリ、CD-ROMドライブなどである。CPU101は、記憶装置103に記憶されているプログラムをメモリ102に読み出して実行することにより各種の機能を実現する。通信インタフェース104は、通信ネットワーク40に接続するためのインタフェースである。通信インタフェース104は、例えば、イーサネット(登録商標)や公衆電話回線網、無線通信網により構築される。入力装置105は、ユーザからデータの入力を受け付ける、例えばキーボードやマウス、タッチパネル、マイクロフォンなどである。出力装置106は、データを出力する、例えばディスプレイやプリンタ、スピーカなどである。
図3は、降水量予測システム10のソフトウェア構成を示す図である。降水量予測システム10は、天気概況取得部111、天気パターン登録部112、予測降水量取得要求受信部113、天気予報取得部114、降水量予測部115、予測降水量送信部116、天気概況データベース131および天気パターンデータベース132を備えている。なお、天気概況取得部111、天気パターン登録部112、予測降水量取得要求受信部113、天気予報取得部114、降水量予測部115および予測降水量送信部116は、降水量予測システム10が備えるCPU101が記憶装置103に記憶されているプログラムをメモリ102に読み出して実行することにより実現される。また、天気概況データベース131および天気パターンデータベース132は、降水量予測システムが備えるメモリ102や記憶装置103が提供する記憶領域として実現される。
天気概況データベース131は、過去の日付の天気および降水量の実績を示す情報(以下、天気概況情報という。)を記憶する。図4は、天気概況データベース131に記憶される天気概況情報の構成例を示す図である。同図に示すように、天気概況情報には、日付、1日の降水量の合計値、昼の時間帯(06:00~18:00)における降水量の最大値、夜の時間帯(18:00~翌日06:00)における降水量の最大値、昼の時間帯における天気を表す文字情報(以下、天気概況という。)、および夜の時間帯における天気概況が含まれている。なお、天気概況情報は、気象庁や気象会社などが一般に提供しているものである。
天気概況取得部111は、天気概況情報を取得する。天気概況取得部111は、例えば、気象庁や民間気象会社が運営するサーバにアクセスして天気概況情報を取得するようにすることができる。また、天気概況取得部111は、ユーザから天気概況情報の入力を受け付けるようにしてもよい。
天気パターンデータベース132は、日付ごとに、天気概況をパターン化した情報(以下、天気パターン情報という。)を記憶する。図5は、天気パターンデータベース132に記憶される天気パターン情報の構成例を示す図である。天気パターン情報には、日付に対応付けて、天気を示す用語(以下、天気語という。)と、その天気が発生する時間を示す用語(以下、時間語という。)との組合せ(以下、天気パターンという。)ごとのフラグ値が含まれている。本実施形態では、天気を示す用語(以下、天気語という。)は、「晴」「曇」「雪」「雨」「大雨」のいずれかであるものとし、時間語は、「時々」「一時」「後」のいずれかであるものとする。なお、時間語には、空文字(時間が指定されていないことを示す。)も含まれるものとする。すなわち、図5に示すように、本実施形態では、天気パターンは、「晴」「曇」「雪」「雨」「大雨」「時々大雨」「一時大雨」「後大雨」「時々雨」「一時雨」「後雨」「時々雪」「一時雪」「後雪」「時々曇」「一時曇」「後曇」「時々晴」「一時晴」および「後晴」である。
天気パターン登録部112は、天気概況情報に基づいて天気パターン情報を生成して天気パターンデータベース132に登録する。図6は、天気パターン情報の登録処理の流れを示す図である。図7は、天気パターン情報の登録処理に用いられる表(以下、パターン表161という。)の構成を示す図である。
図7に示すように、パターン表161は、天気を行とし、時間語を列とする表である。また、パターン表161の行列には、降水量に関する度合いの強い項目がより上および左になるように配置される。図7のパターン表161の例では、行は、「大雨」「雨」「雪」「曇」「晴」の順に配置され、列は、「一時」「時々」「後」の順に配置されている。
天気概況取得部111は、まず天気概況情報を取得する(S1511)。
天気パターン登録部112は、各セルに「0」を設定したパターン表161を生成する(S1512)。天気パターン登録部112は、天気概況情報に含まれている、昼の天気概況と、夜の天気概況とのそれぞれについて以下の処理を行う。
天気パターン登録部112は、天気概況から天気語および時間語以外の語句を削除し(S1513)、天気概況を、天気を示す用語の直後で分割し、分割した語句を天気チャンクとする(S1514)。天気パターン登録部112は、分割した各天気チャンクについて、天気チャンクに含まれている時間語および天気に対応するパターン表161の値を「1」に設定する(S1515)。
天気パターン登録部112は、以上の処理を昼の時間帯の天気概況と夜の時間帯の天気概況とのそれぞれについて行った後、パターン表161の各行について、「1」が設定されているセルのうち最も左にあるものを検索し、検索したセルよりも右にある全てのセルに「0」を設定する(S1516)。天気パターン登録部112は、パターン表161の各列について、「1」が設定されているセルのうち最も上にあるものを検索し、検索したセルよりも下にある全てのセルに「0」を設定する(S1517)。
天気パターン登録部112は、以上のようにして作成したパターン表161から、時間語と天気語との組合せと、日付とを含む天気パターン情報を作成して天気パターンデータベース132に登録する(S1518)。
図8は、天気概況情報に基づく天気パターン情報の登録処理の具体例を説明するための図である。図8の例では、天気概況情報に含まれる昼の時間帯についての天気概況1711が「曇一時雨後晴」であり、夜の時間帯についての天気概況1712が「晴後一時曇」である。
天気パターン登録部112は、昼の天気概況1711について、天気語の直後、すなわち「曇」「雨」および「晴」の後ろで分割して、「曇」「一時雨」および「後晴」の天気チャンクを作成する(S1514)。
次に、天気パターン登録部112は、各天気チャンクに含まれる天気語および時間語に対応するセル、すなわち、「曇」および空文字に対応するセル1721、「雨」および「一時」に対応するセル1722、並びに、「晴」および「後」に対応するセル1723に「1」を設定する(S1515)。
天気パターン登録部112は、夜の時間帯についての天気概況1712についても同様に、「晴」および「後一時曇」の天気チャンクに分割して(S1514)、「晴」および空文字に対応するセル1731、並びに、「曇」と「一時」および「後」のそれぞれとに対応するセル1732およびセル1733に「1」を設定する(S1515)。
天気パターン登録部112は、パターン表161の各行の最も左の「1」のみを残してその他のセルに「0」を設定する(S1516)。行174では、「1」が設定されているセルのうち最も左にあるセル1741を残して、その他のセル1742および1743には「0」が設定されることになる。
天気パターン登録部112は、パターン表161の各列の最も上の「1」のみを残してその他のセルに「0」を設定する(S1517)。列175では、「1」が設定されているセルのうち最も上にあるセル1751を残し、その他のセル1752には「0」が設定される。
上記の処理が行われると、図8においてパターン表161は、「曇」および空白に対応するセル1751および「雨」および「一時」に対応するセル1753のみに「1」が設定された状態となる。そして、パターン表161に基づき、「曇」および「一時雨」のみに「1」が設定された天気パターン情報177が生成されて天気パターンデータベース132に登録される。
予測降水量取得要求受信部113は、通信ネットワーク40に接続される他のコンピュータから、降水量の予測値(以下、予測降水量ともいう。)を取得するためのコマンド(以下、予測降水量取得要求という。)を受信する。予測降水量取得要求には、パーセンタイルの設定値(以下、パーセンタイル設定値という。)が設定される。パーセンタイル設定値としては、例えば、5%や10%など、任意の数値(0<パーセンタイル設定値<1)を設定することができる。
天気予報取得部114は、天気予報が記載された情報(以下、天気予報情報という。)を取得する。天気予報取得部114は、例えば、気象庁や気象会社などから天気予報情報を取得するようにしてもよいし、ユーザから天気予報情報の入力を受け付けるようにしてもよい。天気予報情報は、日付と、その日付における天気予報とが含まれている。天気予報情報は、天気概況情報とは異なり1日単位で天気が記述されている。一方、天気予報情報は、天気概況と同様に、天気と、必要に応じて時間語とが記述されている。
降水量予測部115は、予測降水量を算出し、予測降水量送信部116は、降水量予測部115が算出した予測降水量を、予測降水量取得要求の送信元に対して送信する。降水量予測部115は、天気予報取得部114が取得した天気予報をパターン化し、同じパターンの過去の日の降水量を取得してソートし、パーセンタイル設定値に基づくパーセンタイル値を取得して予測降水量とする。図9は降水量の予測処理の流れを示す図である。
天気予報取得部114が天気予報情報を取得すると(S1531)、降水量予測部115は、天気予報情報に含まれる天気予報をパターン化した情報(以下、予報天気パターン情報という。)を作成する(S1532)。図10は、天気予報に基づく天気パターン情報の作成処理の流れを示す図である。
降水量予測部115は、図7のパターン表161を作成して全てのセルに「0」を設定する(S1551)。降水量予測部115は、天気予報から、天気語および時間語を除く語句を削除し(S1552)、天気予報を各天気語の直後で分割して、分割した文字列を天気チャンクとする(S1553)。
降水量予測部115は、各天気チャンクについて、天気チャンクに含まれている時間語と天気語とに対応するパターン表161のセルに「1」を設定する(S1554)。降水量予測部115は、パターン表161の各行について、「1」が設定されているセルのうち最も左にあるものを選択し、選択したセルよりも右にある全てのセルに「0」を設定する(S1555)。また、降水量予測部115は、パターン表161の各列について、「1」が設定されているセルのうち最も上にあるものを選択し、選択したセルよりも下にある全てのセルに「0」を設定する(S1556)。
降水量予測部115は、パターン表161から、時間指定語と天気語との各組合せについて、組合せに対応するセルの値を抽出し、抽出した値とを設定した予報天気パターン情報を作成する(S1557)。
図9に戻り、降水量予測部115は、作成した予報天気パターン情報にマッチする日付のうち、天気予報情報に含まれている日付と同じ月であるものを天気パターンデータベース132から検索し(S1533)、検索した日付に対応する降水量を天気概況データベース131から取得する(S1534)。降水量予測部115は、取得した降水量の少ない順にソートし(S1535)、取得した降水量の数に、予測降水量取得要求に含まれるパーセンタイル設定値を乗じた値(を整数値に変換したもの)をnとする(S1536)。降水量予測部115は、ソートした降水量の先頭からn番目の降水量を予測降水量とする(S1537)。
以上のようにして、本実施形態の降水量予測システム10によれば、過去の天気概況をパターン化して降水量と対応付けて記憶しておき、将来の天気予報をパターン化し、同じパターンの過去の降水量を、将来の予測値として用いることができる。天気と降水量とは相関することが知られており、精度の高い降水量の予測を行うことができる。また、本実施形態の降水量予測システム10によれば、天気概況に含まれる文字列をパターン化して記憶することができるので、天気予報と同じ天気であった過去の日の降水量を容易に抽出することができる。
なお、本実施形態の降水量予測システム10では、予報天気パターン情報にマッチする日付のうち、天気予報情報に含まれている日付と同じ月であるものを検索するものとしたが、天気パターン情報に、その予報対象の地域において台風が発生しているか否かを示す台風情報や、梅雨入りしているか否かを示す梅雨入り情報を含ませるようにして、予報天気パターン情報にマッチし、かつ、台風情報または梅雨入り情報が一致する日付のうち、予報日と同じ月のものを検索するようにしてもよい。台風が発生している場合と、していない場合、梅雨入りしている場合と、していない場合では、降水量のパターンは異なる。したがって、台風情報や梅雨入り情報が一致している天気パターン情報にのみマッチする日の降水量の実績値を降水量の予測値に用いることで、同じような降水量のパターンになると期待される実績値に基づいて降水量の予測を行うことが可能になる。よって、より精度の高い降水量の予測を行うことができる。
==流入量予測システム20==
次に、流入量予測システム20について説明する。流入量予測システム20は、貯水施設への流入量を予測する。本実施形態では、流入量予測システム20は、過去の気温、降水量、降雪量、積雪量、融雪量、流入量を、後述する統計モデルを用いて回帰分析することにより回帰係数を推計し、気温および降水量の予測値(例えば、気象予報による予報値を採用することができる。)と、推計した回帰係数とを統計モデルに適用して流入量を予測する。なお、流入量の予測は所定の第1単位期間(本実施形態では、一日とする。)単位で行い、流入量の確率分布は、第1単位期間よりも長い第2単位期間(本実施形態では、一ヶ月とする。)単位で行うものとする。
次に、流入量予測システム20について説明する。流入量予測システム20は、貯水施設への流入量を予測する。本実施形態では、流入量予測システム20は、過去の気温、降水量、降雪量、積雪量、融雪量、流入量を、後述する統計モデルを用いて回帰分析することにより回帰係数を推計し、気温および降水量の予測値(例えば、気象予報による予報値を採用することができる。)と、推計した回帰係数とを統計モデルに適用して流入量を予測する。なお、流入量の予測は所定の第1単位期間(本実施形態では、一日とする。)単位で行い、流入量の確率分布は、第1単位期間よりも長い第2単位期間(本実施形態では、一ヶ月とする。)単位で行うものとする。
図11~13は、流入量の変化を示すグラフである。降水や融雪などがない場合にも、例えば山林などからの滲出によって、所定の流入量は存在する。したがって、降水や融雪がないと、流入量は所定の均衡値(以下、均衡流入量という。)に逓減していく(図11)。これに対し、降水があると、それに応じて流水量は一時的に増加するが、降水が止むとともに、再度均衡流入量に向けて逓減を始める(図12)。一方、気温が上昇すると融雪が発生し、それに応じて流水量も増加するが、融雪は降水に比べて流入量に与える影響の変化が緩やかである(図13)。これは、例えば冬季から春季に向けての時期などにおいて、平均気温が上昇している場合に、継続的に融雪が発生するような場合である。
そこで、本実施形態では、降水量、融雪量および均衡流入量に着目し、流入量を算出する回帰モデルを用いて流入量を予測する。本実施形態の流入量予測システム20は、過去の気温や降水量などの気象データの実績値と後述する回帰モデルとに基づいてパラメタを推計し、推計したパラメタと、例えば気象予報などにより求められる気温の予測値(以下、予測気温という。)と、降水量予測システムが求めた予測降水量とを回帰モデルに適用して流入量の予測値を算出する。以下、詳細について説明する。
図14は、本実施形態の流入量予測システム20のハードウェア構成を示す図である。流入量予測システム20は、CPU201、メモリ202、記憶装置203、通信インタフェース204、入力装置205および出力装置206を備える。記憶装置204は、各種のプログラムやデータを記憶する、例えば、ハードディスクドライブやフラッシュメモリ、CD-ROMドライブなどである。CPU201は、記憶装置203に記憶されているプログラムをメモリ202に読み出して実行することにより各種の機能を実現する。通信インタフェース204は、通信インタフェース204は、通信ネットワーク40に接続するためのアダプタである。通信インタフェース204は、例えば、イーサネット(登録商標)や公衆電話回線網、無線通信網により構築される。入力装置205は、ユーザからデータの入力を受け付ける、例えばキーボードやマウス、タッチパネル、マイクロフォンなどである。出力装置206は、データを出力する、例えばディスプレイやプリンタ、スピーカなどである。
図15は、本実施形態の流入量予測システム20のソフトウェア構成を示す図である。本実施形態の流入量予測システム20は、降雪気温推計部211、融雪量モデル推計部212、流入量モデル推計部213、予測気温取得部214、予測降水量取得部215、予測流入量取得要求受信部216、流入量予測部217、予測流入量送信部218、流入量分布取得要求受信部219、流入量発生確率モデル推計部220、流入量分布生成部221、流入量分布送信部222、モデル記憶部231、パラメタ記憶部232、および気象実績データベース233を備えている。
なお、降雪気温推計部211、融雪量モデル推計部212、流入量モデル推計部213、予測気温取得部214、予測降水量取得部215、予測流入量取得要求受信部216、流入量予測部217、予測流入量送信部218、流入量分布取得要求受信部219、流入量発生確率モデル推計部220、流入量分布生成部221、流入量分布送信部222は、流入量予測システム20のCPU11が、記憶装置13に記憶されているプログラムをメモリ12に読み出して実行することにより実現される。また、モデル記憶部231、パラメタ記憶部232、気象実績データベース233は、流入量予測システム20のメモリ202や記憶装置203が提供する記憶領域として実現される。
気象実績データベース233には、気象の各種実績値を含む情報(以下、気象実績情報という。)の履歴が記憶される。図16は、気象実績データベース233に記憶される気象実績情報の構成例を示す図である。同図に示すように、気象実績情報には、日付に対応付けて、気温、降水量、降雪量、積雪量、融雪量、流入量が含まれている。気温は、一日の平均気温である。降水量、降雪量、融雪量は一日の降水量、降雪量、融雪量の累積値である。積雪量は、その日に観測された積雪量である。流入量は、一日にダムなどの貯水施設に流入した水量の累計値である。気温、降水量、降雪量および積雪量は、例えば、気象庁や民間気象会社などが提供するデータである。流入量は、貯水施設において測定した測定値である。流入量は、例えば、河川を管理する自治体などが提供する河川の流量の測定値としてもよい。融雪量は、気象庁や民間気象会社、測量会社などが測定したものであってもよいし、後述するモデルにより計算した値を実績値として記録するようにしてもよい。
モデル記憶部231には、気象実績情報に基づく各種の統計モデルが記憶され、パラメタ記憶部232には、モデル記憶部231に記憶されているモデルに適用される回帰係数や定数などのパラメタが記憶される。モデル記憶部231には、降水量の統計モデル(以下、降水量モデルA1という。)、降雪量の統計モデル(以下、降雪量モデルA2という。)、積雪量の統計モデル(以下、積雪量モデルA3という。)、融雪量の統計モデル(以下、融雪量モデルA4という。)、前日からの流入量の増加量に係る統計モデル(以下、流入量モデルA5という。)、および流入量の発生確率に係る統計モデル(以下、流入量確率モデルA6という。)が記憶される。パラメタ記憶部132には、降雨が降雪に変わる気温(以下、降雪気温という。)δ、日単位の均衡流入量μ1、月単位の均衡流入量μ3、融雪が始まる気温μ2、回帰係数α1~α4、β1、β2がパラメタ記憶部32に記憶される。なお、日単位の均衡流入量μ1、および融雪が始まる気温μ2については、所定の定数として、予めパラメタ記憶部132に記憶されているものとする。
なお以下の説明において、日付tにおける気温、降水量、降雪量、積雪量、融雪量および流入量をそれぞれ、Tt、Pt、St、Dt、MtおよびFtとする。前日からの流入量の増加量をΔFtとする。気温Ttがδより高い場合の降水量をP1t、気温Ttがδ以下である場合の降水量をP2tとする。また、m月における流入量をFmとし、m月についての過去の流入量の平均をImとする。FmをImで割ることによって規格化した流入量をFm
*とし、流入量の増加量を規格化したものをΔFm
*とする。
降水量モデルA1は、降水量Ptが、降雪気温δを境に、P1tまたはP2tとなることを示すモデルであり、次式で表される。
 降雪量モデルA2は、気温Ttがδ以下である場合の降水量P2tを説明変数とし、降雪量Stを目的変数とした回帰モデルであり、次式で表される。
 積雪量モデルA3は、積雪量Dtが、前日までの積雪量Dt-1に当日の降雪量Stを加え、そこから融雪量Mtを引いたものに一致するという関係を示すモデルであり、次式で表される。
 融雪量モデルA4は、気温Ttから融雪が始まる気温μ2を減じた値に積雪量Dtを乗じた値と、P1tとを説明変数とし、融雪量Mtを目的変数とした回帰モデルであり、次式で表される。
 融雪量モデルA4において、気温Ttがμ2よりも低ければ第1項は0になり、前日までの積雪量Dt-1が0であれば融雪量Mtは0になる。
流入量モデルA5は、均衡流入量μ1から前日の流入量Ft-1を減じた値と、当日の気温Ttがδより高い場合の降水量P1tと、当日の融雪量Mtとを説明変数とし、流入量の増加量ΔFtを目的変数とした回帰モデルであり、次式で表される。
 流入量確率モデルA6は、月単位の均衡流入量μ3と、均衡流入量μ3から前月の正規化流入量Fm-1
*を減じたものと、残差項となるumとを説明変数とし、規格化流入量の増加量ΔFm
*を目的変数としたモデルであり、次式で表される。
流入量確率モデルA6は、月単位の均衡流入量μ3と、均衡流入量μ3から前月の正規化流入量Fm-1
*を減じたものと、残差項となるumとを説明変数とし、規格化流入量の増加量ΔFm
*を目的変数としたモデルであり、次式で表される。
 降雪気温推計部211は、降水量モデルA1および気象実績情報に基づいて降雪気温δを推計し、推計した降雪気温δをパラメタ記憶部232に登録する。なお、降雪気温推計部211によるδの推計処理の詳細については後述する。
また、降雪気温推計部211は、各日付tについて、日付tに対応する気象実績情報を気象実績データベース233から読み出し、読み出した気象実績情報の降水量および気温と、上記推計した降雪気温δを前記降水量モデル1に適用してP2tを算出する。降雪気温推計部211は、気象実績情報、P2t、および降雪量モデルA2に基づいて回帰分析を行い、回帰変数γを推計する。降雪気温推計部211は、推計した回帰変数γをパラメタ記憶部32に登録する。
融雪量モデル推計部212は、積雪量モデルA3を融雪量モデルA4に代入した式
 を回帰分析して、回帰係数α2、α3およびμ2を推計する。融雪量モデル推計部212は、推計した回帰係数α2、α3およびμ2をパラメタ記憶部232に登録する。
流入量モデル推計部213は、流入量モデルA5および気象実績情報に基づいて回帰係数α1、β1、およびβ2を推計する。具体的には、流入量モデル推計部213は、各日付tについて、降水量モデル1、δおよび日付tに対応する気象実績情報の降水量に基づいてP1tを算出し、各日付tの気象実績情報と、対応するP1tを用いて、流入量モデルA5を回帰分析し、回帰係数α1、β1、β2およびμ1を推計する。気象実績情報に融雪量がない場合は,日付t-1の積雪量と日付tのその他の気象情報を用いて,融雪量モデルA4を用いて算出したMtを用いて,流入量モデルA5を回帰分析し、回帰係数α1、β1、β2およびμ1を推計することもできる。流入量モデル推計部23は、推計した回帰係数α1、β1、β2およびμ1をパラメタ記憶部232に登録する。
予測気温取得部214は、気温の予測値(以下、予測気温という。)を取得する。予測気温取得部214は、例えば、ユーザから予測気温の入力を受け付けてもよいし、気象庁や民間気象会社のコンピュータにアクセスして予測気温を取得するようにしてもよい。また、予測気温取得部214は、気象実績情報に基づいて気温の予測を行うようにしてもよい。この場合、例えば、一般的な気温の予測に用いられる統計モデルをモデル記憶部31に記憶しておき、予測気温取得部214がその統計モデルと気象実績情報とに基づいて回帰分析を行ってパラメタを推計し、推計したパラメタと気象実績情報とを統計モデルに適用して予測気温を算出することができる。
予測降水量取得部215は、予測降水量を取得する。本実施形態では、予測降水量取得部215は、降水量予測システム10に対して、予測降水量取得要求を送信し、予測降水量取得要求に応じて降水量予測システム10から応答される予測降水量を受信することにより、予測降水量を取得するものとする。予測降水量取得部215は、所定のパーセンタイル設定値(例えば、10%や90%など)を設定した予測降水量取得要求を降水量予測システムに送信する。なお、予測降水量取得部215は、例えば、ユーザから予測降水量の入力を受け付けてもよいし、気象庁や民間気象会社のコンピュータにアクセスして予測降水量を取得するようにしてもよい。また、予測降水量取得部215は、予測気温取得部214と同様に、気象実績情報に基づいて降水量の予測を行うようにしてもよい。
予測流入力取得要求受信部216は、通信ネットワーク40に接続された他のコンピュータから、流入量の予測値(以下、予測流入量という。)を取得するためのコマンド(以下、予測流入量取得要求という。)を受信する。
流入量予測部217は、予測気温取得部214が取得した予測気温、予測降水量取得部215が取得した予測降水量、降雪気温推計部211が推計したパラメタ、気象実績情報、および流入量モデルA5を用いて、予測流入量を算出する。なお、予測流入量の算出処理の詳細については後述する。
予測流入量送信部218は、流入量予測部217が算出した予測流入量を、予測流入量取得要求の送信元に対して送信する。
流入量分布取得要求受信部219は、通信ネットワーク40に接続された他のコンピュータから、流入量の発生確率分布を取得するためのコマンド(以下、流入量分布取得要求という。)を受信する。
流入量確率モデル推計部219は、流入量確率モデルA6を回帰分析して、パラメタα4およびμ3を推計する。なお、流入量確率モデル推計部219は、推計したパラメタα4およびμ3は、パラメタ記憶部232に登録しておくようにしてもよいが、本実施形態では、流入量分布取得要求の受信に応じて流入量確率モデルA6のパラメタの推計を行うものとする。
流入量分布生成部221は、流入量の発生確率分布(以下、流入量分布という。)を生成する。本実施形態では、流入量分布は、前期の流入量の発生を条件とした、条件付確率Pr(Fm|Fm-1)の分布であるものとし、条件付確率で発生する流入量は月単位での流入量の平均値であるものとする。なお、流入量分布の生成処理の詳細については後述する。
流入量分布送信部222は、流入量分布生成部221が生成した流入量の分布を送信する。
以下、本実施形態の流入量予測システムにおける処理の詳細について説明する。
==降雪気温δの推計処理==
まず、降雪気温推計部211による降雪気温δの推計処理について説明する。図17は、降雪気温推計部211による降雪気温δの推計処理の流れを示す図である。
まず、降雪気温推計部211は、気象実績データベース233から降雪量が0より大きい気象実績情報を取得する(S2501)。これにより、図18に示すように、気象実績データベース233に記憶されている気象実績情報のうち、降雪量が0より大きいもののみが抽出される。
まず、降雪気温推計部211による降雪気温δの推計処理について説明する。図17は、降雪気温推計部211による降雪気温δの推計処理の流れを示す図である。
まず、降雪気温推計部211は、気象実績データベース233から降雪量が0より大きい気象実績情報を取得する(S2501)。これにより、図18に示すように、気象実績データベース233に記憶されている気象実績情報のうち、降雪量が0より大きいもののみが抽出される。
次に、降雪気温推計部211は、抽出した気象実績情報に基づき、モデル
降雪量=a×気温+b×降水量
を回帰分析して、回帰係数aおよびbを推計する(S2502)。
降雪量=a×気温+b×降水量
を回帰分析して、回帰係数aおよびbを推計する(S2502)。
降雪気温推計部211は、気温がδ以下の場合には「a×気象実績情報の気温+b×気象実績情報の降水量」、気温がδより高い場合には「0」を推計降雪量として、推計降雪量と気象実績情報の降雪量との差を2乗した値が最小になるδを算出する(S2503)。
降雪気温推計部211は、例えば、所定範囲の気温を所定ステップごとに増加させたδについて、図19に示すように、各気象実績情報について、気温がδより高ければ、上記回帰係数aを気温に乗じた値と、上記か域係数bを降水量に乗じた値とを合計して推計降雪量として算出し、推計降雪量と気象実績情報の降雪量との差を2乗した値を誤差の2乗として算出していき、誤差の2乗が最も小さくなったものをδとして決定することができる。なお、上記誤差の2乗が最も小さくなるように上記δを決定する処理については、一般的な統計手法を利用することが可能である。
降雪気温推計部211は、上記のようにして決定したδを、パラメタ記憶部32に登録する(S2504)。
以上のようにして融雪気温δが決定される。
==流入量の予測処理==
次に、流入量の予測について説明する。図20は、本実施形態の流入量予測システム20における流入量予測処理の流れを示す図である。なお、図20の処理では、日付tが予測対象となる日付であるものとしている。
次に、流入量の予測について説明する。図20は、本実施形態の流入量予測システム20における流入量予測処理の流れを示す図である。なお、図20の処理では、日付tが予測対象となる日付であるものとしている。
予測気温取得部214は、予測気温Ttを取得する(S2521)。上述したように、予測気温取得部214は、例えば、ユーザからデータの入力を受け付けたり、気象庁や民間気象会社のコンピュータにアクセスしてデータを取得することにより、Ttを取得することができる。予測降水量取得部215は、予測降水量Ptを取得する(S2522)。上述したように、予測降水量取得部215は、所定のパーセンタイル設定値を設定した予測降水量取得要求を降水量予測システム10に送信し、降水量予測システム10から応答される予測降水量を受信することにより予測降水量を取得する。
流入量予測部217は、パラメタ記憶部132からδを読み出し(S2523)、降水量モデル1にδ、TtおよびPtを適用してP1tを算出する(S2524)。すなわち、予測気温Ttがδより大きければP1t=Ptとなり、Ttがδ以下であればP1t=0となる。
流入量予測部217は、パラメタ記憶部32から、α1~α3、β1、β2、μ1、μ2を読み出す(S2525)。流入量予測部217は、気象実績データベース233から、前日t-1に対応する気象実績情報を読み出し、読み出した気象実績情報の積雪量をDt-1とし(S2526)、読み出した気象実績情報の流入量をFt-1とする(S2527)。
流入量予測部217は、融雪量モデルA4に、α2、Tt、μ2、Dt-1、α3、P1tを代入して、融雪量の予測値Mtを算出し(S2528)、流入量モデルA5に、α1、μ1、Ft-1、β1、P1t、β2、Mtを代入して流入増加量の予測値ΔFtを算出する(S2529)。流入量予測部217は、Ft-1にΔFtを加算して、予測流入量Ftを算出する(S2530)。
以上のようにして、本実施形態の流入量予測システム20によれば、予測気温および予測降水量と、気象実績情報とに基づいて、降水量および融雪量を考慮した流入量の予測を行うことができる。降水がなかい場合にも融雪により流入量は増加するため、融雪量を考慮して流入量の予測を行うことで、予測の精度を向上することができる。
また、本実施形態の流入量予測システム20によれば、融雪量は、降水量および気温から算出することができる。降水量および気温の予測は、気象予報の手法として様々な手法が存在し、容易に入手可能である。したがって、融雪量の予測が困難である場合でも、容易に取得可能な降水量や気温の予測値に基づいて融雪量の予測を行うことで、融雪量を考慮した流入量の予測を容易に実現することができる。
また、上記流入量モデルA5では、第1項を均衡流入量と流入量との差であるものとして、均衡流入量を考慮に入れているので、単に流入量を説明変数とする場合に比べ、より精度の高い流入量予測を行うことができる。
なお、本実施形態の流入量予測システムでは、ダムなどの貯水施設に河川から流入する水量についての予測を行うものとしたが、河川を流れる水量の予測を行うシステムにも容易に適用することができる。この場合、河川の上流域における気温や降水量の予報値および実績値などを取得および記録するものとする。
また、本実施形態では、均衡流入量μ1および融雪が始まる気温μ2については、予めパラメタ記憶部32に記憶されているものとしたが、これに限らず、過去の気象実績情報に基づいて当てはまりのよい値を推計するようにしてもよい。
また、貯水施設が降雪や積雪の少ない地域に存在する場合などには、流入量モデルA5は融雪量Mを考慮しないようにしてもよい。この場合流入量モデルA5は、次式で表される。
 また、本実施形態の各回帰モデルについて、誤差項に系列相関があるような場合には、降雪気温推計部211がPrais-Winstein変換やコクラン・オーカット法によりパラメータを推計するようにしてもよい。この場合、例えば、コクランオーカット法により流入量モデルA5のパラメータを推計する場合、残差をεtとし、説明変数Xt*=Xt-ρXt-1として(すなわち、Ft*=Ft-ρFt-1、P1t*=P1t-ρP1t-1、Mt*=Mt-ρMt-1などとして)、流入量モデルA5を式のようにすることができる。
 上記式(A5”)を変形すると次式となる。

上記のようにして、残差εtに系列相関がなくなるn期前まで遡って式変形を行った流入量モデルA5を求めることができる、その他のモデルについても同様に、誤差項に系列相関がなくなるようにパラメータを推計することができる。上記のようにして残差εtの系列相関がなくなるn期遅れのモデルをモデル記憶部131に記憶しておき、n期遅れのモデルを用いて流入量を予測することにより、残差項に系列相関がある場合にも、適切なパラメータの推計を行うことが可能となり、適切なパラメータを用いて精度よく流入量を予測することができる。
==流入量分布の作成処理==
次に、流入量分布の作成処理について説明する。流入量分布は、前月の流入量を条件とした条件付確率の分布である。本実施形態では、流入量Fmは、流入量Fmは、所定の最小値(以下、最小流入量といい、Fminと表記する。)から最大値(以下、最大流入量といい、Fmaxと表記する。)までの間を、単位量(例えば、1立法メートルや、10立方メートル、1000立方メートルなどである。以下、単位流入量という。)ずつ増減する離散値であるものとし、流入量分布は、最小流入量Fminから最大流入量Fmaxまで単位流入量ごとの流入量に対応付けて、確率が記述された表であるものとする。
次に、流入量分布の作成処理について説明する。流入量分布は、前月の流入量を条件とした条件付確率の分布である。本実施形態では、流入量Fmは、流入量Fmは、所定の最小値(以下、最小流入量といい、Fminと表記する。)から最大値(以下、最大流入量といい、Fmaxと表記する。)までの間を、単位量(例えば、1立法メートルや、10立方メートル、1000立方メートルなどである。以下、単位流入量という。)ずつ増減する離散値であるものとし、流入量分布は、最小流入量Fminから最大流入量Fmaxまで単位流入量ごとの流入量に対応付けて、確率が記述された表であるものとする。
条件付確率Pr(Fm|Fm-1)に、流入量確率モデルA6を適用すると次式のように変形できる。
 ここで、残差umには系列相関がないことから、A6’は、さらに次式のように変形できる。
 すなわち、条件付確率Pr(Fm|Fm-1)は、前期(m-1月)の流入量に応じて変化するドリフト項α4(μ3-Fm-1
*)Imと、残差項umImとから構成されることになる。
すなわち、条件付確率Pr(Fm|Fm-1)は、前期(m-1月)の流入量に応じて変化するドリフト項α4(μ3-Fm-1
*)Imと、残差項umImとから構成されることになる。
なお、本実施形態において条件付確率は、前月の流入量を条件とするが、前月および前々月の流入量を条件とした条件付確率、すなわち、Pr(Fm|Fm-1,Fm-2)としてもよい。
図21は、流入量分布の作成処理の流れを説明するための図である。
流入量確率モデル推計部219は、各月(1月~12月)をmとして、以下の処理を行う。
流入量確率モデル推計部219は、気象実績データベース233から、全ての年のm月の日付に対応する流入量を平均してImを算出し(S2541)、全ての年のm-1月の日付に対応する流入量を平均してIm-1を算出する(S2542)。
流入量確率モデル推計部219は、各月(1月~12月)をmとして、以下の処理を行う。
流入量確率モデル推計部219は、気象実績データベース233から、全ての年のm月の日付に対応する流入量を平均してImを算出し(S2541)、全ての年のm-1月の日付に対応する流入量を平均してIm-1を算出する(S2542)。
流入量確率モデル推計部219は、気象実績データベース233に記憶されている気象実績情報の日付が属する年のそれぞれについて、当該年のm月の日付に対応する日付の流入量を平均してFmを算出し(S2543)、FmをImで割ることで規格化して、Fm
*を算出する(S2544)。また、流入量確率モデル推計部219は、気象実績データベース233から、当該年のm-1月の日付に対応する流入量を平均してFm-1を算出し(S2545)、Fm-1をIm-1で割ることで規格化して、Fm-1
*を算出する(S2546)。
流入量確率モデル推計部219は、以上の処理を各年について行った後、流入量確率モデルA6”を回帰分析してα4およびμ3を推計し(S2547)、流入量確率モデル推計部219は、ドリフト項α4(μ3-Fm-1
*)Imを計算し(S2548)する。
また、流入量確率モデル推計部219は、流入量確率モデルA6”の残差umを次式により計算する(S2549)。
 流入量確率モデル推計部219は、残差項umImを算出する(S2550)。
また、流入量確率モデル推計部219は、流入量確率モデルA6”の残差umを次式により計算する(S2549)。
流入量確率モデル推計部219は、以上の処理を各月について繰り返して、各月についてのドリフト項および残差項を算出した後、ドリフト項ドリフト項α4(μ3-Fm-1
*)Imの頻度分布を生成し(S2551)、残差項umImの頻度分布を生成し(S2552)、これらを足し合わせて流入量Fmの頻度分布を作成する(S2553)。流入量確率モデル推計部219は、流入量Fmの頻度分布に基づいて、流入量の条件付発生確率Pr(Fm|Fm-1)を算出し(S2554)、算出した発生確率を記述した流入量分布を作成する。なお、流入分布は、確率分布の計算式として記述するようにしてもよい。
==運用計画システム30==
運用計画システム30は、長期の運用計画の対象となる期間(以下、長期運用期間という。本実施形態では1年とする。)における発電電力量が最大となるように、中期の運用計画の対象となる期間(以下、中期運用期間という。本実施形態では、1ヶ月とする。)ごとの最適な水位についてのシミュレーションを行い、その後、中期運用期間における最適な水位となり、かつ、短期の運用対象となる期間(以下、短期運用期間という。本実施形態では6日とする。)における売電額が最大となるように、短期運用期間中の各単位期間(本実施形態では1日とする。)ごとの水位を求める。なお、以下の説明において、貯水施設における水位は、所定の単位量(例えば、1メートルや5メートルなどである。以下、単位水位という。)ごとの離散値であるものとする。長期運用期間における発電電力量が最大となるような中期運用期間での水位は、確率論的動的計画法(Stochastic Dynamic Programming; SDP)により求める。短期運用期間における各単位期間の水位は、貯水施設における水位の最大最小値や水力発電に利用する水量(以下、取水量といい、Qと表記する。)の最大最小値などの制約の下に、流入量予測システム20が予測した予測流入量を用いて、各日の水位を単位水位ずつ変化させてシミュレーションし、売電額が最大となるような水位を算出する。
運用計画システム30は、長期の運用計画の対象となる期間(以下、長期運用期間という。本実施形態では1年とする。)における発電電力量が最大となるように、中期の運用計画の対象となる期間(以下、中期運用期間という。本実施形態では、1ヶ月とする。)ごとの最適な水位についてのシミュレーションを行い、その後、中期運用期間における最適な水位となり、かつ、短期の運用対象となる期間(以下、短期運用期間という。本実施形態では6日とする。)における売電額が最大となるように、短期運用期間中の各単位期間(本実施形態では1日とする。)ごとの水位を求める。なお、以下の説明において、貯水施設における水位は、所定の単位量(例えば、1メートルや5メートルなどである。以下、単位水位という。)ごとの離散値であるものとする。長期運用期間における発電電力量が最大となるような中期運用期間での水位は、確率論的動的計画法(Stochastic Dynamic Programming; SDP)により求める。短期運用期間における各単位期間の水位は、貯水施設における水位の最大最小値や水力発電に利用する水量(以下、取水量といい、Qと表記する。)の最大最小値などの制約の下に、流入量予測システム20が予測した予測流入量を用いて、各日の水位を単位水位ずつ変化させてシミュレーションし、売電額が最大となるような水位を算出する。
図22は、運用計画システム30のハードウェア構成を示す図である。同図に示すように、運用計画システム30は、CPU301、メモリ302、記憶装置303、通信インタフェース304、入力装置305、および出力装置306を備えている。記憶装置303は、各種のデータやプログラムを記憶する、例えば、ハードディスクドライブやフラッシュメモリ、CD-ROMドライブなどである。CPU301は、記憶装置303に記憶されているプログラムをメモリ302に読み出して実行することにより各種の機能を実現する。通信インタフェース304は、通信ネットワーク40に接続するためのインタフェースであり、例えば、イーサネット(登録商標)に接続するためのアダプタや、公衆電話回線網に接続するためのモデム、無線通信を行うための通信器などである。入力装置305は、データの入力を受け付ける、例えば、キーボードやマウス、タッチパネル、マイクロフォンなどである。出力装置306は、データを出力する、例えば、ディスプレイやプリンタ、スピーカなどである。
図23は、運用計画システム30のソフトウェア構成を示す図である。同図に示すように、運用計画システム30は、諸元入力部311、貯水量設定値入力部312、流入量分布取得部313、中期計画部314、予測流入量取得部315、短期計画部316、諸元記憶部331、モデル記憶部332、電力価格データベース333、最適水位データベース334を備えている。なお、諸元入力部311、貯水量設定値入力部312、流入量分布取得部313、中期計画部314、予測流入量取得部315、および短期計画部316は、運用計画システム30が備えるCPU201が、記憶装置203に記憶されているプログラムをメモリ202に読み出して実行することにより実現される。また、諸元記憶部331、電力価格データベース333、および最適水位データベース334は、運用計画システム30が備えるメモリ202や記憶装置203が提供する記憶領域として実現される。なお、諸元記憶部331、モデル記憶部332、電力価格データベース333、および最適水位データベース334は、運用計画システム30とは異なるデータベースサーバが管理し、運用計画システム30がそのデータベースサーバにアクセスするようにしてもよい。
諸元記憶部331は、貯水施設、河川、発電設備などの各種の諸元の設定値を含む情報(以下、諸元情報という。)を記憶する。図24は、諸元記憶部331に記憶される諸元情報の構成例を示す図である。同図に示すように、諸元情報は、諸元名、単位、および設定値が含まれる。
諸元入力部311は、諸元情報の入力を受け付け、受け付けた諸元情報を諸元記憶部331に登録する。諸元入力部311は、例えば、キーボードやマウスなどの入力装置205から諸元情報の各項目の入力を受け付けるようにしてもよいし、例えば、電力会社のホストコンピュータにアクセスして諸元情報を取得するようにしてもよい。
なお、諸元入力部331は予め、貯水施設に係る諸元として、水位の最高値(最高運用水位;以下、Hmaxと表記する。単位はmである。)、および水位の最低値(最低運用水位;以下、Hminと表記する。単位はmである。)の入力を受け付け、受け付けた最高運用水位を含む諸元情報と、最低運用水位を含む諸元情報とを作成して諸元記憶部331に登録し、河川に係る諸元として、維持流量(以下、S0と表記する。単位はm3/sである。)の入力を受け付け、受け付けた維持流量を含む諸元情報を作成して諸元記憶部331に登録し、発電設備に係る諸元として、発電に利用する可能な最大の水量(最大取水量;以下、Qmaxと表記する。単位はm3/sである。)、発電に利用可能な最低の水量(最小取水量;以下、Qminと表記する。単位はm3/sである。)、発電した後に放水する高さ(放水位;以下、Houtと表記する。単位はmである。)、および損失落差(以下、Hlosと表記する。単位はmである。)の入力を受け付けて、受け付けた最大取水量を含む諸元情報、最小取水量を含む諸元情報、放水位を含む諸元情報、および損失落差を含む諸元情報を作成して諸元記憶部331に登録しているものとする。
電力価格データベース333は、日付ごとの電力価格を記憶する。図25は電力価格データベース333の構成例を示す図である。同図に示すように、電力価格データベース333には、日付に対応付けて電力価格(単位は、円/kWhである。)が記憶されている。本実施形態では、電力価格は日付ごとに変更しうるものとし、また各日の電力価格は予めユーザから入力されて電力価格データベース333に登録されているものとする。
貯水量設定値入力部312は、短期運用期間の初日の開始時点(0時)における貯水量の予定値(以下、初期貯水量という。)の入力を受け付ける。なお、貯水量設定値入力部312は、例えば、現在の貯水施設の貯水量を取得して初期貯水量としてもよい。また、貯水量設定値入力部312は、過去の水位から初期貯水量を予測するようにしてもよい。
最適水位データベース334は、月と、当該月の開始時点における水位と、当該月における流入量とに対応する、最適な中期運用期間後の水位を記憶する。図26は、最適水位データベース334の構成例を示す図である。同図に示すように、最適水位データベース334には、長期運用期間中の各月mごとに、水位Hmおよび流入量Fmに対応付けて、その翌月における最適な水位(1月後最適水位Hm+1)が設定される水位流入量別目標水位表351を記憶している。後述するように、月と、その月の開始時点における水位と、予測流入量とに対応する1月後最適水位を最適水位データベース334から読み出すことにより、その月の最終時点における目標水位を取得することができる。
流入量分布取得部313は、流入量分布を取得する。本実施形態では、流入量分布取得部313は、流入量予測システム20に流入量分布取得要求を送信し、流入量分布取得要求に応じて流入量予測システム20が送信する流入量分布を受信することにより流入量分布を取得するものとする。なお、流入量分布取得部313は、ユーザから流入量分布の入力を受け付けるようにしてもよい。
中期計画部314は、中期運用期間ごとの最適な水位の計画を作成する。中期計画部314は、流入量分布と、後述するモデル記憶部332に記憶されている統計モデルとを用いて、確率論的動的計画法により最適な水位の計画を作成して、最適水位データベース334に登録する。なお、中期計画部314による最適水位計画の作成処理の詳細については後述する。
予測流入量取得部313は、流入量予測システム20にアクセスして、流入量予測システム20が予測した、短期運用期間内の各日についての流入量Rの予測値(予測流入量)を取得する。なお、予測流入量取得部313は、例えば、キーボードやマウスなどの入力装置205から、予測流入量の入力を受け付けるようにしてもよい。
短期計画部316(最適貯水量決定部)は、シミュレーションにより、短期運用期間中の各日における最適な水位(以下、短期運用水位といい、Hと表記する。)を算出し、算出した各日の短期運用水位を出力装置に出力する。短期計画部316は、後述するモデル記憶部332に記憶されている統計モデルを用いてシミュレーションを行う。
モデル記憶部332には、以下のモデルB1~B11が記憶されている。
モデルB1は、貯水量Vに基づいて運用水位Hを算出するためのもの(水位算出モデル)であり、次式により表される。なお、aは貯水施設に固有の定数である。
 モデルB2は、最高運用水位Hmaxに基づいて貯水量の上限(以下、上限貯水量といい、Vmaxと表記する。)を算出するためのものであり、次式により表される。
 モデルB3は、最低運用水位Hminに基づいて貯水量の下限(以下、下限貯水量といい、Vminと表記する。)を算出するためのものであり、次式により表される。
 モデルB4は、1日の0時から24時(すなわち次の日の0時)の貯水量に基づいて、単位期間の開始時点から終了時点までの貯水量の差(以下、貯水量差といい、ΔVと表記する。)を算出するものであり、ある日付tの0時における貯水量をVtとして、次式により表される。
 モデルB5は、流入量Rから維持流量S0および貯水量差ΔVを引いた水量(R0)を算出するためのものであり、次式により表される。
 モデルB6は、最小取水量Qmin、最大取水量Qmax、最低運転出力Q0minおよびR0に基づいて、取水量Qを決定するためのもの(取水量算出モデル)であり、次式により表される。
 すなわち、R0が、最小取水量Qmin以上であり、かつ、最大取水量Qmax以下である場合には、R0が取水量Qとなり、R0が最小取水量Qminよりも小さい場合には最小取水量Qminが取水量Qとなり、R0が最大取水量よりも大きい場合には最大取水量Qmaxが取水量Qとなる。ただし、R0が最低運転出力Q0minよりも小さい場合は、取水量Qは0となる。
モデルB7は、R0および取水量Qに基づいて、1日に貯水施設において放流される水量(以下、普通放流量といい、Sと表記する。)を算出するためのものであり、次式により表される。
 モデルB8は、1日の終了時点における運用水位、放水位Houtおよび損失落差Hlosに基づいて、有効落差hnを算出するためのものであり、日付tの0時における運用水位をHtとし、水位を海抜高さに変換するための所定の定数をbとして、次式により表される。
 モデルB9は、取水量Qおよび有効落差hnに基づいて1日に発電される発電電力Pnを算出するためのものであり、発電の変換効率に係る係数をc、重力加速度をgとして、次式により表される。
 モデルB10は、発電電力Pnに基づいて1日に発電される発電電力量Enを算出するためのもの(電力量算出モデル)であり、次式により表される。
 モデルB11は、ある日付についての発電電力量Enと、その日付に対応する電力価格とに基づいて売電額を算出するためのものであり、次式により表される。

==中期計画==
中期計画部314は、流入量分布と上記の統計モデルとを用いて確率論的動的計画法により最適な水位を算出する。具体的には、中期計画部314は、次式を満たす水位の組合せを求める。
 式B12において、GE(Hm,Hm+1,Fm)は、月mの開始時点mにおいて水位がHmであり、月mの終了時点(月m+1の開始時点)m+1における水位がHm+1であり、月mの流入量がFmである場合の発電電力量Enである。ここで、月mにおける発電電力量は、上記モデルB10により算出される1日あたりの発電電力量Enに、月mの日数を乗じることにより算出される。
中期計画部314は、流入量分布と上記の統計モデルとを用いて確率論的動的計画法により最適な水位を算出する。具体的には、中期計画部314は、次式を満たす水位の組合せを求める。
図27~29は、確率論的動的計画法により最適な水位を求める方法を説明するための図である。図27~29の例では、説明を簡単にするために、長期運用期間が4ヶ月であるものとし、貯水施設の水位はh1~h3のいずれかの値のみを取るものとしている。なお、中期計画部314は、終了時点m5における水位がh1~h3のそれぞれである場合について以下の処理を行う。
図27に示すように、中期計画部314は、前の期(ステージ)の合計発電電力量E(1,H1,F1)を0として、第4月の開始時点m4における水位ごとに、第4月における各流入量ごとに発電電力量を算出し、算出した発電電力量に、第1月の流入量の発生確率を乗じて算出された水位毎の期待値を加算したもの(ここでは合計発電電力量が0であるため、期待値も0になる。)を第4月の期待値として算出する。中期計画部314は、第4月の期待値が最も大きいもの(図中に太線で示す。)を選択する(ステップ1)。
中期計画部314は、時点m4における水位と、時点m3における水位の各組合せについて、第3月における発電電力量を算出し、算出値に第4月の流入量の発生確率を乗じて算出された水位毎の期待値を加算したものを第3月以降の期待値として算出する。中期計画部314は、第3月以降の期待値が最も大きい組合せ(図中に太線で示す。)を選択する(ステップ2)。
中期計画部314は、同様に、時点m3における水位と、時点m2における水位の各組合せについて、第2月における発電電力量に、第3月の流入量の発生確率を乗じて算出された水位毎の期待値を加算して、第2月以降の発電電力量の期待値を算出し、第2月以降の期待値が最大になる組合せ(図中に太線で示す。)を選択する(ステップ3)。
中期計画部314は、第1月についても、時点m2における水位と、時点m1における水位との各組合せについて、第1月における発電電力量に、第2月の流入量の発生確率を乗じて算出された水位毎の期待値を加算した、第1月以降の発電電力量の期待値を算出し、第1月以降の期待値が最大になる組合せ(図中に太線で示す。)を選択する(ステップ4)。
以上のようにして最適な水位が決定される。
以上のようにして最適な水位が決定される。
上記説明では、長期運用期間の終了時点における水位(目的水位)のみを与え、発電電力量の期待値を最大化するような各月の水位の組合せを算出する手順を示したが、長期運用期間の終了時点における水位によっては、次の長期運用期間の運用パフォーマンスが悪化することが考えられる。この問題を解決するために長期運用期間における合計発電電力量の期待値が最大となるまで繰り返していく。
中期計画部314は、上述した各処理(ステージ)が終わるごとに、第1月から第4月までの発電電力量の合計値を、第1月の水位H1および第1月の流入量F1に対応付けて管理する水位流入量別電力量表341を作成していく。水位流入量別電力量表341の構成例を図28に示す。中期計画部314は、二回目以降の各ステージにおいては、前のステージの合計発電電力量を水位流入量別電力量表341から読み出して、上記処理を行う(図29参照)。中期計画部314は、前のステージにおける合計電力量と、現在のステージにおける合計電力量との差が所定値以下となるまで上記処理を繰り返す。
図30は、長期運用期間における最適水位の計画処理の流れを示す図である。
中期計画部314は、処理のステージを示すSTに1を設定し(S3601)、最終月(本実施形態では第12月)から第1月までの各月について、確率的動的計画法による水位の計画処理を行う(S3602)。図31は、確率的動的計画法による水位計画処理に用いられる表である水位流入量別発電電力量表352の構成を示す図である。図31に示す水位流入量別発電電力量表352には、第12月の水位H12と、第12月の流入量F12とに対応づけて、第12月における発電電力量が登録される。
中期計画部314は、処理のステージを示すSTに1を設定し(S3601)、最終月(本実施形態では第12月)から第1月までの各月について、確率的動的計画法による水位の計画処理を行う(S3602)。図31は、確率的動的計画法による水位計画処理に用いられる表である水位流入量別発電電力量表352の構成を示す図である。図31に示す水位流入量別発電電力量表352には、第12月の水位H12と、第12月の流入量F12とに対応づけて、第12月における発電電力量が登録される。
図32および図33は、確率的動的計画法による水位計画処理の流れを示す図である。
図32は、最終月(12月)についての水位計画処理の流れを示す図である。中期計画部314は、1つ前の処理に係る月である第1月(第12月から第1月までの各月に対して処理が行われるため、第12月の1つ前の処理に係る月は第1月となる。)までの累計発電電力量E(1,H1,F1)を0とし(S3621)、最終月の水位H12に、最低水位Hminを設定する(S3622)。中期計画部314は、12月までの累計発電電力量E(12,H12,F12)に0を設定し(S3623)、12月の流入量F12に、最小流入量Fminを設定する(S3624)。中期計画部314は、1月の水位H1に最低水位Hminを設定し(S3625)、諸元記憶部331に記憶されている各諸元を上述したモデルに適用して、発電電力量Enを算出する(S3626)。中期計画部314は、Enに31(12月の日数)を乗じて、1ヶ月の発電電力量の期待値GEを算出する(S3627)。中期計画部314は、1月の流入量F1の発生確率を取得し(S3628)、各F1について、F12を条件としたF1の条件付確率を累計発電電力量E(12,H12,F12)に乗じた値を合計してGEに加算し、E1(12,H12,F12)を算出する(S3629)。
図32は、最終月(12月)についての水位計画処理の流れを示す図である。中期計画部314は、1つ前の処理に係る月である第1月(第12月から第1月までの各月に対して処理が行われるため、第12月の1つ前の処理に係る月は第1月となる。)までの累計発電電力量E(1,H1,F1)を0とし(S3621)、最終月の水位H12に、最低水位Hminを設定する(S3622)。中期計画部314は、12月までの累計発電電力量E(12,H12,F12)に0を設定し(S3623)、12月の流入量F12に、最小流入量Fminを設定する(S3624)。中期計画部314は、1月の水位H1に最低水位Hminを設定し(S3625)、諸元記憶部331に記憶されている各諸元を上述したモデルに適用して、発電電力量Enを算出する(S3626)。中期計画部314は、Enに31(12月の日数)を乗じて、1ヶ月の発電電力量の期待値GEを算出する(S3627)。中期計画部314は、1月の流入量F1の発生確率を取得し(S3628)、各F1について、F12を条件としたF1の条件付確率を累計発電電力量E(12,H12,F12)に乗じた値を合計してGEに加算し、E1(12,H12,F12)を算出する(S3629)。
中期計画部314は、E1(12,H12,F12)が、E(12,H12,F12)以上である場合(S3630:YES)、E(12,H12,F12)にE1(12,H12,F12)を設定して(S3631)、月12、H12、H1、F12を水位流入量別目標水位表351および水位流入量発電電力量表352に登録する(S3632)。
中期計画部314は、H1に単位水位を加算し(S3633)、加算後のH1が最高水位Hmaxよりも大きくなければ(S3634:NO)、ステップS3626からの処理を繰り返す。加算後の水位H1が最高水位Hmaxよりも大きい場合には(S3634:YES)、中期計画部314は、流入量F12に単位流入量を加算する(S3635)。流入量F12が最大流入量Fmaxを越えていない場合には(S3636:NO)、ステップS3625からの処理を繰り返す。流入量F12が最大流入量Fmaxを越えた場合(S3636:YES)、中期計画部314は、水位H12に単位水位を加算し(S3637)、加算後の水位H12が最大水位Hmaxよりも大きくなっていなければ(S3638:NO)、ステップS3623からの処理を繰り返す。中期計画部314は、水位H12が最大水位Hmaxよりも大きくなると(S3638)、処理を終了する。
図33は、最終月(12月)以外の月m(m=11,10,...,1)についての水位計画処理の流れを示す図である。まず、中期計画部314は、1つ前の処理に係る月m+1までの累計発電電力量E(m+1,Hm+1,Fm+1)を、水位流入量別発電電力量表352から算出する(S3641)。上述した図32の最終月に係る水位計画の処理では、累計発電電力量E(1,H1,F1)を0として計算をしていたが(図32、S3621)、これは、最初に図32の処理を実行するとき、水位流入量別発電電力量表352に値が登録されていないためである。
次に、中期計画部314は、図32の処理と同様に、月mの水位Hmに、最低水位Hminを設定し(S3642)、月mまでの累計発電電力量E(m,Hm,Fm)に0を設定し(S3643)、月mの流入量Fmに、最小流入量Fminを設定する(S3644)。中期計画部314は、前の期の月m+1の水位Hm+1に最低水位Hminを設定し(S3645)、諸元記憶部331に記憶されている各諸元を上述したモデルに適用して、発電電力量Enを算出する(S3646)。中期計画部314は、Enに月mの日数を乗じて、1ヶ月の発電電力量の期待値GEを算出する(S3647)。中期計画部314は、前期の月m+1の流入量Fm+1の発生確率を取得し(S3648)、各Fm+1について、Fm+1を条件としたFmの条件付確率を累計発電電力量E(m+1,Hm+1,Fm+1)に乗じた値を合計してGEに加算し、E1(m,Hm,Fm)を算出する(S3649)。
中期計画部314は、E1(m,Hm,Fm)が、E(m,Hm,Fm)以上である場合(S3650:YES)、E(m,Hm,Fm)にE1(m,Hm,Fm)を設定して(S3651)、月m、Hm、Hm+1、Fmを水位流入量別目標水位表351および水位流入量発電電力量表352に登録する(S3652)。
中期計画部314は、Hm+1に単位水位を加算し(S3653)、加算後のHm+1が最高水位Hmaxよりも大きくなければ(S3654:NO)、ステップS3646からの処理を繰り返す。加算後の水位Hm+1が最高水位Hmaxよりも大きい場合には(S3654:YES)、中期計画部314は、流入量Fmに単位流入量を加算する(S3655)。流入量Fmが最大流入量Fmaxを越えていない場合には(S3656:NO)、ステップS3645からの処理を繰り返す。流入量Fmが最大流入量Fmaxを越えた場合(S3656:YES)、中期計画部314は、水位Hmに単位水位を加算し(S3657)、加算後の水位Hmが最大水位Hmaxよりも大きくなっていなければ(S3658:NO)、ステップS3643からの処理を繰り返す。中期計画部314は、水位Hmが最大水位Hmaxよりも大きくなると(S3658)、処理を終了する。
第12月から第1月までの各月について上記確率的動的計画法による水位計画処理を行った後、中期計画部314は、図34に示す期待合計発電電力量の計算処理を行う(S3603)。中期計画部314は、H1にHminを設定し(S3661)、単位流入量ごとの各F1の発生確率を取得する(S3662)。中期計画部314は、第1月までの累積発電電力量E(1,H1,F1)を水位流入量別発電電力量表352から算出し(S3663)、各F1について、F12を条件としたF1の条件付確率をEに乗じた値を合計して、ステージの期待合計発電電力量EE(1,H1)を算出する(S3664)。中期計画部は、H1に単位水位を加算し(S3665)、H1がHmaxを越えなければ(S3666:NO)、ステップS3663からの処理を繰り返す。
図30に戻り、中期計画部314は、STが1である場合(S3604:1)、期待合計発電電力量EE(1,H1)をE02(1,H1)として設定し(S3605)、STが2である場合には(S3604:2)、期待合計発電電力量EE(1,H1)をE01(1,H1)として設定する(S3606)。中期計画部314は、STをインクリメントして(S3607)、ステップS3602の最終月から第1月までの確率的計画法による水位計画処理からの処理を繰り返す。
一方、STが3以上である場合には(S3604:3以上)、中期計画部314は、期待合計発電電力量EE(1,H1)をE00(1,H1)として設定し(S3609)、E02(1,H1)からE01(1,H1)を減じた第1の値を、E01(1,H1)からE00(1,H1)を減じた第2の値で割った商が所定の閾値を越えていないかどうかにより、収束を判断する。上記商が閾値を越えている場合(S3610:YES)、中期計画部314は、E02(1,H1)にE01(1,H1)を設定し(S3611)、E01(1,H1)にE00(1,H1)を設定して(S3612)、上述したステップS3607に進む。上記商が閾値を越えていなければ(S3610:NO)、中期計画部314は、処理を終了する。
以上のようにして、最適水位データベース334に格納される各月についての水位流入量別目標水位表351が更新される。
本実施形態の運用計画システム30によれば、将来の流入量の予測値を用いて、長期運用期間における発電電力量の期待値を大きくする、中期運用期間の開始時点および終了時点の水位の組合せを求めることができる。したがって、貯水施設の運用者は、中期運用期間の開始時点に、最適水位データベース334を参考にして、その時点での水位に対応する1ヶ月後の水位を目標の水位として貯水施設を運用することにより、1年間の発電電力量を大きくすることが可能となる。よって、貯水施設の運用者の経験が浅い場合であっても容易に最適な水位に調整することができる。
本実施形態の運用計画システム30によれば、将来の流入量の予測値を用いて、長期運用期間における発電電力量の期待値を大きくする、中期運用期間の開始時点および終了時点の水位の組合せを求めることができる。したがって、貯水施設の運用者は、中期運用期間の開始時点に、最適水位データベース334を参考にして、その時点での水位に対応する1ヶ月後の水位を目標の水位として貯水施設を運用することにより、1年間の発電電力量を大きくすることが可能となる。よって、貯水施設の運用者の経験が浅い場合であっても容易に最適な水位に調整することができる。
また、本実施形態の運用計画システム30によれば、貯水施設の運用者の勘と経験によって水位を計画する場合に比べ、客観的なデータに基づいて、水位の計画を策定することができる。また、本実施形態の運用計画システム30では、確率論的動的計画法を用いることにより、将来の流入量の予測値を確率分布として求めた場合でも、貯水施設における発電電力量の期待値を大きくする最適な水位の計画を容易に導出することができる。
==短期計画==
上述のように、中期計画部314は、中期運用期間(月)の開始時点および終了時点の最適な水位の組合せを求めるのに対し、短期計画部334は、短期運用期間(6日)における売電額を大きくするように、短期運用期間における水位を計画する。
上述のように、中期計画部314は、中期運用期間(月)の開始時点および終了時点の最適な水位の組合せを求めるのに対し、短期計画部334は、短期運用期間(6日)における売電額を大きくするように、短期運用期間における水位を計画する。
短期計画部316は、貯水量設定値入力部312が受け付けた初期貯水量を短期運用期間の初日のV1とし、V1をモデルB1に適用し、初日の水位H1を算出する。短期計画部316は、短期運用期間が属する月とH1とに対応する1月後最適水位を読み出して、短期運用期間の終了時点(7日目の開始時点でもある。)における水位H2とする。短期計画部316は、水位H2およびモデルB2またはB3を用いて、短期運用期間の終了時点における貯水量の目標値(以下、最終目的貯水量という。)V7を算出する。短期計画部316は、各日付t(t=2~6)について、0時における貯水量VtをVminからVmaxの間で所定のステップ(例えば、0.1や0.5、1など)で変化させてシミュレーションを行い、Enが最大となるようにVtを決定する。短期計画部316は、このシミュレーションにおいて、動的計画法を用いるものとする。動的計画法を用いることで、最適なVtの組合せを迅速に算出することができる。
==画面例==
図35は、運用水位のシミュレーションに用いられる画面60の一例を示す図である。画面60には、運用期間の入力欄611、初期貯水量の入力欄612、最終目的貯水量の入力欄613、および各種諸元の表示欄621~627が設けられている。
図35は、運用水位のシミュレーションに用いられる画面60の一例を示す図である。画面60には、運用期間の入力欄611、初期貯水量の入力欄612、最終目的貯水量の入力欄613、および各種諸元の表示欄621~627が設けられている。
短期計画部316は、諸元記憶部331から、最小運用水位および最大運用水位に対応する設定値(HminおよびHmax)を読み出し、読み出したHminおよびHmaxを表示欄621および表示欄622に表示する。短期計画部316は、諸元記憶部331から、維持流量に対応する設定値(S0)を読み出し、読み出したS0を表示欄623に表示する。短期計画部316は、諸元記憶部331から、最小取水量および最大取水量に対応する設定値(QminおよびQmax)を読み出し、読み出したQminおよびQmaxを表示欄624および625にそれぞれ表示する。短期計画部316は、諸元記憶部331から、放水位に対応する設定値(Hout)を読み出し、読み出したHoutを表示欄626に表示する。短期計画部316は、諸元記憶部331から、損失落差に対応する設定値(Hlos)を読み出し、読み出したHlosを表示欄627に表示する。
また、短期計画部316は、上述したモデルB2およびモデルB3を用いて、VmaxおよびVminを算出し、算出したVmaxおよびVminを表示欄631および表示欄632にそれぞれ表示する。
予測流入量取得部313は、流入量予測システム20にアクセスして、流入量予測システム20が予測した、運用期間内の各日についての流入量Rの予測値を取得し、取得したRを表示欄633に表示する。
入力欄611、612および613に運用期間、初期貯水量および最終目的貯水量が入力され、ボタン641が押下されると、貯水量設定値入力部312は、入力欄611、612および613に入力された運用期間、初期貯水量、および最終目的貯水量の入力を受け付け、短期計画部316は、運用期間中の各日について貯水量Vをシミュレーションする。短期計画部316は、例えば以下のようにして貯水量Vのシミュレーションを行う。なお、図35の例では、貯水施設に固有の係数a=30000であり、水位を海抜高さに変換する定数b=500であるものとしている。
短期計画部316は、入力欄612に入力された初期貯水量を第1日目の貯水量V1とし、入力欄613に入力された最終目的貯水量を第7日目の貯水量V7とし、第1日目から第6日目までの貯水量Vtのシミュレーションを行い、貯水量Vを表示欄651に表示する。
短期計画部316は、各日付についての貯水量VをモデルB1に適用して運用水位Hを算出し、算出した運用水位Hを表示欄652に表示する。短期計画部316は、1~6日目の日付tについて、VtおよびVt+1をモデルB4に適用して、各日付tについての貯水量差ΔVtを算出し、算出した貯水量差ΔVtを表示欄653に表示する。
短期計画部316は、流入量の予測値R、維持流量S0、および貯水量差ΔVをモデルB5に適用してR0を算出し、モデルB6によりR0に応じた取水量Qを決定し、決定した取水量Qを表示欄654に表示する。短期計画部316は、R0および取水量QをモデルB7に適用して、普通放流量Sを算出し、算出したSを表示欄655に表示する。
短期計画部316は、1~6日目の各日tについて、上記算出した運用水位Ht+1、放水位Houtおよび損失落差HlosをモデルB8に適用して、有効落差hnを算出し、算出したhnを表示欄656に表示する。
短期計画部316は、取水量Q、有効落差hnをモデルB9に適用して、発電電力Pnを算出して表示欄657に表示するとともに、算出したPnをモデルB10に適用して発電電力量Enを算出し、算出したEnを表示欄660に表示する。
短期計画部316は、運用期間中の各日の日付に対応する電力価格を電力価格データベース333から読み出して表示欄659に表示するとともに、上記Enおよび読み出した電力価格をモデルB11に適用して、売電額を算出し、算出した売電額を表示欄658に表示する。
短期計画部316は、貯水量Vt(t=2~6)を最大VminからVmaxまで変化させて、上記の処理を繰り返すことによりシミュレーションを行い、運用期間中の売電額の合計額が最大となる貯水量Vの組合せを決定する。なお、短期計画部316は、動的計画法により、貯水量Vの組合せを決定することで、効率的に最適な貯水量を決定することができる。短期計画部316は、決定した貯水量Vの組合せに対応するように表示欄651~660を表示する。
図36は、ある貯水施設において、過去の実績水位についてシミュレーションを行った結果を示すグラフである。
図36(a)は、比較的豊水期として知られている2003年7月における取水量および運用水位の変化を示すグラフである。貯水施設では、運用者の経験によって運用水位が決定されており、2003年7月期における売電額の実績値は約258(百万円)であった。これに対して、上記シミュレーションの結果の貯水量Vの組合せに対応する売電額は約269(百万円)となった。すなわち、約4%の売電額の上昇がみられた。
図36(a)は、比較的豊水期として知られている2003年7月における取水量および運用水位の変化を示すグラフである。貯水施設では、運用者の経験によって運用水位が決定されており、2003年7月期における売電額の実績値は約258(百万円)であった。これに対して、上記シミュレーションの結果の貯水量Vの組合せに対応する売電額は約269(百万円)となった。すなわち、約4%の売電額の上昇がみられた。
図36(b)は、比較的渇水期として知られている2007年4月における取水量および運用水位の変化を示すグラフである。2007年4月期における売電額の実績値は107(百万円)であったところ、上記シミュレーションの結果の貯水量Vの組合せに対応する売電価格は114(百万円)となり、約6%の上昇がみられた。
このように、上記シミュレーションにより、売電額が最大になるように貯水量Vの組合せを決定して運用水位Hを運用することで、運用者の経験による運用に比べて売電額の上昇が可能になることが確認された。
以上説明したように、本実施形態の水位運用支援システムによれば、初期貯水量および最終目的貯水量に応じて、売電額が最大になるような運用水位を提示することができる。したがって、貯水施設の運用者は、水位運用支援システムからの提示を参考にして、貯水位施設の水位を運用することで、より効率的かつ効果的に水力発電を行うことができる。
なお、本実施形態では、降水量予測システム10、流入量予測システム20、運用計画システム30はそれぞれ異なるコンピュータであるものとしたが、1台のコンピュータにより実現することもできる。また、降水量予測システム10、流入量予測システム20および運用計画システム30のいずれかを、複数台のコンピュータにより実現するようにすることもできる。
また、本実施形態の降水量予測システム10では、天気は、「晴」「曇」「雪」「雨」「大雨」のいずれかであるものとしたが、例えば、「みぞれ」や「ひょう」などを含めてもよい。また、本実施形態では、時間語は、「時々」「一時」「後」のいずれかであるものとしたが、例えば、「次第に」「はじめ」などを含めてもよい。
また、本実施形態の降水量予測システム10では、天気概況情報には昼の時間帯および夜の時間帯の天気概況が含まれているものとしたが、これに限らず、1日の天気概況のみが含まれていてもよいし、午前、午後、夜など3つ以上の時間帯についての天気概況が含まれていてもよい。
また、本実施形態の降水量予測システム10では、パターン表161の行列ともに、降水量への度合いの強い順に天気語および時間語が並んでいるものとしたが、例えば、天気語および時間語に対応付けて、降水量に関する度合い(優先度)を記憶する優先度記憶部を備えるようにしてもよい。この場合、天気パターン登録部112は、パターン表161を用いず、図6のステップS1514で天気チャンクのリストを生成し、リストに含まれる天気チャンクのそれぞれについて、含まれる天気語に対応する度合いと、含まれる時間語に対応する度合いとを優先度記憶部から取得し、取得した度合いの合計値を当該天気チャンクの優先度とする。天気パターン登録部112は、天気語のそれぞれについて、当該天気語が含まれる天気チャンクを特定し、特定した天気チャンクのうち、最も優先度が高いものを残して、それ以外をリストから削除する。天気パターン登録部112は、リストに残った天気チャンクに基づいて、天気パターン情報を作成して天気パターンデータベース132に登録することができる。
また、本実施形態の降水量予測システム10では、天気パターンデータベース132は、日付と天気チャンクに対応するフラグ値が登録されるものとしたが、これに限らず、例えば、日付に対応付けて、天気チャンクのリストを登録するようにしてもよい。また、天気パターンデータベース132に、日付に対応付けて、天気概況情報に含まれていた降水量も記憶するようにしてもよい。
また、本実施形態の流入量予測システム20では、パーセンタイル値を用いて予測降水量を決定するものとしたが、これに限らず、平均値や中央値などとしてもよい。
また、本実施形態では、流入量および水位は単位流入量および単位水位ごとの離散値であるものとしたが、実数の連続値としてもよい。この場合、流入量予測システム20において作成される流入量分布は、流入量に応じた確率を求める関数として記述され、また、運用計画システム30の最適水位データベース334は、月、水位、および流入量を引数として、1ヵ月後の最適水位を求める関数として記述される。
また、本実施形態の運用計画システム30では、長期運用期間は1年であり、中期運用期間は1ヶ月であり、短期運用期間は6日であるものとしたが、これに限らず、任意の長さを設定することができる。例えば、長期運用期間を半年や3ヶ月などとしてもよいし、中期運用期間を3ヶ月や旬(10日)、1週間としてもよい。また、短期運用期間を2週間や1週間、4日などとしてもよい。
また、本実施形態の運用計画システム30では、確率論的動的計画法により中期運用期間の開始時点および終了時点における最適な水位の組合せを求めるものとしたが、これに限らず、長期運用期間における発電電力量の期待値を最大化するような、各種の最適経路探索手法を用いて水位を算出することができる。
また、本実施形態の運用計画システム30では、売電額が最大になるように貯水量Vの組合せを決定するものとしたが、発電電力量Enが最大となるような組合せを決定するようにしてもよい。この場合、価格の変動に関わらず、より効率的な発電を行うことが可能となる。
また、運用計画システム30は、普通放流量Sの上限を設けて、シミュレーションを行うようにしてもよい。この場合、短期計画部316は、ユーザから上限値の入力を受け付けて、普通放流量Sが上限値を超えない貯水量Vの組合せのうち、売電額が最大になるものを決定するようにする。図37は、上記2003年7月期における放流量Sの実績値と、上限値を設けなかった場合に売電額が最大になるときの放流量Sの理論値と、上限値を15m3/sと設定した場合に売電額が最大になるときの放流量Sの理論値とを比較したグラフである。図37に示すように、例えば、7月24日では、放流量Sが25(m3/2)近くまで増加している。この場合の売電額も、約269(百万円)となり、約4%の上昇がみられた。したがって、実際の貯水施設の運用時には、例えば、釣り人やキャンプをしている人などがいる場合などの、下流への影響を考慮して、放流量には上限値を設けることが行われるが、上限値を設けたとしても、上記のシミュレーションの結果に従って貯水施設の水位を運用することで、より効率的な発電を行うことが可能となる。
また、本実施形態の流入量予測システム20では、ダムなどの貯水施設に河川から流入する水量についての予測を行うものとしたが、河川を流れる水量の予測を行うシステムにも容易に適用することができる。この場合、河川の上流域における気温や降水量の予報値および実績値などを取得および記録するものとする。
また、本実施形態の運用計画システム30では、流入量予測システム20から流入量Rを取得するものとしたが、これに限らず、例えば、流入量Rの入力をユーザから受け付けるようにしてもよい。また、過去の流入量の実績値をデータベースに記憶しておき、過去の実績値をRとして読み出してシミュレーションするようにしてもよい。
また、本実施形態の運用計画システム30では、予め電力価格は電力価格データベース333に記憶されているものとしたが、例えば、日本卸電力取引所における電力価格(JEPX価格)を自動的に取得するようにしてもよい。この場合、電力価格データベース333を省略して、短期計画部316によるシミュレーションの度に、JEPX価格を取得するようにすることもできる。
以上、本実施形態について説明したが、上記実施形態は本発明の理解を容易にするためのものであり、本発明を限定して解釈するためのものではない。本発明は、その趣旨を逸脱することなく、変更、改良され得ると共に、本発明にはその等価物も含まれる。
10 降水量予測システム、20 流入量予測システム、30 運用計画システム、40 通信ネットワーク、101 CPU、102 メモリ、103 記憶装置、104 通信インタフェース、105 入力装置、106 出力装置、111 天気概況取得部、112 天気パターン登録部、113 予測降水量取得要求受信部、114 天気予報取得部、115 降水量予測部、116 予測降水量送信部、131 天気概況データベース、132 天気パターンデータベース、201 CPU、202 メモリ、203 記憶装置、204 入力装置、205 出力装置、211 降雪気温推計部、212 融雪量モデル推計部、213 流入量モデル推計部、214 予測気温取得部、215 予測降水量取得部、216 予測流入量取得要求受信部、217 流入量予測部、218 予測流入量送信部、219 流入量分布取得要求受信部、220 流入量発生確率モデル推計部、221 流入量分布生成部、222 流入量分布送信部、231 モデル記憶部、232 パラメタ記憶部、233 気象実績データベース、211 降雪気温推計部、212 融雪量モデル推計部、213 流入量モデル推計部、214 予測気温取得部、215 予測降水量取得部、216 予測流入量取得要求受信部、217 流入量予測部、218 予測流入量送信部、219 流入量分布取得要求受信部、220 流入量発生確率モデル推計部、221 流入量分布生成部、222 流入量分布送信部、231 モデル記憶部、232 パラメタ記憶部、233 気象実績データベース、311 諸元入力部、312 貯水量設定値入力部、313 流入量分布取得部、314 中期計画部、315 予測流入量取得部、316 短期計画部、331 諸元記憶部、332 モデル記憶部、333 電力価格データベース、334 最適水位データベース、351 水位流入量別目標水位表、352 水位流入量別発電電力量表
Claims (5)
- 水力発電のための貯水施設の運用を支援するシステムであって、
所定の運用期間を構成する単位期間の開始時点における水位と、前記単位期間における前記貯水施設への流入量とに対応づけて、前記単位期間の終了時点における最適な水位である最適水位を記憶する最適水位テーブルと、
前記運用期間の開始時点における前記貯水施設の水位を取得する水位取得部と、
前記各単位期間における流入量の予測値を取得する予測流入量取得部と、
前記各単位期間について、前記開始時点における水位および当該単位期間における前記流入量の予測値に対応する前記最適水位を前記最適水位テーブルから読み出すとともに、読み出した前記最適水位を当該単位期間の次の単位期間の開始時点における水位としていく水位計画部と、
前記各単位期間についての前記最適水位を記憶する水位計画記憶部と、
を備え、
前記各単位期間の終了時に、前記水位取得部は、現在時点における前記貯水施設の水位である現在水位を取得し、前記予測流入量取得部は、当該単位期間の次の単位期間以後における前記流入量の予測値を取得し、前記水位計画部は、前記現在水位を前記次の単位期間の開始時点における水位として、前記次の単位期間以後の前記各単位期間について前記最適水位を前記最適水位テーブルから読み出していき、前記読み出した最適水位により前記水位計画記憶部を更新すること、
を特徴とする貯水施設運用支援システム。 - 請求項1に記載の貯水施設運用支援システムであって、
前記予測流入量取得部は、前記各単位期間における複数の前記流入量の予測値と、当該予測値の発生確率とを取得し、
前記最適水位テーブルは、前記貯水施設がとりうる各水位と、前記各単位期間における前記流入量の予測値と、前記流入量の予測値の発生確率とに基づいて、確率的動的計画法により作成されること、
を特徴とする貯水施設運用支援システム。 - 請求項2に記載の貯水施設運用支援システムであって、
前記単位期間ごとに、前記流入量の実績値を記憶するデータベースと、
ある第1単位期間の直前の第2単位期間における前記流入量と所定の定数である均衡流入量との差を説明変数とし、前記第2単位期間から前記第1単位期間までの前記流入量の増加量を目的変数とする統計モデルを記憶するモデル記憶部と、
前記データベースに記憶されている前記流入量の実績値、および前記統計モデルに基づいて回帰分析を行い、前記説明変数についての回帰係数および前記均衡流入量を推計する流入量モデル推計部と、
前記各単位期間について、当該単位期間である第1単位期間の直前の第2単位期間に対応する前記流入量の第1の実績値、および前記第1期間に対応する前記流入量の第2の実績値を前記データベースから読み出し、前記推計した均衡流入量から前記第2の実績値を引いたものに前記回帰係数を乗じた値を、前記第1および第2の実績値の差から引いた値である残差項を算出して、前記残差項の頻度分布を生成する残差項頻度分布生成部と、
前記各単位期間について、前記第2単位期間に対応する前記流入量の第1の実績値、および前記第1単位期間に対応する前記流入量の第2の実績値を前記データベースから読み出し、前記推計した均衡流入量から前記第2の実績値を引いたものに前記回帰係数を乗じたドリフト項を算出して、前記ドリフト項の頻度分布を生成するドリフト項頻度分布生成部と、
前記残差項の頻度分布および前記ドリフト項の頻度分布を加算して前記流入量の頻度分布を生成し、前記流入量の頻度分布から前記流入量の発生確率分布を生成する確率分布生成部と、
を備え、
前記予測流入量取得部は、前記流入量がとりうる所定の範囲の値のそれぞれを前記流入量の予測値として、前記発生確率分布に基づき前記流入量の予測値の発生確率を算出すること、
を特徴とする貯水施設運用支援システム。 - 水力発電のための貯水施設の運用を支援する方法であって、
所定の運用期間を構成する単位期間の開始時点における水位と、前記単位期間における前記貯水施設への流入量とに対応づけて、前記単位期間の終了時点における最適な水位である最適水位を記憶する最適水位テーブルを備えるコンピュータが、
前記運用期間の開始時点における前記貯水施設の水位を取得し、
前記運用期間の開始前に、
前記各単位期間における流入量の予測値を取得し、
前記各単位期間について、前記開始時点における水位および当該単位期間における前記流入量の予測値に対応する前記最適水位を前記最適水位テーブルから読み出すとともに、読み出した前記最適水位を当該単位期間の次の単位期間の開始時点における水位としていき、
前記各単位期間についての前記最適水位をメモリに記憶し、
前記各単位期間の終了時に、
現在時点における前記貯水施設の水位である現在水位を取得し、
当該単位期間の次の単位期間以後における前記流入量の予測値を取得し、
前記現在水位を前記次の単位期間の開始時点における水位として、前記次の単位期間以後の前記各単位期間について前記最適水位を前記最適水位テーブルから読み出していき、
前記読み出した最適水位により前記メモリを更新すること、
を特徴とする貯水施設運用支援方法。 - 水力発電のための貯水施設の運用を支援するためのプログラムであって、
所定の運用期間を構成する単位期間の開始時点における水位と、前記単位期間における前記貯水施設への流入量とに対応づけて、前記単位期間の終了時点における最適な水位である最適水位を記憶する最適水位テーブルと、を備えるコンピュータに、
前記運用期間の開始時点における前記貯水施設の水位を取得するステップと、
前記運用期間の開始前に、
前記各単位期間における流入量の予測値を取得するステップと、
前記各単位期間について、前記開始時点における水位および当該単位期間における前記流入量の予測値に対応する前記最適水位を前記最適水位テーブルから読み出すとともに、読み出した前記最適水位を当該単位期間の次の単位期間の開始時点における水位としていくステップと、
前記各単位期間についての前記最適水位をメモリに記憶するステップと、
を実行させ、
前記各単位期間の終了時に、
現在時点における前記貯水施設の水位である現在水位を取得するステップと、
当該単位期間の次の単位期間以後における前記流入量の予測値を取得するステップと、
前記現在水位を前記次の単位期間の開始時点における水位として、前記次の単位期間以後の前記各単位期間について前記最適水位を前記最適水位テーブルから読み出していくステップと、
前記読み出した最適水位により前記メモリを更新するステップと、
を実行させるためのプログラム。
Applications Claiming Priority (2)
| Application Number | Priority Date | Filing Date | Title |
|---|---|---|---|
| JP2008-324752 | 2008-12-19 | ||
| JP2008324752 | 2008-12-19 |
Publications (1)
| Publication Number | Publication Date |
|---|---|
| WO2010071158A1 true WO2010071158A1 (ja) | 2010-06-24 |
Family
ID=42268828
Family Applications (1)
| Application Number | Title | Priority Date | Filing Date |
|---|---|---|---|
| PCT/JP2009/070996 Ceased WO2010071158A1 (ja) | 2008-12-19 | 2009-12-16 | 貯水施設運用支援システム、貯水施設運用支援方法およびプログラム |
Country Status (3)
| Country | Link |
|---|---|
| JP (1) | JP5225256B2 (ja) |
| TW (1) | TWI490811B (ja) |
| WO (1) | WO2010071158A1 (ja) |
Cited By (4)
| Publication number | Priority date | Publication date | Assignee | Title |
|---|---|---|---|---|
| JP5014522B1 (ja) * | 2011-06-28 | 2012-08-29 | 中国電力株式会社 | 流入量予測装置、流入量予測方法及びプログラム |
| US10125740B2 (en) * | 2016-01-18 | 2018-11-13 | Horacio L. Velasco | Method for operation of hydropower reservoir with a 2-parameter elevation rule curve |
| CN112686416A (zh) * | 2019-10-17 | 2021-04-20 | 中国电力科学研究院有限公司 | 一种风电功率概率预测方法和系统 |
| JP7303960B1 (ja) | 2022-12-07 | 2023-07-06 | 中国科学院西北生態環境資源研究院 | 氷河融雪水流出量の推定方法 |
Families Citing this family (5)
| Publication number | Priority date | Publication date | Assignee | Title |
|---|---|---|---|---|
| JP5153850B2 (ja) * | 2010-10-26 | 2013-02-27 | 中国電力株式会社 | 貯水施設運用支援システム、貯水施設運用支援方法及びプログラム |
| JP5279867B2 (ja) * | 2011-05-18 | 2013-09-04 | 中国電力株式会社 | 貯水施設運用支援システム、貯水施設運用支援方法及びプログラム |
| WO2013014799A1 (ja) * | 2011-07-28 | 2013-01-31 | 中国電力株式会社 | 水位計画評価支援装置、水位計画評価支援方法およびプログラム |
| JP5415507B2 (ja) * | 2011-10-07 | 2014-02-12 | 中国電力株式会社 | 太陽光発電出力推定装置及び太陽光発電出力推定方法 |
| TWI618016B (zh) * | 2016-07-05 | 2018-03-11 | 台灣電力股份有限公司 | 水庫水位之預測顯示系統及方法 |
Citations (3)
| Publication number | Priority date | Publication date | Assignee | Title |
|---|---|---|---|---|
| JP2005031821A (ja) * | 2003-07-09 | 2005-02-03 | Hitachi Ltd | 水力発電所運用計画作成装置,方法及びプログラム |
| JP2006039838A (ja) * | 2004-07-26 | 2006-02-09 | Mitsubishi Electric Corp | 水系の発電運用計画作成支援装置 |
| JP2008118810A (ja) * | 2006-11-07 | 2008-05-22 | Hitachi Ltd | 連接水系の運用計画作成支援システム |
Family Cites Families (3)
| Publication number | Priority date | Publication date | Assignee | Title |
|---|---|---|---|---|
| JP3693089B2 (ja) * | 1998-08-04 | 2005-09-07 | 富士電機システムズ株式会社 | ダムにおける流量予測方法 |
| TW500873B (en) * | 2000-11-10 | 2002-09-01 | Lung-Ping Huang | Marine energy power generating system using waves and tides |
| JP2005285032A (ja) * | 2004-03-31 | 2005-10-13 | Ffc Ltd | 水力発電所群の日間発電計画立案システム |
-
2009
- 2009-12-16 WO PCT/JP2009/070996 patent/WO2010071158A1/ja not_active Ceased
- 2009-12-17 JP JP2009286766A patent/JP5225256B2/ja active Active
- 2009-12-18 TW TW098143672A patent/TWI490811B/zh active
Patent Citations (3)
| Publication number | Priority date | Publication date | Assignee | Title |
|---|---|---|---|---|
| JP2005031821A (ja) * | 2003-07-09 | 2005-02-03 | Hitachi Ltd | 水力発電所運用計画作成装置,方法及びプログラム |
| JP2006039838A (ja) * | 2004-07-26 | 2006-02-09 | Mitsubishi Electric Corp | 水系の発電運用計画作成支援装置 |
| JP2008118810A (ja) * | 2006-11-07 | 2008-05-22 | Hitachi Ltd | 連接水系の運用計画作成支援システム |
Non-Patent Citations (4)
| Title |
|---|
| "Proceedings of the Annual Conference of Power & Energy Society, 2008.09", article YUKI HAYASHI: "Markov-gata DP ni Motozuku Chosuichi Un'yo Keikakuho" * |
| HIROSHI ISHIKAWA: "Chosuichi Un'yo Keikaku Shuho no Kaizen", HINSHITSU KANRI, vol. 36, no. 11 GAT, 1985, pages 1848 - 1852 * |
| KELMAN, J.: "Sampling Stchastic Dynamic Programming Applied to Reservoir Operation", WATER RESOURCES RESEARCH, vol. 26, no. 3, 1990, pages 447 - 454 * |
| RYUJI OE: "Chosuichi no Tanki Oyobi Choki Un'yo Shien System no Kaihatsu", ENERUGIA SOKEN REBYU, vol. 17, 25 September 2009 (2009-09-25), pages 20 - 23 * |
Cited By (7)
| Publication number | Priority date | Publication date | Assignee | Title |
|---|---|---|---|---|
| JP5014522B1 (ja) * | 2011-06-28 | 2012-08-29 | 中国電力株式会社 | 流入量予測装置、流入量予測方法及びプログラム |
| WO2013001600A1 (ja) * | 2011-06-28 | 2013-01-03 | 中国電力株式会社 | 流入量予測装置、流入量予測方法及びプログラム |
| US10125740B2 (en) * | 2016-01-18 | 2018-11-13 | Horacio L. Velasco | Method for operation of hydropower reservoir with a 2-parameter elevation rule curve |
| EP3405914A4 (en) * | 2016-01-18 | 2019-06-19 | Velasco, Horacio | METHOD FOR OPERATING A RESERVOIR FOR HYDROELECTRIC ENERGY WITH A 2-PARAMETER RISE RULE CURVE |
| CN112686416A (zh) * | 2019-10-17 | 2021-04-20 | 中国电力科学研究院有限公司 | 一种风电功率概率预测方法和系统 |
| JP7303960B1 (ja) | 2022-12-07 | 2023-07-06 | 中国科学院西北生態環境資源研究院 | 氷河融雪水流出量の推定方法 |
| JP2024082208A (ja) * | 2022-12-07 | 2024-06-19 | 中国科学院西北生態環境資源研究院 | 氷河融雪水流出量の推定方法 |
Also Published As
| Publication number | Publication date |
|---|---|
| TW201033930A (en) | 2010-09-16 |
| JP2010165346A (ja) | 2010-07-29 |
| JP5225256B2 (ja) | 2013-07-03 |
| TWI490811B (zh) | 2015-07-01 |
Similar Documents
| Publication | Publication Date | Title |
|---|---|---|
| JP5047260B2 (ja) | 降水量予測システム、降水量予測方法およびプログラム | |
| JP5225256B2 (ja) | 貯水施設運用支援システム、貯水施設運用支援方法およびプログラム | |
| JP5014213B2 (ja) | 貯水施設の運用支援システム、運用支援方法及びプログラム | |
| EP3333999A1 (en) | Device for predicting amount of photovoltaic power generation, and method for predicting amount of photovoltaic power generation | |
| JP2013164286A (ja) | 日射量予測方法、太陽光発電出力予測方法、及びシステム | |
| JP5415507B2 (ja) | 太陽光発電出力推定装置及び太陽光発電出力推定方法 | |
| JP5235923B2 (ja) | 貯水施設の運用支援システム、運用支援方法及びプログラム | |
| JP4969599B2 (ja) | 流入量予測システム、流入量予測方法およびプログラム | |
| JP7514148B2 (ja) | 情報処理装置、情報処理方法、情報処理システム及びコンピュータプログラム | |
| JP5279765B2 (ja) | 気温予測システム、気温予測方法およびプログラム | |
| CN112580899A (zh) | 一种融合机器学习模型的中长期风力发电预测方法及系统 | |
| WO2022168357A1 (ja) | 発電量管理システム及び発電量管理方法 | |
| Okonkwo et al. | Economic analysis of cross-breed power arrangement for Salalah region in the Al-Khareef season | |
| Rodríguez-Martinez et al. | Economic analysis and modelling of rooftop photovoltaic systems in Spain for industrial self-consumption | |
| Olivares et al. | Representing energy price variability in long-and medium-term hydropower optimization | |
| JP5425985B2 (ja) | 貯水施設の運用支援システム、運用支援方法及びプログラム | |
| JP5235922B2 (ja) | 貯水施設の運用支援システム、運用支援方法及びプログラム | |
| JP4969623B2 (ja) | 貯水施設の運用支援システム、運用支援方法及びプログラム | |
| JP2016170468A (ja) | 電力取引量決定システム、電力取引量決定方法およびプログラム | |
| KR102460279B1 (ko) | 태양광 분산 에너지 자원의 정보 제공 시스템 | |
| KR20150096099A (ko) | 미래 표준 기상 데이터 산출 장치 및 그 방법 | |
| Coburn et al. | Can synoptic drivers explain rotor‐area wind conditions and predict energy output? | |
| JP2011215672A (ja) | 情報処理装置、発電出力推定方法およびプログラム | |
| Izkara et al. | GIS-3D Platform to Help Decision Making for Energy Rehabilitation in Urban Environments | |
| CN113632131A (zh) | 电力管理装置 |
Legal Events
| Date | Code | Title | Description |
|---|---|---|---|
| 121 | Ep: the epo has been informed by wipo that ep was designated in this application |
Ref document number: 09833461 Country of ref document: EP Kind code of ref document: A1 |
|
| NENP | Non-entry into the national phase |
Ref country code: DE |
|
| 122 | Ep: pct application non-entry in european phase |
Ref document number: 09833461 Country of ref document: EP Kind code of ref document: A1 |