WO2010055915A1 - 植生生育状況解析方法、プログラムを記録した記録媒体および植生生育状況解析装置 - Google Patents
植生生育状況解析方法、プログラムを記録した記録媒体および植生生育状況解析装置 Download PDFInfo
- Publication number
- WO2010055915A1 WO2010055915A1 PCT/JP2009/069370 JP2009069370W WO2010055915A1 WO 2010055915 A1 WO2010055915 A1 WO 2010055915A1 JP 2009069370 W JP2009069370 W JP 2009069370W WO 2010055915 A1 WO2010055915 A1 WO 2010055915A1
- Authority
- WO
- WIPO (PCT)
- Prior art keywords
- radar
- backscattering coefficient
- image
- radar image
- coefficient
- Prior art date
- Legal status (The legal status is an assumption and is not a legal conclusion. Google has not performed a legal analysis and makes no representation as to the accuracy of the status listed.)
- Ceased
Links
Images


Classifications
-
- A—HUMAN NECESSITIES
- A01—AGRICULTURE; FORESTRY; ANIMAL HUSBANDRY; HUNTING; TRAPPING; FISHING
- A01G—HORTICULTURE; CULTIVATION OF VEGETABLES, FLOWERS, RICE, FRUIT, VINES, HOPS OR SEAWEED; FORESTRY; WATERING
- A01G7/00—Botany in general
-
- G—PHYSICS
- G01—MEASURING; TESTING
- G01S—RADIO DIRECTION-FINDING; RADIO NAVIGATION; DETERMINING DISTANCE OR VELOCITY BY USE OF RADIO WAVES; LOCATING OR PRESENCE-DETECTING BY USE OF THE REFLECTION OR RERADIATION OF RADIO WAVES; ANALOGOUS ARRANGEMENTS USING OTHER WAVES
- G01S13/00—Systems using the reflection or reradiation of radio waves, e.g. radar systems; Analogous systems using reflection or reradiation of waves whose nature or wavelength is irrelevant or unspecified
- G01S13/88—Radar or analogous systems specially adapted for specific applications
- G01S13/89—Radar or analogous systems specially adapted for specific applications for mapping or imaging
- G01S13/90—Radar or analogous systems specially adapted for specific applications for mapping or imaging using synthetic aperture techniques, e.g. synthetic aperture radar [SAR] techniques
- G01S13/9021—SAR image post-processing techniques
- G01S13/9027—Pattern recognition for feature extraction
-
- G—PHYSICS
- G01—MEASURING; TESTING
- G01S—RADIO DIRECTION-FINDING; RADIO NAVIGATION; DETERMINING DISTANCE OR VELOCITY BY USE OF RADIO WAVES; LOCATING OR PRESENCE-DETECTING BY USE OF THE REFLECTION OR RERADIATION OF RADIO WAVES; ANALOGOUS ARRANGEMENTS USING OTHER WAVES
- G01S7/00—Details of systems according to groups G01S13/00, G01S15/00, G01S17/00
- G01S7/02—Details of systems according to groups G01S13/00, G01S15/00, G01S17/00 of systems according to group G01S13/00
- G01S7/024—Details of systems according to groups G01S13/00, G01S15/00, G01S17/00 of systems according to group G01S13/00 using polarisation effects
-
- G—PHYSICS
- G01—MEASURING; TESTING
- G01S—RADIO DIRECTION-FINDING; RADIO NAVIGATION; DETERMINING DISTANCE OR VELOCITY BY USE OF RADIO WAVES; LOCATING OR PRESENCE-DETECTING BY USE OF THE REFLECTION OR RERADIATION OF RADIO WAVES; ANALOGOUS ARRANGEMENTS USING OTHER WAVES
- G01S7/00—Details of systems according to groups G01S13/00, G01S15/00, G01S17/00
- G01S7/02—Details of systems according to groups G01S13/00, G01S15/00, G01S17/00 of systems according to group G01S13/00
- G01S7/41—Details of systems according to groups G01S13/00, G01S15/00, G01S17/00 of systems according to group G01S13/00 using analysis of echo signal for target characterisation; Target signature; Target cross-section
- G01S7/411—Identification of targets based on measurements of radar reflectivity
- G01S7/412—Identification of targets based on measurements of radar reflectivity based on a comparison between measured values and known or stored values
-
- G—PHYSICS
- G06—COMPUTING OR CALCULATING; COUNTING
- G06T—IMAGE DATA PROCESSING OR GENERATION, IN GENERAL
- G06T7/00—Image analysis
- G06T7/0002—Inspection of images, e.g. flaw detection
- G06T7/0012—Biomedical image inspection
- G06T7/0014—Biomedical image inspection using an image reference approach
- G06T7/0016—Biomedical image inspection using an image reference approach involving temporal comparison
-
- G—PHYSICS
- G06—COMPUTING OR CALCULATING; COUNTING
- G06T—IMAGE DATA PROCESSING OR GENERATION, IN GENERAL
- G06T2207/00—Indexing scheme for image analysis or image enhancement
- G06T2207/10—Image acquisition modality
- G06T2207/10032—Satellite or aerial image; Remote sensing
- G06T2207/10044—Radar image
-
- G—PHYSICS
- G06—COMPUTING OR CALCULATING; COUNTING
- G06T—IMAGE DATA PROCESSING OR GENERATION, IN GENERAL
- G06T2207/00—Indexing scheme for image analysis or image enhancement
- G06T2207/30—Subject of image; Context of image processing
- G06T2207/30181—Earth observation
- G06T2207/30188—Vegetation; Agriculture
Definitions
- the present invention is mounted on a flying object such as an artificial satellite, and uses radar image data obtained by a radar device that captures a wide range of the ground surface of an imaging target area and obtains the surface condition, to determine the growth status of vegetation.
- the present invention relates to a vegetation growth situation analysis method suitable for analysis, a recording medium recording a program for executing the processing, and a vegetation growth situation analysis apparatus.
- Synthetic Aperture Radar can capture a wide area, day or night, regardless of the weather, using the characteristics of microwaves.
- the conventional synthetic aperture radar has a problem in resolution (definition) compared to optical remote sensing, but the latest satellite-mounted synthetic aperture radar has a resolution of 1 m or less, and has a high resolution. Images are becoming available.
- Non-Patent Document 1 Japanese Patent Document 1
- Non-Patent Document 2 The applicant of this application has also published research results on the growth of paddy rice using multi-period SAR images (see Non-Patent Document 2). As a result of research described in Non-Patent Document 2, analysis results as shown in FIGS. 1 to 3 were obtained.
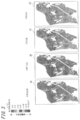
- FIG. 1 shows an example of radar images for a plurality of periods, and shows growth and reflection characteristics for each observation day, the state of paddy fields, paddy rice coverage, and radar images.
- a radar image is taken using the C band of RADARSAT. Radar images 1A, 1B, 1C, and 1D for four periods of May 22, June 15, July 9, and August 2 were created, and the overall growth of rice was changed from these radar images. You can see what you are doing.
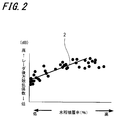
- Fig. 2 shows the relationship between the paddy rice coverage and the radar backscattering coefficient (the backward component of the scattering intensity of the object with respect to the microwave transmitted from the radar device), and the horizontal axis represents the paddy rice coverage. (%), The vertical axis represents the radar backscatter coefficient (dB).
- a regression line 2 representing the relationship between the paddy rice coverage and the radar backscattering coefficient is obtained. can get.
- Fig. 3 shows the distribution of radar backscattering coefficients for each field in each period.
- Zengyuan Li Guoqing Sun, Mike Wooding, Yong Pang, Y gardeningDong, Erxue Chen and BingxiangTan, “Rice Monitoring Using EnvisatAsar Data in China”, Proc. Of the 2004, Envisatzpos (572, April 2005) Kazuyoshi Takahashi, Hiroaki Abe, Atsushi Rikimaru, Yukio Mukai, “Understanding the distribution of rice growth using time-series RADARSAT data”, Japan Photogrammetric Society, Annual Scientific Lecture, Tokyo International Exhibition Center (Tokyo), June 17, 2004. 18th
- Non-Patent Document 1 describes the research content of paddy rice monitoring using multi-time SAR images, but the relationship between the backscatter coefficient of SAR images and vegetation is not clear.
- Non-Patent Document 2 revealed the correlation between the backscatter coefficient of the satellite SAR data and the growth status.
- the backscattering coefficient is affected by atmospheric conditions and system fluctuations at the time of shooting, calibration of the backscattering coefficient of SAR images taken at different times is necessary. It did not accurately represent the situation.
- the present invention has been made in view of such a situation, and makes it possible to accurately analyze the growth situation of vegetation over many periods using a radar image obtained from a flying object such as an artificial satellite. is there.
- a vegetation growth situation analysis method and a recording medium recording a program acquire a radar image of the ground surface of the same target area, which is taken at a plurality of times by a radar device mounted on a flying object,
- the acquired radar images are stored in a map database.
- the radar image taken at another time is aligned, and then a backscattering coefficient of a specific region of the radar image is extracted.
- the backscattering coefficient of another radar image is calibrated based on the backscattering coefficient of the specific region of the reference image.
- the growth value of the vegetation reflected in the radar image is calculated from the backscattering coefficient of the calibrated radar image. It is characterized by including a function.
- the vegetation growth situation analysis method apparatus includes an acquisition unit that acquires a radar image of a ground surface of the same target area, which is captured at a plurality of times by a radar device mounted on a flying object, and the acquisition unit
- a radar image holding unit that stores a plurality of radar images acquired in the map database, and a positioning process that aligns radar images taken at other times using a radar image taken at a predetermined time as a reference image
- a backscattering coefficient processing unit that extracts a backscattering coefficient of a specific region of the radar image, and a backscattering coefficient of the specific region of the reference image among a plurality of radar images stored in the map database.
- a calibration unit that calibrates the backscatter coefficient of another radar image, and a radar calibrated by the calibration unit based on the correlation between the backscatter coefficient of the radar image and the growth value of the vegetation Characterized in that the backscattering coefficient of the image and a growth value calculation unit for calculating a growth value of vegetation caught on the radar image.
- the backscattering coefficient of the radar image at each time is calibrated based on the backscattering coefficient of the radar image at a predetermined time. And since the radar image of each period is corrected based on the backscattering coefficient after calibration, a growth value indicating an accurate growth state of a plant such as a crop at each period can be calculated.
- A is a radar image after correction
- B is a diagram (August 11) showing a calibration line.
- A is a radar image after correction
- B is a diagram (August 11) showing a calibration line.
- A is a radar image after correction
- B is a diagram (August 11) showing a calibration line.
- A is a radar image after correction
- B is a diagram (August 11) showing a calibration line.
- A is a radar image after correction
- B is a diagram (August 11) showing a calibration line.
- It is a block diagram which shows the example of an internal structure of a personal computer.
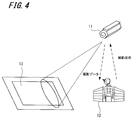
- FIG. 4 shows an outline of a system to which the vegetation growth state analyzing apparatus of the present invention is applied.
- a synthetic aperture radar SAR
- the ground surface is photographed (based on an instruction from the data analysis center 12) by the synthetic aperture radar.
- the synthetic aperture radar mounted on the artificial satellite is referred to as “satellite SAR”.
- the satellite SAR 11 mounted on the artificial satellite images the field 13 on the ground surface periodically or according to an instruction from the data analysis center 12 while orbiting a predetermined orbit, and analyzes the image data (radar image data). Transmit to the center 12.
- image data radar image data
- the data analysis center 12 performs an imaging plan along the growth calendar, transmits a radio signal including an imaging instruction based on the imaging plan to the satellite SAR11, and also transmits radar image data captured by the satellite SAR11 via an antenna. Receive.
- a synthetic aperture process and a predetermined correction are performed by a vegetation growth state analyzing apparatus 20 described later, and a corrected multi-time reproduction image and a radar backscatter coefficient (also simply referred to as “backscatter coefficient”). Generate a distribution map etc.
- the present invention calibrates the backscattering coefficient values of time-series images with reference to images acquired at the beginning or at a predetermined time. By calibrating the backscattering coefficient value, it is possible to realize a more practical paddy rice growth prediction system that takes into account the influence of fluctuations depending on the photographing time.
- the following three methods can be considered as the time series image calibration method.
- (1) A method of setting a reference reflector (for example, a corner reflector) in a target area, extracting a backscattering coefficient value of the reflector from a photographed SAR image, and using this as a reference value (2) photographed SAR
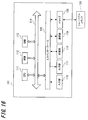
- FIG. 5 shows a functional block diagram according to one embodiment of the vegetation growth situation analyzing apparatus of the present invention.
- the vegetation growth state analyzing apparatus calibrates the backscattering coefficient value of the time-series image and generates data for predicting the vegetation growth state.
- this vegetation growth state analysis apparatus is assumed to be installed in the data analysis center 12, it may be mounted on an artificial satellite together with the satellite SAR11, or may be distributed to each.
- each function of the vegetation growth situation analysis apparatus can be realized by either hardware or software. Or you may implement
- the vegetation growth state analyzing apparatus 20 of the present embodiment mainly includes an I / F unit 21, an imaging determination unit 22, a radar image holding unit 24, an alignment processing unit 25, a backscattering coefficient processing unit 27 for a reference reflector, and a rear side.
- a scattering coefficient determination processing unit 28 and a feature backscattering coefficient processing unit 29 are provided.
- the backscattering coefficient holding unit 30, the calibration backscattering coefficient calculating unit 31, the calibration line calculating unit 32, the backscattering coefficient calibration unit 33 using the calibration line, the growth value calculating unit 34, the field aggregation calculating unit 36, and the output unit 38 are provided. Prepare.
- growth calendar DB a growth calendar database
- imaging plan DB an imaging plan database
- map DB a map database
- a database hereinafter referred to as “growth model DB” 35 and a field map database (hereinafter referred to as “field map DB”) 37 are provided.
- the I / F unit 21 is an example of an acquisition unit, and has a function as a so-called interface that captures image data captured by the satellite SAR11.
- the I / F unit 21 also has a function as a communication unit, and can transmit an instruction from the imaging determination unit 22 to the satellite SAR11 to cause the satellite SAR11 to perform imaging.
- the photographing data is data of radar images that are photographed systematically based on the growing calendar of paddy rice registered in the growing calendar DB 23A and the photographing time (cycle) of the satellite registered in the photographing plan DB 23B.
- the growing calendar is a cultivation calendar starting from the rice planting period in May, the dividing period, the highest dividing period, the ear formation period, the heading period, the ripening period, and the maturity period in September.
- artificial satellites equipped with a synthetic aperture radar that are currently launched include those with an observation period of 11 days.
- the imaging determination unit 22 determines the time when the radar image is taken into the I / F unit 21 in consideration of the growth calendar and the imaging cycle of the satellite.
- An example of the determined scheduled shooting date (data acquisition date) is shown below.
- [Observation date] [Calculation date] [Stage] 1) May 7th 0th Rice transplanting period 2) May 31st 24th Divided period 3) June 24th 38th Best divided period 4) July 18th 72nd Young panicle formation period 5) August 11th 96th Heading period 6) September 4th 120th Ripening period
- the photographing determination unit 22 may set the pixel size of the photographed image according to the target area for evaluating the growth of paddy rice. For example, when performing a detailed evaluation, it is preferable to increase the ground resolution (for example, 1 m).
- the radar image holding unit 24 has a function of saving, in the map DB 26, time-series radar images taken at a predetermined time.
- the map DB 26 is constructed in a nonvolatile storage means such as a hard disk or a flash memory.
- the alignment processing unit 25 is a function that performs geometric (position) processing so that the radar image can be superimposed on the map based on the map data stored in the map DB 26.
- the radar image after alignment is supplied to the backscattering coefficient calibration unit 33 using the calibration line, the backscattering coefficient processing unit 27 for the reference reflector, and the backscattering coefficient processing unit 29 for the feature.
- the backscattering coefficient processing unit 27 of the reference reflector has a function of processing (extracting) the backscattering coefficient of the reference reflector shown in the radar image.
- this reference reflector for example, “Yuta Kamikawa, Kazuo Ouchi,“ Calibration / Verification Experiment of Synthetic Aperture Radar PALSAR Mounted on Land Observing Satellite “Daichi” ”, 2006 Graduation Thesis, Faculty of Engineering, Kochi University of Technology”
- Various reflectors such as the corner reflector described in 1) can be applied.
- the reflector When a reflector is used in the observation area, the backscattering coefficient values of the reflectors at two periods are extracted, and a calibration line for performing calibration based on the backscattering coefficient value of the reference image is obtained. Calibrate images taken at other times.
- the reflector has an appropriate area, shape, number, and direction as appropriate depending on the microwave band (wavelength) irradiated on the ground surface and the orbit of the satellite (imaging direction). It is desirable to adjust and install.
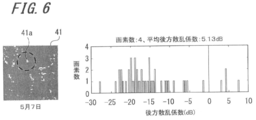
- FIG. 6 shows the measurement result of the radar image and the average backscattering coefficient when a corner reflector is installed as a reflector in an arbitrary observation target area.
- the left side of the figure is a radar image, and the right side is a graph showing a histogram (frequency distribution) of backscattering coefficients.
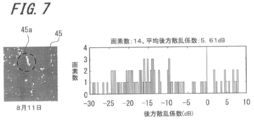
- the corner reflector 45a shown in the radar image 45 on the observation date August 11 shown in FIG. 7 has 14 pixels and an average backscattering coefficient of 5.61 dB.
- the backscattering coefficient discrimination processing unit 28 has a function of determining whether or not the backscattering coefficient processed by the backscattering coefficient processing unit 27 of the reference reflector can be used.
- the backscattering coefficient is saturated, that is, a radar image.
- no use is made. This is because when the backscattering coefficient is saturated, accurate information on the backscattering coefficient cannot be obtained, so that accurate calibration cannot be performed.
- the feature backscattering coefficient processing unit 29 has a function of extracting a backscattering coefficient of a feature (artificial structure, pond, ground, etc.) reflected in the radar image. Based on the processed backscattering coefficient, a low fluctuation region in the radar image is determined. Or the feature which shows the characteristic of a low fluctuation area may be specified beforehand from past data, and this may be used.
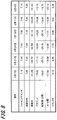
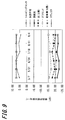
- FIG. 8 and FIG. 9 show examples of radar backscattering coefficient [dB] observed at multiple points and multiple times and changes with time. 8 and 9 are obtained by applying a median filter described later as a smoothing process to the observation result.
- FIG. 8 shopping centers, temporary housing, adjustment ponds, grounds, parking lots (parks), ponds (parks), and seven corner reflectors are taken as feature areas, and May 7 and May 31, Data obtained on June 24, July 18, August 11, and September 4 are shown. Each data is an average value of each pixel constituting the feature region.
- FIG. 9 is a graph showing the data shown in FIG. 8 as the time-dependent change of the radar backscatter coefficient in the characteristic region.
- a shopping center or a temporary house with a small change and a large radar backscattering coefficient can be cited as a candidate for a low fluctuation region that is a reference for calibrating the backscattering coefficient of a radar image. It is also possible to list adjustment ponds with little change and a small radar backscattering coefficient as candidates for the low fluctuation region.
- a radar image at the first or predetermined time in which these low fluctuation regions are reflected is used as a reference image at the time of calibration.
- the backscattering coefficient holding unit 30 has a function of storing the backscattering coefficients of the reference reflector and the feature extracted from the radar image.
- the calibration backscattering coefficient calculation unit 31 is a function of performing a smoothing process and / or a local minimum value process on the backscattering coefficient stored in the backscattering coefficient holding unit 30 to obtain a calibration backscattering coefficient, A backscattering coefficient smoothing processing unit 31A and a backscattering coefficient local minimum value calculation unit 31B are provided.
- the backscattering coefficient smoothing processing unit 31A has a function of reducing a noise component such as speckle noise by applying a predetermined smoothing filter, for example, a median filter, to the radar image.
- the median filter is a filter that performs processing in which values in a local region of k ⁇ k are arranged in order and the middle value is used as an output value of a pixel at the center of the region, and the processing can be expressed by Expression (1).
- y [m, n] median ⁇ x [i, j], (i, j) ⁇ (1)
- y [m, n] is the value of the target pixel
- x [i, j] is the value of the neighboring pixel centered on the target pixel
- the backscattering coefficient local minimum value calculation unit 31B has a function of applying a predetermined local minimum value processing filter (hereinafter referred to as “minimum value filter”) to the radar image and extracting a minimum value of a predetermined region.
- the minimum value filter is a filter that performs processing that uses the minimum value in the local area of k ⁇ k as the output value of the pixel at the center of the region, and the processing can be expressed by Expression (2).
- y [m, n] min ⁇ x [i, j], (i, j) ⁇ (2)
- y [m, n] is the value of the target pixel and x [i, j] is the value of the neighboring pixel centered on the target pixel
- the backscattering coefficient smoothing processing unit 31A and the backscattering coefficient local minimum value calculating unit 31B are for reducing the noise component generated in the radar image and extracting the minimum value of the predetermined region, respectively. Without these functional blocks, it is assumed that the image quality of the radar image will deteriorate and the accuracy of calibration will decrease, but this is not always necessary as long as the acquired radar image meets the required specifications, and either It is also possible to use only one or reverse the processing order.
- the calibration line calculation unit 32 is used to calibrate the first image in order to calibrate sequentially captured images (second image, third image,...) With respect to the first captured image (first image). This is a function for calculating a relational expression (calibration line) with the backscattering coefficient for calibration of the second image based on the backscattering coefficient.
- the calibration line calculation unit 32 and the backscattering coefficient calibration unit 33 using the following calibration line constitute the calibration means described in the claims.
- the backscattering coefficient calibration unit 33 based on the calibration line is an example of a backscattering coefficient calibration unit, and an image other than the reference image, for example, the second image and the third image, using the calibration line calculated by the calibration line calculation unit 32. Is a function for processing the backscattering coefficient of all the pixels.
- the growth value calculation unit 34 is obtained by the backscattering coefficient calibration unit 33 using the calibration line based on the information of the growth model (correlation between the backscattering coefficient of the radar image and the paddy rice coverage) stored in the growth model DB 35. This is a function to calculate the rice paddy coverage from the backscattering coefficient.
- the field aggregation calculation unit 36 is a function for calculating the paddy rice coverage in a single stroke unit based on the field map data stored in the field map DB 37, and includes a field representative value calculation unit 36A, a field representative value difference calculation unit 36B, A growth determination unit 36C is provided.
- the field representative value calculation unit 36A is a function for obtaining an average value per stroke or a value having the highest appearance frequency (mode) from the paddy rice coverage of each pixel constituting one radar image.
- the field representative value difference calculation unit 36B is a function that calculates the difference between the field representative value of the reference image (for example, the first image) and the field representative value of the reference image (for example, the second image).
- the growth determination unit 36C has a function of performing growth determination (fast growth and slow growth) from the field representative value and the value of the field representative value difference.
- the output unit 38 is a function for outputting the field representative value of the paddy rice coverage, the value of the field representative value difference, and the result of the growth determination to a list of field units or a ranked map (ranking map). .
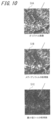
- FIG. 10 and 11 are diagrams for explaining the effect of correcting the backscattering coefficient.
- FIG. 10 shows the case of a certain shopping center parking lot on August 11, and
- FIG. 11 shows the case of a certain adjustment pond on August 11.
- the image 51B is an image after the median filter is applied to the original image (image before correction) 51A
- the image 51C is an image obtained by performing the minimum value filter on the image 51B after the median filter is executed.
- the original image 51A has a lot of noise, after the median filtering process and the minimum value filtering process, the noise is removed and the pixel at the center of the area is replaced with the surrounding minimum value.
- the backscattering coefficient for calibration can be stably obtained in a region where the backscattering coefficient itself is large and its fluctuation is small, as in a shopping center parking lot (see arrow).
- FIG. 11 shows an example of the adjustment pond.
- An image 52B is an image after the median filter is applied to the original image (image before correction) 52A
- an image 52C is an image 52B after the median filter is executed. It is the image which implemented the minimum value filter.
- the backscattering coefficient for calibration can be stably increased even in a region such as the adjustment pond where the backscattering coefficient itself is small and its fluctuation is small. (See arrow).
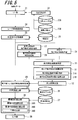
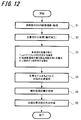
- the alignment processing unit 25 uses the first captured radar image stored in the map DB 26 as a reference image, and the alignment is performed so that the radar images (the same target area) captured at the next or other time overlap. Performed (step S2).
- the ground reference point GCP: Ground ⁇ Control Point
- the alignment process for example, the ground reference point (GCP: Ground ⁇ Control Point) with a clear latitude and longitude, road intersections, buildings, and other points that appear in the image can be used as a reference so that they can be superimposed on the map. Correction is performed.
- backscattering coefficient processing and calibration of the multi-time radar image are performed according to each case (step S3).
- the backscattering coefficient processing unit 27 of the reference reflector extracts the backscattering coefficient values of the corner reflectors that appear in the radar images at a plurality of times, and obtains a calibration line based on the backscattering coefficient values of the reference image. Based on the calibration line, the backscattering coefficient value of the radar image taken at the next time or other time is processed. At this time, the backscattering coefficient determination processing unit 28 determines whether the backscattering coefficient processed by the backscattering coefficient processing unit 27 of the reference reflector can be used, and does not use it when the value of the backscattering coefficient is saturated. .
- the backscattering coefficient value processed by the backscattering coefficient processing unit 27 of the reference reflector is supplied to the backscattering coefficient holding unit 30 in association with the imaging time of the radar image. To do.
- the information on the backscattering coefficient stored in the backscattering coefficient holding unit 30 is filtered by the backscattering coefficient smoothing processing unit 32A and the backscattering coefficient local minimum value calculating unit 32B of the calibration backscattering coefficient calculating unit 31, respectively.
- the noise component is reduced and the backscattering coefficient value in a representative region on the radar image is obtained, and then supplied to the calibration line calculation unit 32.
- the calibration line calculation unit 32 the backscattering coefficient of the low fluctuation region (a plurality of pixels in the reference image) and the specific region (a plurality of pixels in the other radar image corresponding to the low fluctuation region of the reference image).
- a calibration line is calculated from the backscattering coefficient.
- the information on the calibration line is supplied to the calibration unit 33 for the backscattering coefficient calibration unit 33, and the backscattering coefficient of the other radar image is calibrated based on the calibration line.
- Such a calibration process is performed on multi-period radar images.
- the backscattering coefficient of the low fluctuation region in the radar image is used.
- the backscattering coefficient value serving as a calibration reference is extracted from the acquired radar image.
- the feature backscattering coefficient processing unit 29 calculates a backscattering coefficient value of the feature shown in the radar image, and an image region (for example, an artificial structure) having a large backscattering coefficient and a small fluctuation thereof, and the rear An image region (for example, a pond or a soil ground) having a low scattering coefficient and a small fluctuation is extracted.
- These backscattering coefficient values in the image area where the fluctuation of the backscattering coefficient is small are supplied to the backscattering coefficient holding unit 30 in association with the imaging time of the radar image.
- the calibration line calculation unit 32 obtains the backscattering coefficient of the reference reflector reflected in the radar image, and corresponds to the backscattering coefficient of the reference reflector (a plurality of pixels) reflected in the reference image and the reference reflector reflected in the reference image.
- a calibration line is calculated from the backscattering coefficient of the reference reflector (a plurality of pixels thereof) reflected in another radar image.
- the information on the calibration line is supplied to the calibration unit 33 for the backscattering coefficient calibration unit 33, and the backscattering coefficient of the other radar image is calibrated based on the calibration line.
- Such a calibration process is performed on multi-period radar images.
- a reference reflector such as a corner reflector of the first item and a low fluctuation region in the radar image of the second item are used in combination.
- the calibration line calculation unit 32 in accordance with the situation of the image area where the fluctuation of the backscattering coefficient is small in the reference image, the data of the backscattering coefficient of the low fluctuation area on the radar image in the second item and the first item A calibration line is calculated by selectively using data acquired using a reference reflector such as a corner reflector.
- the backscattering coefficient of the region and the backscattering of the reference reflector reflected in another radar image corresponding to the reference reflector reflected in the reference image If the low-fluctuation region is an artificial structure or the like using the coefficient, calibration is performed using the backscattering coefficient of that region and the backscattering coefficient of a specific region of another radar image corresponding to the artificial structure or the like of the reference image. A line is calculated. The information on the calibration line is supplied to the calibration unit 33 for the backscattering coefficient calibration unit 33, and the backscattering coefficient of the other radar image is calibrated based on the calibration line. Such a calibration process is performed on multi-period radar images.
- step S4 The analysis of the growth situation of paddy rice is calculated from the radar image that has been calibrated based on the backscattering coefficient value and the growth information model that are grasped in advance. That is, based on the information on the correlation between the backscattering coefficient of the radar image and the growth value of the vegetation stored in the growth model DB 35, it is reflected in each pixel of the radar image from the backscattering coefficient of the calibrated radar image. The vegetation growth value is calculated.
- the field aggregation calculation unit 36 performs an aggregation process of the analysis results (step S5). For example, when the field representative value calculation unit 36A obtains an average value or mode value in units of one stroke from the paddy rice coverage of each pixel constituting one radar image from the above analysis result, the growth for each field I can understand the situation. Further, when the difference between the field representative value of the reference image (for example, the first image) and the field representative value of the reference image (for example, the second image) is obtained by the field representative value difference calculating unit 36B, between the two periods. Can understand the difference in growth between fields. Furthermore, when the growth determination unit 36C performs the growth determination based on the field representative value and the value of the field representative value difference, it is possible to grasp the difference between the early and late growth between the fields.
- a rice growth situation distribution is created by the output unit 38 (step S6). That is, processing is performed to output the field representative value of the paddy rice coverage, the value of the field representative value difference, and the result of the growth determination to a list of field units or a ranked map (ranking map). These maps showing the rice growth situation distribution are called rice growth situation distribution maps.
- the paddy rice growth situation distribution map is tailored to the actual situation of each user by performing the aggregation process of information for each unit that provides guidance for farming, such as pixel units, field units, and units that subdivide the field. Can provide farming guidance.
- field shape data for example, geographic information data is used.
- the geographic information data of the target area is stored in the map DB 26 or the like.
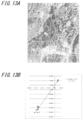
- FIG. 13 shows the result of calibration (step S3 in FIG. 12) of data acquired on August 11 based on a radar image at a predetermined time (May 7 in this example).
- FIG. 13A is a radar image after calibration of the target time
- FIG. 13B is a diagram showing calibration lines used for calibration of the radar image shown in FIG. 13A.
- the graph is created based on the first imaging time (May 7) at which the backscattering coefficient is minimum, but August 11th is the time when the backscattering coefficient is maximum as described later. It is also possible to standardize on a day basis.
- FIG. 13B is a calibration line based on the May 7 radar image used to calibrate the August 11 data.
- the vertical axis represents the May 7 backscattering coefficient
- the horizontal axis represents the August 11 backscattering coefficient.
- the calibration line (regression line) is expressed by the following equation.
- y backscattering coefficient of the reference image (May 7)
- x backscatter coefficient of the image (August 11) to calibrate
- R 2 is the coefficient of determination.
- the data shown in FIG. 13B is data after applying the minimum value filter.
- y 0.984x-0.137
- R 2 0.972
- the backscattering coefficient of the radar image acquired at each time is calibrated by the calibration line of each time created based on the backscattering coefficient of the radar image at a predetermined time ( May 7 in this example). .
- the backscattering coefficient of the radar image is calibrated, it is possible to calculate a growth value indicating an accurate growth state of paddy rice (plants such as agricultural crops) at each time.
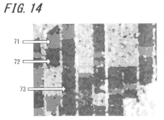
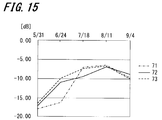
- FIG. 14 shows the distribution of the radar backscattering coefficient for a certain field (paddy rice field), and is an enlarged view of the main part of the radar backscattering coefficient distribution map of the entire target area including a plurality of fields.
- the enlarged radar backscatter coefficient distribution map includes fields 71 to 73. In this way, it is possible to finely confirm the growth status of the crop corresponding to an arbitrary region of the radar image in units of pixels.
- FIG. 15 is a graph showing the change over time of the average backscattering coefficient corresponding to the radar backscattering coefficient distribution map of the paddy rice field shown in FIG.
- the average backscatter coefficient is obtained by calculating an average value of backscatter coefficients obtained from a plurality of pixels constituting a certain area in the radar image.
- the paddy rice in the fields 71 to 73 has a large backscattering coefficient and a small backscattering coefficient with August 11 as a maximum point. This is presumed to be the result of reduced backscattering by heading and rice drooping. From the graph of FIG. 15, it can be understood that, for example, paddy rice in the field 73 is early-ripened, and paddy rice in the field 71 is late-ripening.
- the objects of observation of the present invention include not only paddy rice but also crops and plants whose backscattering coefficient changes according to the morphological change accompanying the growth stage of corn, barley, etc., and correction of ground surface vegetation using a reference image
- the radar images of a plurality of periods and the radar backscatter coefficient distribution map (vegetation growth situation distribution map) created from the corrected radar image the growth situation of the vegetation can be accurately grasped in real time.
- the calibration line of the radar image at each time is calculated with reference to the backscattering coefficient of the radar image at the predetermined time, and the radar image acquired at each time by the calculated calibration line at each time. Are calibrated. And since the radar image of each period is corrected based on the backscattering coefficient after calibration, it is possible to know the exact growth state of plants such as agricultural crops at each period.
- a series of processes performed by the vegetation growth state analyzing apparatus described above can be executed by hardware or can be executed by software. Needless to say, the function for executing these processes can also be realized by a combination of hardware and software.
- a series of processing is executed by software, it is possible to execute various functions by installing a computer in which a program constituting the software is incorporated in dedicated hardware, or by installing various programs. For example, it is installed from a program recording medium in a general-purpose computer or the like.
- FIG. 16 is a block diagram illustrating a configuration example of a computer that executes the above-described series of processing by a program.
- the computer 101 may be, for example, a personal computer having a certain performance in addition to a dedicated computer with high performance for executing a series of processes.
- a CPU (Central Processing Unit) 111 of the computer 101 executes various processes in addition to the series of processes described above according to a program recorded in a ROM (Read Only Memory) 112 or a recording unit 118.
- a RAM (Random Access Memory) 113 appropriately stores programs executed by the CPU 111 and data.
- the CPU 111, the ROM 112, and the RAM 113 are connected to each other by a bus 114.
- the CPU 111 is also connected with an input / output interface 115 via the bus 114.
- the input / output interface 115 is connected to an input unit 116 including a keyboard, a mouse, and a microphone, and an output unit 117 including a display and a speaker.
- the CPU 111 executes various processes in response to commands input from the input unit 116. Then, the CPU 111 outputs the processing result to the output unit 117.
- the recording unit 118 connected to the input / output interface 115 includes, for example, a hard disk, and records programs executed by the CPU 111 and various data.
- the communication unit 119 communicates with an external device via a network such as the Internet or a local area network.
- a program may be acquired via the communication unit 119 and recorded in the recording unit 118.
- the drive 120 connected to the input / output interface 115 drives a removable medium 131 such as a magnetic disk, an optical disk, a magneto-optical disk, or a semiconductor memory, and drives programs and data recorded there. Get etc. The acquired program and data are transferred to the recording unit 118 and recorded as necessary.
- a program recording medium that stores a program that is installed in a computer and can be executed by the computer is provided as a package medium by a removable medium 131 as shown in FIG.
- a removable medium 131 a magnetic disk (including a flexible disk), an optical disk (including a CD-ROM (compact disc-read-only memory), a DVD (digital versatile disc), a magneto-optical disc), or a semiconductor memory is applied.
- the program recording medium includes a ROM 112 that stores (records) a program temporarily or permanently, a hard disk that forms the recording unit 118, and the like.
- the program is stored in the program recording medium via a communication unit 119 which is an interface such as a router or a modem, as necessary, such as a local area network (LAN), the Internet, or digital satellite broadcasting. This is performed using a wireless communication medium.
- a communication unit 119 is an interface such as a router or a modem, as necessary, such as a local area network (LAN), the Internet, or digital satellite broadcasting. This is performed using a wireless communication medium.
- processing steps describing the program stored in the program recording medium are not limited to the processing performed in time series in the described order, but are not necessarily performed in time series. This includes processing that is executed manually or individually (for example, parallel processing or object processing).
- the program may be processed by a single computer, or may be processed in a distributed manner by a plurality of computers. Furthermore, the program may be transferred to a remote computer and executed.
- SYMBOLS 20 Vegetation growth condition analysis apparatus, 21 ... I / F part, 22 ... Shooting determination part, 23A ... Growth calendar DB, 23B ... Shooting plan DB, 24 ... Radar image holding part, 25 ... Position alignment processing part, 26 ... Map DB, 27... Backscattering coefficient processing unit of reference reflector, 28... Backscattering coefficient discrimination processing unit, 29 .. Backscattering coefficient processing unit of feature, 30... Backscattering coefficient holding unit, 31. Calculation unit, 31A ... backscattering coefficient smoothing processing unit, 31B ... backscattering coefficient local minimum value calculation unit, 32 ... calibration line calculation unit, 33 ...
Landscapes
- Engineering & Computer Science (AREA)
- Remote Sensing (AREA)
- Radar, Positioning & Navigation (AREA)
- Physics & Mathematics (AREA)
- General Physics & Mathematics (AREA)
- Computer Networks & Wireless Communication (AREA)
- Life Sciences & Earth Sciences (AREA)
- Computer Vision & Pattern Recognition (AREA)
- Quality & Reliability (AREA)
- Nuclear Medicine, Radiotherapy & Molecular Imaging (AREA)
- Theoretical Computer Science (AREA)
- Radiology & Medical Imaging (AREA)
- Biodiversity & Conservation Biology (AREA)
- Botany (AREA)
- Ecology (AREA)
- Forests & Forestry (AREA)
- Environmental Sciences (AREA)
- Health & Medical Sciences (AREA)
- Medical Informatics (AREA)
- General Health & Medical Sciences (AREA)
- Artificial Intelligence (AREA)
- Electromagnetism (AREA)
- Image Processing (AREA)
- Radar Systems Or Details Thereof (AREA)
- Image Analysis (AREA)
Priority Applications (3)
| Application Number | Priority Date | Filing Date | Title |
|---|---|---|---|
| US13/129,245 US8478003B2 (en) | 2008-11-14 | 2009-11-13 | Vegetation growth condition analysis method, recording medium on which program is recorded, and vegetation growth condition analyzer |
| EP09826161.3A EP2351477B1 (en) | 2008-11-14 | 2009-11-13 | Vegetation growth condition analysis method, recording medium on which program is recorded, and vegetation growth condition analyzer |
| CN2009801457435A CN102215666B (zh) | 2008-11-14 | 2009-11-13 | 植被生长状况分析方法、记录有程序的记录介质和植被生长状况分析器 |
Applications Claiming Priority (2)
| Application Number | Priority Date | Filing Date | Title |
|---|---|---|---|
| JP2008292705A JP5369282B2 (ja) | 2008-11-14 | 2008-11-14 | 植生生育状況解析方法、プログラムおよび植生生育状況解析装置 |
| JP2008-292705 | 2008-11-14 |
Publications (1)
| Publication Number | Publication Date |
|---|---|
| WO2010055915A1 true WO2010055915A1 (ja) | 2010-05-20 |
Family
ID=42170045
Family Applications (1)
| Application Number | Title | Priority Date | Filing Date |
|---|---|---|---|
| PCT/JP2009/069370 Ceased WO2010055915A1 (ja) | 2008-11-14 | 2009-11-13 | 植生生育状況解析方法、プログラムを記録した記録媒体および植生生育状況解析装置 |
Country Status (5)
| Country | Link |
|---|---|
| US (1) | US8478003B2 (enExample) |
| EP (1) | EP2351477B1 (enExample) |
| JP (1) | JP5369282B2 (enExample) |
| CN (1) | CN102215666B (enExample) |
| WO (1) | WO2010055915A1 (enExample) |
Cited By (6)
| Publication number | Priority date | Publication date | Assignee | Title |
|---|---|---|---|---|
| US20190179009A1 (en) * | 2017-12-08 | 2019-06-13 | International Business Machines Corporation | Crop classification and growth tracking with synthetic aperture radar |
| US10761185B2 (en) | 2015-02-18 | 2020-09-01 | Nec Corporation | Signal processing device, signal processing method, recording medium, target detection device, and target detection method |
| CN111860325A (zh) * | 2020-07-20 | 2020-10-30 | 河南大学 | 土壤水分反演方法、装置、计算机可读介质和电子设备 |
| CN113505635A (zh) * | 2021-05-24 | 2021-10-15 | 中国农业大学 | 基于光学和雷达的冬小麦与大蒜混种区识别方法及装置 |
| CN114332492A (zh) * | 2021-12-15 | 2022-04-12 | 南京林业大学 | 一种基于长时间序列的植被特征提取及选择方法 |
| WO2025074762A1 (ja) * | 2023-10-03 | 2025-04-10 | 井関農機株式会社 | 作業車両 |
Families Citing this family (27)
| Publication number | Priority date | Publication date | Assignee | Title |
|---|---|---|---|---|
| AU2010278785A1 (en) * | 2009-07-31 | 2012-03-22 | Global Surface Intelligence Ltd. | Greenhouse gas grid and tracking system |
| US8493262B2 (en) * | 2011-02-11 | 2013-07-23 | Mitsubishi Electric Research Laboratories, Inc. | Synthetic aperture radar image formation system and method |
| JP5771430B2 (ja) * | 2011-04-08 | 2015-08-26 | オリンパス株式会社 | 霞除去画像処理装置、霞除去画像処理方法及び霞除去画像処理プログラム |
| JP5795932B2 (ja) * | 2011-10-07 | 2015-10-14 | 株式会社日立製作所 | 土地状態推定方法 |
| CN111815470B (zh) * | 2012-07-04 | 2024-11-19 | 索尼公司 | 农事支持装置、方法和系统及记录介质 |
| JP5904044B2 (ja) * | 2012-07-18 | 2016-04-13 | 富士通株式会社 | 農作物の状態変化日特定方法、装置及びプログラム |
| JP5935654B2 (ja) * | 2012-10-22 | 2016-06-15 | 富士通株式会社 | 作物推定方法,作物推定プログラムおよび作物推定装置 |
| JP6292772B2 (ja) * | 2013-06-05 | 2018-03-14 | 三菱電機株式会社 | レーダ画像処理装置及びレーダ画像処理方法 |
| CN103679202B (zh) * | 2013-12-17 | 2017-04-12 | 中国测绘科学研究院 | 一种适用于光学遥感卫星影像植被分类方法及装置 |
| JP6314101B2 (ja) * | 2015-02-26 | 2018-04-18 | 株式会社パスコ | 地上設置型合成開口レーダーを用いた植生域に対応した地盤変位計測方法 |
| FR3035722B1 (fr) * | 2015-04-30 | 2020-05-15 | Ovalie Innovation | Systeme et procede d'estimation du rendement d'une parcelle cultivee |
| US10664750B2 (en) | 2016-08-10 | 2020-05-26 | Google Llc | Deep machine learning to predict and prevent adverse conditions at structural assets |
| CN106331493B (zh) * | 2016-08-30 | 2020-04-10 | 深圳春沐源控股有限公司 | 一种种植相册生成方法及装置 |
| WO2019003400A1 (ja) | 2017-06-29 | 2019-01-03 | 日本電気株式会社 | 係数算出装置、係数算出方法、及び、係数算出プログラムが記録された記録媒体 |
| EP3707990B1 (en) | 2017-12-01 | 2021-07-14 | Sony Corporation | Information processing device, information processing method, and vegetation management system |
| WO2019130568A1 (ja) * | 2017-12-28 | 2019-07-04 | スカパーJsat株式会社 | 評価情報生成システム、評価情報生成方法、およびプログラム |
| KR102315392B1 (ko) * | 2018-11-19 | 2021-10-21 | 한화시스템 주식회사 | 모의 식생 환경에 대한 산란계수 생성 시스템 |
| KR102300969B1 (ko) * | 2018-11-19 | 2021-09-10 | 한화시스템 주식회사 | 모의 식생 환경에 대한 산란계수 생성 방법 및 시스템 |
| CN109948596B (zh) * | 2019-04-26 | 2022-04-22 | 电子科技大学 | 一种基于植被指数模型进行水稻识别和种植面积提取的方法 |
| CN110378894B (zh) * | 2019-07-25 | 2021-08-13 | 内蒙古工业大学 | 基于相关性的TomoSAR植被病虫害监测方法及装置 |
| JP7175537B2 (ja) * | 2020-02-06 | 2022-11-21 | 株式会社ナイルワークス | 生育診断システム、生育診断サーバ及び生育診断方法 |
| CN113807129B (zh) * | 2020-06-12 | 2025-03-04 | 广州极飞科技股份有限公司 | 一种作物区域识别方法、装置、计算机设备和存储介质 |
| CN111985433B (zh) * | 2020-08-28 | 2023-01-20 | 中国科学院地理科学与资源研究所 | 一种水稻遥感信息提取方法和系统 |
| JP7630164B2 (ja) * | 2021-04-28 | 2025-02-17 | 株式会社天地人 | 生育状況評価システム、生育状況評価装置、生育状況評価方法及びプログラム |
| JP7677106B2 (ja) * | 2021-10-08 | 2025-05-15 | 三菱電機株式会社 | 画像解析装置および画像解析方法 |
| KR102671005B1 (ko) * | 2021-11-15 | 2024-06-03 | 주식회사 솔탑 | Sar 레이더의 영상 표출 장치 |
| WO2025249121A1 (ja) * | 2024-05-31 | 2025-12-04 | 日本電気株式会社 | 盛土監視装置、盛土監視方法及びプログラム |
Citations (4)
| Publication number | Priority date | Publication date | Assignee | Title |
|---|---|---|---|---|
| JP2001045867A (ja) * | 1999-08-12 | 2001-02-20 | Satake Eng Co Ltd | 作物の診断方法 |
| JP2002171121A (ja) * | 2000-11-29 | 2002-06-14 | Communication Research Laboratory | 偏波選択性電波反射鏡 |
| JP2005189100A (ja) * | 2003-12-25 | 2005-07-14 | National Institute Of Information & Communication Technology | Sarによる植生被覆分類観測方法 |
| JP2008046107A (ja) * | 2006-07-21 | 2008-02-28 | Pasuko:Kk | レーダ画像処理装置及びレーダ画像処理方法 |
Family Cites Families (4)
| Publication number | Priority date | Publication date | Assignee | Title |
|---|---|---|---|---|
| ID26882A (id) * | 1999-08-10 | 2001-02-15 | Satake Eng Co Ltd | Metode diagnosa kondisi nutrisi hasil panen di ladang tanaman |
| US6963662B1 (en) * | 2000-11-15 | 2005-11-08 | Sri International | Method and system for detecting changes in three dimensional shape |
| US7046841B1 (en) * | 2003-08-29 | 2006-05-16 | Aerotec, Llc | Method and system for direct classification from three dimensional digital imaging |
| US7705768B2 (en) * | 2007-05-07 | 2010-04-27 | Pasco Corporation | Radar image processor and method of radar image processing |
-
2008
- 2008-11-14 JP JP2008292705A patent/JP5369282B2/ja active Active
-
2009
- 2009-11-13 WO PCT/JP2009/069370 patent/WO2010055915A1/ja not_active Ceased
- 2009-11-13 EP EP09826161.3A patent/EP2351477B1/en not_active Not-in-force
- 2009-11-13 US US13/129,245 patent/US8478003B2/en not_active Expired - Fee Related
- 2009-11-13 CN CN2009801457435A patent/CN102215666B/zh not_active Expired - Fee Related
Patent Citations (4)
| Publication number | Priority date | Publication date | Assignee | Title |
|---|---|---|---|---|
| JP2001045867A (ja) * | 1999-08-12 | 2001-02-20 | Satake Eng Co Ltd | 作物の診断方法 |
| JP2002171121A (ja) * | 2000-11-29 | 2002-06-14 | Communication Research Laboratory | 偏波選択性電波反射鏡 |
| JP2005189100A (ja) * | 2003-12-25 | 2005-07-14 | National Institute Of Information & Communication Technology | Sarによる植生被覆分類観測方法 |
| JP2008046107A (ja) * | 2006-07-21 | 2008-02-28 | Pasuko:Kk | レーダ画像処理装置及びレーダ画像処理方法 |
Non-Patent Citations (8)
| Title |
|---|
| KAZUYOSHI TAKAHASHI ET AL.: "Jikeiretsu RADARSAT Data o Mochiita Mizuina Ikusei Bunpu no Haaku", JAPAN SOCIETY OF PHOTOGRAMMETY AND REMOTE SENSING NENJI GAKUJUTSU KOENKAI TOKYO KOKUSAI TENJIJO, 2004, TOKYO, pages 259 - 262, XP008147486 * |
| KIYOTADA SATO: "Ine no Ikusei Kansatsu ni Taisuru Tajiki JERS-1/SAR Data no Kaiseki", THE REMOTE SENSING SOCIETY OF JAPAN GAKUJUTSU KOENKAI RONBUNSHU, vol. 24TH, 1998, pages 29 - 30, XP008147485 * |
| KONISHI TOMOHISA: "Rice crop growth monitoring using ENVISAT-1/ASAR AP mode", PROCEEDINGS OF SPIE, vol. 6749, 2007, pages 674920.1 - 674920.9, XP008147482 * |
| See also references of EP2351477A4 * |
| SHIGEO OGAWA: "Eisei SAR Data to ni yoru Mizuina Sakutsuke Menseki no Suitei Hoho", NOKANKEN NEWS, vol. 47, 2000, pages 6 - 7, XP008150059 * |
| YUN SHAO ET AL.: "Rice monitoring and production estimation using multitemporal RADARSAT", REMOTE SENSING OF ENVIRONMENT, vol. 76, no. ISSUE, June 2001 (2001-06-01), pages 310 - 325, XP008147479 * |
| YUZO SUGA: "Eisei Tosai SAR ni yoru Suiden no Koho Sanran Tokusei no Kaiseki RADARSAT Data no Kansatsu Mode no Chigai ni yoru Hikaku", THE REMOTE SENSING SOCIETY OF JAPAN GAKUJUTSU KOENKAI RONBUNSHU, vol. 29TH, 2000, pages 63 - 66, XP008150060 * |
| YUZO SUGA: "RADARSAT Data ni yoru Suiden no Koho Sanran Henka no Chushutsu", THE REMOTE SENSING SOCIETY OF JAPAN GAKUJUTSU KOENKAI RONBUNSHU, vol. 27TH, 1999, pages 191 - 192, XP008147487 * |
Cited By (10)
| Publication number | Priority date | Publication date | Assignee | Title |
|---|---|---|---|---|
| US10761185B2 (en) | 2015-02-18 | 2020-09-01 | Nec Corporation | Signal processing device, signal processing method, recording medium, target detection device, and target detection method |
| US20190179009A1 (en) * | 2017-12-08 | 2019-06-13 | International Business Machines Corporation | Crop classification and growth tracking with synthetic aperture radar |
| US10705204B2 (en) * | 2017-12-08 | 2020-07-07 | International Business Machines Corporation | Crop classification and growth tracking with synthetic aperture radar |
| CN111860325A (zh) * | 2020-07-20 | 2020-10-30 | 河南大学 | 土壤水分反演方法、装置、计算机可读介质和电子设备 |
| CN111860325B (zh) * | 2020-07-20 | 2023-09-15 | 河南大学 | 土壤水分反演方法、装置、计算机可读介质和电子设备 |
| CN113505635A (zh) * | 2021-05-24 | 2021-10-15 | 中国农业大学 | 基于光学和雷达的冬小麦与大蒜混种区识别方法及装置 |
| CN113505635B (zh) * | 2021-05-24 | 2024-05-31 | 中国农业大学 | 基于光学和雷达的冬小麦与大蒜混种区识别方法及装置 |
| CN114332492A (zh) * | 2021-12-15 | 2022-04-12 | 南京林业大学 | 一种基于长时间序列的植被特征提取及选择方法 |
| CN114332492B (zh) * | 2021-12-15 | 2024-03-19 | 南京林业大学 | 一种基于长时间序列的植被特征提取及选择方法 |
| WO2025074762A1 (ja) * | 2023-10-03 | 2025-04-10 | 井関農機株式会社 | 作業車両 |
Also Published As
| Publication number | Publication date |
|---|---|
| JP2010117327A (ja) | 2010-05-27 |
| EP2351477B1 (en) | 2014-08-20 |
| US20110222738A1 (en) | 2011-09-15 |
| US8478003B2 (en) | 2013-07-02 |
| EP2351477A1 (en) | 2011-08-03 |
| JP5369282B2 (ja) | 2013-12-18 |
| CN102215666A (zh) | 2011-10-12 |
| CN102215666B (zh) | 2013-03-27 |
| EP2351477A4 (en) | 2013-07-03 |
Similar Documents
| Publication | Publication Date | Title |
|---|---|---|
| JP5369282B2 (ja) | 植生生育状況解析方法、プログラムおよび植生生育状況解析装置 | |
| US11636672B2 (en) | Crop phenology estimation and tracking with remote sensing imagery | |
| US11327171B2 (en) | Crop classification and growth tracking with synthetic aperture radar | |
| Son et al. | A phenological object-based approach for rice crop classification using time-series Sentinel-1 Synthetic Aperture Radar (SAR) data in Taiwan | |
| Clauss et al. | Estimating rice production in the Mekong Delta, Vietnam, utilizing time series of Sentinel-1 SAR data | |
| CN102194127B (zh) | 一种多频率sar数据农作物遥感分类方法 | |
| Phung et al. | Monitoring rice growth status in the Mekong Delta, Vietnam using multitemporal Sentinel-1 data | |
| Almeida-Ñauñay et al. | Optimization of soil background removal to improve the prediction of wheat traits with UAV imagery | |
| WO2011102520A1 (ja) | 水稲収量予測モデル生成方法、及び水稲収量予測方法 | |
| Kaivosoja et al. | A case study of a precision fertilizer application task generation for wheat based on classified hyperspectral data from UAV combined with farm history data | |
| Wibowo et al. | Spatio-temporal analysis of rice field phenology using Sentinel-1 image in Karawang Regency West Java, Indonesia | |
| IL289666A (en) | Assesses variety for crop yield | |
| CN115758232B (zh) | 一种基于拟合模型的小麦苗情分类方法及系统 | |
| Mishra et al. | Crop classification by using dual-pol SAR vegetation indices derived from Sentinel-1 SAR-C data | |
| Sisheber et al. | Assimilation of Earth observation data for crop yield estimation in smallholder agricultural systems | |
| Son et al. | Rice yield estimation through assimilating satellite data into a crop simumlation model | |
| Tilly et al. | Precise plant height monitoring and biomass estimation with Terrestrial Laser Scanning in paddy rice | |
| Sisheber et al. | The influence of temporal resolution on crop yield estimation with Earth Observation data assimilation | |
| Karada et al. | A review on advances in agriculture and agroforestry with GPS and GIS | |
| CN117876870A (zh) | 一种基于多源遥感数据的农作物估产的方法和系统 | |
| US20220124960A1 (en) | Commercial Farm Optimization Utilizing Simulation, Remote Sensing, and Farmer Inputs | |
| Bolanio et al. | Estimating rice crop yield based on the Sentinel-1A C-band SAR data: a focus in the rice granary capital of Agusan del Sur, Philippines | |
| WO2021081451A1 (en) | Commercial farm optimization utilizing simulation, remote sensing, and farmer inputs | |
| Bagdatli et al. | Estimation of Horticulture Area Expansion and Crop Yield Quantification by Using Remotely Sensed Data and Geographic Information Systems | |
| Heupel et al. | Combining optical remote sensing data with in-situ measurements in order to estimate vegetation parameters on agricultural fields and corresponding uncertainties |
Legal Events
| Date | Code | Title | Description |
|---|---|---|---|
| WWE | Wipo information: entry into national phase |
Ref document number: 200980145743.5 Country of ref document: CN |
|
| 121 | Ep: the epo has been informed by wipo that ep was designated in this application |
Ref document number: 09826161 Country of ref document: EP Kind code of ref document: A1 |
|
| DPE1 | Request for preliminary examination filed after expiration of 19th month from priority date (pct application filed from 20040101) | ||
| WWE | Wipo information: entry into national phase |
Ref document number: 13129245 Country of ref document: US |
|
| NENP | Non-entry into the national phase |
Ref country code: DE |
|
| WWE | Wipo information: entry into national phase |
Ref document number: 2009826161 Country of ref document: EP |