WO2010046968A1 - Dispositif et procédé de diagnostic destinés à une structure en béton - Google Patents
Dispositif et procédé de diagnostic destinés à une structure en béton Download PDFInfo
- Publication number
- WO2010046968A1 WO2010046968A1 PCT/JP2008/069034 JP2008069034W WO2010046968A1 WO 2010046968 A1 WO2010046968 A1 WO 2010046968A1 JP 2008069034 W JP2008069034 W JP 2008069034W WO 2010046968 A1 WO2010046968 A1 WO 2010046968A1
- Authority
- WO
- WIPO (PCT)
- Prior art keywords
- concrete structure
- wavelength
- absorbance
- reference body
- component
- Prior art date
Links
Images
Classifications
-
- G—PHYSICS
- G01—MEASURING; TESTING
- G01N—INVESTIGATING OR ANALYSING MATERIALS BY DETERMINING THEIR CHEMICAL OR PHYSICAL PROPERTIES
- G01N21/00—Investigating or analysing materials by the use of optical means, i.e. using sub-millimetre waves, infrared, visible or ultraviolet light
- G01N21/17—Systems in which incident light is modified in accordance with the properties of the material investigated
- G01N21/25—Colour; Spectral properties, i.e. comparison of effect of material on the light at two or more different wavelengths or wavelength bands
- G01N21/27—Colour; Spectral properties, i.e. comparison of effect of material on the light at two or more different wavelengths or wavelength bands using photo-electric detection ; circuits for computing concentration
- G01N21/274—Calibration, base line adjustment, drift correction
-
- G—PHYSICS
- G01—MEASURING; TESTING
- G01N—INVESTIGATING OR ANALYSING MATERIALS BY DETERMINING THEIR CHEMICAL OR PHYSICAL PROPERTIES
- G01N21/00—Investigating or analysing materials by the use of optical means, i.e. using sub-millimetre waves, infrared, visible or ultraviolet light
- G01N21/17—Systems in which incident light is modified in accordance with the properties of the material investigated
- G01N21/25—Colour; Spectral properties, i.e. comparison of effect of material on the light at two or more different wavelengths or wavelength bands
Definitions
- the present invention relates to an apparatus or method for diagnosing the degree of soundness of a concrete structure by determining the concentration of surface components of a concrete structure such as a road viaduct, tunnel, dike, or building, particularly the concentration of chloride ions on the surface. It is about. *
- Salt damage is not limited to concrete structures facing the sea.
- the salt contained in the antifreezing agent used in cold regions permeates the concrete structure to cause salt damage deterioration.
- Diagnosis method by physical collection That is, first, the core of the concrete structure is removed at the site, and the core is collected as a test piece, or the concrete structure is partially broken by a drill or the like, and the broken concrete powder is collected as a test piece. Then, the collected test piece is brought back to the analysis room, and the concentration of chloride ions is analyzed.
- Near-infrared spectroscopy is spectroscopy in the near-infrared region.
- a large amount of artificial light including near infrared rays is irradiated onto a concrete structure to be diagnosed. That is, for example, an artificial light source such as a halogen lamp is brought close to the concrete structure and irradiated with light. Then, the light reflected from the concrete structure (scattered light) is dispersed in the near-infrared wavelength region, and the absorbance for each wavelength is calculated from the reflectance for each wavelength. Based on the idea that reflected light changes depending on the concentration of surface components (chloride ions) in a specific wavelength range, the concentration of surface components (chloride ions) is calculated from the calculated absorbance for each wavelength. To do.
- Patent Document 1 This type of diagnostic method using near infrared spectroscopy is disclosed in the following Patent Document 1, Non-Patent Document 1, and the like.
- Japanese Patent Laying-Open No. 2005-291881 (Title of Invention “Concrete Structure Deterioration Detection Device and Concrete Structure Deterioration Detection Method”) “Study on Estimation Method of Chloride Ion Concentration in Concrete Using Near Infrared Spectroscopy”, Gunsei et al., Concrete Engineering Annual Papers, vol. 30, no. 2, 2008
- the conventional “diagnosis method by near-infrared spectroscopy” remains at the laboratory level at this stage. That is, in this diagnostic method, it is necessary to obtain a stable reflected light by irradiating a concrete structure to be diagnosed with a large amount of artificial light including near infrared rays. Otherwise, the near-infrared illuminance will be insufficient, and the near-infrared reflected light of the same spectral component cannot always be captured from the concrete structure, and stable and accurate data cannot be obtained. If this diagnostic method is applied to an actual outdoor concrete structure, not a laboratory level, a huge halogen lamp must be brought close to the concrete structure and irradiated with light.
- This invention is made
- the first invention is The light reflected from the surface of the concrete structure is divided into each wavelength to determine the absorbance for each wavelength, and based on the absorbance for each wavelength, the concentration of the component on the surface of the concrete structure is determined to obtain the concrete structure.
- Each component has a different component concentration on the surface of the concrete structure, and natural light with the same or almost the same spectrum as the natural light irradiated on the surface of the concrete structure to be diagnosed
- a reference body placed in an environment irradiated with In an environment where natural light of the same or almost the same spectrum is irradiated on the surface of the concrete structure and the surface of the reference body, the light reflected from the surface of the concrete structure and the surface of the reference body is spectrally imaged at each wavelength and imaged.
- Imaging means Based on the imaging result of the imaging means, reference body absorbance calculation means for calculating the absorbance for each component concentration and each wavelength of the light reflected by each component of the reference body, Based on the absorbance for each component concentration and each wavelength calculated by the reference body absorbance calculation means, and the known component concentration of each component of the reference body, the absorbance for each wavelength is used as a variable, and the surface component concentration A function calculation means for calculating a function having a function value as Based on the imaging result of the imaging means, the concrete structure absorbance calculating means for calculating the absorbance for each wavelength of the light reflected from the surface of the concrete structure; Concrete structure surface component concentration calculating means for obtaining the absorbance of each wavelength calculated by the concrete structure absorbance calculating means as a function variable and using the surface component concentration of the concrete structure as a function value. To do.
- the second invention is the first invention,
- a concrete structure is placed in an environment where natural light of the same or substantially the same spectrum is irradiated by placing the reference body in the vicinity of the concrete structure and imaging the surface of the concrete structure and the surface of the reference body simultaneously or substantially simultaneously. It is characterized by taking images of the surface of the surface and the surface of the reference body.
- the third invention is the first invention,
- the wavelength region for calculating the absorbance for each wavelength includes the visible light region.
- a fourth invention is the first invention,
- the component concentration on the surface of the concrete structure is characterized by chloride ion or chloride concentration, water cement ratio W / C, or degree of neutralization.
- a fifth invention is the first invention, The component density is obtained for each pixel of the captured image, and the surface component density distribution is obtained.
- a sixth invention is the first invention, The function is calculated using a neural network having the absorbance at each wavelength as an input signal and the surface component concentration as an output signal.
- a seventh invention is the sixth invention,
- the function is calculated by updating the connection weight of the neural network so that the error between the output signal and the teacher signal is eliminated using the known component concentrations of the respective constituents of the reference body as the teacher signal. To do.
- Absorbance for each wavelength is calculated in a wavelength region excluding the wavelength region in which water or / and carbon dioxide absorbs light.
- the ninth invention The light reflected from the surface of the concrete structure is divided into each wavelength to determine the absorbance for each wavelength, and based on the absorbance for each wavelength, the concentration of the component on the surface of the concrete structure is determined to obtain the concrete structure.
- Natural light with the same or almost the same spectrum as the natural light irradiated on the surface of the concrete structure to be diagnosed with the reference body having each component whose concentration of the component existing on the surface of the concrete structure is varied at each level. Is placed in an environment where the surface of the concrete structure and the surface of the reference body are irradiated with natural light of the same or substantially the same spectrum.
- Imaging the step Based on the imaging results, the light reflected by each component of the reference body is dispersed into each wavelength, and the absorbance for each component concentration and each wavelength is calculated. The calculated absorbance for each component concentration and each wavelength. And calculating a function using the absorbance for each wavelength as a variable and the surface component concentration as a function value based on the known component concentrations of each component of the reference body, Based on the imaging results, the light reflected from the surface of the concrete structure is divided into each wavelength, the absorbance at each wavelength is calculated, and the calculated absorbance at each wavelength is used as a function variable. And calculating a surface component concentration as a function value.
- the tenth invention is the ninth invention,
- a concrete structure is placed in an environment where natural light of the same or substantially the same spectrum is irradiated by placing the reference body in the vicinity of the concrete structure and imaging the surface of the concrete structure and the surface of the reference body simultaneously or substantially simultaneously. It is characterized by taking images of the surface of the surface and the surface of the reference body.
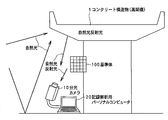
- the diagnostic apparatus for a concrete structure spectroscopically divides the light reflected from the surface of the concrete structure 1 into each wavelength, obtains the absorbance for each wavelength, and obtains the absorbance for each wavelength.
- the concrete structure 1 is diagnosed by determining the concentration of components (for example, chloride ion concentration) on the surface of the viaduct 1 that is a concrete structure based on the absorbance.
- the light to be used is natural light, and it is not necessary to prepare a special or dedicated light source.
- the concrete structure 1 and the reference body 100 are disposed in an environment where natural light outdoors is irradiated.
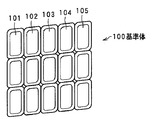
- the reference body 100 includes constituent elements 101, 102, 103, 104, 105... That have different concentrations (chloride ion concentrations) of components existing on the surface of the concrete structure 1. And is arranged in an environment where natural light having the same or substantially the same spectrum as natural light irradiated on the surface of the concrete structure 1 to be diagnosed is irradiated on the surface.
- the reference body 100 is disposed in the vicinity of the concrete structure 1 (second invention).
- the imaging unit 10 reflects light reflected from the surface of the concrete structure 1 and the surface of the reference body 100 in an environment where natural light having the same or substantially the same spectrum is irradiated on the surface of the concrete structure 1 and the surface of the reference body 100. Are imaged by spectrally dividing each wavelength.
- the surface of the concrete structure 1 and the surface of the reference body 100 are imaged simultaneously or substantially simultaneously by the spectroscopic camera 10 (second invention).
- the spectroscopic camera 10 second invention.
- the imaging time of the reference body 100 and the concrete structure 1 It is also possible to significantly shift the imaging time in terms of time.
- the function calculation means 22 is based on the absorbance for each component concentration and each wavelength calculated by the reference body absorbance calculation means 21 and the known component concentrations of the components 101, 102. A function having the absorbance at each wavelength as a variable and the surface component concentration as a function value is calculated.
- the concrete structure absorbance calculation means 23 calculates the absorbance of each wavelength of the light reflected from the surface of the concrete structure 1 based on the imaging result of the imaging means 10.
- the concrete structure surface component concentration calculating means 24 obtains the surface component concentration of the concrete structure 1 as a function value using the absorbance for each wavelength calculated by the concrete structure absorbance calculating means 23 as a function variable.
- the wavelength region for calculating the absorbance for each wavelength may include a visible light region (third invention).
- component concentration on the surface of the concrete structure in the first invention is chloride ion or chloride concentration, water cement ratio W / C, or degree of neutralization (fourth invention).
- the component density can be obtained for each pixel of the captured image, and the surface component density distribution can be obtained (fifth invention).
- the function can be calculated using a neural network having the absorbance for each wavelength as an input signal and the surface component concentration as an output signal (sixth invention). At this time, the function is calculated by updating the connection weight of the neural network so that there is no error between the output signal and the teacher signal, using the known component concentrations of each component of the reference body as the teacher signal. (Seventh invention).
- the absorbance for each wavelength can be calculated in a wavelength region excluding the wavelength region in which water or / and carbon dioxide absorbs light (eighth invention).
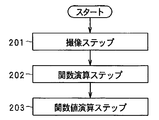
- the method for diagnosing a concrete structure according to the ninth aspect of the invention includes the following steps shown in FIG.
- the reference body 100 having the constituent elements 101, 102, 103, 104, 105... In which the concentration of the component existing on the surface of the concrete structure 1 is varied at each level is provided on the surface of the concrete structure 1 to be diagnosed.
- the surface of the concrete structure 1 and the surface of the reference body are irradiated with natural light having the same or substantially the same spectrum as the natural light having the same or substantially the same spectrum as the natural light to be irradiated.
- the light reflected from the surface of the concrete structure 1 and the surface of the reference body 100 is spectrally divided into each wavelength and imaged (step 201).
- the reference body 100 may be arranged in the vicinity of the concrete structure 1, and the surface of the reference body 100 may be imaged immediately before imaging the surface of the concrete structure 1, or immediately after the surface of the concrete structure 1 is imaged. You may image the surface of the body 100 (10th invention).
- the “concrete structure” is a concept including a mortar structure not including gravel as well as concrete including gravel as an aggregate.
- component concentration on the surface of a concrete structure to be measured is not only chloride ion concentration and chloride concentration, but also water cement ratio (W / C), neutralization. The concept includes the degree of.
- Drawing 1 shows the whole concrete structure diagnostic device composition of an embodiment.
- the apparatus is roughly composed of a reference body 100, a spectroscopic camera 10 and a personal computer for recording analysis which are arranged in the vicinity of a concrete structure 1 (a viaduct) to be diagnosed. 20
- this diagnostic apparatus divides the light reflected on the surface of the viaduct 1 that is a concrete structure into each wavelength to obtain the absorbance for each wavelength, and based on the absorbance for each wavelength.
- the concentration of the components on the surface of the viaduct 1 as a concrete structure (chloride ion concentration) is determined to diagnose the viaduct 1 as a concrete structure.
- the light to be used is natural light, and it is not necessary to prepare a special or dedicated light source.
- the reference body 100 has each component in which the concentration (chloride ion concentration) of the component existing on the surface of the concrete structure 1 is varied at each level, and is irradiated on the surface of the concrete structure 1 to be diagnosed. It is arranged in an environment where natural light having the same or substantially the same spectrum as natural light is irradiated on the surface. In the case of the present embodiment, the reference body 100 is disposed in the vicinity of the concrete structure 1, but this is only an example, and in an environment where natural light of the same or substantially the same spectrum is irradiated, It is also possible to arrange the reference body 100 at a place spatially far from the concrete structure 1.
- FIG. 2 shows a specific configuration example of the reference body 100.
- the reference body 100 is composed of a plurality of components 101, 102, 103, 104, 105... Having different chloride ion concentrations.
- the chloride ion concentrations on the surfaces of the constituent elements 101, 102, 103, 104, 105... Are 0 kg / m 3, 1 kg / m 3, 2 kg / m 3, 5 kg / m 3 and 10 kg / m 3, respectively. In the experiment, the following specimens were used.
- the spectroscopic camera 10 a hyperspectral camera equipped with a spectroscope can be used.
- the spectroscopic camera 10 serving as an imaging unit is configured such that the surface of the concrete structure 1 and the surface of the reference body 100 are in an environment where natural light having the same or substantially the same spectrum is irradiated on the surface of the concrete structure 1 and the surface of the reference body 100. The light reflected by is split into each wavelength and imaged.
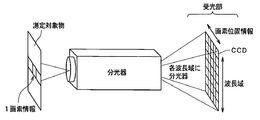
- reflected light from the object is captured, divided into slit-like line spectra by the mirror mechanism of the spectroscope, and sent to the diffraction grating via the objective lens.
- the light is dispersed for each wavelength by the diffraction grating and sent to the CCD of the light receiving unit.
- the spectroscopic method employed in the spectroscopic camera 10 can employ any method such as spectroscopic using a diffraction phenomenon or spectroscopic using a spectral filter.
- the CCD receives light for each pixel of the object and records reflection intensity data corresponding to the size of the wavelength for each pixel.
- FIG. 3 is a diagram conceptually showing spectral data obtained by the spectroscopic camera 10. That is, in the spectroscopic camera 10, spectroscopy is performed for each pixel of the measurement object by the spectroscope, and reflection intensity data for each wavelength is recorded in association with the position information of the pixel.
- the measurement object is the reference body 100
- the component concentration differs for each of the constituent elements 101, 102. Therefore, data in which the component density information and the magnitude of the reflection intensity for each wavelength are associated with the pixel position information is recorded.
- the surface of the concrete structure 1 and the surface of the reference body 100 are imaged simultaneously or substantially simultaneously by the spectroscopic camera 10.
- the reference body 100 It is also possible to significantly shift the imaging time and the imaging time of the concrete structure 1 in terms of time. For example, it is also possible to observe weather conditions in advance and take images of the concrete structure 1 and the reference body 100 at different times when the weather conditions match.
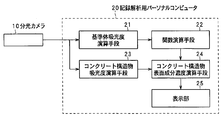
- FIG. 4 is a functional block diagram of the recording analysis personal computer 20.
- the personal computer 20 for recording analysis includes a reference body absorbance calculating means 21, a function calculating means 22, a concrete structure absorbance calculating means 23, a concrete structure surface component concentration calculating means 24, and a display unit 25. Has been.
- the reference body absorbance calculation means 21 calculates the absorbance for each component concentration and each wavelength of the light reflected by each component 101, 102,... Of the reference body 100 based on the imaging result of the spectroscopic camera 10.
- the function calculation means 22 is based on the absorbance for each component concentration and each wavelength calculated by the reference body absorbance calculation means 21 and the known component concentrations of the components 101, 102. A function having the absorbance at each wavelength as a variable and the surface component concentration as a function value is calculated.
- the concrete structure absorbance calculation means 23 calculates the absorbance for each wavelength of the light reflected by the surface of the concrete structure 1 based on the imaging result of the spectroscopic camera 10.
- the concrete structure surface component concentration calculating means 24 obtains the surface component concentration of the concrete structure 1 as a function value using the absorbance for each wavelength calculated by the concrete structure absorbance calculating means 23 as a function variable.
- the display unit 25 displays the calculation processing result as an image.
- FIG. 5 is a flowchart showing the procedure of the concrete structure diagnosis method of the embodiment.
- the method according to the embodiment mainly includes the following steps.
- the reference body 100 having the constituent elements 101, 102, 103, 104, 105... In which the concentration of the component existing on the surface of the concrete structure 1 is varied at each level is provided on the surface of the concrete structure 1 to be diagnosed.
- the surface of the concrete structure 1 and the surface of the reference body are irradiated with natural light having the same or substantially the same spectrum as the natural light having the same or substantially the same spectrum as the natural light to be irradiated.
- the light reflected from the surface of the concrete structure 1 and the surface of the reference body 100 is spectrally divided into each wavelength and imaged (step 201).
- the reference body 100 may be arranged in the vicinity of the concrete structure 1, and the surface of the reference body 100 may be imaged immediately before imaging the surface of the concrete structure 1, or immediately after the surface of the concrete structure 1 is imaged.
- the surface of the body 100 may be imaged.
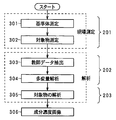
- FIG. 6 shows the processing of the processing content of imaging the surface of the reference body 100 immediately before imaging the surface of the concrete structure 1 as an object and calculating the function using a neural network which is one method of multivariate analysis. The procedure is shown in the flowchart.
- Step 301 The operator places the reference body 100 in the vicinity of the concrete structure 1 at the site, and images the surface of the reference body 100 with the spectroscopic camera 10. Thereby, data in which the component density information and the magnitude of the reflection intensity for each wavelength are associated with the pixel position information is acquired (step 301).
- step 302 Next, the surface of the concrete structure 1 is imaged by the spectroscopic camera 10. Thereby, data in which the magnitude of the reflection intensity for each wavelength is associated with the pixel position information is acquired (step 302).
- steps 301 and 302 corresponds to the processing in step 201 in FIG.
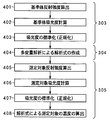
- the teacher data extraction process in step 303 is specifically shown in steps 401, 402, and 403 in FIG.
- the wavelength range to be analyzed is, for example, 900 nm to 2400 nm.
- This wavelength region is a wavelength region including the near infrared region (step 401: calculation of reference body reflection intensity).
- the reflectance R ( ⁇ ) (unit%) for each wavelength ⁇ of the reference body 100 is obtained as shown in the following equation (1). It is done.
- the absorbance A ( ⁇ ) for each wavelength ⁇ of the reference body 100 is obtained as shown in the following equation (2).
- the absorbance is the degree to which a substance absorbs light.
- a ( ⁇ ) log (1 / R ( ⁇ )) (2)
- the above process is performed for each pixel. Since component concentration information is associated with each pixel, the absorbance A ( ⁇ ) is obtained for each component concentration (step 402: reference body absorbance calculation).
- step 304 Next, based on the teacher data obtained in step 303, analysis using a neural network as a method of multivariate analysis is performed, and the component concentration is determined from the absorbance A ( ⁇ ) i for each wavelength ⁇ to be measured.
- a function for estimating (chloride ion concentration) y is obtained. That is, in this embodiment, the function is calculated using a neural network having the absorbance A ( ⁇ ) i for each wavelength ⁇ as an input signal and the surface component concentration y as an output signal.
- the known component concentrations yd (0 kg / m 3, 1 kg / m 3, 2 kg / m 3, 5 kg / m 3, 10 kg / m 3) of each component 101, 102.
- the function is calculated by updating the connection weight (weight) wij of the neural network so that the error between y and the teacher signal yd is eliminated.
- This calculation processing is performed by the function calculation means 22 of the recording analysis personal computer 20.
- step 304 The multivariate analysis process in step 304 is specifically shown in step 404 (creation of an analytical expression by multivariate analysis) in FIG.
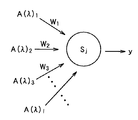
- Figure 8 shows a neural network model
- the component concentration (output signal) is y
- a hidden layer Sj called a latent variable is placed between the output signal and the input signal, and the coupling weight (weight) wij indicating the importance of each input signal is changed.
- the latent variable Sj is obtained as the following equation (5) as the sum of the products of each input signal A ( ⁇ ) i and the coupling weight (weight) wij.
- an arithmetic process is performed using an output function (transfer function) having the latent variable Sj obtained by the above equation (6) as a variable to obtain an output signal (component concentration) y.
- the output function (transfer function) is a hyperbolic tangent curve.
- ⁇ wij ⁇ (yd ⁇ y) A ( ⁇ ) i (8)
- ⁇ is a minute constant.
- step 305 The object analysis processing in step 305 is specifically shown in steps 405, 406, 407, and 408 in FIG.
- the data related to the concrete structure 1 of the spectroscopic camera 10 is sent to the concrete structure absorbance calculation means 23 of the personal computer 20 for recording analysis, and the concrete structure which is the measurement object for each wavelength ⁇ in the same manner as the reference body 100.
- the reflection intensity Ic ( ⁇ ) of the object 1 is calculated (Step 405: Measurement object reflection intensity calculation).
- Step 406 Absorbance calculation of measurement object
- Step 407 Absorbance standardization (normalization)).
- Step 408 Calculation of concentration of measurement object by analytical formula).
- step 305 corresponds to the processing in step 203 in FIG.
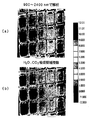
- FIG. 9A is a photograph showing the experimental results.
- the reference body 100 itself is regarded as a measurement target, and the absorbance A ( ⁇ ) i of each wavelength ⁇ of the reference body 100 is expressed as a function of the above equation (10).
- the magnitude of the surface component concentration (function value) y obtained as an analysis result by substituting it into the F variable is displayed as an image.
- the magnitude of the surface component concentration y displayed in the image is compared with the magnitude of the known surface component concentration yd (the chloride ion concentrations of the constituent elements 101, 102,... In FIG. 2), they agree very accurately. I can see that
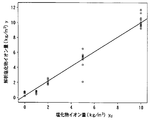
- the horizontal axis represents the magnitude of the known surface component concentration yd (concentration of chloride ions of each of the constituent elements 101, 102... In FIG. 2), and the vertical axis represents the analysis result.
- concentration (function value) y is shown.
- One plot point is an average value of 20 pixels ⁇ 20 pixels.
- the wavelength range to be analyzed is the wavelength range including the near infrared region of 900 nm to 2400 nm has been described as an example. However, this is merely an example, and any wavelength region can be analyzed as long as it is a natural light wavelength region.
- the visible light region may be set as the wavelength region to be analyzed.
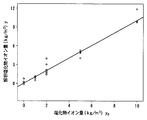
- FIG. 11 shows a known surface component concentration yd as in FIG. 10 (visible chloride region concentration of each component 101, 102... ) And the magnitude of the surface component concentration (function value) y obtained as an analysis result.
- the contribution rate R2 is 0.963, which indicates that both have a very high correlation.
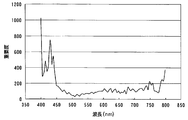
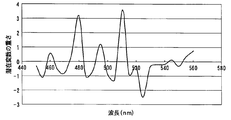
- FIG. 12 shows the result of determining the relationship between the wavelength and the importance, with the visible light region of 400 nm to 800 nm as the wavelength region to be analyzed.
- FIG. 12 shows a correspondence relationship between the horizontal axis representing the wavelength (nm) and the vertical axis representing the cumulative value of the absolute value of the product of the absorbance A ( ⁇ ) i and the binding load (weight) wij as the importance. ing.
- FIG. 12 shows that the importance of the wavelength region of 500 nm or less is particularly high in the visible light region.
- the reflection intensity peak in natural light is about 560 nm. Therefore, the analysis is performed only in the visible light region within the wavelength region of 560 nm or less.
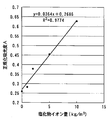
- the magnitude of the known surface component concentration yd (respective chloride ions of the respective constituent elements 101, 102...
- the graph shown in FIG. 13 shows the correspondence between the density) and the magnitude of the surface component density (function value) y obtained as an analysis result.
- the contribution ratio R2 is 0.963, and it can be seen that both show a very high correlation.
- FIG. 14 shows the correspondence between the horizontal axis with the wavelength (nm) and the vertical axis indicating the weight of the latent variable (binding load wij). This is a calculation result obtained based on a neural network model having one latent variable.
- the weight of the latent variable (bonding load wij) jumps and becomes high near wavelengths of 480 nm and 510 nm, showing high importance.
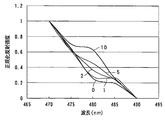
- the normalized reflection intensity at each of the wavelengths 480 nm and 470 nm and 490 nm before and after the wavelength of high importance is calculated, and the correspondence relationship between the wavelength and the normalized reflection intensity is expressed as the magnitude of each surface component concentration (0 kg).
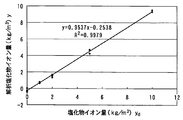
- the normalized absorbance A around the wavelength of 480 nm was obtained, and as shown in FIG. 16, the horizontal axis represents the chloride ion concentration and the vertical axis represents the normalized absorbance A, and the correspondence between the two was determined.
- the wavelength region including the visible light region preferably the wavelength region of the wavelength of 560 nm or less, more preferably, the wavelength region around the wavelength of 480 nm, the absorbance for each wavelength is calculated.
- the function F can be obtained with high accuracy and the surface component concentration of the object can be obtained accurately.
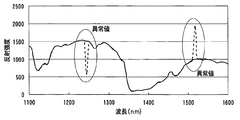
- FIG. 17 is a graph comparing the normalized reflection intensity spectrum of natural light in the morning and the normalized reflection intensity spectrum of natural light in the afternoon on the same measurement day under the clear sky.
- the horizontal axis of FIG. 17 is the wavelength (nm) and indicates the wavelength region from 900 nm to 2400 nm.
- the left side of the vertical axis in FIG. 17 shows the normalized reflection intensity of the concrete structure 1, and the right side shows the normalized reflection intensity of morning natural light (“AM natural light component” in the figure) and normalization of afternoon natural light.
- the difference (“Morning and afternoon difference" in the figure) from the reflection intensity (“PM afternoon natural light component” in the figure) is shown.
- the concentration of the component existing on the surface of the concrete structure 1 cannot always be accurately determined by the same index based on the specific wavelength region as in the conventional technique.
- the teacher data of the reference body 100 is measured each time and the analysis is performed by the neural network even if the measurement environment changes, the surface component concentration (chloride ion concentration) of the target object is measured. ) Can always be accurately estimated.
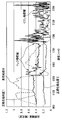
- FIG. 18 is a graph with the horizontal axis representing wavelengths from 900 nm to 2400 nm as in FIG.
- FIG. 18 compares the spectrum of the reflection intensity of natural light (“natural light component” in the figure) with the spectrum of normalized absorbance of natural light (“normalized absorbance 1” and “normalized absorbance 2” in the figure). Show.
- normalized absorbance 1 and “normalized absorbance 2” are normalized absorbances obtained for adjacent pixels, respectively. Even when adjacent pixels are compared in this way, the amount of light in the absorption region of water H2O or carbon dioxide CO2 is insufficient, resulting in a large variation in absorbance.
- the teacher data of the reference body 100 is measured and analyzed by the neural network.
- the data is judged to be less important, and the surface component concentration (chloride ion concentration) of the object can be accurately estimated.
- FIG. 9A shows the result of analyzing the wavelength region (900 nm to 2400 nm) including the above-described absorption region of water H2O and carbon dioxide CO2, but includes the absorption region of water H2O and carbon dioxide CO2. It can be seen that the surface component concentration can be estimated very accurately even if it is.
- FIG. 9 (b) is an image similar to FIG. 9 (a), and shows the result of analyzing the wavelength region excluding the above-described absorption region of water H2O and carbon dioxide CO2 from the wavelength region of 900 nm to 2400 nm. From the image of FIG. 9B, it can be seen that the surface component concentration can be estimated more accurately than the analysis result shown in FIG. 9A. In particular, it can be seen that an image showing the distribution of the chloride ion concentration is clear because the variation for each pixel is small.
- the absorbance for each wavelength is calculated for a wavelength region including the visible light region, preferably a wavelength region having a wavelength of 560 nm or less, more preferably a wavelength region around 480 nm, and a neural network. If the analysis is performed by the above, since the absorption region of water H2O and carbon dioxide CO2 described above is subtracted from the analysis target wavelength region from the beginning, the surface component concentration of the target can be obtained more accurately by that amount. Can do.
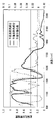
- FIG. 19 is a graph with the horizontal axis representing wavelengths from 900 nm to 2400 nm, as in FIGS. 17 and 18.
- FIG. 19 shows a spectrum of the reflection intensity of natural light measured for adjacent pixels, respectively.
- the solid line and the broken line in the figure correspond to the spectrum of each adjacent pixel.
- FIG. 19 shows a case where an abnormal value of reflection intensity occurs at a specific wavelength. Such an abnormality is presumed to be due to an instrumental error of the CCD pixel. Therefore, by comparing the natural light reflection intensity spectra measured for the adjacent pixels, it is possible to automatically extract the abnormal value and perform correction to remove the abnormal value. For example, the estimation accuracy can be increased by performing correction using time series analysis based on CCD pixel column information.
- an analysis method using a neural network which is one method of multivariate analysis
- a PLS analysis method which is another method of multivariate analysis.
- FIG. 1 is a figure showing the whole concrete structure diagnostic device composition of an embodiment.
- FIG. 2 is a diagram illustrating a specific configuration example of the reference body.
- FIG. 3 is a diagram conceptually showing spectral data obtained by the spectroscopic camera.
- FIG. 4 is a functional block diagram of a personal computer for recording analysis.
- FIG. 5 is a flowchart illustrating a procedure of the concrete structure diagnosis method according to the embodiment.
- FIG. 6 is a flowchart showing a processing procedure for imaging the surface of the reference body immediately before imaging the surface of the concrete structure and calculating a function using a neural network which is one method of multivariate analysis.
- FIG. 7 is a flowchart specifically showing the processing procedure of the analysis processing in FIG. FIG.
- FIG. 8 is a diagram illustrating a model of a neural network.
- FIGS. 9A and 9B are photographs showing the experimental results.
- the reference body itself is regarded as a measurement object, and the surface component concentration (function value) obtained as an analysis result is displayed as an image.
- FIG. 10 is a graph showing the correspondence between the known surface component concentration and the surface component concentration (function value) obtained as an analysis result.
- FIG. 11 shows the correspondence between the known surface component concentration and the surface component concentration (function value) obtained as an analysis result, with the visible light region of 400 nm to 800 nm as the wavelength region to be analyzed. It is a graph.
- FIG. 9A and 9B are photographs showing the experimental results.
- the reference body itself is regarded as a measurement object, and the surface component concentration (function value) obtained as an analysis result is displayed as an image.
- FIG. 10 is a graph showing the correspondence between the known surface component concentration and the surface component concentration (function value) obtained as an analysis result.
- FIG. 11 shows the correspondence
- FIG. 12 is a graph showing the correspondence between the wavelength and the importance with the visible light region of 400 nm to 800 nm as the wavelength region to be analyzed.
- FIG. 13 shows the correspondence between the magnitude of the known surface component concentration and the magnitude of the surface component concentration (function value) obtained as a result of the analysis by analyzing only the wavelength region of 560 nm or less in the visible light region. It is a graph to show.
- FIG. 14 is a graph showing the correspondence between the wavelength and the weight of the latent variable by analyzing only the wavelength region of 560 nm or less in the visible light region.
- FIG. 15 calculates normalized reflection intensities at a wavelength of 480 nm and wavelengths around 470 nm and 490 nm, and a correspondence relationship between the wavelength and the normalized reflection intensity is obtained for each surface component concentration. It is a graph.
- FIG. 16 is a graph showing the correspondence between the chloride ion concentration and the normalized absorbance after obtaining the normalized absorbance around the wavelength of 480 nm.
- FIG. 17 is a graph comparing the normalized reflection intensity spectrum of natural light in the morning with the normalized reflection intensity spectrum of natural light in the afternoon in the wavelength range from 900 nm to 2400 nm on the same measurement day under clear sky.
- FIG. 16 is a graph showing the correspondence between the chloride ion concentration and the normalized absorbance after obtaining the normalized absorbance around the wavelength of 480 nm.
- FIG. 17 is a graph comparing the normalized reflection intensity spectrum of natural light in the morning with the normalized reflection intensity spectrum of natural light in the afternoon in the wavelength range from
- FIG. 18 is a graph showing the spectrum of the reflection intensity of natural light and the spectrum of normalized absorbance of natural light in a wavelength range from 900 nm to 2400 nm.
- FIG. 19 is a graph showing the spectrum of the reflection intensity of natural light measured for adjacent pixels in the wavelength range from 900 nm to 2400 nm, and shows that an abnormal value of the reflection intensity occurs at a specific wavelength. It is the shown graph.
Landscapes
- Physics & Mathematics (AREA)
- Spectroscopy & Molecular Physics (AREA)
- Health & Medical Sciences (AREA)
- Life Sciences & Earth Sciences (AREA)
- Chemical & Material Sciences (AREA)
- Analytical Chemistry (AREA)
- Biochemistry (AREA)
- General Health & Medical Sciences (AREA)
- General Physics & Mathematics (AREA)
- Immunology (AREA)
- Pathology (AREA)
- Engineering & Computer Science (AREA)
- Mathematical Physics (AREA)
- Theoretical Computer Science (AREA)
- Investigating Or Analysing Materials By Optical Means (AREA)
Abstract
L'invention concerne un dispositif et un procédé de diagnostic destinés à une structure en béton, qui peuvent mesurer presque précisément la concentration des éléments constitutifs de surface d'une structure en béton extérieure sans contact et de manière non destructrice. Dans le procédé de diagnostic, un corps de référence possédant différents composants, dans lesquels les concentrations des éléments constitutifs existant sur la surface de la structure en béton sont différentes des niveaux individuels, est agencé dans l'environnement, la surface du corps de référence étant exposée à une lumière naturelle présentant le même ou sensiblement le même spectre que celui d'une lumière naturelle pour éclairer la surface de la structure en béton à diagnostiquer. La lumière, qui est réfléchie sur la surface de la structure en béton et la surface du corps de référence, est divisée en différentes longueurs d'onde et photographiée dans l'environnement, la surface de la structure en béton et la surface du corps de référence étant exposées à la lumière naturelle présentant le même ou sensiblement le même spectre que celui de la lumière naturelle. Sur la base du résultat photographique, l'absorbance de chaque concentration des éléments constitutifs et de chaque longueur d'onde de la lumière réfléchie par chaque composant du corps de référence est ensuite calculée, et une fonction, dont l'absorbance de chaque onde est définie en tant que variable et dont la concentration des éléments constitutifs de surface est définie en tant que valeur fonctionnelle, est calculée sur la base de l'absorbance calculée de chaque concentration des éléments constitutifs et de chaque longueur d'onde, et de chaque concentration des éléments constitutifs connue du corps de référence. Sur la base du résultat photographique, l'absorbance de chaque longueur d'onde de la lumière réfléchie sur la surface de la structure en béton est calculée, et la concentration des éléments constitutifs de surface de la structure en béton est déterminée en tant que valeur fonctionnelle par l'utilisation de l'absorbance calculée de chaque longueur d'onde en tant que variable de la fonction.
Priority Applications (2)
| Application Number | Priority Date | Filing Date | Title |
|---|---|---|---|
| PCT/JP2008/069034 WO2010046968A1 (fr) | 2008-10-21 | 2008-10-21 | Dispositif et procédé de diagnostic destinés à une structure en béton |
| JP2010534620A JPWO2010046968A1 (ja) | 2008-10-21 | 2008-10-21 | コンクリート構造物の診断装置および診断方法 |
Applications Claiming Priority (1)
| Application Number | Priority Date | Filing Date | Title |
|---|---|---|---|
| PCT/JP2008/069034 WO2010046968A1 (fr) | 2008-10-21 | 2008-10-21 | Dispositif et procédé de diagnostic destinés à une structure en béton |
Publications (1)
| Publication Number | Publication Date |
|---|---|
| WO2010046968A1 true WO2010046968A1 (fr) | 2010-04-29 |
Family
ID=42119029
Family Applications (1)
| Application Number | Title | Priority Date | Filing Date |
|---|---|---|---|
| PCT/JP2008/069034 WO2010046968A1 (fr) | 2008-10-21 | 2008-10-21 | Dispositif et procédé de diagnostic destinés à une structure en béton |
Country Status (2)
| Country | Link |
|---|---|
| JP (1) | JPWO2010046968A1 (fr) |
| WO (1) | WO2010046968A1 (fr) |
Cited By (11)
| Publication number | Priority date | Publication date | Assignee | Title |
|---|---|---|---|---|
| JP2012159375A (ja) * | 2011-01-31 | 2012-08-23 | Fujitsu Ltd | 反射率算出装置、反射率算出方法およびプログラム |
| JP2013096741A (ja) * | 2011-10-28 | 2013-05-20 | West Nippon Expressway Engineering Shikoku Co Ltd | 構造物の赤外線調査方法及び赤外線調査用演算装置 |
| JP2013535014A (ja) * | 2010-06-25 | 2013-09-09 | セルマーク セラノスティクス,リミテッド ライアビリティー カンパニー | 生物学的試片をスペクトル画像により分析する方法 |
| US9129371B2 (en) | 2010-06-25 | 2015-09-08 | Cireca Theranostics, Llc | Method for analyzing biological specimens by spectral imaging |
| JP2017116476A (ja) * | 2015-12-25 | 2017-06-29 | 株式会社トプコン | コンクリートの計測方法 |
| JP2017181407A (ja) * | 2016-03-31 | 2017-10-05 | 株式会社トプコン | 分光曲線取得装置及びコンクリート測定装置及び分光曲線取得方法及びコンクリート測定方法 |
| JP2018128370A (ja) * | 2017-02-09 | 2018-08-16 | 富士通株式会社 | 植物判別装置、植物判別方法及び植物判別用コンピュータプログラム |
| US10067051B2 (en) | 2010-06-25 | 2018-09-04 | Cireca Theranostics, Llc | Method for analyzing biological specimens by spectral imaging |
| KR101922831B1 (ko) * | 2018-01-31 | 2018-11-27 | 서울시립대학교 산학협력단 | 콘크리트 상태를 판정하는 영상분석장치 및 영상분석방법 |
| US10460439B1 (en) | 2015-08-12 | 2019-10-29 | Cireca Theranostics, Llc | Methods and systems for identifying cellular subtypes in an image of a biological specimen |
| JPWO2021176568A1 (fr) * | 2020-03-03 | 2021-09-10 |
Citations (8)
| Publication number | Priority date | Publication date | Assignee | Title |
|---|---|---|---|---|
| JPH01110237A (ja) * | 1987-10-23 | 1989-04-26 | Suzuki Motor Co Ltd | 路面状態検出装置 |
| JPH04148828A (ja) * | 1990-10-12 | 1992-05-21 | Olympus Optical Co Ltd | 分光検査装置 |
| JPH0829332A (ja) * | 1994-07-13 | 1996-02-02 | Horiba Ltd | 多成分水溶液の分析方法およびその分析装置 |
| JP2004354098A (ja) * | 2003-05-27 | 2004-12-16 | Starlabo Corp | スペクトル画像化装置 |
| JP2005315877A (ja) * | 2004-03-31 | 2005-11-10 | Keita Sugiyama | 画像解析を利用した植物体の色素含有量の定量方法 |
| JP2005321350A (ja) * | 2004-05-11 | 2005-11-17 | Ishikawajima Harima Heavy Ind Co Ltd | 物質比較装置 |
| JP2006101768A (ja) * | 2004-10-06 | 2006-04-20 | Satake Corp | ライスセンターやカントリーエレベータ等の荷受における生籾の仕分け方法 |
| JP2007187486A (ja) * | 2006-01-11 | 2007-07-26 | Iwate Prefecture | 物質の成分推定方法及び物質の成分推定装置 |
Family Cites Families (1)
| Publication number | Priority date | Publication date | Assignee | Title |
|---|---|---|---|---|
| JP2005055228A (ja) * | 2003-07-31 | 2005-03-03 | Japan Science & Technology Agency | 酸化的ストレスの検出方法 |
-
2008
- 2008-10-21 WO PCT/JP2008/069034 patent/WO2010046968A1/fr active Application Filing
- 2008-10-21 JP JP2010534620A patent/JPWO2010046968A1/ja active Pending
Patent Citations (8)
| Publication number | Priority date | Publication date | Assignee | Title |
|---|---|---|---|---|
| JPH01110237A (ja) * | 1987-10-23 | 1989-04-26 | Suzuki Motor Co Ltd | 路面状態検出装置 |
| JPH04148828A (ja) * | 1990-10-12 | 1992-05-21 | Olympus Optical Co Ltd | 分光検査装置 |
| JPH0829332A (ja) * | 1994-07-13 | 1996-02-02 | Horiba Ltd | 多成分水溶液の分析方法およびその分析装置 |
| JP2004354098A (ja) * | 2003-05-27 | 2004-12-16 | Starlabo Corp | スペクトル画像化装置 |
| JP2005315877A (ja) * | 2004-03-31 | 2005-11-10 | Keita Sugiyama | 画像解析を利用した植物体の色素含有量の定量方法 |
| JP2005321350A (ja) * | 2004-05-11 | 2005-11-17 | Ishikawajima Harima Heavy Ind Co Ltd | 物質比較装置 |
| JP2006101768A (ja) * | 2004-10-06 | 2006-04-20 | Satake Corp | ライスセンターやカントリーエレベータ等の荷受における生籾の仕分け方法 |
| JP2007187486A (ja) * | 2006-01-11 | 2007-07-26 | Iwate Prefecture | 物質の成分推定方法及び物質の成分推定装置 |
Non-Patent Citations (3)
| Title |
|---|
| HISASHI KANADA ET AL.: "Kinsekigai Bunkoho no Concrete Chosa eno Oyo", CONCRETE JOURNAL, vol. 43, no. 3, 1 March 2005 (2005-03-01), pages 37 - 44 * |
| MASAHIRO KURODAI ET AL.: "Kinsekigai Bunkoho o Mochiita Concrete Hyomen no Enkabutsu Ion Nodo Suitei ni Kansuru Kenkyu", THE REMOTE SENSING SOCIETY OF JAPAN GAKUJUTSU KOENKAI RONBUNSHU, 16 May 2008 (2008-05-16), pages 157 - 158 * |
| MASATO KOORI ET AL.: "Kinsekigai Bunkoho o Mochiita Concrete Chu no Enkabutsu Ion Nodo no Suitei Shuho ni Kansuru Kento", PROCEEDINGS OF THE JAPAN CONCRETE INSTITUTE, vol. 30, no. 2, 30 July 2008 (2008-07-30), pages 745 - 750 * |
Cited By (17)
| Publication number | Priority date | Publication date | Assignee | Title |
|---|---|---|---|---|
| US10067051B2 (en) | 2010-06-25 | 2018-09-04 | Cireca Theranostics, Llc | Method for analyzing biological specimens by spectral imaging |
| JP2013535014A (ja) * | 2010-06-25 | 2013-09-09 | セルマーク セラノスティクス,リミテッド ライアビリティー カンパニー | 生物学的試片をスペクトル画像により分析する方法 |
| US9129371B2 (en) | 2010-06-25 | 2015-09-08 | Cireca Theranostics, Llc | Method for analyzing biological specimens by spectral imaging |
| US9495745B2 (en) | 2010-06-25 | 2016-11-15 | Cireca Theranostics, Llc | Method for analyzing biological specimens by spectral imaging |
| JP2012159375A (ja) * | 2011-01-31 | 2012-08-23 | Fujitsu Ltd | 反射率算出装置、反射率算出方法およびプログラム |
| JP2013096741A (ja) * | 2011-10-28 | 2013-05-20 | West Nippon Expressway Engineering Shikoku Co Ltd | 構造物の赤外線調査方法及び赤外線調査用演算装置 |
| US10460439B1 (en) | 2015-08-12 | 2019-10-29 | Cireca Theranostics, Llc | Methods and systems for identifying cellular subtypes in an image of a biological specimen |
| US10345232B2 (en) | 2015-12-25 | 2019-07-09 | Topcon Corporation | Method of measuring state of concrete |
| WO2017110853A1 (fr) * | 2015-12-25 | 2017-06-29 | 株式会社トプコン | Procédé permettant de mesurer du béton |
| JP2017116476A (ja) * | 2015-12-25 | 2017-06-29 | 株式会社トプコン | コンクリートの計測方法 |
| WO2017170975A1 (fr) * | 2016-03-31 | 2017-10-05 | 株式会社 トプコン | Dispositif d'acquisition de courbe spectrale, dispositif de mesure de béton, procédé d'acquisition de courbe spectrale et procédé de mesure de béton |
| JP2017181407A (ja) * | 2016-03-31 | 2017-10-05 | 株式会社トプコン | 分光曲線取得装置及びコンクリート測定装置及び分光曲線取得方法及びコンクリート測定方法 |
| JP2018128370A (ja) * | 2017-02-09 | 2018-08-16 | 富士通株式会社 | 植物判別装置、植物判別方法及び植物判別用コンピュータプログラム |
| KR101922831B1 (ko) * | 2018-01-31 | 2018-11-27 | 서울시립대학교 산학협력단 | 콘크리트 상태를 판정하는 영상분석장치 및 영상분석방법 |
| JPWO2021176568A1 (fr) * | 2020-03-03 | 2021-09-10 | ||
| WO2021176568A1 (fr) * | 2020-03-03 | 2021-09-10 | 日本電気株式会社 | Système de diagnostic d'équipement et procédé de diagnostic d'équipement |
| JP7375909B2 (ja) | 2020-03-03 | 2023-11-08 | 日本電気株式会社 | 設備診断システム、及び、設備診断方法 |
Also Published As
| Publication number | Publication date |
|---|---|
| JPWO2010046968A1 (ja) | 2012-03-15 |
Similar Documents
| Publication | Publication Date | Title |
|---|---|---|
| WO2010046968A1 (fr) | Dispositif et procédé de diagnostic destinés à une structure en béton | |
| Amigo et al. | Direct quantification and distribution assessment of major and minor components in pharmaceutical tablets by NIR-chemical imaging | |
| JP5258044B2 (ja) | 植物葉の水分ストレスを推定する方法、植物葉の水分ストレスを推定するための装置及び植物葉の水分ストレスを推定するためのプログラム | |
| JP2022522348A (ja) | 基板上の膜の検査のための装置及び方法 | |
| Jacq et al. | High-resolution prediction of organic matter concentration with hyperspectral imaging on a sediment core | |
| Ortiz-Herrero et al. | Estimation of the post-mortem interval of human skeletal remains using Raman spectroscopy and chemometrics | |
| Sfarra et al. | How to retrieve information inherent to old restorations made on frescoes of particular artistic value using infrared vision? | |
| CN104677853A (zh) | 一种基于近红外高光谱的壁画起甲病害评估方法 | |
| Edelman et al. | Practical implementation of blood stain age estimation using spectroscopy | |
| Moradi et al. | Rectifying the emissivity variations problem caused by pigments in artworks inspected by infrared thermography: A simple, useful, effective, and optimized approach for the cultural heritage field | |
| Perron et al. | Development of a diffuse reflectance probe for in situ measurement of inherent optical properties in sea ice | |
| Garzonio et al. | A novel hyperspectral system for high resolution imaging of ice cores: Application to light-absorbing impurities and ice structure | |
| JP2005291881A (ja) | コンクリート構造物の劣化検出装置、及びコンクリート構造物の劣化検出方法 | |
| Mehmani et al. | Quantification of kerogen content in organic-rich shales from optical photographs | |
| Watanabe et al. | Toward automated non-destructive diagnosis of chloride attack on concrete structures by near infrared spectroscopy | |
| Hazel et al. | Multivariate analysis of mid-IR FT-IR spectra of hydrocarbon-contaminated wet soils | |
| Crowther et al. | A comparison between visible wavelength hyperspectral imaging and digital photography for the detection and identification of bloodstained footwear marks | |
| JP2007085850A (ja) | コンクリート劣化因子検出方法及び検出装置 | |
| Ichi et al. | Spectral characterization of fouled railroad ballast using hyperspectral imaging | |
| Sun | Errors induced by spectral measurement positions and instrument noise in soil organic carbon prediction using vis-NIR on intact soil | |
| Vibhute et al. | Assessment of soil organic matter through hyperspectral remote sensing data (VNIR spectroscopy) using PLSR method | |
| De Kerf et al. | Quantitative detection of corrosion minerals in carbon steel using shortwave infrared hyperspectral imaging | |
| Agresti et al. | Colour modifications and hyperspectral imaging: non-invasive analysis of photo-degraded wood surfaces | |
| Lim et al. | Soil Water Content Regression Analysis of Measurement Data from Hyperspectral Camera in Weathered Granite Soils | |
| Ovadia | Behind the Painting: A Novel NDT Approach Based on Active Irt for Full Non-Destructive Detection, Identification, and Classification of Soluble Salts at the Subsurface: The Case of the Wall Painting at the Royal Box at Herodium |
Legal Events
| Date | Code | Title | Description |
|---|---|---|---|
| 121 | Ep: the epo has been informed by wipo that ep was designated in this application |
Ref document number: 08877534 Country of ref document: EP Kind code of ref document: A1 |
|
| WWE | Wipo information: entry into national phase |
Ref document number: 2010534620 Country of ref document: JP |
|
| NENP | Non-entry into the national phase |
Ref country code: DE |
|
| 122 | Ep: pct application non-entry in european phase |
Ref document number: 08877534 Country of ref document: EP Kind code of ref document: A1 |