US5183047A - Doppler flow velocity meter - Google Patents
Doppler flow velocity meter Download PDFInfo
- Publication number
- US5183047A US5183047A US07/697,892 US69789291A US5183047A US 5183047 A US5183047 A US 5183047A US 69789291 A US69789291 A US 69789291A US 5183047 A US5183047 A US 5183047A
- Authority
- US
- United States
- Prior art keywords
- flow velocity
- signal
- signals
- sub
- values
- Prior art date
- Legal status (The legal status is an assumption and is not a legal conclusion. Google has not performed a legal analysis and makes no representation as to the accuracy of the status listed.)
- Expired - Fee Related
Links
- 238000012545 processing Methods 0.000 claims abstract description 22
- 239000012530 fluid Substances 0.000 claims abstract description 17
- 239000002245 particle Substances 0.000 claims abstract description 13
- 230000004044 response Effects 0.000 claims abstract description 8
- 230000000875 corresponding effect Effects 0.000 claims description 26
- 238000001228 spectrum Methods 0.000 claims description 22
- 108010076504 Protein Sorting Signals Proteins 0.000 claims description 17
- 230000009466 transformation Effects 0.000 claims description 11
- 238000004364 calculation method Methods 0.000 claims description 6
- 230000002596 correlated effect Effects 0.000 claims description 5
- 230000001678 irradiating effect Effects 0.000 claims 1
- 238000011156 evaluation Methods 0.000 abstract description 4
- 238000000034 method Methods 0.000 description 37
- 238000005259 measurement Methods 0.000 description 13
- 238000004458 analytical method Methods 0.000 description 12
- 238000010586 diagram Methods 0.000 description 11
- 230000000737 periodic effect Effects 0.000 description 7
- 230000010363 phase shift Effects 0.000 description 5
- 230000008569 process Effects 0.000 description 5
- 230000006870 function Effects 0.000 description 4
- 238000004519 manufacturing process Methods 0.000 description 4
- 230000005540 biological transmission Effects 0.000 description 3
- 239000000919 ceramic Substances 0.000 description 3
- 238000009826 distribution Methods 0.000 description 3
- 238000002592 echocardiography Methods 0.000 description 3
- 239000008280 blood Substances 0.000 description 2
- 210000004369 blood Anatomy 0.000 description 2
- 230000000295 complement effect Effects 0.000 description 2
- 230000000694 effects Effects 0.000 description 2
- 230000010355 oscillation Effects 0.000 description 2
- 230000002123 temporal effect Effects 0.000 description 2
- 238000000411 transmission spectrum Methods 0.000 description 2
- 238000007792 addition Methods 0.000 description 1
- 230000003321 amplification Effects 0.000 description 1
- ODKSFYDXXFIFQN-UHFFFAOYSA-M argininate Chemical compound [O-]C(=O)C(N)CCCNC(N)=N ODKSFYDXXFIFQN-UHFFFAOYSA-M 0.000 description 1
- 230000008901 benefit Effects 0.000 description 1
- 210000004204 blood vessel Anatomy 0.000 description 1
- 230000008030 elimination Effects 0.000 description 1
- 238000003379 elimination reaction Methods 0.000 description 1
- 238000005516 engineering process Methods 0.000 description 1
- -1 for example Substances 0.000 description 1
- 230000010354 integration Effects 0.000 description 1
- 238000005304 joining Methods 0.000 description 1
- 238000012423 maintenance Methods 0.000 description 1
- 239000000203 mixture Substances 0.000 description 1
- 238000003199 nucleic acid amplification method Methods 0.000 description 1
- 230000005855 radiation Effects 0.000 description 1
- 230000011218 segmentation Effects 0.000 description 1
- 230000035945 sensitivity Effects 0.000 description 1
- 230000001629 suppression Effects 0.000 description 1
- 230000001360 synchronised effect Effects 0.000 description 1
- 230000003313 weakening effect Effects 0.000 description 1
Images
Classifications
-
- G—PHYSICS
- G01—MEASURING; TESTING
- G01P—MEASURING LINEAR OR ANGULAR SPEED, ACCELERATION, DECELERATION, OR SHOCK; INDICATING PRESENCE, ABSENCE, OR DIRECTION, OF MOVEMENT
- G01P5/00—Measuring speed of fluids, e.g. of air stream; Measuring speed of bodies relative to fluids, e.g. of ship, of aircraft
- G01P5/24—Measuring speed of fluids, e.g. of air stream; Measuring speed of bodies relative to fluids, e.g. of ship, of aircraft by measuring the direct influence of the streaming fluid on the properties of a detecting acoustical wave
- G01P5/241—Measuring speed of fluids, e.g. of air stream; Measuring speed of bodies relative to fluids, e.g. of ship, of aircraft by measuring the direct influence of the streaming fluid on the properties of a detecting acoustical wave by using reflection of acoustical waves, i.e. Doppler-effect
- G01P5/244—Measuring speed of fluids, e.g. of air stream; Measuring speed of bodies relative to fluids, e.g. of ship, of aircraft by measuring the direct influence of the streaming fluid on the properties of a detecting acoustical wave by using reflection of acoustical waves, i.e. Doppler-effect involving pulsed waves
Definitions
- the present invention relates to a Doppler measuring device for measuring flow velocity of a fluid carrying particles which reflect ultrasonic waves.
- a Doppler flow velocity meter may include:
- an ultrasonic transducer for the radiation of fluid with ultrasonic wave pulses in response to corresponding transmit pulses which are fed to it with a predetermined pulse repetition rate, for receiving echo signals reflected in the fluid by the particles and for the emission of corresponding echo signals; b) a transmitter linked to the ultrasonic transducer for the production of transmit pulses which excite the ultrasonic transducer to emit ultrasonic wave pulses; (c) a receiver connected to the ultrasonic transducer for receiving and processing echo signals which correspond to at least two different echo waves which are reflected by the particles in a set point of the flow path in response to a first and a second pulse of the transmitted wave, in which adjacent but separate frequency bands of the echo signals are each processed in a separate signal processing channel; (d) an evaluator unit connected to the receiver output, by which an output signal is derived from the Doppler information obtained with the receiver, this signal corresponding to the flow velocity.
- a pulsed Doppler procedure By a pulsed Doppler procedure the flow velocity of a fluid, for example, blood carrying particles which reflect ultrasonic waves is measured in an element of determined set volume.
- a series of ultrasonic pulses are transmitted by a transducer. Each time, at a time ⁇ after the transmit pulse, a receiving gate is opened for a brief time for which,
- f D is the Doppler frequency
- c sound velocity f 1 the frequency of the ultrasonic signal transmitted
- ⁇ the angle between the sound radius and the direction of velocity.
- f D is the difference between the frequency of the signal received and the frequency of the signal transmitted.
- the echo signal is periodically analysed, that is to say that it is measured only in periodic rest points. According to the Nyquist theorem therefore the maximum univocally measurable Doppler frequency and thus the maximum univocally measurable velocity are limited.
- c is the velocity of sound
- f 1 the ultrasonic frequency
- d the depth and ⁇ the angle between the sonic radius and the direction of the velocity.
- V max becomes larger. Consequently however the space resolution and the sensitivity of the procedure are reduced, because at lower frequency less power is redispersed. In practice therefore the lower frequency limit employed is at about 2 MHz.
- the normal measuring range lies between -V max and +V max .
- f 1 and f 2 are the average frequencies of the frequency band.
- the object of the present invention is that of providing a Doppler meter of the aforementioned type, by which measurement of the time distribution of flow velocity can be carried out, in which the measurement range where the flow velocity is univocally measured, is notably broadened.
- a Doppler meter of the aforementioned type according to the present invention is characterised in that (e) the receiver contains the following means:
- e.1 means comprised in each of the signal processing channels for the realisation of a demodulation of quadrature of the echo signals received from the ultrasonic transducer in each of the frequency bands, by which at the output of each of the signal processing channels a couple of quadrature signals are obtained each time defining a complex measured value (P(0), P( ⁇ t), P(2 ⁇ t) . . . );
- the transmitter is set up so that the sequence spectrum of the periodic sequence of the transmit pulses consists of two adjacent but separate frequency bands.
- the means for the evaluation of the signal sequence preferably contains means for carrying out analysis of a signal sequence which is composed of signals corresponding to complex measured and calculated values, (P(0), P( ⁇ t/2), P( ⁇ t), P(3 ⁇ t/2), P(2 ⁇ t), . . . ) in which by these analyses a second output signal is produced the amplitude of which corresponds to the phase variation of an indicator defined by signals of the signal sequence and therefore corresponds to the instantaneous value of the flow velocity.
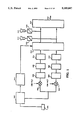
- FIG. 1 shows a block diagram representing the principle structure of a Doppler flow velocity meter according to the present invention
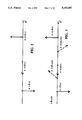
- FIGS. 2 and 3 are diagrams which to illustrate the computer unit 213 in FIG. 1;
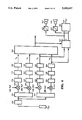
- FIG. 4 is a first embodiment of the Doppler flow velocity meter of the present invention according to FIG. 1;
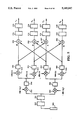
- FIG. 5 is a second embodiment of the Doppler flow velocity meter of the present invention according to FIG. 1;
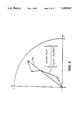
- FIG. 6 shows the indicator graphs
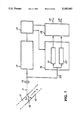
- FIG. 7 is a block diagram of a Doppler flow velocity meter
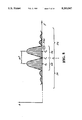
- FIG. 8 shows the frequency spectrum of a sequence of transmit pulses with a waveform according to FIG. 9;
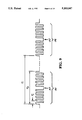
- FIG. 9 shows transmit pulses
- FIG. 10 is one of the block diagrams of a first embodiment of the transmitter 15 in FIG. 7;
- FIG. 11 is a block diagram of the register 43 in FIG. 10;
- FIG. 12 shows signal diagrams for the illustration of the transmitter operation according to FIG. 10;
- FIG. 13 is a block diagram of a second embodiment of the transmitter 15 in FIG. 7;
- FIG. 14 is a diagram of the input signal of the gate circuit 84 in FIG. 13;
- FIGS. 15 and 16 show transmit pulses
- FIG. 17 is a schematic representation of the frequency spectrum of a sequence of transmit pulses with a waveform according to FIGS. 15 or 16.
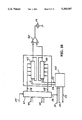
- FIG. 1 shows a very simplified block diagram which represents the principle structure of a Doppler velocity meter according to the present invention.
- An ultrasonic transducer 201 connected to a receiving transmitter 202 sends transmit pulses having a spectrum consisting of two adjacent but separate frequency bands. These transmit pulses and devices for producing them are described in full detail making reference to FIGS. 7 to 17.
- the arrangement in FIG. 1 has two separate channels for processing the echo signals received. In the upper channel which is formed by a circuit 203, echo signals are processed in the two frequency bands of transmit pulses and at the output of this channel an output signal is obtained which corresponds to an average value of the flow velocity in an analysed point of the flow's path. This average value has an upper limit v a max which is given in equation 4.
- an average value of the flow velocity is measurable in a greater measurement range with respect to conventional Doppler procedures.
- echo signals from 4 to 8 transmitted pulses (which is more than sufficient) are processed in the usual way.
- the lower channel in FIG. 1 is a conventional pulsed Doppler channel at the frequency f 1 consisting of two quadrature demodulators 204 and 205 which mix the signal with the signals of the form sin ⁇ 1 t and cos ⁇ 1 t with successive low pass filters 206, 207, integrator and holding circuits 208, 209 which analyse the signal at the desired time and successive fixed echo erasers 211, 212 for the elimination of stationary and almost stationary echo signals.
- a quadrature signal a(t) is transmitted, and a quadrature signal b(t) is transmitted from the output of the fixed echo eraser 212.
- the signals a(t) and b(t) are continuous signals. For the subsequent analysis however only the values of these signals at the times in which the signal is determined must be considered. These times are 0, ⁇ t, 2 ⁇ t and therefore have the signal values
- ⁇ t is the time between transmit pulses
- a(k ⁇ t) and b(k ⁇ t) are measured values. These values can be considered as the real and imaginary parts of the complex signal
- Pairs of successive signals a(k ⁇ t), b(k ⁇ t) thus each time define a complex measured value of P(0), P( ⁇ t), P(2 ⁇ t)+P(3 ⁇ t)
- the velocity values can be derived from the phase variation p which with time have the normal higher velocity limit v max according to equation (3).
- the output signal of the computer unit 203 and the signals a(k ⁇ t) and b(k ⁇ t) are fed to the outputs of the fixed echo erasers 211 and 212, inputs of the computer unit 213.
- These signals are logically correlated in the computer unit 213 to obtain calculated values of signal pairs a'(k ⁇ t/2), b'(k ⁇ t/2) by interpolation which define complex calculated values P( ⁇ t/2), P(3 ⁇ t/2), P(5 ⁇ t/2); for these values the following equation is valid:
- the values a'(k ⁇ t/2), b'(k ⁇ t/2) are consistent with the average value v a of the flow velocity determined by the output signal of the computer unit 203 and with the measured values a(k ⁇ t), b(k ⁇ t) of the signals at the output of the constant sign erasers 211, 212. Between the successive pairs of signals, the measured values a(k ⁇ t), b(k ⁇ t) correspond, for example in the computer unit 213 one can produce a pair of signals a'(k ⁇ t/2), b'(k ⁇ t/2) which correspond to values calculated by interpolation. In the computer unit 213 two or more of these interpolated values can also be calculated between successive measured values.
- the corresponding pairs of signals are a'(k ⁇ t/3), b'k ⁇ t/3). If two interpolated values are calculated, then the corresponding pairs of signals are a'(k ⁇ t/[n+1]), b'(k ⁇ t/[n+1]). k and n can have values 1, 2, 3 and so on.
- a sequence of signal pairs are transmitted which consist of pairs of measured signals a(k ⁇ t), b(k ⁇ t) and pairs of calculated signals a'(k ⁇ t/2), b'k ⁇ t/2).
- Each pair of signals of the signal sequence at the outputs of the computer unit 213 are fed to a computer unit 214 in which an analysis of the signal sequence is carried out, for example by a Fourier transformation, to produce an output signal of which the amplitude corresponds to a phase variation of an indicator defined by the signals of the signal sequence and thus corresponds to the instantaneous value of the flow velocity.
- the information contained in 64 up to 128 echo signals is considered. This number of echo signals is also substantially greater than the number of echo signals (from 4 to 8) of which the information content is considered for the calculation of the average value v a of the flow velocity in the computer unit 203.
- Each signal of a signal pair at the input of the computer unit 214 is also fed by an digital/analog converter to means 215 or 216 for the acoustic reproduction of the signal.
- the signals of the signal sequence which is composed of signals corresponding to measured values a(k ⁇ t), b(k ⁇ t), and calculated values a'(k ⁇ t/2), b'(k ⁇ t/2) have shorter time intervals between them than the signals corresponding to measured values a(k ⁇ t), b(k ⁇ t).
- the output signal of the computer unit 203 is fed to the computer unit 213, and this signal corresponds to the average value V of the flow velocity. From this average value it can be determined that the phase shift between the analysis values ⁇ amounts to +270°. It is therefore possible to interpolate the calculated values between the measured values of the signal.
- P( ⁇ t/2), P(3 ⁇ t/2), P(5 ⁇ t/2) are interpolated values.
- the interpolation of the values between the measured values, for which the average velocity information from a two frequency procedure is utilised, is an essential characteristic of the invention described here.
- the interpolation of the complex signal occurs in the polar representation, that is to say the quantity and phase are interpolated. From FIG. 3 it can be seen that the signal is now reproduced correctly; among the single values a phase shift is seen of +135° and among the measured values a phase shift of 270°. Since the number of complex values available in total is doubled by interpolation, the measurement range is also doubled.
- the signal sequence represented in FIG. 3 of the complex measured and calculated values are fed to the computer unit 214 which carries out a Fourier transformation.
- f s indicates the frequency of analysis. If n values are interpolated between the measured values, then the frequency of analysis is multiplied by (n+1). The new frequency limit f max is therefore
- a new upper velocity limit v max corresponding to f max can be derived from equation (3) as follows
- Equation (9) gives the number of the measured values which are preferably interpolated between the measured values.
- FIG. 4 shows a first embodiment of the Doppler flow velocity meter according to the present invention shown in FIG. 1.
- an ultrasonic transducer 201 connected to a transmitter-receiver 202 transmits transmit pulses of which the frequency spectrum consists of two adjacent but separate frequency bands. These transmit pulses and devices for producing them are described subsequently in full detail making reference to FIGS. 7 to 17.
- the reception signal obtained from the ultrasonic transducer 201 and the transmitter receiver 202 is introduced into two quadrature channels. One of these channels processes the echo signals in the frequency band with average frequency f 2 .
- the second quadrature channel processes the echo signals in the frequency band with average frequency f 1 .
- each of these quadrature channels consists of a band pass filter 221 or 222 followed by a synchronous demodulator, which contains multipliers 224, 225 or 226, 227.
- the output signals of the multipliers are filtered by means of low pass filters 231, 232, 233, 234, and analysed by integrated maintenance circuits 235, 236, 237, 238.
- the constant signed erasers 241, 242, 243, 244 connected in series serve for the suppression of stationary or almost stationary echoes.
- the output signals I 1 , Q 1 , I 2 , Q 2 of these constant sign erasers are introduced into the computer unit 203.
- the output signals I 1 , Q 1 of the constant sign erasers 243, 244 and the output signals of the computer unit 203 are processed in the computer unit 213 for producing as output signals a sequence of signal pairs I, Q which are made up of output signals I 1 and Q 2 and of signal pairs I' and Q' obtained by interpolation for one of the frequencies f 1 or f 2 .
- the signal sequence at the output of the computer unit 213 is fed to the computer unit 214 where the spectrum is calculated by means of a fast Fourier transformation according to a known algorithm.
- the computer units 203, 213, 214 are preferably realised with a digital signal processor, for example the AD 2100 processor of Analog Devices. The algorithms which are employed in the computer units 203 and 213 are described subsequently.
- the output signals of the computer unit 213 are converted by means of a digital/analog converter 215, 216 and are fed to two loudspeakers 217, 218. With this output signals which correspond to an enlarged measurement range of the flow velocity, are reproduced acoustically.
- FIG. 5 shows a second embodiment of the Doppler flow velocity meter according to the present invention shown in FIG. 1.
- the ultrasonic transducer 201 and the transmitter receiver 202 are already as described for FIGS. 1 and 4.
- With a band pass filter 251 the echo signals are filtered in the two frequency bands of the transmit signals, that is to say allowed to pass for the signal processing.
- the echo signal transmitted by the band pass filter 251 is first demodulated by means of the multipliers 252 and 253 and the low pass filters 254 and 255 with cos ⁇ o t e-sin ⁇ o t in which
- the required quadrature signals I 1 , Q 1 , I 2 , Q 2 are therefore obtained from these signals by means of adders 265, 266, 267, 268 using suitable additions and subtractions, in which, as represented in FIG. 5, integration and holding circuits 271, 272, 273, 274 and constant sign erasers 275, 276, 277, 278 are employed in an analogous manner to the circuits according to FIGS. 1 and 4.
- the circuit according to FIG. 5 is more complicated than that of FIG. 4. It however offers the advantage that in the first quadrature demodulation the frequency of the transmit signal ⁇ o is employed. This is available with high stability.
- the processing of the signal which permits the achievement of the output signals I 1 , Q 1 , I 2 , Q 2 of the two quadrature channels is now explained hereinbelow.
- the signal received has a line spectrum.
- the distance between the single lines is the repetition frequency of the pulses, as known.
- one line s(t) of the spectrum is considered which has a Doppler shift:
- ⁇ d1 and ⁇ d2 are the Doppler frequency at ⁇ o - ⁇ and at ( ⁇ o + ⁇ ).
- Circuits for the further processing of the signals I 1 , Q 1 , I 2 , Q 2 are as already described with reference to FIG. 4. These circuits therefore are not shown in FIG. 5.
- the average velocity is calculated according to the two frequency procedure.
- the computer unit 213 further signal values of a Doppler path are interpolated as described above with reference to FIGS. 2 and 3. The algorithms for these calculations must be described here.
- the computer unit 214 calculates a fast Fourier transformation with the use of algoritms which are sufficiently well known and are therefore not described.
- Equations (25) and (26) define two complex indicators which rotate with the angular Doppler velocity ⁇ d1 or ⁇ d2 .
- ⁇ d1 the angular Doppler velocity
- Equations (25) and (26) define two complex indicators which rotate with the angular Doppler velocity ⁇ d1 or ⁇ d2 .
- ⁇ 1 is the phase difference between P 1 (t+ ⁇ t) and P 1 (t). This phase difference can be determined by a complex multiplication.
- the indicator P 1N is normalised, in which /P 1N / is in the range from equal to or greater than 0 up to equal to or greater than 1, that is
- the length of the indicator P 1N is a measurement of the signal quality.
- the indicators which are considered in the calculation of P 1N are represented in FIG. 6. If all the indicators summed are in the same direction, /P 1N / ⁇ 1.
- ⁇ is univocal in a range of equal or greater than - ⁇ up to equal or less than ⁇ , and that corresponds to the Nyquist range.
- the univocal measurement range of v a is increased, since ⁇ is much smaller than ⁇ 1 and ⁇ 2 .
- N can have for example values from 4 to 8.
- Interpolation serves to modify the Doppler signal to a determined frequency in order that the univocal measurement range of V is increased. As described above with reference to FIGS. 2 and 3, this is obtained by the fact that further values are interpolated between these measurement values. As an example here the interpolation of a value between two measured values of the signal P 1 (t) at the frequency ⁇ 1 .
- the measured signal P 1 (t) consists of the values
- the average value v a of the velocity v a is utilised, which is calculated by the two frequency procedure, as seen from equation 37.
- v a one can calculate a phase ⁇ 1 according to equation 34.
- the signal sequence consisting of signals which correspond to the measured values or the values interpolated between these, are fed to the computer unit 214 in which a fast Fourier transformation is calculated.
- the average velocity value is determined from relatively few values, typically from 4 to 8 values.
- the Fourier transformation is on the contrary calculated from a substantially greater number of values. It is therefore certainly possible that the average frequency and therefore the average value of the velocity varies along the signal sequence, along which the Fourier transformation is calculated. This signifies that the frequency range of the Fourier transformation can be greater than the original Nyquist range. This is a further difference with respect to the abovementioned tracking procedures. These work only when the width of the signal band is less than the original Nyquist range.
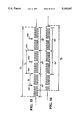
- FIG. 7 shows the block diagram of a Doppler Flow Velocity Meter for the measuring of flow velocity in a fluid 11 carrying particles 12 which reflect ultrasonic waves.
- the fluid can for example be blood which flows through a blood vessel.
- the principle of this device is described in the published German Patent Application DE-A-2 406 630 and the corresponding U.S. Pat. No. 3,914,999.
- a fluid 11 which flows for example through a tube 13 is irradiated with at least two successive ultrasonic pulses transmitted from a transducer 14, the echoes shifted by the corresponding Doppler frequency by reflectors (for example particles) in the fluid along the ultrasonic beam are received by the same transducer 14, and from the phase difference between echoes having the same transit time of the first and second transmitted ultrasonic pulses by means of suitable processing in an evaluator 18 an output signal is produced of which the temporal pace corresponds to the velocity profile of the fluid in the section examined.
- the device contains an ultrasonic transducer 14, a transmitter 15, a receiver 16, a central control unit 17 and an evaluator 18.
- the ultrasonic transducer 14 irradiates the fluid 11 with ultrasonic wave pulses in response to the corresponding transmit pulses which are fed with a predetermined pulse repetition frequency.
- the transducer 14 also receives the echo waves reflected by the particles in the fluid and transmits the corresponding echo signals.
- the transducer 14 is for example an ultrasonic transducer with the following technical data:
- the transmit frequency must be preferably of about 3.0 MHz.
- Diameter of the circular ceramic 13 mm
- the transmitter 15 is connected with the ultrasonic transducer 14 and serves for the production of the transmit pulses with which the ultrasonic transducer is excited for the emission of the ultrasonic wave pulses.
- the echo signals are processed which correspond to at least two groups of echo signals, which are reflected by the particles in the fluid in response to a first and to a second pulse of the emitted wave.
- Adjacent but separate frequency bands of echo signals are processed in the receiver 16 each in a separate signal processing channel 21 or 22.
- At least one output signal which contains information on the flow velocity is derived from the Doppler information obtained with the receiver.
- the central control unit 17 produces all the control and timing signals which are necessary for a programmable operation of the Doppler meter.
- the control unit 17 is therefore substantially a programmable digital signal generator.
- the most important functions of the central control unit 17 are as follows:
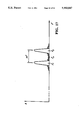
- the transmitter 15 is designed so that the frequency spectrum of the sequence with which the periodic achievement of transmit pulses consists of two adjacent but separate frequency bands 31 and 32 which are represented in FIG. 8. Since the transmit pulses are emitted periodically with the frequence of the pulse repetition, the spectrum of the transmit signal frequency consists of a network of frequency lines with the distance between the lines corresponding to the pulse repetition frequency. By means of the form or the conformation of the frequency spectrum of the transmit signal, the result is that most of the energy sent is concentrated in these frequency bands around two frequencies f 1 or f 2 .
- the frequency bands 31 or 32 are so close to each other that they can be radiated by the same ultrasonic transducer and undergo about the same weakening of the structure.
- the majority of the energy emitted is concentrated in two adjacent frequency bands 33 or 34, in which the carrier frequency f 0 defines the limit between these bands and in which f 1 is the average frequency of the frequency band 33 and f 2 the frequency of the average frequency band 34.
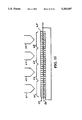
- FIG. 9 shows an example of two successive transmit pulses 35 or 36.
- the sequence emitted by these transmit pulses has a transmission spectrum according to FIG. 8.
- the transmit pulses sent to the transducer have for example a voltage which is between 50 and 100 Volts.
- each transmit pulse deviates from a periodic rectangular signal because that the signal has a point 37 at the centre in which a phase inversion occurs.
- This phase inversion is necessary in order that the periodic sequence of the transmit pulses has a frequency spectrum according to FIG. 8.
- FIGS. 15 and 16 show two further examples of transmit pulses.
- the transmit pulse according to FIG. 15 is composed of three elements of transmit pulse, in which each element has the pace of the transmit pulse 35 according to FIG. 9.
- the transmit pulse according to FIG. 16 contains two entire transmit pulse elements with the pace of the transmit pulse 35 according to FIG. 9 and at the beginning and end, parts of one such element of transmit pulse.
- the transmit pulse according to FIG. 16 contains a little less than 3 whole transmit pulse elements, its duration is a little shorter that the duration of the transmit pulse according to FIG. 15. As is shown in FIG. 16, the transmit pulse can start in correspondence with a desired edge of a transmit pulse element.
- the transmit pulses according to FIGS. 15 and 16 contain points of phase inversion 181-185, in which each of the phase inversion points 181, 183, 185 correspond to phase inversion point 37 of FIG. 9, while the phase inversion points 182, 184 form by the joining of two elements of the signal pulse.
- the transmit pulses are produced by temporal segmentation of a signal in itself continuous, which possesses periodically distributed phase inversion points.
- FIG. 17 shows a schematic representation of the frequency spectrum of a sequence of transmit pulses which has the waveform shown in FIG. 15 or in FIG. 16.
- the frequency spectrum according to FIG. 17 for a sequence of transmit pulses which each contain various elements of transmit pulse it can be seen that by the utilisation of these said transmit pulses according to FIGS. 15 and 16 a stronger concentration can be obtained of the energy of the ultrasonic waves emitted in narrower frequency bands around the frequencies f 1 and f 2 , in which the distance f is equal as in FIG. 8.
- the period of the points of phase inversion that is to say the time interval between the inversion points of equivalent phases, is indicated with T u , in which T u is equal to 2/ ⁇ f. This follows also for the transmit pulse according to FIG. 16.
- the transmit signal consists of a sequence of transmit pulses of the duration T p , and T p as in FIGS. 15 and 16 it is much bigger than T u , the position of the start of the transmit pulses and its end are not obligatory with respect to the position of the inversion points of the phases contained in it.
- the duration T p of the transmit pulse is preferably greater than the period T u of the points of phase inversion.
- T p must be choosen so that it is greater than T u .
- the greater T p is with respect to T u , the stronger the concentration of the energy emitted around the lateral band average frequency f 1 and f 2 in the frequency spectrum of the transmit signal.
- FIG. 10 shows a first embodiment of the transmitter 15 in FIG. 7.
- This embodiment consists substantially of digital components.
- the transmitter circuit according to FIG. 10 includes a control interface 41, a control unit 42, two scroll registers and a power amplifier 45 the output of which is connected to the ultrasonic transducer 14 in FIG. 7.
- transmit pulses are produced according to FIG. 9 in which the transmitted periodic sequence of the transmit pulses has a frequency spectrum according to FIG. 8.
- the necessary signals are fed to the control interface 41 by lines 39, 56, 51, an address bus 46 and a data bus 47.
- the interface 41 is connected to the registers 43 or 44 by lines 48 or 49.
- the outputs of the registers 43 or 44 are each connected to an input of the power amplifier 45.
- the control unit 42 is connected by lines 51, 52, 53 to the central control unit 17 in FIG. 7.
- the control unit 42 is also connected by a line 56 to the interface 41 and by lines 54 or 55 to the registers 43 or 44.
- the registers 43 and 44 have the same structure and corresponding connections. These registers are however loaded with different but complementary bytes.
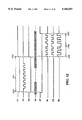
- FIG. 11 shows a schematic representation of the register 43 in FIG. 10. As shown in FIG. 11, in this register four bytes (words) 65, 66, 67, 68 are loaded by corresponding lines of buses 61, 62, 63, and 64 in register 43. The content of these bytes is represented in the memory cells of register 43 in FIG. 11.
- each of the registers 43 and 44 have a feed-back from its output to its input. As described subsequently in greater detail, this is important for the suitable operation of the transmitter circuit according to FIG. 10. It is equally important that the contents of the registers 43, 44 are complementary, that is to say that for example 101010 . . . is stored in Register 43 and 010101 . . . in Register 44.
- the control interface 41 serves to program the control unit 42 and the scroll registers 43 and 44.
- the interface receives from the address or data buses 46, 47 and from line 39 the associated stroboscopic signal 72 in FIG. 12 from the bus of the decodified microprocessor of the principle system according to FIG. 7.
- the signal 72 is a timing signal which effects loading of bytes supplied in the registers 43, 44.
- the interface 41 receives a further signal 71 from lines 51 and 56. The loading of the provided bytes is possible only in the time interval 171 in which the signal 71 has the state shown.
- a further signal 73 is produced which is fed to the registers by lines 54 or 55.
- control unit 42 By means of line 52 the control unit 42 also receives a timing signal from the central control unit 17 in FIG. 7. In response to this timing signal, the control unit 42 produces a corresponding timing signal 74 which is fed to the registers 43 or 44 by means of the lines 54 or 55.
- the interval 171 provided for the loading of registers 43 or 44 lasts between the times 172 or 173, in which a variation of the state of signals 71 and 73 is verified each time.
- a scroll cycle begins in the registers 43 or 44.
- an output signal 76 or 77 is produced in each of the outputs of the registers 43 or 44.
- the difference of these output signals 76 and 77 is established and in this manner a transmit pulse 78 is produced which has the desired pace according to FIG. 9.
- the scroll cycle in registers 43 or 44 is extended on a time interval 176 which lasts from time 174 until time 175.
- the duration of the time interval 176 and therefore the duration of the transmit pulse 78 is determined by a counter contained in the control unit 42, which at time 175 effects a signal variation that marks the end of the transmit pulse 78.
- the signal 75 is transmitted by means of a line 53 of the control unit 42 at the central control unit 17 in FIG. 7.
- the registers 43 or 44 are scroll registers with the structures shown in FIG. 11 for the register 43. As shown here, each of these registers has 4 ⁇ 8 memory cells each for a byte, which are loaded by means of the interface 41 with 4 bytes each of 8 bits. As already described above, subsequently the 32 bit long sample (transmit sample) is moved to an input of the power amplifier 45. By means of the feed-back of the output to the input of the register it is possible to carry out the scroll cycle for as long as desired.
- the transmit circuit just described according to the FIG. 10 is preferred since it consists predominantly of relatively economical digital components, and since it permits a flexible conformation of the frequency spectrum of the transmit pulses by means of relatively simple variations of the operational parameters.
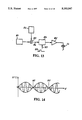
- a transmission circuit according to FIG. 13 can be employed, which substantially consists of a modulator with amplitude modulation, an electronic switch and a power amplifier.
- the transmitter circuit according to FIG. 10 contains a multiplier 83, a pilotable electronic gate circuit 84 and a power amplifier 85 of which the output is connected to the ultrasonic transducer 14 in FIG. 7. With the multiplier 83 the carrier signal supplied by the oscillator 81 is multiplied by the modulation signal produced by the oscillator 82 to obtain an output signal which is represented in FIG. 14. As can be seen from FIG.
- the amplitude modulated signal produced in this manner is the result of a conventional amplitude modulation.
- This amplitude modulated signal is fed by means of a line 86 to the input of the gate circuit 84.
- a pulse 88 which is supplied by the central control unit 17 in FIG. 7, is fed by means of a line 87 to a second input of the gate circuit to allow the amplitude modulated signal to pass to the input of the gate circuit 84 at set time intervals.
- transmit pulses are produced with after an amplification in the power amplifier 85 are fed to the ultrasonic transducer 14.
- the duration of the pulse 88 in FIG. 13 determines the duration of the transmit pulse.
- the waveform produced by the amplitude modulation at the input of the gate circuit 84 has points of periodic phase inversion 89.
- the transmit pulses produced by the output of the gate circuit 84 contain one such point of inversion of phase 89. In this way (as in the case of the transmit pulses according to FIG. 9), one ensures that the transmit pulses fed to the ultrasonic transducer have a frequency spectrum according to FIG. 8.
Landscapes
- Physics & Mathematics (AREA)
- Engineering & Computer Science (AREA)
- Acoustics & Sound (AREA)
- Multimedia (AREA)
- Aviation & Aerospace Engineering (AREA)
- General Physics & Mathematics (AREA)
- Measuring Volume Flow (AREA)
- Ultra Sonic Daignosis Equipment (AREA)
Applications Claiming Priority (2)
| Application Number | Priority Date | Filing Date | Title |
|---|---|---|---|
| CH172090 | 1990-05-21 | ||
| CH1720/90 | 1990-05-21 |
Publications (1)
| Publication Number | Publication Date |
|---|---|
| US5183047A true US5183047A (en) | 1993-02-02 |
Family
ID=4217027
Family Applications (1)
| Application Number | Title | Priority Date | Filing Date |
|---|---|---|---|
| US07/697,892 Expired - Fee Related US5183047A (en) | 1990-05-21 | 1991-05-09 | Doppler flow velocity meter |
Country Status (5)
| Country | Link |
|---|---|
| US (1) | US5183047A (de) |
| EP (1) | EP0458392B1 (de) |
| JP (1) | JP2836989B2 (de) |
| DE (1) | DE59106185D1 (de) |
| ES (1) | ES2077788T3 (de) |
Cited By (10)
| Publication number | Priority date | Publication date | Assignee | Title |
|---|---|---|---|---|
| US5349524A (en) * | 1993-01-08 | 1994-09-20 | General Electric Company | Color flow imaging system utilizing a time domain adaptive wall filter |
| US5777892A (en) * | 1992-03-30 | 1998-07-07 | Isco, Inc. | Doppler shift velocity measuring system with correction factors |
| US5891038A (en) * | 1996-12-30 | 1999-04-06 | General Electric Company | Method, apparatus and applications for combining transmit wave functions to obtain synthetic waveform in ultrasonic imaging system |
| US6179781B1 (en) | 1999-03-31 | 2001-01-30 | Acuson Corporation | Medical diagnostic ultrasound method and apparatus for improving doppler processing |
| US6364838B1 (en) * | 2000-01-11 | 2002-04-02 | Siemens Medical Soulutions, Usa, Inc. | Pulsed wave doppler processing using aliased spectral data |
| US20040111027A1 (en) * | 1999-08-23 | 2004-06-10 | Hans Torp | Method and apparatus for providing real-time calculation and display of tissue deformation in ultrasound imaging |
| US20070063577A1 (en) * | 2003-06-26 | 2007-03-22 | Campagnolo S.R.I. | Lightened rim for a bicycle wheel and method for manufacturing such a rim |
| US20080156106A1 (en) * | 2006-10-13 | 2008-07-03 | Shenzhen Mindray Bio-Medical Electronics Co., Ltd. | Method and apparatus for dealiasing Doppler signals |
| US20090131837A1 (en) * | 2005-04-23 | 2009-05-21 | Smith & Nephew, Plc | Ultrasound Device |
| CN102240214A (zh) * | 2010-05-12 | 2011-11-16 | 株式会社东芝 | 超声波诊断装置 |
Families Citing this family (6)
| Publication number | Priority date | Publication date | Assignee | Title |
|---|---|---|---|---|
| NO944736D0 (no) * | 1994-12-07 | 1994-12-07 | Vingmed Sound As | Fremgangsmåte for bestemmelse av blodhastighet |
| ES2242996T3 (es) | 1997-03-07 | 2005-11-16 | THE PROCTER & GAMBLE COMPANY | Composiciones de blanqueo. |
| KR101158792B1 (ko) * | 2010-12-02 | 2012-06-22 | 아이에스테크놀로지 주식회사 | 신호의 믹싱기법을 이용한 코히어런트 도플러 유속분포 측정 방법 및 장치 |
| JP2017215171A (ja) * | 2016-05-30 | 2017-12-07 | 国立研究開発法人産業技術総合研究所 | 流速分布の計測方法及びその装置 |
| CN111650397A (zh) * | 2020-04-02 | 2020-09-11 | 浙江清环智慧科技有限公司 | 超声波回波信号的处理方法、装置、流量计及存储介质 |
| CN113805852B (zh) * | 2021-09-24 | 2022-05-27 | 北京连山科技股份有限公司 | 一种提高数据安全性的方法 |
Citations (4)
| Publication number | Priority date | Publication date | Assignee | Title |
|---|---|---|---|---|
| US4966153A (en) * | 1988-04-22 | 1990-10-30 | Matsushita Electric Industrial Co., Ltd. | Ultrasonic doppler blood flow velocity detection apparatus and a method for detecting blood flow velocity |
| US4979513A (en) * | 1987-10-14 | 1990-12-25 | Matsushita Electric Industrial Co., Ltd. | Ultrasonic diagnostic apparatus |
| US5035245A (en) * | 1988-05-23 | 1991-07-30 | Matsushita Electric Industrial Co., Ltd. | Ultrasonic Doppler blood flow velocity detection apparatus |
| US5046500A (en) * | 1988-10-03 | 1991-09-10 | Kontron Instruments Holding N.V. | Doppler flow velocity meter |
Family Cites Families (2)
| Publication number | Priority date | Publication date | Assignee | Title |
|---|---|---|---|---|
| FR2562675B1 (fr) * | 1984-04-06 | 1989-10-13 | Cgr Ultrasonic | Procede de levee d'ambiguite de la mesure par effet doppler de la vitesse d'un mobile |
| JPS6125534A (ja) * | 1984-07-16 | 1986-02-04 | 横河メディカルシステム株式会社 | 画像診断装置 |
-
1991
- 1991-05-09 US US07/697,892 patent/US5183047A/en not_active Expired - Fee Related
- 1991-05-11 DE DE59106185T patent/DE59106185D1/de not_active Expired - Fee Related
- 1991-05-11 ES ES91201148T patent/ES2077788T3/es not_active Expired - Lifetime
- 1991-05-11 EP EP91201148A patent/EP0458392B1/de not_active Expired - Lifetime
- 1991-05-21 JP JP3115870A patent/JP2836989B2/ja not_active Expired - Lifetime
Patent Citations (4)
| Publication number | Priority date | Publication date | Assignee | Title |
|---|---|---|---|---|
| US4979513A (en) * | 1987-10-14 | 1990-12-25 | Matsushita Electric Industrial Co., Ltd. | Ultrasonic diagnostic apparatus |
| US4966153A (en) * | 1988-04-22 | 1990-10-30 | Matsushita Electric Industrial Co., Ltd. | Ultrasonic doppler blood flow velocity detection apparatus and a method for detecting blood flow velocity |
| US5035245A (en) * | 1988-05-23 | 1991-07-30 | Matsushita Electric Industrial Co., Ltd. | Ultrasonic Doppler blood flow velocity detection apparatus |
| US5046500A (en) * | 1988-10-03 | 1991-09-10 | Kontron Instruments Holding N.V. | Doppler flow velocity meter |
Cited By (20)
| Publication number | Priority date | Publication date | Assignee | Title |
|---|---|---|---|---|
| US5777892A (en) * | 1992-03-30 | 1998-07-07 | Isco, Inc. | Doppler shift velocity measuring system with correction factors |
| US5349524A (en) * | 1993-01-08 | 1994-09-20 | General Electric Company | Color flow imaging system utilizing a time domain adaptive wall filter |
| US5891038A (en) * | 1996-12-30 | 1999-04-06 | General Electric Company | Method, apparatus and applications for combining transmit wave functions to obtain synthetic waveform in ultrasonic imaging system |
| US6179781B1 (en) | 1999-03-31 | 2001-01-30 | Acuson Corporation | Medical diagnostic ultrasound method and apparatus for improving doppler processing |
| US7798965B2 (en) | 1999-08-23 | 2010-09-21 | G.E. Vingmed Ultrasound As | Method and apparatus for providing real-time calculation and display of tissue deformation in ultrasound imaging |
| US20040111027A1 (en) * | 1999-08-23 | 2004-06-10 | Hans Torp | Method and apparatus for providing real-time calculation and display of tissue deformation in ultrasound imaging |
| US20040176687A1 (en) * | 1999-08-23 | 2004-09-09 | Hans Torp | Method and apparatus for providing real-time calculation and display of tissue deformation in ultrasound imaging |
| EP1079240A3 (de) * | 1999-08-23 | 2004-12-29 | GE Vingmed Ultrasound AS | Verfahren und Vorrichtung zur Verfügungsstellung von EchtzeitRechnung und Anzeige von Gewebedeformation bei Ultraschallbilderzeugung |
| US20050203390A1 (en) * | 1999-08-23 | 2005-09-15 | Hans Torp | Method and apparatus for providing real-time calculation and display of tissue deformation in ultrasound imaging |
| US7077807B2 (en) | 1999-08-23 | 2006-07-18 | G.E. Vingmed Ultrasound As | Method and apparatus for providing real-time calculation and display of tissue deformation in ultrasound imaging |
| US7261694B2 (en) | 1999-08-23 | 2007-08-28 | G.E. Vingmed Ultrasound As | Method and apparatus for providing real-time calculation and display of tissue deformation in ultrasound imaging |
| US6364838B1 (en) * | 2000-01-11 | 2002-04-02 | Siemens Medical Soulutions, Usa, Inc. | Pulsed wave doppler processing using aliased spectral data |
| US20070063577A1 (en) * | 2003-06-26 | 2007-03-22 | Campagnolo S.R.I. | Lightened rim for a bicycle wheel and method for manufacturing such a rim |
| US20090131837A1 (en) * | 2005-04-23 | 2009-05-21 | Smith & Nephew, Plc | Ultrasound Device |
| US20080156106A1 (en) * | 2006-10-13 | 2008-07-03 | Shenzhen Mindray Bio-Medical Electronics Co., Ltd. | Method and apparatus for dealiasing Doppler signals |
| US8147412B2 (en) * | 2006-10-13 | 2012-04-03 | Shenzhen Mindray Bio-Medical Electronics Co., Ltd. | Ultrasound doppler dealiasing without zero insertion |
| CN102240214A (zh) * | 2010-05-12 | 2011-11-16 | 株式会社东芝 | 超声波诊断装置 |
| EP2386873A1 (de) * | 2010-05-12 | 2011-11-16 | Kabushiki Kaisha Toshiba | Ultraschalldiagnosegerät |
| US8652049B2 (en) | 2010-05-12 | 2014-02-18 | Kabushiki Kaisha Toshiba | Ultrasonic diagnostic apparatus |
| CN102240214B (zh) * | 2010-05-12 | 2016-06-22 | 株式会社东芝 | 超声波诊断装置 |
Also Published As
| Publication number | Publication date |
|---|---|
| EP0458392A3 (en) | 1992-12-16 |
| DE59106185D1 (de) | 1995-09-14 |
| EP0458392B1 (de) | 1995-08-09 |
| JP2836989B2 (ja) | 1998-12-14 |
| EP0458392A2 (de) | 1991-11-27 |
| JPH05340952A (ja) | 1993-12-24 |
| ES2077788T3 (es) | 1995-12-01 |
Similar Documents
| Publication | Publication Date | Title |
|---|---|---|
| US5183047A (en) | Doppler flow velocity meter | |
| US6095980A (en) | Pulse inversion doppler ultrasonic diagnostic imaging | |
| EP0150997B1 (de) | Einrichtung zum Messen und Darstellen eines Mediums mit Hilfe von Ultraschall | |
| US5177691A (en) | Measuring velocity of a target by Doppler shift, using improvements in calculating discrete Fourier transform | |
| JP2637439B2 (ja) | 流体分布検出装置 | |
| JP2544342B2 (ja) | 超音波ドップラ―診断装置 | |
| GB1451286A (en) | Method and apparatus for the measurement of fluid-flow velocity | |
| JPS6122907B2 (de) | ||
| US4534357A (en) | Multiple demodulation frequency Doppler | |
| US5818735A (en) | Method and system for high resolution time-of-flight measurements | |
| JPH05149963A (ja) | 超音波高速流計測装置 | |
| EP0228070A2 (de) | Mit Doppler-Effekt arbeitendes Ultraschall-Diagnosegerät | |
| US5046500A (en) | Doppler flow velocity meter | |
| US4671294A (en) | Pulsed doppler flow mapping apparatus | |
| US5107466A (en) | Ultrasonic doppler flow meter | |
| EP0345960B1 (de) | Doppler-Ultraschallgerät zur Bestimmung von Blutströmungsgeschwindigkeiten | |
| US4607642A (en) | Unaliased quadrature audio synthesizer | |
| US4771789A (en) | Ultrasonic device for measuring acceleration of moving reflective member | |
| US4955386A (en) | Pulse doppler flow speed meter | |
| JPH03173551A (ja) | 血流の測定及び表示装置 | |
| EP0807825B1 (de) | Dauerstrichultraschalldopplerblutströmungsmesser | |
| JPH04223273A (ja) | パルスドップラー装置における多義性回避方法および装置 | |
| EP0474867B1 (de) | Verfahren zur verarbeitung von dopplersignalen | |
| JP2953083B2 (ja) | 高限界速パルスドプラ計測装置 | |
| US5216639A (en) | Method for processing a doppler signal |
Legal Events
| Date | Code | Title | Description |
|---|---|---|---|
| AS | Assignment |
Owner name: KONTRON INSTRUMENTS HOLDING NV Free format text: ASSIGNMENT OF ASSIGNORS INTEREST.;ASSIGNOR:BURCKHARDT, CHRISTOPH B.;REEL/FRAME:005710/0691 Effective date: 19910327 |
|
| FEPP | Fee payment procedure |
Free format text: PAYOR NUMBER ASSIGNED (ORIGINAL EVENT CODE: ASPN); ENTITY STATUS OF PATENT OWNER: LARGE ENTITY Free format text: PAYER NUMBER DE-ASSIGNED (ORIGINAL EVENT CODE: RMPN); ENTITY STATUS OF PATENT OWNER: LARGE ENTITY |
|
| FPAY | Fee payment |
Year of fee payment: 4 |
|
| REMI | Maintenance fee reminder mailed | ||
| LAPS | Lapse for failure to pay maintenance fees | ||
| FP | Lapsed due to failure to pay maintenance fee |
Effective date: 20010202 |
|
| STCH | Information on status: patent discontinuation |
Free format text: PATENT EXPIRED DUE TO NONPAYMENT OF MAINTENANCE FEES UNDER 37 CFR 1.362 |