US10066253B2 - Method of measuring blood component amount - Google Patents
Method of measuring blood component amount Download PDFInfo
- Publication number
- US10066253B2 US10066253B2 US15/034,725 US201415034725A US10066253B2 US 10066253 B2 US10066253 B2 US 10066253B2 US 201415034725 A US201415034725 A US 201415034725A US 10066253 B2 US10066253 B2 US 10066253B2
- Authority
- US
- United States
- Prior art keywords
- voltage
- electrode
- blood component
- blood
- electrode system
- Prior art date
- Legal status (The legal status is an assumption and is not a legal conclusion. Google has not performed a legal analysis and makes no representation as to the accuracy of the status listed.)
- Active, expires
Links
Images


Classifications
-
- C—CHEMISTRY; METALLURGY
- C12—BIOCHEMISTRY; BEER; SPIRITS; WINE; VINEGAR; MICROBIOLOGY; ENZYMOLOGY; MUTATION OR GENETIC ENGINEERING
- C12Q—MEASURING OR TESTING PROCESSES INVOLVING ENZYMES, NUCLEIC ACIDS OR MICROORGANISMS; COMPOSITIONS OR TEST PAPERS THEREFOR; PROCESSES OF PREPARING SUCH COMPOSITIONS; CONDITION-RESPONSIVE CONTROL IN MICROBIOLOGICAL OR ENZYMOLOGICAL PROCESSES
- C12Q1/00—Measuring or testing processes involving enzymes, nucleic acids or microorganisms; Compositions therefor; Processes of preparing such compositions
- C12Q1/001—Enzyme electrodes
- C12Q1/005—Enzyme electrodes involving specific analytes or enzymes
- C12Q1/006—Enzyme electrodes involving specific analytes or enzymes for glucose
-
- G—PHYSICS
- G01—MEASURING; TESTING
- G01N—INVESTIGATING OR ANALYSING MATERIALS BY DETERMINING THEIR CHEMICAL OR PHYSICAL PROPERTIES
- G01N27/00—Investigating or analysing materials by the use of electric, electrochemical, or magnetic means
- G01N27/26—Investigating or analysing materials by the use of electric, electrochemical, or magnetic means by investigating electrochemical variables; by using electrolysis or electrophoresis
- G01N27/28—Electrolytic cell components
- G01N27/30—Electrodes, e.g. test electrodes; Half-cells
- G01N27/307—Disposable laminated or multilayered electrodes
-
- G—PHYSICS
- G01—MEASURING; TESTING
- G01N—INVESTIGATING OR ANALYSING MATERIALS BY DETERMINING THEIR CHEMICAL OR PHYSICAL PROPERTIES
- G01N27/00—Investigating or analysing materials by the use of electric, electrochemical, or magnetic means
- G01N27/26—Investigating or analysing materials by the use of electric, electrochemical, or magnetic means by investigating electrochemical variables; by using electrolysis or electrophoresis
- G01N27/28—Electrolytic cell components
- G01N27/30—Electrodes, e.g. test electrodes; Half-cells
- G01N27/327—Biochemical electrodes, e.g. electrical or mechanical details for in vitro measurements
- G01N27/3271—Amperometric enzyme electrodes for analytes in body fluids, e.g. glucose in blood
- G01N27/3272—Test elements therefor, i.e. disposable laminated substrates with electrodes, reagent and channels
-
- G—PHYSICS
- G01—MEASURING; TESTING
- G01N—INVESTIGATING OR ANALYSING MATERIALS BY DETERMINING THEIR CHEMICAL OR PHYSICAL PROPERTIES
- G01N27/00—Investigating or analysing materials by the use of electric, electrochemical, or magnetic means
- G01N27/26—Investigating or analysing materials by the use of electric, electrochemical, or magnetic means by investigating electrochemical variables; by using electrolysis or electrophoresis
- G01N27/28—Electrolytic cell components
- G01N27/30—Electrodes, e.g. test electrodes; Half-cells
- G01N27/327—Biochemical electrodes, e.g. electrical or mechanical details for in vitro measurements
- G01N27/3271—Amperometric enzyme electrodes for analytes in body fluids, e.g. glucose in blood
- G01N27/3274—Corrective measures, e.g. error detection, compensation for temperature or hematocrit, calibration
-
- G—PHYSICS
- G01—MEASURING; TESTING
- G01N—INVESTIGATING OR ANALYSING MATERIALS BY DETERMINING THEIR CHEMICAL OR PHYSICAL PROPERTIES
- G01N27/00—Investigating or analysing materials by the use of electric, electrochemical, or magnetic means
- G01N27/26—Investigating or analysing materials by the use of electric, electrochemical, or magnetic means by investigating electrochemical variables; by using electrolysis or electrophoresis
- G01N27/416—Systems
- G01N27/4166—Systems measuring a particular property of an electrolyte
Definitions
- the present invention relates to a method for measuring a blood component amount.
- the sensors for measuring blood components may have a configuration in which a cover is disposed on an insulating substrate via a spacer. A working electrode and a counter electrode are formed on the surface of the insulating substrate. A reagent containing an oxidoreductase, a mediator (electron carrier), etc. is placed on the working electrode and the counter electrode. This portion is an analytical portion. One end of a flow path for the introduction of blood is connected to the analytical portion. The other end of the flow path is open to the outside and serves as a blood inlet.
- Analysis of blood components using such a sensor may be performed in the following manner.
- the sensor is set in a special-purpose measuring device (meter).
- a lancet is used to prick the finger tip or the like and draw a small amount of blood, which is brought into contact with the blood inlet of the sensor.
- the blood is sucked into the flow path of the sensor by capillary action, passes through the flow path to the analytical portion, and comes into contact with the reagent.
- An oxidation-reduction reaction occurs between components of the blood and the oxidoreductase, so that a current flows via the mediator.
- the measuring device calculates a blood component amount based on the detected current value and displays the blood component amount.
- the blood component amount can be measured using the sensor.
- the measured value may be affected by hematocrit (Hct). Therefore, in order to obtain an accurately measured value, it is necessary to measure an Hct value and to correct the blood component amount based on the Hct value.
- Hct hematocrit
- Patent Document 1 there is a method that uses a mediator to measure an Hct value
- the conventional techniques have problems in the accuracy and reliability of the measured Hct value, and thus cannot sufficiently and properly correct the blood component amount.
- Patent Document 1 JP 2003-501627 A
- Patent Document 2 Japanese Patent No. 3369183
- the present invention relates to a method for measuring a blood component amount (also referred to as a “first method for measuring a blood component amount” in the present description) that uses a biosensor to calculate a blood component amount in blood.
- the biosensor includes the following: a first electrode system having a first working electrode and a first counter electrode; a second electrode system having a second working electrode and a second counter electrode; and a reagent portion arranged in a form that covers at least a part of the first electrode system, but does not cover the second working electrode.
- the method includes the following: a first step of detecting a first current value that flows through the first electrode system and calculating an apparent blood component amount in the blood based on the first current value, during a period in which a first voltage is applied to the first electrode system and a second voltage is applied to the second electrode system while the first voltage is being applied; followed by a second step of stopping the application of the first voltage to the first electrode system, applying a third voltage to the second electrode system, and detecting a second current value; and a step of calculating a true blood component amount using the apparent blood component amount and the second current value.
- the present invention relates to a method for measuring a blood component amount (also referred to as a “second method for measuring a blood component amount” in the present description) that uses a biosensor to calculate a blood component amount in blood.
- the biosensor includes the following: a first electrode system having a first working electrode and a first counter electrode; a second electrode system having a second working electrode and a second counter electrode; and a reagent portion arranged in a form that covers at least a part of the first electrode system.
- the second counter electrode is located in a place that is independent of the first electrode system, and the reagent portion is also arranged in a form that covers at least a part of the second counter electrode.
- the method includes the following: a first step of detecting a first current value that flows through the first electrode system and calculating an apparent blood component amount in the blood based on the first current value, during a period in which a first voltage is applied to the first electrode system and a second voltage is applied to the second electrode system while the first voltage is being applied; followed by a second step of stopping the application of the first voltage to the first electrode system, applying a third voltage to the second electrode system, and detecting a second current value; and a step of calculating a true blood component amount using the apparent blood component amount and the second current value.
- the present invention is characterized by the method for measuring a blood component amount.
- the blood component amount is measured by (i) arranging the reagent portion in a form that covers at least a part of the first electrode system, but does not cover the working electrode of the second electrode system, (ii) applying a voltage to the first electrode system and the second electrode system simultaneously to determine an apparent blood component amount, (iii) applying a voltage only to the second electrode system to determine a current value, and (iv) calculating a true blood component amount by correcting the apparent blood component amount based on the current value (the first method for measuring a blood component amount).
- the blood component amount is measured by (i) using a biosensor in which the second counter electrode is located in a place that is independent of the first electrode system, and the reagent portion is also arranged in a form that covers at least a part of the second counter electrode, (ii) applying a voltage to the first electrode system and the second electrode system simultaneously to determine an apparent blood component amount, (iii) applying a voltage only to the second electrode system to determine a current value, and (iv) calculating a true blood component amount by correcting the apparent blood component amount based on the current value (the second method for measuring a blood component amount).
- the simultaneous application of a voltage to the first electrode system and the second electrode system reduces the effect of hematocrit on the current value that flows through the first electrode system, and thus improves the accuracy of the apparent blood component amount. Since such an apparent blood component amount is corrected to calculate a true blood component amount, the correction value is small. Therefore, the measuring methods of the present invention reduce the effect of Hct when the blood component amount is measured, and thus improve the accuracy of the measured blood component amount.
- the “method for measuring a blood component amount” refers to both the “first method for measuring a blood component amount” and the “second method for measuring a blood component amount”.
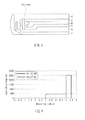
- FIG. 1 is an exploded perspective view showing an example of a sensor of the present invention.
- FIG. 2 is a cross-sectional view of the sensor in FIG. 1 .
- FIG. 3 is a plan view of the sensor in FIG. 1 .
- FIG. 4 is a graph showing the relationship between an application time and an applied current in Comparative Example 1.
- FIG. 5 is a graph showing the relationship between an application time and an applied current in Example 2.
- FIG. 6 is a graph showing the relationship between an application time and an applied current in Example 3.
- FIG. 7 shows the results of blood samples in which a blood component (glucose) concentration is 75 mg/dl.
- FIG. 7( a ) is a graph showing changes in a response current value (mV) over time with respect to an applied voltage (mV) in Comparative Example 1.
- FIG. 7( b ) is a graph showing changes in a sensitivity difference (%) over time with respect to an applied voltage (mV) in Comparative Example 1.
- FIG. 8 shows the results of blood samples in which a blood component (glucose) concentration is 75 mg/dl.
- FIG. 8( a ) is a graph showing changes in a response current value (mV) over time with respect to an applied voltage (mV) in Example 2.
- FIG. 8( b ) is a graph showing changes in a sensitivity difference (%) over time with respect to an applied voltage (mV) in Example 2.
- FIG. 9 shows the results of blood samples in which a blood component (glucose) concentration is 75 mg/dl.
- FIG. 9( a ) is a graph showing changes in a response current value (mV) over time with respect to an applied voltage (mV) in Example 3.
- FIG. 9( b ) is a graph showing changes in a sensitivity difference (%) over time with respect to an applied voltage (mV) in Example 3.
- FIG. 10 shows the results of blood samples in which a blood component (glucose) concentration is 150 mg/dl.
- FIG. 10( a ) is a graph showing changes in a response current value (mV) over time with respect to an applied voltage (mV) in Comparative Example 1.
- FIG. 10( b ) is a graph showing changes in a sensitivity difference (%) over time with respect to an applied voltage (mV) in Comparative Example 1.
- FIG. 11 shows the results of blood samples in which a blood component (glucose) concentration is 150 mg/dl.
- FIG. 11( a ) is a graph showing changes in a response current value (mV) over time with respect to an applied voltage (mV) in Example 2.
- FIG. 11( b ) is a graph showing changes in a sensitivity difference (%) over time with respect to an applied voltage (mV) in Example 2.
- FIG. 12 shows the results of blood samples in which a blood component (glucose) concentration is 150 mg/dl.
- FIG. 12( a ) is a graph showing changes in a response current value (mV) over time with respect to an applied voltage (mV) in Example 3.
- FIG. 12( b ) is a graph showing changes in a sensitivity difference (%) over time with respect to an applied voltage (mV) in Example 3.
- FIG. 13 shows the results of blood samples in which a blood component (glucose) concentration is 300 mg/dl.
- FIG. 13( a ) is a graph showing changes in a response current value (mV) over time with respect to an applied voltage (mV) in Comparative Example 1.
- FIG. 13( b ) is a graph showing changes in a sensitivity difference (%) over time with respect to an applied voltage (mV) in Comparative Example 1.
- FIG. 14 shows the results of blood samples in which a blood component (glucose) concentration is 300 mg/dl.
- FIG. 14( a ) is a graph showing changes in a response current value (mV) over time with respect to an applied voltage (mV) in Example 2.
- FIG. 14( b ) is a graph showing changes in a sensitivity difference (%) over time with respect to an applied voltage (mV) in Example 2.
- FIG. 15 shows the results of blood samples in which a blood component (glucose) concentration is 300 mg/dl.
- FIG. 15( a ) is a graph showing changes in a response current value (mV) over time with respect to an applied voltage (mV) in Example 3.
- FIG. 15( b ) is a graph showing changes in a sensitivity difference (%) over time with respect to an applied voltage (mV) in Example 3.
- FIG. 16 is a summary of the results shown in FIGS. 7, 10, and 13 .
- FIG. 16( a ) is a graph showing the relationship between an application time and an applied current.
- FIG. 16( b ) is a graph showing changes in a blood component (glucose) concentration and a response current value (mV) over time when the application time is 5 seconds in Comparative Example 1.
- FIG. 16( c ) is a graph showing a blood component (glucose) concentration and a sensitivity difference (%) when the application time is 5 seconds in Comparative Example 1.
- FIG. 17 is a summary of the results shown in FIGS. 8, 11, and 14 .
- FIG. 17( a ) is a graph showing the relationship between an application time and an applied current.
- FIG. 17( b ) is a graph showing changes in a blood component (glucose) concentration and a response current value (mV) over time when the application time is 5 seconds in Example 2.
- FIG. 17( c ) is a graph showing a blood component (glucose) concentration and a sensitivity difference (%) when the application time is 5 seconds in Example 2.
- FIG. 18 is a summary of the results shown in FIGS. 9, 12, and 15 .
- FIG. 18( a ) is a graph showing the relationship between an application time and an applied current.
- FIG. 18( b ) is a graph showing changes in a blood component (glucose) concentration and a response current value (mV) over time when the application time is 5 seconds in Example 3.
- FIG. 18( c ) is a graph showing a blood component (glucose) concentration and a sensitivity difference (%) when the application time is 5 seconds in Example 3.
- FIG. 19( a ) and FIG. 19( b ) are graphs showing the relationship between an application time and an applied current in another aspect of the present invention.
- FIG. 20 shows the results of blood samples in which a blood component (glucose) concentration is 75 mg/dl.
- FIG. 20( a ) is a graph showing the relationship between an application time and an applied current.
- FIG. 20( b ) is a graph showing changes in a response current value (mV) over time with respect to an applied voltage (mV) in Example 4.
- FIG. 20( c ) is a graph showing changes in a sensitivity difference (%) over time with respect to an applied voltage (mV) in Example 4.
- FIG. 21 shows the results of blood samples in which a blood component (glucose) concentration is 150 mg/dl.
- FIG. 21( a ) is a graph showing the relationship between an application time and an applied current.
- FIG. 21( b ) is a graph showing changes in a response current value (mV) over time with respect to an applied voltage (mV) in Example 4.
- FIG. 21( c ) is a graph showing changes in a sensitivity difference (%) over time with respect to an applied voltage (mV) in Example 4.
- FIG. 22 shows the results of blood samples in which a blood component (glucose) concentration is 300 mg/dl.
- FIG. 22( a ) is a graph showing the relationship between an application time and an applied current.
- FIG. 22( b ) is a graph showing changes in a response current value (mV) over time with respect to an applied voltage (mV) in Example 4.
- FIG. 22( c ) is a graph showing changes in a sensitivity difference (%) over time with respect to an applied voltage (mV) in Example 4.
- FIG. 23 is a summary of the results shown in FIGS. 20, 21, and 22 .
- FIG. 23( a ) is a graph showing the relationship between an application time and an applied current.
- FIG. 23( b ) is a graph showing changes in a blood component (glucose) concentration and a response current value (mV) over time when the application time is 5 seconds in Example 4.
- FIG. 23( c ) is a graph showing a blood component (glucose) concentration and a sensitivity difference (%) when the application time is 5 seconds in Example 4.
- FIGS. 24( a ), 24( b ), and 24( c ) are graphs showing the relationship between an application time and an applied current in another aspect of the present invention.
- FIG. 25 shows the results of blood samples in which a blood component (glucose) concentration is 75 mg/dl.
- FIG. 25( a ) is a graph showing the relationship between an application time and an applied current in Example 5.
- FIG. 25( b ) is a graph showing changes in a response current value (mV) over time with respect to an applied voltage (mV) in Example 5.
- FIG. 25( c ) is a graph showing changes in a sensitivity difference (%) over time with respect to an applied voltage (mV) in Example 5.
- FIG. 26 shows the results of blood samples in which a blood component (glucose) concentration is 75 mg/dl.
- FIG. 26( a ) is a graph showing the relationship between an application time and an applied current in Example 6.
- FIG. 26( b ) is a graph showing changes in a response current value (mV) over time with respect to an applied voltage (mV) in Example 6.
- FIG. 26( c ) is a graph showing changes in a sensitivity difference (%) over time with respect to an applied voltage (mV) in Example 6.
- FIG. 27 shows the results of blood samples in which a blood component (glucose) concentration is 150 mg/dl.
- FIG. 27( a ) is a graph showing the relationship between an application time and an applied current in Example 5.
- FIG. 27( b ) is a graph showing changes in a response current value (mV) over time with respect to an applied voltage (mV) in Example 5.
- FIG. 27( c ) is a graph showing changes in a sensitivity difference (%) over time with respect to an applied voltage (mV) in Example 5.
- FIG. 28 shows the results of blood samples in which a blood component (glucose) concentration is 150 mg/dl.
- FIG. 28( a ) is a graph showing the relationship between an application time and an applied current in Example 6.
- FIG. 28( b ) is a graph showing changes in a response current value (mV) over time with respect to an applied voltage (mV) in Example 6.
- FIG. 28( c ) is a graph showing changes in a sensitivity difference (%) over time with respect to an applied voltage (mV) in Example 6.
- FIG. 29 shows the results of blood samples in which a blood component (glucose) concentration is 300 mg/dl.
- FIG. 29( a ) is a graph showing the relationship between an application time and an applied current in Example 5.
- FIG. 29( b ) is a graph showing changes in a response current value (mV) over time with respect to an applied voltage (mV) in Example 5.
- FIG. 29( c ) is a graph showing changes in a sensitivity difference (%) over time with respect to an applied voltage (mV) in Example 5.
- FIG. 30 shows the results of blood samples in which a blood component (glucose) concentration is 300 mg/dl.
- FIG. 30( a ) is a graph showing the relationship between an application time and an applied current in Example 6.
- FIG. 30( b ) is a graph showing changes in a response current value (mV) over time with respect to an applied voltage (mV) in Example 6.
- FIG. 30( c ) is a graph showing changes in a sensitivity difference (%) over time with respect to an applied voltage (mV) in Example 6.
- FIG. 31 shows the results of blood samples in which a blood component (glucose) concentration is 600 mg/dl.
- FIG. 31( a ) is a graph showing the relationship between an application time and an applied current in Example 5.
- FIG. 31( b ) is a graph showing changes in a response current value (mV) over time with respect to an applied voltage (mV) in Example 5.
- FIG. 31( c ) is a graph showing changes in a sensitivity difference (%) over time with respect to an applied voltage (mV) in Example 5.
- FIG. 32 shows the results of blood samples in which a blood component (glucose) concentration is 600 mg/dl.
- FIG. 32( a ) is a graph showing the relationship between an application time and an applied current in Comparative Example 1.
- FIG. 32( b ) is a graph showing changes in a response current value (mV) over time with respect to an applied voltage (mV) in Comparative Example 1.
- FIG. 32( c ) is a graph showing changes in a sensitivity difference (%) over time with respect to an applied voltage (mV) in Comparative Example 1.
- FIG. 33 is a summary of the results shown in FIGS. 25, 27, 29, and 31 .
- FIG. 33( a ) is a graph showing the relationship between an application time and an applied current.
- FIG. 33( b ) is a graph showing changes in a blood component (glucose) concentration and a response current value (mV) over time when the application time is 5 seconds in Example 5.
- FIG. 33( c ) is a graph showing a blood component (glucose) concentration and a sensitivity difference (%) when the application time is 5 seconds in Example 5.
- FIG. 34 is a summary of the results shown in FIGS. 26, 28, and 30 .
- FIG. 34( a ) is a graph showing the relationship between an application time and an applied current.
- FIG. 34( b ) is a graph showing changes in a blood component (glucose) concentration and a response current value (mV) over time when the application time is 5 seconds in Example 6.
- FIG. 34( c ) is a graph showing a blood component (glucose) concentration and a sensitivity difference (%) when the application time is 5 seconds in Example 6.
- FIG. 35 is an exploded perspective view showing another example of a sensor of the present invention.
- FIG. 36 is a cross-sectional view of the sensor in FIG. 35 .
- FIG. 37 is a plan view of the sensor in FIG. 35 .
- FIG. 38 shows the results of blood samples in which a blood component (glucose) concentration is 75 mg/dl.
- FIG. 38( a ) is a graph showing the relationship between an application time and an applied current in Comparative Example 2.
- FIG. 38( b ) is a graph showing changes in a response current value (mV) over time with respect to an applied voltage (mV) in Comparative Example 2.
- FIG. 38( c ) is a graph showing changes in a sensitivity difference (%) over time with respect to an applied voltage (mV) in Comparative Example 2.
- FIG. 39 shows the results of blood samples in which a blood component (glucose) concentration is 75 mg/dl.
- FIG. 39( a ) is a graph showing the relationship between an application time and an applied current in Example 8.
- FIG. 39( b ) is a graph showing changes in a response current value (mV) over time with respect to an applied voltage (mV) in Example 8.
- FIG. 39( c ) is a graph showing changes in a sensitivity difference (%) over time with respect to an applied voltage (mV) in Example 8.
- FIG. 40 shows the results of blood samples in which a blood component (glucose) concentration is 75 mg/dl.
- FIG. 40( a ) is a graph showing the relationship between an application time and an applied current in Example 9.
- FIG. 40( b ) is a graph showing changes in a response current value (mV) over time with respect to an applied voltage (mV) in Example 9.
- FIG. 40( c ) is a graph showing changes in a sensitivity difference (%) over time with respect to an applied voltage (mV) in Example 9.
- FIG. 41 is a summary of the results shown in FIG. 38 .
- FIG. 41( a ) is a graph showing the relationship between an application time and an applied current.
- FIG. 41( b ) is a graph showing changes in a blood component (glucose) concentration and a response current value (mV) over time when the application time is 5 seconds in Comparative Example 2.
- FIG. 41( c ) is a graph showing a blood component (glucose) concentration and a sensitivity difference (%) when the application time is 5 seconds in Comparative Example 2.
- FIG. 42 is a summary of the results shown in FIG. 39 .
- FIG. 42( a ) is a graph showing the relationship between an application time and an applied current.
- FIG. 42( b ) is a graph showing changes in a blood component (glucose) concentration and a response current value (mV) over time when the application time is 5 seconds in Example 8.
- FIG. 42( c ) is a graph showing a blood component (glucose) concentration and a sensitivity difference (%) when the application time is 5 seconds in Example 8.
- FIG. 43 is a summary of the results shown in FIG. 40 .
- FIG. 43( a ) is a graph showing the relationship between an application time and an applied current.
- FIG. 43( b ) is a graph showing changes in a blood component (glucose) concentration and a response current value (mV) over time when the application time is 5 seconds in Example 9.
- FIG. 43( c ) is a graph showing a blood component (glucose) concentration and a sensitivity difference (%) when the application time is 5 seconds in Example 9.
- FIG. 44 is a perspective view showing an example of a measuring device of the present invention.
- FIG. 45 is an electrical block diagram of a blood component amount measuring device to which a biosensor is attached in an embodiment of the present invention.
- the present invention relates to a method for measuring a blood component amount (a first method for measuring a blood component amount) that uses a biosensor to calculate a blood component amount in blood.
- the biosensor includes the following: a first electrode system having a first working electrode and a first counter electrode; a second electrode system having a second working electrode and a second counter electrode; and a reagent portion arranged in a form that covers at least a part of the first electrode system, but does not cover the second working electrode.
- the method includes the following: a first step of detecting a first current value that flows through the first electrode system and calculating an apparent blood component amount in the blood based on the first current value, during a period in which a first voltage is applied to the first electrode system and a second voltage is applied to the second electrode system while the first voltage is being applied; followed by a second step of stopping the application of the first voltage to the first electrode system, applying a third voltage to the second electrode system, and detecting a second current value; and a step of calculating a true blood component amount using the apparent blood component amount and the second current value.
- the present invention relates to a method for measuring a blood component amount (a second method for measuring a blood component amount) that uses a biosensor to calculate a blood component amount in blood.
- the biosensor includes the following: a first electrode system having a first working electrode and a first counter electrode; a second electrode system having a second working electrode and a second counter electrode; and a reagent portion arranged in a form that covers at least a part of the first electrode system.
- the second counter electrode is located in a place that is independent of the first electrode system, and the reagent portion is also arranged in a form that covers at least a part of the second counter electrode.
- the method includes the following: a first step of detecting a first current value that flows through the first electrode system and calculating an apparent blood component amount in the blood based on the first current value, during a period in which a first voltage is applied to the first electrode system and a second voltage is applied to the second electrode system while the first voltage is being applied; followed by a second step of stopping the application of the first voltage to the first electrode system, applying a third voltage to the second electrode system, and detecting a second current value; and a step of calculating a true blood component amount using the apparent blood component amount and the second current value.
- the biosensor may further include a third electrode system having a third working electrode and a third counter electrode.
- the third working electrode may also be used as the second working electrode, and the third counter electrode may be located in a place that is independent of the first electrode system and the second electrode system.
- the second voltage and the third voltage may be either the same or different.
- the first current value that flows through the first electrode system may be detected during the period in which the first voltage is applied to the first electrode system and the second voltage is applied to the second electrode system while the first voltage is being applied. It is preferable that the first current value is detected at the end of the period in which the first voltage is applied to the first electrode system and the second voltage is applied to the second electrode system while the first voltage is being applied.
- the biosensor further includes a third electrode system having a third working electrode and a third counter electrode, that the reagent portion is arranged in a form that covers at least a part of the third counter electrode, but does not cover the third working electrode, and that the third voltage is applied to the third electrode system instead of applying the third voltage to the second electrode system in the second step.
- the reagent portion includes a mediator. It is more preferable that the reagent portion further includes an oxidoreductase.
- the first electrode system is independent of the counter electrode of the second electrode system.
- the first step and the second step may be performed continuously or with a time interval between them.
- the time interval may be, e.g., 0.01 to 10 seconds, preferably 0.1 to 5 seconds, and more preferably 0.5 to 2 seconds.
- the second voltage may be, e.g., 0.5 to 5 V, preferably 1 to 3 V, and more preferably 1.5 to 2.5 V.
- the third voltage may be, e.g., 0.1 to 10 V, preferably 0.1 to 6.5 V, and more preferably 0.5 to 2.5 V.
- the first voltage is 0.05 to 1 V and an application time of the first voltage is 0.05 to 30 seconds
- the second voltage is 0.5 to 5 V and an application time of the second voltage is 0.01 to 5 seconds.
- the first method for measuring a blood component amount and the second method for measuring a blood component amount preferably include a previous step of applying the first voltage only to the first electrode system before the first step. It is more preferable that a third current value that flows through the first electrode system is detected in the previous step, and the third voltage is selected based on the third current value.
- the third voltage is selected based on the first current value.
- the first working electrode, the first counter electrode, the second working electrode, and the second counter electrode are made of gold, platinum, or palladium.
- the third working electrode and the third counter electrode are made of gold, platinum, or palladium.
- the electrode on which the reagent portion is not provided is coated with a polymeric material in order to prevent adhesion of impurities, oxidation, or the like.
- polymeric material examples include the following: carboxymethyl cellulose (CMC); hydroxyethyl cellulose; hydroxypropyl cellulose; methyl cellulose; ethyl cellulose; ethylhydroxyethyl cellulose; carboxyethyl cellulose; polyvinyl alcohol; polyvinyl pyrrolidone; polyamino acids such as polygine; polystyrene sulfonate; gelatin and its derivatives; polyacrylic acid and its salts; polymethacrylic acid and its salts; starch and its derivatives; maleic anhydride polymer and its salts; and agarose gel and its derivatives. These materials may be used individually or in combinations of two or more. In particular, CMC is preferred.
- the coating of the electrode with the polymeric material is not particularly limited.
- a solution of the polymeric material may be prepared and applied to the surface of the electrode. After drying the solution, the solvent in the coating film may be removed.
- the ratio of the polymeric material to the whole reagent solution for forming the reagent portion may be, e.g., 0.001 to 10 wt %, preferably 0.005 to 5 wt %, and more preferably 0.01 to 2 wt %.
- the closest distance between the working electrode and the counter electrode in each of the first electrode system and the second electrode system is preferably 0.05 mm or more. If the distance between the electrodes is 0.05 mm or more, the reliability of the measured value is improved.
- the distance between the electrodes is more preferably 0.1 mm or more, and further preferably 0.5 mm or more.
- a calibration curve and a calibration table of the Hct value and the blood component amount have been previously prepared, and the correction based on the second current value uses either the calibration curve or the calibration table.
- the blood component amount of the present invention it is preferable that an environmental temperature is further measured, and the blood component amount is corrected with the environmental temperature. This is because the enzyme reaction is affected by the environmental temperature.
- the correction with the environmental temperature uses either a calibration curve or a calibration table, which have been previously prepared.
- the blood components to be measured may include, e.g., glucose, lactic acid, uric acid, bilirubin, and cholesterol.
- the reagent portion further includes an oxidoreductase.
- the oxidoreductase may be appropriately selected in accordance with the blood components to be measured. Examples of the oxidoreductase include glucose oxidase, lactate oxidase, cholesterol oxidase, bilirubin oxidase, glucose dehydrogenase, and lactate dehydrogenase.
- the amount of the oxidoreductase may be, e.g., 0.01 to 100 U, preferably 0.05 to 10 U, and more preferably 0.1 to 5 U per one sensor or one measurement.
- glucose is preferred as a measuring object, and glucose oxidase and glucose dehydrogenase are preferred as oxidoreductases.
- the first electrode system has the first working electrode and the first counter electrode
- the second electrode system has the second working electrode and the second counter electrode.
- the first working electrode and the first counter electrode of the first electrode system are independent of the second counter electrode of the second electrode system.
- the first working electrode and the first counter electrode of the first electrode system may also be used as the second working electrode of the second electrode system.
- the biosensor used in the method for measuring a blood component amount of the present invention may further include an insulating substrate, on which a first electrode system, a second electrode system, and a flow path for the introduction of blood into each of the electrode systems are formed.
- One end of the flow path may be open to the outside of the biosensor and serve as a blood inlet.
- the flow path may have one blood inlet and branch into multiple paths in the middle. The end of each of the branched paths may communicate with each analytical portion.
- the second electrode system may be located in the middle of the flow path, and the first electrode system may be located downstream of the second electrode system.
- the biosensor used in the method for measuring a blood component amount of the present invention may further include a spacer and a cover.
- the cover may be disposed on the insulating substrate via the spacer.
- a polymeric material, an enzyme stabilizer, and a crystal homogenizing agent are further arranged on the first electrode system.
- the reagent portion preferably includes a mediator, more preferably includes a mediator and an oxidoreductase, even more preferably includes a mediator and an enzyme stabilizer, and further preferably includes a mediator, an enzyme stabilizer, and a crystal homogenizing agent.
- the mediator is not particularly limited and may be, e.g., ferricyanide, p-benzoquinone, p-benzoquinone derivatives, phenazine methosulfate, methylene blue, ferrocene, or ferrocene derivatives.
- ferricyanide is preferred, and potassium ferricyanide is more preferred.
- the amount of the mediator to be mixed is not particularly limited and may be, e.g., 0.1 to 1000 mM, preferably 1 to 500 mM, and more preferably 10 to 200 mM per one measurement or one sensor.
- the enzyme stabilizer may be, e.g., sugar alcohols.
- sugar alcohols include open-chain polyalcohols and cyclic sugar alcohols such as sorbitol, maltitol, xylitol, mannitol, lactitol, reduced palatinose, arabinitol, glycerol, ribitol, galactitol, sedoheptitol, perseitol, volemitol, styracitol, polygalitol, iditol, talitol, allitol, isylitol, hydrogenated starch hydrolysate, and isylitol.
- the enzyme stabilizer may also be stereoisomers, substitution products, or derivatives of these sugar alcohols. These sugar alcohols may be used individually or in combinations of two or more. In particular, maltitol is preferred.
- the amount of the enzyme stabilizer to be mixed may be, e.g., 0.1 to 500 mM, preferably 0.5 to 100 mM, and more preferably 1 to 50 mM per one measurement or one sensor.
- the crystal homogenizing agent is used to homogenize the crystalline state of the reagent portion and may be, e.g., amino acids.
- the amino acids include the following: glycine; alanine; valine; leucine; isoleucine; serine; threonine; methionine; asparagine; glutamine; arginine; lysine; histidine; phenylalanine; tryptophan; proline; sarcosine; betaine; taurine; and salts, substitution products, and derivatives thereof.
- amino acids may be used individually or in combinations of two or more.
- the amount of the crystal homogenizing agent to be mixed may be, e.g., 0.1 to 1000 mM, preferably 10 to 500 mM, and more preferably 20 to 200 mM per one measurement or one sensor.
- the biosensor used in the method for measuring a blood component amount of the present invention may further include an blood detecting electrode. It is preferable that the blood detecting electrode is located downstream of at least one of the electrode systems from the blood inlet, and can detect that blood has been reliably introduced into at least one of the electrode systems. It is more preferable that the blood detecting electrode is located most downstream of each of the electrode systems.
- the blood detecting electrode may also be used as at least one of the first counter electrode of the first electrode system and the second counter electrode of the second electrode system.
- the measuring device of the present invention may further include a correction means for correcting the apparent blood component amount based on the second current value.
- the third voltage applied to the second electrode system may be a voltage higher than the value at which the electrolysis of water occurs, and is preferably 0.1 to 10 V, more preferably 0.1 to 6.5 V, and further preferably 1.5 to 2.5 V.
- FIG. 44 is a perspective view showing an example of a measuring device of the present invention, where a biosensor used in the measuring method of the present invention is attached to the measuring device.
- a measuring device 2 has an insertion port 5 for a sensor at one end, into which a sensor 1 is inserted and held.
- Reference numeral 12 denotes a sample inlet of the sensor 1 .
- a display unit 4 is provided substantially in the center of the measuring device 2 and displays the results of the measurement.
- FIG. 45 shows an example of an electrical block diagram of a measuring device of the present invention, where a biosensor used in the measuring method of the present invention is attached to the measuring device.
- a voltage application portion 37 for applying a voltage and a current-voltage converter 38 are connected to an input terminal portion 6 .
- a voltage is supplied from a control portion 39 to the voltage application portion 37 , and this voltage is then applied via the input terminal portion 6 to a desired electrode among the first electrode system, the second electrode system, and the blood component introduction detecting electrode of the biosensor 1 for a predetermined time.
- the current flowing between the electrodes of the biosensor 1 as a result of this voltage application is converted to a voltage by the current-voltage converter 38 , and subsequently the voltage is converted to a digital value by an A/D converter 30 . Thereafter, a determination portion 31 compares the digitized voltage value with a threshold value.
- a display portion 32 is connected to the control portion 39 and displays the glucose value detected by the biosensor 1 and the results of the determination made by the determination portion 31 .
- reference numeral 33 denotes a power source that supplies power to each portion.
- Reference numeral 34 denotes a memory that stores a table containing hematocrit values and applied voltages, application times, etc. for measuring the glucose, or a calibration curve and a calibration table that have been previously prepared from the environmental temperature.
- a clock 35 is connected to the control portion 39 .
- the control portion 39 makes use of the hour and the time of the clock 35 to perform various control operations.
- the control portion 39 further includes a correction portion 36 that corrects the measured blood glucose level with the hematocrit value to improve the measurement accuracy of the blood glucose level.
- FIGS. 1, 2, and 3 show an example of a sensor for measuring blood components used in the measuring method of the present invention.
- FIG. 1 is an exploded perspective view of the sensor.
- FIG. 2 is a cross-sectional view of the sensor.
- FIG. 3 is a plan view of the sensor.
- This sensor is used, e.g., to measure glucose as a blood component.
- the senor includes an insulating substrate 101 and six electrodes A, C, D, E, G, and F formed on the insulating substrate 101 . These electrodes can switch between the working electrode and the counter electrode. The surfaces of the electrodes A, C, D, E, F, and G are coated with a polymeric material such as CMC.
- a reagent layer 11 is arranged to cover a part of the electrodes C, D, E, and G.
- the reagent layer 11 includes an oxidoreductase such as glucose dehydrogenase and a mediator such as potassium ferricyanide, and may include, e.g., an enzyme stabilizer and a crystal homogenizing agent as optional components.
- a cover 103 is disposed on the insulating substrate 101 via a spacer 102 , while leaving one end of the sensor (i.e., the right end in the drawings) uncovered.
- a flow path 14 is formed by the insulating substrate 101 , the spacer 102 , and the cover 103 to introduce blood into each of the electrodes (A, C, D, E, G, and F).
- the end of the flow path 14 extends to the other end of the sensor (i.e., the left end in the drawings) and is open to the outside, thereby serving as a blood inlet 12 .
- Each of the six electrodes (A, C, D, E, G, and F) is connected to a lead, and the leads extend to the one end of the sensor (i.e., the right end in the drawings). The ends of the leads are exposed and not covered with the cover.
- the cover 103 has an air hole 13 in a portion corresponding to the right end of the flow path 14 .
- the material of the insulating substrate is not particularly limited and may be, e.g., polyethylene terephthalate (PET), polycarbonate (PC), polyimide (PI), polyethylene (PE), polypropylene (PP), polystyrene (PS), polyvinyl chloride (PVC), polyoxymethylene (POM), monomer-cast nylon (MC), polybutylene terephthalate (PBT), methacrylate resin (PMMA), ABS resin (ABS), or glass.
- PET polyethylene terephthalate
- PC polycarbonate
- PI polyimide
- PET polyethylene terephthalate
- PET polyethylene terephthalate
- PC polycarbonate
- PI polyimide
- PET polyethylene terephthalate
- PET polyethylene terephthalate
- PET polycarbonate
- PI polyimide
- PET polyethylene terephthalate
- PET polyethylene terephthalate
- PET polycarbonate
- PI polyimide
- PET polyethylene terephthal
- the insulating substrate has a total length of 5 to 100 mm, a width of 2 to 50 mm, and a thickness of 0.05 to 2 mm, preferably has a total length of 7 to 50 mm, a width of 3 to 20 mm, and a thickness of 0.1 to 1 mm, and more preferably has a total length of 10 to 30 mm, a width of 3 to 10 mm, and a thickness of 0.1 to 0.6 mm.
- the material and size of the insulating substrate are the same as in Examples 2 to 6, as will be described later.
- the electrodes and the leads on the insulating substrate can be provided, e.g., by forming a conductive layer by sputtering or evaporation with the use of a material such as gold, platinum, or palladium, and processing the conductive layer into a particular electrode pattern with a laser.
- the laser may be, e.g., a YAG laser, a CO 2 laser, or an excimer laser. This process also is the same as in Examples 2 to 6, as will be described later.
- the reagent layer 11 is formed in the following manner. For example, an aqueous solution containing 0.1 to 5 U per sensor of glucose dehydrogenase, 10 to 200 mM of potassium ferricyanide, 1 to 50 mM of maltitol, and 20 to 200 mM of taurine is dropped onto a circular slit portion 20 (not shown) and dried. The presence of the slit portion 20 can suppress the spread of the dropped aqueous solution, so that the reagent layer 11 can be located in a more accurate position. Thus, the reagent layer 11 is formed to cover a part of the electrode portion composed of the electrodes C, D, and E.
- the drying process may be, e.g., natural drying or hot-air forced drying. However, if the temperature is too high, the enzyme can be inactivated. Therefore, the hot air of about 50° C. is preferably used.
- the material of the spacer is not particularly limited and may be, e.g., the same as that of the insulating substrate.
- the size of the spacer is not particularly limited.
- the spacer has a total length of 5 to 100 mm, a width of 2 to 50 mm, and a thickness of 0.01 to 1 mm, preferably has a total length of 7 to 50 mm, a width of 3 to 20 mm, and a thickness of 0.05 to 0.5 mm, and more preferably has a total length of 10 to 30 mm, a width of 3 to 10 mm, and a thickness of 0.05 to 0.25 mm.
- the spacer in this example has an I-shaped notch that serves as a flow path for the introduction of blood.
- the I-shaped notch has a total length of 0.5 to 8 mm and a width of 0.1 to 5 mm, preferably has a total length of 1 to 10 mm and a width of 0.2 to 3 mm, and more preferably has a total length of 1 to 5 mm and a width of 0.5 to 2 mm.
- the notch may be formed, e.g., by punching through the spacer with a laser or drill, or by using a die that allows a notch to be provided during the formation of the spacer.
- the material, size, and notch of the spacer are the same as in Examples 2 to 6, as will be described later.
- the material of the cover is not particularly limited and may be, e.g., the same as that of the insulating substrate. It is more preferable that a portion of the cover that forms the ceiling of the flow path for the introduction of blood is subjected to a hydrophilic treatment.
- the hydrophilic treatment may be, e.g., a method for applying a surface active agent or a method for introducing a hydrophilic functional group such as a hydroxyl group, a carbonyl group, or a carboxyl group into the surface of the cover by plasma processing. Alternatively, a layer of a surface active agent such as lecithin may be formed on the reagent layer.
- the size of the cover is not particularly limited.
- the cover has a total length of 5 to 100 mm, a width of 3 to 50 mm, and a thickness of 0.01 to 0.5 mm, preferably has a total length of 10 to 50 mm, a width of 3 to 20 mm, and a thickness of 0.05 to 0.25 mm, and more preferably has a total length of 15 to 30 mm, a width of 5 to 10 mm, and a thickness of 0.05 to 0.1 mm.
- the cover preferably has an air hole, e.g., in the form of a circle, ellipse, or polygon.
- the air hole has a maximum diameter of 0.01 to 10 mm, preferably has a maximum diameter of 0.05 to 5 mm, and more preferably has a maximum diameter of 0.1 to 2 mm.
- the air hole may be formed, e.g., by punching through the cover with a laser or drill, or by using a die that allows an air vent to be provided during the formation of the cover.
- the material, size, and air hole of the cover are the same as in Examples 2 to 6, as will be described later.
- the insulating substrate, the spacer, and the cover are laminated in this order and integrated into one component, thereby producing the sensor.
- the three members are joined together, e.g., using an adhesive or a heat seal.
- the adhesive include an epoxy adhesive, an acrylic adhesive, a polyurethane adhesive, a thermosetting adhesive (such as a hot-melt adhesive), and a UV curable adhesive. This process also is the same as in Examples 2 to 6, as will be described later.
- a blood component amount e.g., a blood glucose level is measured with the above sensor in the following manner.
- a special-purpose lancet is used to prick the finger tip or the like and draw a small amount of blood.
- the sensor is set in a special-purpose measuring device (meter). The blood is brought into contact with the blood inlet of the sensor set in the measuring device, and then is introduced into the sensor by capillary action. Analysis of the blood by the sensor is performed in the following steps.
- the electrode C is used as the working electrode of the first electrode system
- the electrode D and the electrode E are used as the counter electrode of the first electrode system
- the electrode F is used as the working electrode of the second electrode system
- the electrode G is used as the counter electrode of the second electrode system.
- a voltage is applied between the electrode D and the electrode E, and the introduction of the blood is detected by a change in a current value due to the blood introduced into the sensor. After confirming the introduction of the blood, the next step is started.
- the applied voltage is, e.g., 0.05 to 1 V, and glucose in the blood reacts with the glucose oxidoreductase for a certain period of time.
- a first voltage is applied to both of the electrodes of the first electrode system (i.e., the working electrode including the electrode C and the counter electrode including the electrode D and the electrode E), and a second voltage is applied to both of the electrodes of the second electrode system (i.e., the working electrode including the electrode F and the counter electrode including the electrode G) (the first step).
- the reagent layer 11 is formed to cover a part of the electrode portion composed of the electrode C (the working electrode of the first electrode system), the electrode D (the counter electrode of the first electrode system), and the electrode E (the counter electrode of the first electrode system) of the biosensor.
- the reduced mediator that is generated on the electrode C of the first electrode system by the enzyme reaction is oxidized, and an oxidation current (a first current value) is detected. Based on the oxidation current (the first current value), an apparent amount of glucose (an apparent blood component amount) in the blood is calculated.
- the application time of the first voltage is the same as that of the second voltage.
- the reaction time between the glucose and the oxidoreductase may be, e.g., 0 to 60 seconds, preferably 0 to 30 seconds, and more preferably 0 to 10 seconds.
- the first voltage in the step 2 (the first step) may be, e.g., 0.05 to 1.0 V, preferably 0.1 to 0.8 V, and more preferably 0.2 to 0.6 V.
- the application time of the first voltage may be, e.g., 0.05 to 30 seconds, preferably 0.1 to 10 seconds, and more preferably 0.5 to 5 seconds.
- the second voltage in the step 2 (the first step) may be, e.g., 0.5 to 5 V, preferably 1 to 3 V, and more preferably 1.5 to 2.5 V.
- the application time of the second voltage may be, e.g., 0.01 to 5 seconds, preferably 0.01 to 2.5 seconds, and more preferably 0.1 to 1 second.
- the combinations of the first voltage and the second voltage in the step 2 may include the following.
- the first voltage is 0.05 to 1 V and the application time of the first voltage is 0.05 to 30 seconds
- the second voltage is 0.5 to 5 V and the application time of the second voltage is 0.01 to 5 seconds.
- the first voltage is 0.01 to 0.8 V and the application time of the first voltage is 0.1 to 10 seconds
- the second voltage is 1 to 3 V and the application time of the second voltage is 0.01 to 2.5 seconds.
- the first voltage is 0.2 to 0.6 V and the application time of the first voltage is 0.5 to 5 seconds
- the second voltage is 1.5 to 2.5 V and the application time of the second voltage is 0.1 to 1 second.
- the measuring method may include a previous step of applying the first voltage only to the first electrode system before the first voltage is applied to both of the electrodes of the first electrode system and the second voltage is applied to both of the electrodes of the second electrode system in the step 2 (the first step).
- the first voltage in the previous step may be, e.g., 0.05 to 1.0 V, preferably 0.1 to 0.8 V, and more preferably 0.2 to 0.6 V.
- the application time of the first voltage in the previous step may be, e.g., 0.05 to 30 seconds, preferably 0.1 to 10 seconds, and more preferably 0.5 to 5 seconds.
- the second voltage and the application time of the second voltage may be selected based on the first current value obtained in the step 2. Specifically, when the first current value is 0.01 to 0.1 V, the second voltage may be 1.5 to 2.0 V and the application time of the second voltage may be 0.1 to 1 second. When the first current value is 0.1 to 1 V, the second voltage may be 2.0 to 2.5 V and the application time of the second voltage may be 0.1 to 1 second.
- the first voltage may be applied only to the first electrode system to detect a third current value that flows through the first electrode system, and the second voltage and the application time of the second voltage may be selected based on the third current value.
- the first voltage may be, e.g., 0.05 to 1.0 V, preferably 0.1 to 0.8 V, and more preferably 0.2 to 0.6 V.
- the application time of the first voltage may be, e.g., 0.05 to 30 seconds, preferably 0.1 to 10 seconds, and more preferably 0.5 to 5 seconds.
- the third current value is 0.01 to 0.1 V
- the second voltage may be 1.5 to 2.0 V and the application time of the second voltage may be 0.1 to 1 second.
- the third current value is 0.1 to 1 V
- the second voltage may be 2.0 to 2.5 V and the application time of the third voltage may be 0.1 to 1 second.
- the application of the first voltage to the first electrode system is stopped, and a third voltage is applied to both of the electrodes of the second electrode system (i.e., the working electrode including the electrode F and the counter electrode including the electrode G), so that a current (a second current value) that depends on an Hct value based on the electrolytic oxidation reaction of glucose can be detected (the second step).
- the conversion from the detected current (the second current value) to an Hct value can be performed by previously determining the calibration curve or the calibration table. This correction may use the Hct value obtained from the calibration curve of the current and the Hct value, which has been previously prepared, or may use the detected current directly.
- the third voltage in the step 3 may be, e.g., 0.1 to 10 V, preferably 0.1 to 6.5 V, and more preferably 0.5 to 2.5 V.
- the application time of the third voltage may be, e.g., 0.05 to 10 seconds, preferably 0.1 to 5 seconds, and more preferably 0.2 to 1 second.
- the mediator is not arranged on the electrode F (the working electrode). Moreover, there is a predetermined gap between the electrode G and the electrode F, and no reagent such as a mediator is arranged, but only blood is present in this gap. Therefore, an oxidation current that depends on the Hct value can be detected without being affected by the reagent.
- the step 3 (the second step) may be performed either immediately after the step 2 (the first step) or after a time interval from the step 2 (the first step).
- the time interval may be, e.g., 0 to 10 seconds, preferably 0.05 to 5 seconds, and more preferably 0.1 to 1 second.
- the third voltage in the step 3 may be either the same as or different from the second voltage in the step 2.
- the third voltage and the application time of the third voltage may be selected based on the first current value obtained in the step 2. Specifically, when the first current value is 0.01 to 0.1 V, the third voltage may be 2 to 2.5 V and the application time of the third voltage may be 0.2 to 1 second. When the first current value is 0.1 to 1 V, the third voltage may be 2.5 to 3 V and the application time of the third voltage may be 0.2 to 1 second.
- the first voltage may be applied to the first electrode system to detect a third current value that flows through the first electrode system, and the third voltage and the application time of the third voltage may be selected based on the third current value.
- the first voltage may be, e.g., 0.05 to 1.0 V, preferably 0.1 to 0.8 V, and more preferably 0.2 to 0.6 V.
- the application time of the first voltage may be, e.g., 0.05 to 30 seconds, preferably 0.1 to 10 seconds, and more preferably 0.5 to 5 seconds.
- the third current value is 0.01 to 0.1 V
- the third voltage may be 2 to 2.5 V and the application time of the third voltage may be 0.2 to 1 second.
- the third current value is 0.1 to 1 V
- the third voltage may be 2.5 to 3 V and the application time of the third voltage may be 0.1 to 1 second.
- the amount of glucose obtained in the step 2 is corrected with the Hct value detected in the step 3 (the second step). This correction is preferably performed based on the calibration curve (including the calibration table) that has been previously prepared.
- the corrected amount of glucose is displayed or stored in the measuring device. Instead of correcting the amount of glucose after the Hct value has been determined, as described above, the amount of glucose may be corrected by directly using the current value (the second current value) that depends on the Hct value detected in the step 3 (the second step).
- a sensor shown in FIGS. 1 to 3 is produced in the same manner as Example 1.
- the sensor that includes the electrode C as the working electrode of the first electrode system, the electrode D and the electrode E as the counter electrode of the first electrode system, the electrode F as the working electrode of the second electrode system, and the electrode G as the counter electrode of the second electrode system, a response current and a sensitivity difference are determined by varying the blood component amount in blood.
- a response current and a sensitivity difference are determined by varying the blood component amount in blood.
- the measurement of a sample (blood) and a blood component (glucose) and the correction of the blood component are performed in the same manner as Example 1.
- the reagent layer is formed in the following manner.
- a reagent solution is prepared by dissolving glucose dehydrogenase, potassium ferricyanide (60 mM), and taurine (80 mM) in a CMC aqueous solution (0.1 wt %). Then, the reagent solution is dropped onto the electrodes and dried. The distance between the working electrode and the counter electrode is 0.1 mm or more. Three types of blood samples, in which the Hct values are adjusted to 25%, 45%, and 65%, respectively, are prepared for each glucose concentration.
- the sensor is used to measure a current flowing through both of the electrodes of the sensor and to determine a response current value and a sensitivity difference in the measurement of the Hct value under the following conditions: the first voltage is 400 mV and the application time of the first voltage is from 3 to 5 seconds; the second voltage is 2500 mV and the application time of the second voltage is from 4.5 to 5 seconds; and the third voltage is 2500 mV and the application time of the third voltage is from 5 to 5.5 seconds (see FIG. 5 ).
- Glu (C-DE) represents the application of the voltage to the first electrode system
- Hct (F-G) represents the application of the voltage to the second electrode system.
- the step 2 corresponds to a measuring time from 4.5 to 5 seconds
- the step 3 corresponds to a measuring time from 5 to 5.5 seconds
- the previous step corresponds to a measuring time from 3 to 4.5 seconds.
- the sensor is used to measure a current flowing through both of the electrodes of the sensor and to determine a response current value and a sensitivity difference in the measurement of the Hct value under the following conditions: the first voltage is 400 mV and the application time of the first voltage is 3 to 5 seconds; and the second voltage is 2500 mV and the application time of the second voltage is 5 to 5.5 seconds (see FIG. 4 ).
- Glu (C-DE) represents the application of the voltage to the first electrode system
- Hct (F-G) represents the application of the voltage to the second electrode system.
- the voltage is applied to the first electrode system, and then the voltage is applied to the second electrode system.
- the first voltage and the second voltage are not simultaneously applied to the first electrode system and the second electrode system, respectively.
- a response current value and a sensitivity difference in the measurement of the Hct value are determined in the same manner as Example 2, except that a blood component (glucose) concentration of the blood samples is 75 mg/dl, and a current flowing through both of the electrodes of the sensor is measured under the following conditions: the first voltage is 400 mV and the application time of the first voltage is from 3 to 5 seconds; the second voltage is 2000 mV and the application time of the second voltage is from 4.5 to 5 seconds; and the third voltage is 2500 mV and the application time of the third voltage is from 5 to 5.5 seconds (see FIG. 6 ).
- the first voltage is 400 mV and the application time of the first voltage is from 3 to 5 seconds
- the second voltage is 2000 mV and the application time of the second voltage is from 4.5 to 5 seconds
- the third voltage is 2500 mV and the application time of the third voltage is from 5 to 5.5 seconds (see FIG. 6 ).
- Glu (C-DE) represents the application of the voltage to the first electrode system
- Hct (F-G) represents the application of the voltage to the second electrode system.
- the step 2 corresponds to a measuring time from 4.5 to 5 seconds
- the step 3 corresponds to a measuring time from 5 to 5.5 seconds.
- the previous step corresponds to a measuring time from 3 to 4.5 seconds.
- FIG. 7 shows the results of the blood samples in which the blood component (glucose) concentration is 75 mg/dl.
- FIG. 7( a ) is a graph showing changes in the response current value (mV) over time with respect to the applied voltage (mV) in Comparative Example 1.
- FIG. 7( b ) is a graph showing changes in the sensitivity difference (%) over time with respect to the applied voltage (mV) in Comparative Example 1.
- a calibration curve is obtained from the correspondence between the first current value and the blood component (glucose) concentration.
- FIG. 7( b ) shows the sensitivity difference (%) from the true value when the calibration curve is applied to the blood sample with an Hct value of 25% and the blood sample with an Hct value of 65%.
- FIG. 8 shows the results of the blood samples in which the blood component (glucose) concentration is 75 mg/dl.
- FIG. 8( a ) is a graph showing changes in the response current value (mV) over time with respect to the applied voltage (mV) in Example 2.
- FIG. 8( b ) is a graph showing changes in the sensitivity difference (%) over time with respect to the applied voltage (mV) in Example 2.
- a calibration curve is obtained from the correspondence between the first current value and the blood component (glucose) concentration.
- FIG. 8( b ) shows the sensitivity difference (%) from the true value when the calibration curve is applied to the blood sample with an Hct value of 25% and the blood sample with an Hct value of 65%.
- FIG. 9 shows the results of the blood samples in which the blood component (glucose) concentration is 75 mg/dl.
- FIG. 9( a ) is a graph showing changes in the response current value (mV) over time with respect to the applied voltage (mV) in Example 3.
- FIG. 9( b ) is a graph showing changes in the sensitivity difference (%) over time with respect to the applied voltage (mV) in Example 3. Specifically, using the blood sample with an Hct value of 45% as a reference, a calibration curve is obtained from the correspondence between the first current value and the blood component (glucose) concentration.
- FIG. 9( a ) is a graph showing changes in the response current value (mV) over time with respect to the applied voltage (mV) in Example 3.
- FIGS. 7 to 9 shows the sensitivity difference (%) from the true value when the calibration curve is applied to the blood sample with an Hct value of 25% and the blood sample with an Hct value of 65%.
- “H25” represents the use of the blood sample with an Hct value of 25%
- “H45” represents the use of the blood sample with an Hct value of 45%
- “H65” represents the use of the blood sample with an Hct value of 65%.
- the sensitivity difference (%) after a measuring time of 4.5 seconds in FIG. 8( b ) is smaller than the sensitivity difference (%) in FIG. 7( b ) .
- This can confirm that the effect of the Hct is reduced when the blood component amount is measured for each of the blood samples with different Hct values, and thus the accuracy of the measured blood component amount is improved.
- the sensitivity difference (%) after a measuring time of 4.5 seconds in FIG. 9( b ) is smaller than the sensitivity difference (%) in FIG. 7( b ) . This can confirm that the effect of the Hct is reduced when the blood component amount is measured, and thus the accuracy of the measured blood component amount is improved.
- FIG. 10 shows the results of the blood samples in which the blood component (glucose) concentration is 150 mg/dl.
- FIG. 10( a ) is a graph showing changes in the response current value (mV) over time with respect to the applied voltage (mV) in Comparative Example 1.
- FIG. 10( b ) is a graph showing changes in the sensitivity difference (%) over time with respect to the applied voltage (mV) in Comparative Example 1.
- a calibration curve is obtained from the correspondence between the first current value and the blood component (glucose) concentration.
- FIG. 10( b ) shows the sensitivity difference (%) from the true value when the calibration curve is applied to the blood sample with an Hct value of 25% and the blood sample with an Hct value of 65%.
- FIG. 11 shows the results of the blood samples in which the blood component (glucose) concentration is 150 mg/dl.
- FIG. 11( a ) is a graph showing changes in the response current value (mV) over time with respect to the applied voltage (mV) in Example 2.
- FIG. 11( b ) is a graph showing changes in the sensitivity difference (%) over time with respect to the applied voltage (mV) in Example 2.
- a calibration curve is obtained from the correspondence between the first current value and the blood component (glucose) concentration.
- FIG. 11( b ) shows the sensitivity difference (%) from the true value when the calibration curve is applied to the blood sample with an Hct value of 25% and the blood sample with an Hct value of 65%.
- FIG. 12 shows the results of the blood samples in which the blood component (glucose) concentration is 150 mg/dl.
- FIG. 12( a ) is a graph showing changes in the response current value (mV) over time with respect to the applied voltage (mV) in Example 3.
- FIG. 12( b ) is a graph showing changes in the sensitivity difference (%) over time with respect to the applied voltage (mV) in Example 3. Specifically, using the blood sample with an Hct value of 45% as a reference, a calibration curve is obtained from the correspondence between the first current value and the blood component (glucose) concentration.
- FIG. 12 shows the results of the blood samples in which the blood component (glucose) concentration is 150 mg/dl.
- FIG. 12( a ) is a graph showing changes in the response current value (mV) over time with respect to the applied voltage (mV) in Example 3.
- FIG. 12( b ) is a graph showing changes in the sensitivity difference (%) over time with respect to the
- FIGS. 10 to 12 shows the sensitivity difference (%) from the true value when the calibration curve is applied to the blood sample with an Hct value of 25% and the blood sample with an Hct value of 65%.
- “H25” represents the use of the blood sample with an Hct value of 25%
- “H45” represents the use of the blood sample with an Hct value of 45%
- “H65” represents the use of the blood sample with an Hct value of 65%.
- the sensitivity difference (%) after a measuring time of 4.5 seconds in FIG. 11( b ) is smaller than the sensitivity difference (%) in FIG. 10( b ) .
- This can confirm that the effect of the Hct is reduced when the blood component amount is measured for each of the blood samples with different Hct values, and thus the accuracy of the measured blood component amount is improved.
- FIG. 12( a ) and FIG. 10( b ) in the measuring method of the present invention, as shown in FIG. 12( a ) and FIG.
- the sensitivity difference (%) after a measuring time of 4.5 seconds in FIG. 12( b ) is smaller than the sensitivity difference (%) in FIG. 10( b ) . This can confirm that the effect of the Hct is reduced when the blood component amount is measured for each of the blood samples with different Hct values, and thus the accuracy of the measured blood component amount is improved.
- FIG. 13 shows the results of the blood samples in which the blood component (glucose) concentration is 300 mg/dl.
- FIG. 13( a ) is a graph showing changes in the response current value (mV) over time with respect to the applied voltage (mV) in Comparative Example 1.
- FIG. 13( b ) is a graph showing changes in the sensitivity difference (%) over time with respect to the applied voltage (mV) in Comparative Example 1.
- a calibration curve is obtained from the correspondence between the first current value and the blood component (glucose) concentration.
- FIG. 13( b ) shows the sensitivity difference (%) from the true value when the calibration curve is applied to the blood sample with an Hct value of 25% and the blood sample with an Hct value of 65%.
- FIG. 14 shows the results of the blood samples in which the blood component (glucose) concentration is 300 mg/dl.
- FIG. 14( a ) is a graph showing changes in the response current value (mV) over time with respect to the applied voltage (mV) in Example 2.
- FIG. 14( b ) is a graph showing changes in the sensitivity difference (%) over time with respect to the applied voltage (mV) in Example 2.
- a calibration curve is obtained from the correspondence between the first current value and the blood component (glucose) concentration.
- FIG. 14( b ) shows the sensitivity difference (%) from the true value when the calibration curve is applied to the blood sample with an Hct value of 25% and the blood sample with an Hct value of 65%.
- FIG. 15 shows the results of the blood samples in which the blood component (glucose) concentration is 300 mg/dl.
- FIG. 15( a ) is a graph showing changes in the response current value (mV) over time with respect to the applied voltage (mV) in Example 3.
- FIG. 15( b ) is a graph showing changes in the sensitivity difference (%) over time with respect to the applied voltage (mV) in Example 3. Specifically, using the blood sample with an Hct value of 45% as a reference, a calibration curve is obtained from the correspondence between the first current value and the blood component (glucose) concentration.
- FIG. 15 shows the results of the blood samples in which the blood component (glucose) concentration is 300 mg/dl.
- FIG. 15( a ) is a graph showing changes in the response current value (mV) over time with respect to the applied voltage (mV) in Example 3.
- FIG. 15( b ) is a graph showing changes in the sensitivity difference (%) over time with respect to the
- FIGS. 13 to 15 shows the sensitivity difference (%) from the true value when the calibration curve is applied to the blood sample with an Hct value of 25% and the blood sample with an Hct value of 65%.
- “H25” represents the use of the blood sample with an Hct value of 25%
- “H45” represents the use of the blood sample with an Hct value of 45%
- “H65” represents the use of the blood sample with an Hct value of 65%.
- the sensitivity difference (%) after a measuring time of 4.5 seconds in FIG. 14( b ) is smaller than the sensitivity difference (%) in FIG. 13( b ) .
- This can confirm that the effect of the Hct is reduced when the blood component amount is measured for each of the blood samples with different Hct values, and thus the accuracy of the measured blood component amount is improved.
- FIG. 15( a ) and FIG. 15( b ) in the measuring method of the present invention, as shown in FIG. 15( a ) and FIG.
- the sensitivity difference (%) after a measuring time of 4.5 seconds in FIG. 15( b ) is smaller than the sensitivity difference (%) in FIG. 13( b ) . This can confirm that the effect of the Hct is reduced when the blood component amount is measured for each of the blood samples with different Hct values, and thus the accuracy of the measured blood component amount is improved.
- FIG. 16 is a summary of the results shown in FIGS. 7, 10, and 13 .
- FIG. 16( a ) is a graph showing the relationship between the application time and the applied current.
- FIG. 16( b ) is a graph showing changes in the blood component (glucose) concentration and the response current value (mV) over time when the application time is 5 seconds in Comparative Example 1.
- FIG. 16( c ) is a graph showing the blood component (glucose) concentration and the sensitivity difference (%) when the application time is 5 seconds in Comparative Example 1.
- FIG. 17 is a summary of the results shown in FIGS. 8, 11, and 14 .
- FIG. 17( a ) is a graph showing the relationship between the application time and the applied current.
- FIG. 17( b ) is a graph showing changes in the blood component (glucose) concentration and the response current value (mV) over time when the application time is 5 seconds in Example 2.
- FIG. 17( c ) is a graph showing the blood component (glucose) concentration and the sensitivity difference (%) when the application time is 5 seconds in Example 2.
- FIG. 18 is a summary of the results shown in FIGS. 9, 12, and 15 .
- FIG. 18( a ) is a graph showing the relationship between the application time and the applied current.
- FIG. 18( b ) is a graph showing changes in the blood component (glucose) concentration and the response current value (mV) over time when the application time is 5 seconds in Example 3.
- FIG. 18( c ) is a graph showing the blood component (glucose) concentration and the sensitivity difference (%) when the application time is 5 seconds in Example 3.
- the absolute value of the sensitivity difference (%) in Examples is small compared to the sensitivity difference (%) in Comparative Example in FIGS. 16( c ), 17( c ), and 18( c ) .
- This can confirm that the effect of the Hct is reduced when the blood component amount is measured for each of the blood samples with different Hct values, and thus the accuracy of the measured blood component amount is improved.
- FIG. 19( a ) and FIG. 19( b ) are graphs showing the relationship between the application time and the applied current in another aspect of the present invention.
- a current flows through both of the electrodes of the sensor under the following conditions: the first voltage is 400 mV and the application time of the first voltage is from 3 to 5 seconds; the second voltage is 1000 mV and the application time of the second voltage is from 4.5 to 5 seconds; and the third voltage is 2500 mV and the application time of the third voltage is from 5 to 5.5 seconds.
- the step 2 corresponds to a measuring time from 4.5 to 5 seconds
- the step 3 corresponds to a measuring time from 5 to 5.5 seconds.
- the previous step corresponds to a measuring time from 3 to 4.5 seconds.
- a current flows through both of the electrodes of the sensor under the following conditions: the first voltage is 400 mV and the application time of the first voltage is from 3 to 5 seconds; the second voltage is 1500 mV and the application time of the second voltage is from 4.5 to 5 seconds; and the third voltage is 2500 mV and the application time of the third voltage is from 5 to 5.5 seconds.
- the step 2 corresponds to a measuring time from 4.5 to 5 seconds
- the step 3 corresponds to a measuring time from 5 to 5.5 seconds.
- the previous step corresponds to a measuring time from 3 to 4.5 seconds.
- a response current value and a sensitivity difference in the measurement of the Hct value are determined in the same manner as Example 2, except that using a sensor that includes the electrode C as the working electrode of the first electrode system, the electrode D and the electrode E as the counter electrode of the first electrode system, the electrode F as the working electrode of the second electrode system, the electrode A as the counter electrode of the second electrode system, the electrode F as the working electrode of a third electrode system, and the electrode G as the counter electrode of the third electrode system, a current flowing through both of the electrodes of the sensor is measured under the following conditions: the first voltage is 400 mV and the application time of the first voltage is from 3 to 5 seconds; the second voltage is 2000 mV and the application time of the second voltage is from 4.5 to 5 seconds; and the third voltage is 2500 mV and the application time of the third voltage is from 5 to 5.5 seconds (see FIG.
- Glu (C-DE) represents the application of the voltage to the first electrode system
- Hct (F-A) represents the application of the voltage to the second electrode system
- Hct (F-G) represents the application of the voltage to the third electrode system.
- the step 2 corresponds to a measuring time from 4.5 to 5 seconds
- the step 3 corresponds to a measuring time from 5 to 5.5 seconds.
- the previous step corresponds to a measuring time from 3 to 4.5 seconds.
- the reagent layer 11 is arranged to cover a part of the electrodes C, D, E, and G.
- the third voltage is applied to the third electrode system instead of applying the third voltage to the second electrode system in the second step.
- FIG. 20 shows the results of the blood samples in which the blood component (glucose) concentration is 75 mg/dl.
- FIG. 20( a ) is a graph showing the relationship between the application time and the applied current.
- FIG. 20( b ) is a graph showing changes in the response current value (mV) over time with respect to the applied voltage (mV) in Example 4.
- FIG. 20( c ) is a graph showing changes in the sensitivity difference (%) over time with respect to the applied voltage (mV) in Example 4.
- a calibration curve is obtained from the correspondence between the first current value and the blood component (glucose) concentration.
- FIG. 20( c ) shows the sensitivity difference (%) from the true value when the calibration curve is applied to the blood sample with an Hct value of 25% and the blood sample with an Hct value of 65%.
- the sensitivity difference (%) after a measuring time of 4.5 seconds in FIG. 20( b ) is smaller than the sensitivity difference (%) in FIG. 7( b ) .
- This can confirm that the effect of the Hct is reduced when the blood component amount is measured for each of the blood samples with different Hct values, and thus the accuracy of the measured blood component amount is improved.
- FIG. 21 shows the results of the blood samples in which the blood component (glucose) concentration is 150 mg/dl.
- FIG. 21( a ) is a graph showing the relationship between the application time and the applied current.
- FIG. 21( b ) is a graph showing changes in the response current value (mV) over time with respect to the applied voltage (mV) in Example 4.
- FIG. 21( c ) is a graph showing changes in the sensitivity difference (%) over time with respect to the applied voltage (mV) in Example 4.
- a calibration curve is obtained from the correspondence between the first current value and the blood component (glucose) concentration.
- FIG. 21( c ) shows the sensitivity difference (%) from the true value when the calibration curve is applied to the blood sample with an Hct value of 25% and the blood sample with an Hct value of 65%.
- the sensitivity difference (%) after a measuring time of 4.5 seconds in FIG. 21( b ) is smaller than the sensitivity difference (%) in FIG. 10( b ) .
- This can confirm that the effect of the Hct is reduced when the blood component amount is measured for each of the blood samples with different Hct values, and thus the accuracy of the measured blood component amount is improved.
- FIG. 22 shows the results of the blood samples in which the blood component (glucose) concentration is 300 mg/dl.
- FIG. 22( a ) is a graph showing the relationship between the application time and the applied current.
- FIG. 22( b ) is a graph showing changes in the response current value (mV) over time with respect to the applied voltage (mV) in Example 4.
- FIG. 22( c ) is a graph showing changes in the sensitivity difference (%) over time with respect to the applied voltage (mV) in Example 4.
- a calibration curve is obtained from the correspondence between the first current value and the blood component (glucose) concentration.
- FIG. 22( c ) shows the sensitivity difference (%) from the true value when the calibration curve is applied to the blood sample with an Hct value of 25% and the blood sample with an Hct value of 65%.
- the sensitivity difference (%) after a measuring time of 4.5 seconds in FIG. 22( b ) is smaller than the sensitivity difference (%) in FIG. 13( b ) .
- This can confirm that the effect of the Hct is reduced when the blood component amount is measured for each of the blood samples with different Hct values, and thus the accuracy of the measured blood component amount is improved.
- FIG. 23 is a summary of the results shown in FIGS. 20, 21, and 22 .
- FIG. 23( a ) is a graph showing the relationship between the application time and the applied current.
- FIG. 23( b ) is a graph showing changes in the blood component (glucose) concentration and the response current value (mV) over time when the application time is 5 seconds in Example 4.
- FIG. 23( c ) is a graph showing the blood component (glucose) concentration and the sensitivity difference (%) when the application time is 5 seconds in Example 4.
- the absolute value of the sensitivity difference (%) in Example 4 is small compared to the sensitivity difference (%) in Comparative Example in FIG. 23( c ) . This can confirm that the effect of the Hct is reduced when the blood component amount is measured for each of the blood samples with different Hct values, and thus the accuracy of the measured blood component amount is improved.
- FIG. 24( a ) , FIG. 24( b ) , and FIG. 24( c ) are graphs showing the relationship between the application time and the applied current in another aspect of the present invention.
- a current flows through both of the electrodes of the sensor under the following conditions: the first voltage is 400 mV and the application time of the first voltage is from 3 to 5 seconds; the second voltage is 1000 mV and the application time of the second voltage is from 4.5 to 5 seconds; and the third voltage is 2500 mV and the application time of the third voltage is from 5 to 5.5 seconds.
- the step 2 corresponds to a measuring time from 4.5 to 5 seconds, and the step 3 corresponds to a measuring time from 5 to 5.5 seconds.
- Glu (C-DE) represents the application of the voltage to the first electrode system
- Hct (F-G) represents the application of the voltage to the second electrode system
- Hct (F-A) represents the application of the voltage to the third electrode system.
- the step 2 corresponds to a measuring time from 4.5 to 5 seconds
- the step 3 corresponds to a measuring time from 5 to 5.5 seconds.
- the previous step corresponds to a measuring time from 3 to 4.5 seconds.
- a current flows through both of the electrodes of the sensor under the following conditions: the first voltage is 400 mV and the application time of the first voltage is from 3 to 5 seconds; the second voltage is 1500 mV and the application time of the second voltage is from 4.5 to 5 seconds; and the third voltage is 2500 mV and the application time of the third voltage is from 5 to 5.5 seconds.
- the step 2 corresponds to a measuring time from 4.5 to 5 seconds
- the step 3 corresponds to a measuring time from 5 to 5.5 seconds.
- the previous step corresponds to a measuring time from 3 to 4.5 seconds.
- a current flows through both of the electrodes of the sensor under the following conditions: the first voltage is 400 mV and the application time of the first voltage is from 3 to 5 seconds; the second voltage is 2500 mV and the application time of the second voltage is from 4.5 to 5 seconds; and the third voltage is 2500 mV and the application time of the third voltage is from 5 to 5.5 seconds.
- the step 2 corresponds to a measuring time from 4.5 to 5 seconds
- the step 3 corresponds to a measuring time from 5 to 5.5 seconds.
- the previous step corresponds to a measuring time from 3 to 4.5 seconds.
- a response current value and a sensitivity difference in the measurement of the Hct value are determined in the same manner as Example 2, except that using a sensor that includes the electrode C as the working electrode of the first electrode system, the electrode D, the electrode E, and the electrode G as the counter electrode of the first electrode system, the electrode F as the working electrode of the second electrode system, and the electrode D, the electrode E, and the electrode G as the counter electrode of the second electrode system, a current flowing through both of the electrodes of the sensor is measured under the following conditions: the first voltage is 400 mV and the application time of the first voltage is from 3 to 5 seconds; the second voltage is 1000 mV and the application time of the second voltage is from 4.5 to 5 seconds; and the third voltage is 2500 mV and the application time of the third voltage is from 5 to 5.5 seconds (see FIG.
- Glu (C-DEG) represents the application of the voltage to the first electrode system
- Hct (F-DEG) represents the application of the voltage to the second electrode system.
- the step 2 corresponds to a measuring time from 4.5 to 5 seconds
- the step 3 corresponds to a measuring time from 5 to 5.5 seconds.
- the previous step corresponds to a measuring time from 3 to 4.5 seconds.
- the reagent layer 11 is arranged to cover a part of the electrodes C, D, E, and G.
- a response current value and a sensitivity difference in the measurement of the Hct value are determined in the same manner as Example 2, except that using a sensor that includes the electrode C as the working electrode of the first electrode system, the electrode D, the electrode E, and the electrode G as the counter electrode of the first electrode system, the electrode F as the working electrode of the second electrode system, and the electrode D, the electrode E, and the electrode G as the counter electrode of the second electrode system, a current flowing through both of the electrodes of the sensor is measured under the following conditions: the first voltage is 400 mV and the application time of the first voltage is from 3 to 5 seconds; the second voltage is 2000 mV and the application time of the second voltage is from 4.5 to 5 seconds; and the third voltage is 2500 mV and the application time of the third voltage is from 5 to 5.5 seconds (see FIG.
- Glu (C-DEG) represents the application of the voltage to the first electrode system
- Hct (F-DEG) represents the application of the voltage to the second electrode system.
- the step 2 corresponds to a measuring time from 4.5 to 5 seconds
- the step 3 corresponds to a measuring time from 5 to 5.5 seconds.
- the previous step corresponds to a measuring time from 3 to 4.5 seconds.
- the reagent layer 11 is arranged to cover a part of the electrodes C, D, E, and G.
- FIG. 25 shows the results of the blood samples in which the blood component (glucose) concentration is 75 mg/dl.
- FIG. 25( a ) is a graph showing the relationship between the application time and the applied current.
- FIG. 25( b ) is a graph showing changes in the response current value (mV) over time with respect to the applied voltage (mV) in Example 5.
- FIG. 25( c ) is a graph showing changes in the sensitivity difference (%) over time with respect to the applied voltage (mV) in Example 5.
- a calibration curve is obtained from the correspondence between the first current value and the blood component (glucose) concentration.
- FIG. 25( c ) shows the sensitivity difference (%) from the true value when the calibration curve is applied to the blood sample with an Hct value of 25% and the blood sample with an Hct value of 65%.
- FIG. 26 shows the results of the blood samples in which the blood component (glucose) concentration is 75 mg/dl.
- FIG. 26( a ) is a graph showing the relationship between the application time and the applied current.
- FIG. 26( b ) is a graph showing changes in the response current value (mV) over time with respect to the applied voltage (mV) in Example 6.
- FIG. 26( c ) is a graph showing changes in the sensitivity difference (%) over time with respect to the applied voltage (mV) in Example 6.
- a calibration curve is obtained from the correspondence between the first current value and the blood component (glucose) concentration.
- FIG. 26( c ) shows the sensitivity difference (%) from the true value when the calibration curve is applied to the blood sample with an Hct value of 25% and the blood sample with an Hct value of 65%.
- the sensitivity difference (%) after a measuring time of 4.5 seconds in FIG. 25( b ) is smaller than the sensitivity difference (%) in FIG. 7( b ) .
- This can confirm that the effect of the Hct is reduced when the blood component amount is measured for each of the blood samples with different Hct values, and thus the accuracy of the measured blood component amount is improved.
- the sensitivity difference (%) after a measuring time of 4.5 seconds in FIG. 26( b ) is smaller than the sensitivity difference (%) in FIG. 7( b ) . This can confirm that the effect of the Hct is reduced when the blood component amount is measured for each of the blood samples with different Hct values, and thus the accuracy of the measured blood component amount is improved.
- FIG. 27 shows the results of the blood samples in which the blood component (glucose) concentration is 150 mg/dl.
- FIG. 27( a ) is a graph showing the relationship between the application time and the applied current.
- FIG. 27( b ) is a graph showing changes in the response current value (mV) over time with respect to the applied voltage (mV) in Example 5.
- FIG. 27( c ) is a graph showing changes in the sensitivity difference (%) over time with respect to the applied voltage (mV) in Example 5.
- a calibration curve is obtained from the correspondence between the first current value and the blood component (glucose) concentration.
- FIG. 27( c ) shows the sensitivity difference (%) from the true value when the calibration curve is applied to the blood sample with an Hct value of 25% and the blood sample with an Hct value of 65%.
- FIG. 28 shows the results of the blood samples in which the blood component (glucose) concentration is 150 mg/dl.
- FIG. 28( a ) is a graph showing the relationship between the application time and the applied current.
- FIG. 28( b ) is a graph showing changes in the response current value (mV) over time with respect to the applied voltage (mV) in Example 6.
- FIG. 28( c ) is a graph showing changes in the sensitivity difference (%) over time with respect to the applied voltage (mV) in Example 6.
- a calibration curve is obtained from the correspondence between the first current value and the blood component (glucose) concentration.
- FIG. 28( c ) shows the sensitivity difference (%) from the true value when the calibration curve is applied to the blood sample with an Hct value of 25% and the blood sample with an Hct value of 65%.
- the sensitivity difference (%) after a measuring time of 4.5 seconds in FIG. 27( b ) is smaller than the sensitivity difference (%) in FIG. 10( b ) .
- This can confirm that the effect of the Hct is reduced when the blood component amount is measured for each of the blood samples with different Hct values, and thus the accuracy of the measured blood component amount is improved.
- the sensitivity difference (%) after a measuring time of 4.5 seconds in FIG. 28( b ) is smaller than the sensitivity difference (%) in FIG. 10( b ) . This can confirm that the effect of the Hct is reduced when the blood component amount is measured for each of the blood samples with different Hct values, and thus the accuracy of the measured blood component amount is improved.
- FIG. 29 shows the results of the blood samples in which the blood component (glucose) concentration is 300 mg/dl.
- FIG. 29( a ) is a graph showing the relationship between the application time and the applied current.
- FIG. 29( b ) is a graph showing changes in the response current value (mV) over time with respect to the applied voltage (mV) in Example 5.
- FIG. 29( c ) is a graph showing changes in the sensitivity difference (%) over time with respect to the applied voltage (mV) in Example 5.
- a calibration curve is obtained from the correspondence between the first current value and the blood component (glucose) concentration.
- FIG. 29( c ) shows the sensitivity difference (%) from the true value when the calibration curve is applied to the blood sample with an Hct value of 25% and the blood sample with an Hct value of 65%.
- FIG. 30 shows the results of the blood samples in which the blood component (glucose) concentration is 300 mg/dl.
- FIG. 30( a ) is a graph showing the relationship between the application time and the applied current.
- FIG. 30( b ) is a graph showing changes in the response current value (mV) over time with respect to the applied voltage (mV) in Example 6.
- FIG. 30( c ) is a graph showing changes in the sensitivity difference (%) over time with respect to the applied voltage (mV) in Example 6.
- a calibration curve is obtained from the correspondence between the first current value and the blood component (glucose) concentration.
- FIG. 30( c ) shows the sensitivity difference (%) from the true value when the calibration curve is applied to the blood sample with an Hct value of 25% and the blood sample with an Hct value of 65%.
- the sensitivity difference (%) after a measuring time of 4.5 seconds in FIG. 29( b ) is smaller than the sensitivity difference (%) in FIG. 13( b ) .
- This can confirm that the effect of the Hct is reduced when the blood component amount is measured for each of the blood samples with different Hct values, and thus the accuracy of the measured blood component amount is improved.
- the sensitivity difference (%) after a measuring time of 4.5 seconds in FIG. 30( b ) is smaller than the sensitivity difference (%) in FIG. 13( b ) . This can confirm that the effect of the Hct is reduced when the blood component amount is measured for each of the blood samples with different Hct values, and thus the accuracy of the measured blood component amount is improved.
- FIG. 31 shows the results of the blood samples in which the blood component (glucose) concentration is 600 mg/dl.
- FIG. 31( a ) is a graph showing the relationship between the application time and the applied current.
- FIG. 31( b ) is a graph showing changes in the response current value (mV) over time with respect to the applied voltage (mV) in Example 5.
- FIG. 31( c ) is a graph showing changes in the sensitivity difference (%) over time with respect to the applied voltage (mV) in Example 5.
- a calibration curve is obtained from the correspondence between the first current value and the blood component (glucose) concentration.
- FIG. 31( c ) shows the sensitivity difference (%) from the true value when the calibration curve is applied to the blood sample with an Hct value of 25% and the blood sample with an Hct value of 65%.
- FIG. 32 shows the results of the blood samples in which the blood component (glucose) concentration is 600 mg/dl.
- FIG. 32( a ) is a graph showing the relationship between the application time and the applied current in Comparative Example 1.
- FIG. 32( b ) is a graph showing changes in the response current value (mV) over time with respect to the applied voltage (mV) in Comparative Example 1.
- FIG. 32( c ) is a graph showing changes in the sensitivity difference (%) over time with respect to the applied voltage (mV) in Comparative Example 1.
- a calibration curve is obtained from the correspondence between the first current value and the blood component (glucose) concentration.
- FIG. 32( c ) shows the sensitivity difference (%) from the true value when the calibration curve is applied to the blood sample with an Hct value of 25% and the blood sample with an Hct value of 65%.
- the sensitivity difference (%) after a measuring time of 4.5 seconds in FIG. 31( b ) is smaller than the sensitivity difference (%) in FIG. 32( b ) .
- This can confirm that the effect of the Hct is reduced when the blood component amount is measured for each of the blood samples with different Hct values, and thus the accuracy of the measured blood component amount is improved.
- H25 represents the use of the blood sample with an Hct value of 25%
- H45 represents the use of the blood sample with an Hct value of 45%
- H65 represents the use of the blood sample with an Hct value of 65%.
- FIG. 33 is a summary of the results shown in FIGS. 25, 27, 29, and 31 .
- FIG. 33( a ) is a graph showing the relationship between the application time and the applied current.
- FIG. 33( b ) is a graph showing changes in the blood component (glucose) concentration and the response current value (mV) over time when the application time is 5 seconds in Example 5.
- FIG. 33( c ) is a graph showing the blood component (glucose) concentration and the sensitivity difference (%) when the application time is 5 seconds in Example 5.
- the absolute value of the sensitivity difference (%) in Example 5 is small compared to the sensitivity difference (%) in Comparative Example in FIG. 33( c ) . This can confirm that the effect of the Hct is reduced when the blood component amount is measured for each of the blood samples with different Hct values, and thus the accuracy of the measured blood component amount is improved.
- FIG. 34 is a summary of the results shown in FIGS. 26, 28, and 30 .
- FIG. 34( a ) is a graph showing the relationship between the application time and the applied current.
- FIG. 34( b ) is a graph showing changes in the blood component (glucose) concentration and the response current value (mV) over time when the application time is 5 seconds in Example 6.
- FIG. 34( c ) is a graph showing the blood component (glucose) concentration and the sensitivity difference (%) when the application time is 5 seconds in Example 6.
- the absolute value of the sensitivity difference (%) in Example 6 is small compared to the sensitivity difference (%) in Comparative Example in FIG. 34( c ) . This can confirm that the effect of the Hct is reduced when the blood component amount is measured for each of the blood samples with different Hct values, and thus the accuracy of the measured blood component amount is improved.
- FIGS. 35, 36, and 37 show an example of a sensor for measuring blood components used in the measuring method of the present invention.
- FIG. 35 is an exploded perspective view of the sensor.
- FIG. 36 is a cross-sectional view of the sensor.
- FIG. 37 is a plan view of the sensor.
- the same portions are denoted by the same reference numerals.
- the senor includes an insulating substrate 201 and seven electrodes A, B, C, D, E, G, and F formed on the insulating substrate 201 . These electrodes can switch between the working electrode and the counter electrode. The surfaces of the electrodes A, B, C, D, E, F, and G are coated with a polymeric material such as CMC.
- a reagent layer 21 is arranged to cover a part of the electrodes A, B, C, D, E, and G.
- the reagent layer 21 includes an oxidoreductase such as glucose dehydrogenase and a mediator such as potassium ferricyanide, and may include, e.g., an enzyme stabilizer and a crystal homogenizing agent as optional components.
- a cover 203 is disposed on the insulating substrate 201 via a spacer 202 , while leaving one end of the sensor (i.e., the right end in the drawings) uncovered.
- a flow path 24 is formed by the insulating substrate 201 , the spacer 202 , and the cover 203 to introduce blood into each of the electrodes (A, B, C, D, E, F, and G).
- the end of the flow path 24 extends to the other end of the sensor (i.e., the left end in the drawings) and is open to the outside, thereby serving as a blood inlet 22 .
- Each of the seven electrodes (A, B, C, D, E, F, and G) is connected to a lead, and the leads extend to the one end of the sensor (i.e., the right end in the drawings). The ends of the leads are exposed and not covered with the cover.
- the cover 203 has an air hole 23 in a portion corresponding to the right end of the flow path 24 .
- the material of the insulating substrate is not particularly limited and may be, e.g., polyethylene terephthalate (PET), polycarbonate (PC), polyimide (PI), polyethylene (PE), polypropylene (PP), polystyrene (PS), polyvinyl chloride (PVC), polyoxymethylene (POM), monomer-cast nylon (MC), polybutylene terephthalate (PBT), methacrylate resin (PMMA), ABS resin (ABS), or glass.
- PET polyethylene terephthalate
- PC polycarbonate
- PI polyimide
- PET polyethylene terephthalate
- PET polyethylene terephthalate
- PC polycarbonate
- PI polyimide
- PET polyethylene terephthalate
- PET polyethylene terephthalate
- PET polycarbonate
- PI polyimide
- PET polyethylene terephthalate
- PET polyethylene terephthalate
- PET polycarbonate
- PI polyimide
- PET polyethylene terephthal
- the insulating substrate has a total length of 5 to 100 mm, a width of 2 to 50 mm, and a thickness of 0.05 to 2 mm, preferably has a total length of 7 to 50 mm, a width of 3 to 20 mm, and a thickness of 0.1 to 1 mm, and more preferably has a total length of 10 to 30 mm, a width of 3 to 10 mm, and a thickness of 0.1 to 0.6 mm.
- the material and size of the insulating substrate are the same as in Examples 8 to 9, as will be described later.
- the electrodes and the leads on the insulating substrate can be provided, e.g., by forming a conductive layer by sputtering or evaporation with the use of a material such as gold, platinum, or palladium, and processing the conductive layer into a particular electrode pattern with a laser.
- the laser may be, e.g., a YAG laser, a CO 2 laser, or an excimer laser. This process also is the same as in Examples 8 to 9, as will be described later.
- the reagent layer 21 is formed in the following manner. For example, an aqueous solution containing 0.1 to 5 U per sensor of glucose dehydrogenase, 10 to 200 mM of potassium ferricyanide, 1 to 50 mM of maltitol, and 20 to 200 mM of taurine is dropped onto a circular slit portion 30 (not shown) and dried. The presence of the slit portion 30 can suppress the spread of the dropped aqueous solution, so that the reagent layer 21 can be located in a more accurate position. Thus, the reagent layer 21 is formed to cover a part of the electrodes A, B, C, D, E, and G.
- the drying process may be, e.g., natural drying or hot-air forced drying. However, if the temperature is too high, the enzyme can be inactivated. Therefore, the hot air of about 50° C. is preferably used.
- the material of the spacer is not particularly limited and may be, e.g., the same as that of the insulating substrate.
- the size of the spacer is not particularly limited.
- the spacer has a total length of 5 to 100 mm, a width of 2 to 50 mm, and a thickness of 0.01 to 1 mm, preferably has a total length of 7 to 50 mm, a width of 3 to 20 mm, and a thickness of 0.05 to 0.5 mm, and more preferably has a total length of 10 to 30 mm, a width of 3 to 10 mm, and a thickness of 0.05 to 0.25 mm.
- the spacer in this example has an I-shaped notch that serves as a flow path for the introduction of blood.
- the I-shaped notch has a total length of 0.5 to 8 mm and a width of 0.1 to 5 mm, preferably has a total length of 1 to 10 mm and a width of 0.2 to 3 mm, and more preferably has a total length of 1 to 5 mm and a width of 0.5 to 2 mm.
- the notch may be formed, e.g., by punching through the spacer with a laser or drill, or by using a die that allows a notch to be provided during the formation of the spacer.
- the material, size, and notch of the spacer are the same as in Examples 8 to 9, as will be described later.
- the material of the cover is not particularly limited and may be, e.g., the same as that of the insulating substrate. It is more preferable that a portion of the cover that forms the ceiling of the flow path for the introduction of blood is subjected to a hydrophilic treatment.
- the hydrophilic treatment may be, e.g., a method for applying a surface active agent or a method for introducing a hydrophilic functional group such as a hydroxyl group, a carbonyl group, or a carboxyl group into the surface of the cover by plasma processing. Alternatively, a layer of a surface active agent such as lecithin may be formed on the reagent layer.
- the size of the cover is not particularly limited.
- the cover has a total length of 5 to 100 mm, a width of 3 to 50 mm, and a thickness of 0.01 to 0.5 mm, preferably has a total length of 10 to 50 mm, a width of 3 to 20 mm, and a thickness of 0.05 to 0.25 mm, and more preferably has a total length of 15 to 30 mm, a width of 5 to 10 mm, and a thickness of 0.05 to 0.1 mm.
- the cover preferably has an air hole, e.g., in the form of a circle, ellipse, or polygon.
- the air hole has a maximum diameter of 0.01 to 10 mm, preferably has a maximum diameter of 0.05 to 5 mm, and more preferably has a maximum diameter of 0.1 to 2 mm.
- the air hole may be formed, e.g., by punching through the cover with a laser or drill, or by using a die that allows an air vent to be provided during the formation of the cover.
- the material, size, and air hole of the cover are the same as in Examples 8 to 9, as will be described later.
- the insulating substrate, the spacer, and the cover are laminated in this order and integrated into one component, thereby producing the sensor.
- the three members are joined together, e.g., using an adhesive or a heat seal.
- the adhesive include an epoxy adhesive, an acrylic adhesive, a polyurethane adhesive, a thermosetting adhesive (such as a hot-melt adhesive), and a UV curable adhesive. This process also is the same as in Examples 8 to 9, as will be described later.
- a blood component amount e.g., a blood glucose level is measured with the above sensor in the following manner.
- a special-purpose lancet is used to prick the finger tip or the like and draw a small amount of blood.
- the sensor is set in a special-purpose measuring device (meter). The blood is brought into contact with the blood inlet of the sensor set in the measuring device, and then is introduced into the sensor by capillary action. Analysis of the blood by the sensor is performed in the following steps.
- the electrode B is used as the working electrode of the first electrode system
- the electrode E and the electrode G are used as the counter electrode of the first electrode system
- the electrode F is used as the working electrode of the second electrode system
- the electrode A, the electrode C, and the electrode D are used as the counter electrode of the second electrode system.
- a voltage is applied between the electrode D and the electrode E, and the introduction of the blood is detected by a change in a current value due to the blood introduced into the sensor. After confirming the introduction of the blood, the next step is started.
- the applied voltage is, e.g., 0.05 to 1 V, and glucose in the blood reacts with the glucose oxidoreductase for a certain period of time.
- a first voltage is applied to both of the electrodes of the first electrode system (i.e., the working electrode including the electrode B and the counter electrode including the electrode E and the electrode G), and a second voltage is applied to both of the electrodes of the second electrode system (i.e., the working electrode including the electrode F and the counter electrode including the electrode A, the electrode C, and the electrode D) (the first step).
- the reagent layer 21 is formed to cover a part of the electrode portion composed of the electrode A (the counter electrode of the second electrode system), the electrode B (the working electrode of the first electrode system), the electrode C (the counter electrode of the second electrode system), the electrode D (the counter electrode of the second electrode system), the electrode E (the counter electrode of the first electrode system), and the electrode G (the counter electrode of the first electrode system) of the biosensor.
- the reduced mediator that is generated on the electrode C of the first electrode system by the enzyme reaction is oxidized, and an oxidation current (a first current value) is detected. Based on the oxidation current (the first current value), an apparent amount of glucose (an apparent blood component amount) in the blood is calculated.
- the application time of the first voltage is the same as that of the second voltage.
- the reaction time between the glucose and the oxidoreductase may be, e.g., 0 to 60 seconds, preferably 0 to 30 seconds, and more preferably 0 to 10 seconds.
- the first voltage in the step 2 (the first step) may be, e.g., 0.05 to 1.0 V, preferably 0.1 to 0.8 V, and more preferably 0.2 to 0.6 V.
- the application time of the first voltage may be, e.g., 0.05 to 30 seconds, preferably 0.1 to 10 seconds, and more preferably 0.5 to 5 seconds.
- the second voltage in the step 2 may be, e.g., 0.5 to 5 V, preferably 1 to 3 V, and more preferably 1.5 to 2.5 V.
- the application time of the second voltage may be, e.g., 0.01 to 5 seconds, preferably 0.01 to 2.5 seconds, and more preferably 0.1 to 1 second.
- the combinations of the first voltage and the second voltage in the step 2 may include the following.
- the first voltage is 0.05 to 1 V and the application time of the first voltage is 0.05 to 30 seconds
- the second voltage is 0.5 to 5 V and the application time of the second voltage is 0.01 to 5 seconds.
- the first voltage is 0.01 to 0.8 V and the application time of the first voltage is 0.1 to 10 seconds
- the second voltage is 1 to 3 V and the application time of the second voltage is 0.01 to 2.5 seconds.
- the first voltage is 0.2 to 0.6 V and the application time of the first voltage is 0.5 to 5 seconds
- the second voltage is 1.5 to 2.5 V and the application time of the second voltage is 0.1 to 1 second.
- the measuring method may include a previous step of applying the first voltage only to the first electrode system before the first voltage is applied to both of the electrodes of the first electrode system and the second voltage is applied to both of the electrodes of the second electrode system in the step 2 (the first step).
- the first voltage in the previous step may be, e.g., 0.05 to 1.0 V, preferably 0.1 to 0.8 V, and more preferably 0.2 to 0.6 V.
- the application time of the first voltage in the previous step may be, e.g., 0.05 to 30 seconds, preferably 0.1 to 10 seconds, and more preferably 0.5 to 5 seconds.
- the second voltage and the application time of the second voltage may be selected based on the first current value obtained in the step 2 (the first step). Specifically, when the first current value is 0.01 to 0.1 V, the second voltage may be 1.5 to 2.0 V and the application time of the second voltage may be 0.1 to 1 second. When the first current value is 0.1 to 1 V, the second voltage may be 2.0 to 2.5 V and the application time of the second voltage may be 0.1 to 1 second.
- the first voltage may be applied only to the first electrode system to detect a third current value that flows through the first electrode system, and the second voltage and the application time of the second voltage may be selected by the first current value obtained in the step 2, based on the third current value.
- the first voltage may be, e.g., 0.05 to 1.0 V, preferably 0.1 to 0.8 V, and more preferably 0.2 to 0.6 V.
- the application time of the first voltage may be, e.g., 0.05 to 30 seconds, preferably 0.1 to 10 seconds, and more preferably 0.5 to 5 seconds.
- the third current value is 0.01 to 0.1 V
- the second voltage may be 1.5 to 2 V and the application time of the second voltage may be 0.1 to 1 second.
- the third current value is 0.1 to 1 V
- the second voltage may be 2.0 to 2.5 V and the application time of the third voltage may be 0.1 to 1 second.
- the application of the first voltage to the first electrode system is stopped, and a third voltage is applied to both of the electrodes of the second electrode system (i.e., the working electrode including the electrode F and the counter electrode including the electrode A, the electrode C, and the electrode D), so that a current (a second current value) that depends on an Hct value based on the electrolytic oxidation reaction of glucose can be detected (the second step).
- the conversion from the detected current (the second current value) to an Hct value can be performed by previously determining the calibration curve or the calibration table. This correction may use the Hct value obtained from the calibration curve of the current and the Hct value, which has been previously prepared, or may use the detected current directly.
- the third voltage in the step 3 may be, e.g., 0.1 to 10 V, preferably 0.1 to 6.5 V, and more preferably 0.5 to 2.5 V.
- the application time of the third voltage may be, e.g., 0.05 to 10 seconds, preferably 0.1 to 5 seconds, and more preferably 0.2 to 1 second.
- the mediator is not arranged on the electrode F (the working electrode).
- the step 3 (the second step) may be performed either immediately after the step 2 (the first step) or after a time interval from the step 2 (the first step).
- the time interval may be, e.g., 0 to 10 seconds, preferably 0.05 to 5 seconds, and more preferably 0.1 to 1 second.
- the third voltage in the step 3 may be either the same as or different from the second voltage in the step 2.
- the third voltage and the application time of the third voltage may be selected based on the first current value obtained in the step 2. Specifically, when the first current value is 0.01 to 0.1 V, the third voltage may be 2 to 2.5 V and the application time of the third voltage may be 0.2 to 1 second. When the first current value is 0.1 to 1 V, the third voltage may be 2.5 to 3 V and the application time of the third voltage may be 0.2 to 1 second.
- the first voltage may be applied to the first electrode system to detect a third current value that flows through the first electrode system, and the third voltage and the application time of the third voltage may be selected by the first current value obtained in the step 2, based on the third current value.
- the third voltage may be 2 to 2.5 V and the application time of the third voltage may be 0.2 to 1 second.
- the third current value is 0.1 to 1 V
- the third voltage may be 2.5 to 2 V and the application time of the third voltage may be 0.1 to 1 second.
- the amount of glucose obtained in the step 2 is corrected with the Hct value detected in the step 3 (the second step). This correction is preferably performed based on the calibration curve (including the calibration table) which has been previously prepared.
- the corrected amount of glucose is displayed or stored in the measuring device. Instead of correcting the amount of glucose after the Hct value has been determined, as described above, the amount of glucose may be corrected by directly using the current value (the second current value) that depends on the Hct value detected in the step 3 (the second step).
- a sensor shown in FIGS. 35 to 37 is produced in the same manner as Example 7.
- the sensor that includes the electrode B as the working electrode of the first electrode system, the electrode E and the electrode G as the counter electrode of the first electrode system, the electrode F as the working electrode of the second electrode system, and the electrode A, the electrode C, and the electrode D as the counter electrode of the second electrode system, a response current and a sensitivity difference are determined by varying the blood component amount in blood.
- a response current and a sensitivity difference are determined by varying the blood component amount in blood.
- the measurement of a sample (blood) and a blood component (glucose) and the correction of the blood component are performed in the same manner as Example 7.
- the reagent layer is formed in the following manner.
- a reagent solution is prepared by dissolving glucose dehydrogenase, potassium ferricyanide (60 mM), and taurine (80 mM) in a CMC aqueous solution (0.1 wt %). Then, the reagent solution is dropped onto the electrodes and dried. The distance between the working electrode and the counter electrode is 0.1 mm or more. Three types of blood samples, in which the Hct values are adjusted to 25%, 45%, and 65%, respectively, are prepared for each glucose concentration.
- the sensor is used to measure a current flowing through both of the electrodes of the sensor and to determine a response current value and a sensitivity difference in the measurement of the Hct value under the following conditions: the first voltage is 400 mV and the application time of the first voltage is from 3 to 5 seconds; the second voltage is 2500 mV and the application time of the second voltage is from 4.5 to 5 seconds; and the third voltage is 2500 mV and the application time of the third voltage is from 5 to 5.5 seconds (see FIG. 39( a ) ).
- the first voltage is 400 mV and the application time of the first voltage is from 3 to 5 seconds
- the second voltage is 2500 mV and the application time of the second voltage is from 4.5 to 5 seconds
- the third voltage is 2500 mV and the application time of the third voltage is from 5 to 5.5 seconds (see FIG. 39( a ) ).
- the first voltage is 400 mV and the application time of the first voltage is from 3 to 5 seconds
- the second voltage is 2500 m
- Glu (B-EG) represents the application of the voltage to the first electrode system
- Hct (F-ACD) represents the application of the voltage to the second electrode system.
- the step 2 corresponds to a measuring time from 4.5 to 5 seconds
- the step 3 corresponds to a measuring time from 5 to 5.5 seconds.
- the previous step corresponds to a measuring time from 3 to 4.5 seconds.
- the sensor is used to measure a current flowing through both of the electrodes of the sensor and to determine a response current value and a sensitivity difference in the measurement of the Hct value under the following conditions: the first voltage is 400 mV and the application time of the first voltage is 3 to 5 seconds; and the second voltage is 2500 mV and the application time of the second voltage is 5 to 5.5 seconds (see FIG. 38( a ) ).
- the first voltage is 400 mV and the application time of the first voltage is 3 to 5 seconds
- the second voltage is 2500 mV and the application time of the second voltage is 5 to 5.5 seconds (see FIG. 38( a ) ).
- Glu (B-ACDEG) represents the application of the voltage to the first electrode system
- Hct (F-AF) represents the application of the voltage to the second electrode system.
- the voltage is applied to the first electrode system, and then the voltage is applied to the second electrode system. Unlike the step 2 of the present invention, the first voltage and the second voltage are not simultaneously applied to the first electrode system and the second electrode system, respectively.
- a response current value and a sensitivity difference in the measurement of the Hct value are determined in the same manner as Example 8, except that using a sensor that includes the electrode B as the working electrode of the first electrode system, the electrode A, the electrode C, and the electrode D as the counter electrode of the first electrode system, the electrode F as the working electrode of the second electrode system, the electrode A and the electrode G as the counter electrode of the second electrode system, the electrode F as the working electrode of a third electrode system, and the electrode E as the counter electrode of the third electrode system, a current flowing through both of the electrodes of the sensor is measured under the following conditions: the first voltage is 400 mV and the application time of the first voltage is from 3 to 5 seconds; the second voltage is 2500 mV and the application time of the second voltage is from 4.5 to 5 seconds; and the third voltage is 2500 mV and the application time of the third voltage is from 5 to 5.5 seconds (see FIG.
- Glu (B-ACD) represents the application of the voltage to the first electrode system
- Hct (FAG) represents the application of the voltage to the second electrode system
- Hct (F-EG) represents the application of the voltage to the third electrode system.
- the step 2 corresponds to a measuring time from 4.5 to 5 seconds
- the step 3 corresponds to a measuring time from 5 to 5.5 seconds.
- the previous step corresponds to a measuring time from 3 to 4.5 seconds.
- the reagent layer 21 is arranged to cover a part of the electrodes A, B, C, D, E, and G.
- the third voltage is applied to the third electrode system instead of applying the third voltage to the second electrode system in the second step.
- FIG. 38 shows the results of the blood samples in which the blood component (glucose) concentration is 75 mg/dl.
- FIG. 38( a ) is a graph showing the relationship between the application time and the applied current.
- FIG. 38( b ) is a graph showing changes in the response current value (mV) over time with respect to the applied voltage (mV) in Comparative Example 2.
- FIG. 38( c ) is a graph showing changes in the sensitivity difference (%) over time with respect to the applied voltage (mV) in Comparative Example 2.
- a calibration curve is obtained from the correspondence between the first current value and the blood component (glucose) concentration.
- FIG. 38( c ) shows the sensitivity difference (%) from the true value when the calibration curve is applied to the blood sample with an Hct value of 25% and the blood sample with an Hct value of 65%.
- FIG. 39 shows the results of the blood samples in which the blood component (glucose) concentration is 75 mg/dl.
- FIG. 39( a ) is a graph showing the relationship between the application time and the applied current.
- FIG. 39( b ) is a graph showing changes in the response current value (mV) over time with respect to the applied voltage (mV) in Example 8.
- FIG. 39( c ) is a graph showing changes in the sensitivity difference (%) over time with respect to the applied voltage (mV) in Example 8.
- a calibration curve is obtained from the correspondence between the first current value and the blood component (glucose) concentration.
- FIG. 39( c ) shows the sensitivity difference (%) from the true value when the calibration curve is applied to the blood sample with an Hct value of 25% and the blood sample with an Hct value of 65%.
- FIG. 40 shows the results of the blood samples in which the blood component (glucose) concentration is 75 mg/dl.
- FIG. 40( a ) is a graph showing the relationship between the application time and the applied current.
- FIG. 40( b ) is a graph showing changes in the response current value (mV) over time with respect to the applied voltage (mV) in Example 9.
- FIG. 40( c ) is a graph showing changes in the sensitivity difference (%) over time with respect to the applied voltage (mV) in Example 9.
- a calibration curve is obtained from the correspondence between the first current value and the blood component (glucose) concentration.
- FIGS. 39 to 40 shows the sensitivity difference (%) from the true value when the calibration curve is applied to the blood sample with an Hct value of 25% and the blood sample with an Hct value of 65%.
- “H25” represents the use of the blood sample with an Hct value of 25%
- “H45” represents the use of the blood sample with an Hct value of 45%
- “H65” represents the use of the blood sample with an Hct value of 65%.
- the sensitivity difference (%) after a measuring time of 4.5 seconds in FIG. 39( c ) is smaller than the sensitivity difference (%) in FIG. 38( c ) .
- This can confirm that the effect of the Hct is reduced when the blood component amount is measured for each of the blood samples with different Hct values, and thus the accuracy of the measured blood component amount is improved.
- the sensitivity difference (%) after a measuring time of 4.5 seconds in FIG. 40( c ) is smaller than the sensitivity difference (%) in FIG. 38( c ) . This can confirm that the effect of the Hct is reduced when the blood component amount is measured for each of the blood samples with different Hct values, and thus the accuracy of the measured blood component amount is improved.
- FIG. 41 is a summary of the results shown in FIG. 38 .
- FIG. 41( a ) is a graph showing the relationship between the application time and the applied current.
- FIG. 41( b ) is a graph showing changes in the blood component (glucose) concentration and the response current value (mV) over time when the application time is 5 seconds in Comparative Example 2.
- FIG. 41( c ) is a graph showing the blood component (glucose) concentration and the sensitivity difference (%) when the application time is 5 seconds in Comparative Example 2.
- FIG. 42 is a summary of the results shown in FIG. 39 .
- FIG. 42( a ) is a graph showing the relationship between the application time and the applied current.
- FIG. 42( b ) is a graph showing changes in the blood component (glucose) concentration and the response current value (mV) over time when the application time is 5 seconds in Example 8.
- FIG. 42( c ) is a graph showing the blood component (glucose) concentration and the sensitivity difference (%) when the application time is 5 seconds in Example 8.
- the absolute value of the sensitivity difference (%) in Example 8 is small compared to the sensitivity difference (%) in Comparative Example 2 in FIG. 42( c ) . This can confirm that the effect of the Hct is reduced when the blood component amount is measured for each of the blood samples with different Hct values, and thus the accuracy of the measured blood component amount is improved.
- FIG. 43 is a summary of the results shown in FIG. 40 .
- FIG. 43( a ) is a graph showing the relationship between the application time and the applied current.
- FIG. 43( b ) is a graph showing changes in the blood component (glucose) concentration and the response current value (mV) over time when the application time is 5 seconds in Example 9.
- FIG. 43( c ) is a graph showing the blood component (glucose) concentration and the sensitivity difference (%) when the application time is 5 seconds in Example 9.
- the absolute value of the sensitivity difference (%) in Example 8 is small compared to the sensitivity difference (%) in Comparative Example 2 in FIG. 43( c ) . This can confirm that the effect of the Hct is reduced when the blood component amount is measured for each of the blood samples with different Hct values, and thus the accuracy of the measured blood component amount is improved.
- the method for measuring a blood component amount of the present invention reduces the effect of Hct, and thus improves the accuracy of the measured blood component amount. Therefore, the measuring method of the present invention can be preferably used in all fields that require the measurement of blood components such as biology, biochemistry, and medicine. In particular, the measuring method of the present invention is suitable for the field of clinical examination.
Landscapes
- Health & Medical Sciences (AREA)
- Life Sciences & Earth Sciences (AREA)
- Chemical & Material Sciences (AREA)
- General Health & Medical Sciences (AREA)
- Molecular Biology (AREA)
- Immunology (AREA)
- Physics & Mathematics (AREA)
- Analytical Chemistry (AREA)
- Biochemistry (AREA)
- Pathology (AREA)
- Electrochemistry (AREA)
- Chemical Kinetics & Catalysis (AREA)
- General Physics & Mathematics (AREA)
- Hematology (AREA)
- Organic Chemistry (AREA)
- Zoology (AREA)
- Proteomics, Peptides & Aminoacids (AREA)
- Engineering & Computer Science (AREA)
- Wood Science & Technology (AREA)
- Biophysics (AREA)
- Biotechnology (AREA)
- Microbiology (AREA)
- Emergency Medicine (AREA)
- Bioinformatics & Cheminformatics (AREA)
- General Engineering & Computer Science (AREA)
- Genetics & Genomics (AREA)
- Investigating Or Analysing Biological Materials (AREA)
Applications Claiming Priority (3)
| Application Number | Priority Date | Filing Date | Title |
|---|---|---|---|
| JP2013-244987 | 2013-11-27 | ||
| JP2013244987 | 2013-11-27 | ||
| PCT/JP2014/005666 WO2015079635A1 (ja) | 2013-11-27 | 2014-11-11 | 血液成分量の測定方法 |
Publications (2)
| Publication Number | Publication Date |
|---|---|
| US20160273017A1 US20160273017A1 (en) | 2016-09-22 |
| US10066253B2 true US10066253B2 (en) | 2018-09-04 |
Family
ID=53198613
Family Applications (1)
| Application Number | Title | Priority Date | Filing Date |
|---|---|---|---|
| US15/034,725 Active 2035-03-13 US10066253B2 (en) | 2013-11-27 | 2014-11-11 | Method of measuring blood component amount |
Country Status (5)
| Country | Link |
|---|---|
| US (1) | US10066253B2 (ja) |
| EP (1) | EP3076167B1 (ja) |
| JP (1) | JP6635789B2 (ja) |
| CN (1) | CN105793700B (ja) |
| WO (1) | WO2015079635A1 (ja) |
Cited By (1)
| Publication number | Priority date | Publication date | Assignee | Title |
|---|---|---|---|---|
| US11255834B2 (en) * | 2016-03-22 | 2022-02-22 | Conductive Technologies, Inc. | Physical characteristic determination of a biological sample |
Families Citing this family (5)
| Publication number | Priority date | Publication date | Assignee | Title |
|---|---|---|---|---|
| JP6577402B2 (ja) * | 2015-04-06 | 2019-09-18 | アークレイ株式会社 | ヘマトクリット値測定用電極を備えたバイオセンサ |
| EP3546932A4 (en) * | 2016-11-25 | 2019-12-04 | PHC Holdings Corporation | METHOD OF MEASURING COMPONENTS OF A BIOLOGICAL SAMPLE |
| WO2019031421A1 (ja) * | 2017-08-10 | 2019-02-14 | Phcホールディングス株式会社 | 血液中の血液成分の量を測定する方法 |
| WO2019181436A1 (ja) * | 2018-03-19 | 2019-09-26 | Phcホールディングス株式会社 | 血液中の血液成分の量を測定する方法 |
| US11950902B2 (en) * | 2019-08-02 | 2024-04-09 | Bionime Corporation | Micro biosensor and method for reducing measurement interference using the same |
Citations (12)
| Publication number | Priority date | Publication date | Assignee | Title |
|---|---|---|---|---|
| WO1994029731A1 (en) | 1993-06-03 | 1994-12-22 | Boehringer Mannheim Corporation | Biosensor for hematocrit determination |
| WO2000073785A2 (en) | 1999-06-02 | 2000-12-07 | Nova Biomedical Corporation | Low interference disposable sensor and method of making |
| US20050103624A1 (en) | 1999-10-04 | 2005-05-19 | Bhullar Raghbir S. | Biosensor and method of making |
| US20060175205A1 (en) | 2005-02-04 | 2006-08-10 | I-Sens, Inc. | Electrochemical biosensor |
| EP1691192A1 (en) | 2003-12-04 | 2006-08-16 | Matsushita Electric Industrial Co., Ltd. | Blood component measuring method, sensor used therefor, and measuring instrument |
| CN1938590A (zh) | 2004-04-19 | 2007-03-28 | 松下电器产业株式会社 | 血液成分的测定方法、该方法中使用的生物传感器和测定装置 |
| JP2009188992A (ja) | 2008-01-10 | 2009-08-20 | Panasonic Corp | 生体試料測定装置 |
| US20100000880A1 (en) * | 2006-07-26 | 2010-01-07 | Yoshihiro Itoh | Biosensor measurement system and measurement method |
| WO2010087191A1 (ja) | 2009-01-30 | 2010-08-05 | パナソニック株式会社 | 生体試料の温度測定方法、生体試料の濃度測定方法、センサチップおよびバイオセンサシステム |
| US20110139634A1 (en) * | 2009-12-14 | 2011-06-16 | Taidoc Technology Corporation | System and method for measuring analyte concentration with interferant correction |
| WO2012042211A2 (en) | 2010-09-28 | 2012-04-05 | Lifescan Scotland Limited | Analyte measurement method and system with error trapping |
| WO2012164271A1 (en) | 2011-05-27 | 2012-12-06 | Lifescan Scotland Limited | Peak offset correction for analyte test strip |
Family Cites Families (1)
| Publication number | Priority date | Publication date | Assignee | Title |
|---|---|---|---|---|
| JP2010087191A (ja) * | 2008-09-30 | 2010-04-15 | Canon Inc | 露光装置およびデバイス製造方法 |
-
2014
- 2014-11-11 JP JP2015550548A patent/JP6635789B2/ja active Active
- 2014-11-11 CN CN201480064988.6A patent/CN105793700B/zh active Active
- 2014-11-11 US US15/034,725 patent/US10066253B2/en active Active
- 2014-11-11 WO PCT/JP2014/005666 patent/WO2015079635A1/ja active Application Filing
- 2014-11-11 EP EP14865528.5A patent/EP3076167B1/en active Active
Patent Citations (20)
| Publication number | Priority date | Publication date | Assignee | Title |
|---|---|---|---|---|
| WO1994029731A1 (en) | 1993-06-03 | 1994-12-22 | Boehringer Mannheim Corporation | Biosensor for hematocrit determination |
| JP3369183B2 (ja) | 1993-06-03 | 2003-01-20 | ロシュ・ダイアグノスティックス・コーポレイション | ヘマトクリット決定のためのバイオセンサ |
| WO2000073785A2 (en) | 1999-06-02 | 2000-12-07 | Nova Biomedical Corporation | Low interference disposable sensor and method of making |
| JP2003501627A (ja) | 1999-06-02 | 2003-01-14 | ノヴァ バイオメディカル コーポレイション | 使い捨てセンサ及び製造方法 |
| US20050103624A1 (en) | 1999-10-04 | 2005-05-19 | Bhullar Raghbir S. | Biosensor and method of making |
| EP1691192A1 (en) | 2003-12-04 | 2006-08-16 | Matsushita Electric Industrial Co., Ltd. | Blood component measuring method, sensor used therefor, and measuring instrument |
| CN1938590A (zh) | 2004-04-19 | 2007-03-28 | 松下电器产业株式会社 | 血液成分的测定方法、该方法中使用的生物传感器和测定装置 |
| US20070138026A1 (en) | 2004-04-19 | 2007-06-21 | Matsushita Electric Industrial Co., Ltd. | Method for measuring blood components and biosensor and measuring instrument for use therein |
| US7955492B2 (en) * | 2004-04-19 | 2011-06-07 | Panasonic Corporation | Method for measuring blood components and biosensor and measuring instrument for use therein |
| US20060175205A1 (en) | 2005-02-04 | 2006-08-10 | I-Sens, Inc. | Electrochemical biosensor |
| US20100000880A1 (en) * | 2006-07-26 | 2010-01-07 | Yoshihiro Itoh | Biosensor measurement system and measurement method |
| JP5239860B2 (ja) | 2006-07-26 | 2013-07-17 | パナソニック株式会社 | バイオセンサ測定システム、および測定方法 |
| US20100190441A1 (en) | 2008-01-10 | 2010-07-29 | Eiji Okuda | Biological sample measuring apparatus |
| JP2009188992A (ja) | 2008-01-10 | 2009-08-20 | Panasonic Corp | 生体試料測定装置 |
| WO2010087191A1 (ja) | 2009-01-30 | 2010-08-05 | パナソニック株式会社 | 生体試料の温度測定方法、生体試料の濃度測定方法、センサチップおよびバイオセンサシステム |
| US20110272294A1 (en) | 2009-01-30 | 2011-11-10 | Masaki Fujiwara | Method for measuring temperature of biological sample, method for measuring concentration of biological sample, sensor chip and biosensor system |
| US20110139634A1 (en) * | 2009-12-14 | 2011-06-16 | Taidoc Technology Corporation | System and method for measuring analyte concentration with interferant correction |
| WO2012042211A2 (en) | 2010-09-28 | 2012-04-05 | Lifescan Scotland Limited | Analyte measurement method and system with error trapping |
| US9618517B2 (en) * | 2010-09-28 | 2017-04-11 | Lifescan Scotland Limited | Analyte measurement method and system with error trapping |
| WO2012164271A1 (en) | 2011-05-27 | 2012-12-06 | Lifescan Scotland Limited | Peak offset correction for analyte test strip |
Non-Patent Citations (4)
| Title |
|---|
| Extended European Search Report issued in corresponding European Application No. 14865528.5, dated Nov. 16, 2016, 5 pages. |
| International Search Report for PCT/JP2014/005666, dated Feb. 10, 2015, 4 pages. |
| JPO computer-generated English language translation of JP 5239860 B1. Downloaded Dec. 20, 2017. (Year: 2017). * |
| Office Action issued in corresponding Chinese Patent Application No. 201480064988.6, dated Nov. 3, 2017, 19 pages with translation. |
Cited By (1)
| Publication number | Priority date | Publication date | Assignee | Title |
|---|---|---|---|---|
| US11255834B2 (en) * | 2016-03-22 | 2022-02-22 | Conductive Technologies, Inc. | Physical characteristic determination of a biological sample |
Also Published As
| Publication number | Publication date |
|---|---|
| EP3076167A1 (en) | 2016-10-05 |
| CN105793700A (zh) | 2016-07-20 |
| EP3076167A4 (en) | 2016-12-14 |
| EP3076167B1 (en) | 2018-03-14 |
| JPWO2015079635A1 (ja) | 2017-03-16 |
| US20160273017A1 (en) | 2016-09-22 |
| WO2015079635A1 (ja) | 2015-06-04 |
| JP6635789B2 (ja) | 2020-01-29 |
| CN105793700B (zh) | 2018-09-28 |
Similar Documents
| Publication | Publication Date | Title |
|---|---|---|
| US9719956B2 (en) | Method of measuring blood component, sensor used in the method, and measuring device | |
| US20180120249A1 (en) | Method for measuring blood components and biosensor and measuring instrument for use therein | |
| US10066253B2 (en) | Method of measuring blood component amount | |
| US11635405B2 (en) | Method for measuring components of biological sample | |
| US11467118B2 (en) | Method for measuring amount of blood component in blood | |
| US11959872B2 (en) | Method for measuring amount of blood component in blood |
Legal Events
| Date | Code | Title | Description |
|---|---|---|---|
| AS | Assignment |
Owner name: PANASONIC HEALTHCARE HOLDINGS CO., LTD., JAPAN Free format text: ASSIGNMENT OF ASSIGNORS INTEREST;ASSIGNORS:FUJIWARA, MASAKI;YAMAMOTO, TOMOHIRO;REEL/FRAME:038479/0412 Effective date: 20160419 |
|
| AS | Assignment |
Owner name: PHC HOLDINGS CORPORATION, JAPAN Free format text: CHANGE OF NAME;ASSIGNOR:PANASONIC HEALTHCARE HOLDINGS CO., LTD.;REEL/FRAME:046724/0122 Effective date: 20180401 |
|
| STCF | Information on status: patent grant |
Free format text: PATENTED CASE |
|
| MAFP | Maintenance fee payment |
Free format text: PAYMENT OF MAINTENANCE FEE, 4TH YEAR, LARGE ENTITY (ORIGINAL EVENT CODE: M1551); ENTITY STATUS OF PATENT OWNER: LARGE ENTITY Year of fee payment: 4 |