EP4451081A2 - Systeme und verfahren zur auf künstlicher intelligenz basierten wartung einer klimaanlage - Google Patents
Systeme und verfahren zur auf künstlicher intelligenz basierten wartung einer klimaanlage Download PDFInfo
- Publication number
- EP4451081A2 EP4451081A2 EP24181450.8A EP24181450A EP4451081A2 EP 4451081 A2 EP4451081 A2 EP 4451081A2 EP 24181450 A EP24181450 A EP 24181450A EP 4451081 A2 EP4451081 A2 EP 4451081A2
- Authority
- EP
- European Patent Office
- Prior art keywords
- data
- air conditioning
- conditioning system
- status
- image
- Prior art date
- Legal status (The legal status is an assumption and is not a legal conclusion. Google has not performed a legal analysis and makes no representation as to the accuracy of the status listed.)
- Pending
Links
Images


Classifications
-
- G—PHYSICS
- G05—CONTROLLING; REGULATING
- G05B—CONTROL OR REGULATING SYSTEMS IN GENERAL; FUNCTIONAL ELEMENTS OF SUCH SYSTEMS; MONITORING OR TESTING ARRANGEMENTS FOR SUCH SYSTEMS OR ELEMENTS
- G05B23/00—Testing or monitoring of control systems or parts thereof
- G05B23/02—Electric testing or monitoring
- G05B23/0205—Electric testing or monitoring by means of a monitoring system capable of detecting and responding to faults
- G05B23/0259—Electric testing or monitoring by means of a monitoring system capable of detecting and responding to faults characterized by the response to fault detection
- G05B23/0283—Predictive maintenance, e.g. involving the monitoring of a system and, based on the monitoring results, taking decisions on the maintenance schedule of the monitored system; Estimating remaining useful life [RUL]
-
- F—MECHANICAL ENGINEERING; LIGHTING; HEATING; WEAPONS; BLASTING
- F24—HEATING; RANGES; VENTILATING
- F24F—AIR-CONDITIONING; AIR-HUMIDIFICATION; VENTILATION; USE OF AIR CURRENTS FOR SCREENING
- F24F11/00—Control or safety arrangements
- F24F11/30—Control or safety arrangements for purposes related to the operation of the system, e.g. for safety or monitoring
- F24F11/32—Responding to malfunctions or emergencies
- F24F11/39—Monitoring filter performance
-
- F—MECHANICAL ENGINEERING; LIGHTING; HEATING; WEAPONS; BLASTING
- F24—HEATING; RANGES; VENTILATING
- F24F—AIR-CONDITIONING; AIR-HUMIDIFICATION; VENTILATION; USE OF AIR CURRENTS FOR SCREENING
- F24F11/00—Control or safety arrangements
- F24F11/50—Control or safety arrangements characterised by user interfaces or communication
- F24F11/52—Indication arrangements, e.g. displays
-
- F—MECHANICAL ENGINEERING; LIGHTING; HEATING; WEAPONS; BLASTING
- F24—HEATING; RANGES; VENTILATING
- F24F—AIR-CONDITIONING; AIR-HUMIDIFICATION; VENTILATION; USE OF AIR CURRENTS FOR SCREENING
- F24F11/00—Control or safety arrangements
- F24F11/62—Control or safety arrangements characterised by the type of control or by internal processing, e.g. using fuzzy logic, adaptive control or estimation of values
-
- G—PHYSICS
- G05—CONTROLLING; REGULATING
- G05B—CONTROL OR REGULATING SYSTEMS IN GENERAL; FUNCTIONAL ELEMENTS OF SUCH SYSTEMS; MONITORING OR TESTING ARRANGEMENTS FOR SUCH SYSTEMS OR ELEMENTS
- G05B23/00—Testing or monitoring of control systems or parts thereof
- G05B23/02—Electric testing or monitoring
- G05B23/0205—Electric testing or monitoring by means of a monitoring system capable of detecting and responding to faults
- G05B23/0218—Electric testing or monitoring by means of a monitoring system capable of detecting and responding to faults characterised by the fault detection method dealing with either existing or incipient faults
- G05B23/0224—Process history based detection method, e.g. whereby history implies the availability of large amounts of data
- G05B23/024—Quantitative history assessment, e.g. mathematical relationships between available data; Functions therefor; Principal component analysis [PCA]; Partial least square [PLS]; Statistical classifiers, e.g. Bayesian networks, linear regression or correlation analysis; Neural networks
-
- G—PHYSICS
- G06—COMPUTING OR CALCULATING; COUNTING
- G06N—COMPUTING ARRANGEMENTS BASED ON SPECIFIC COMPUTATIONAL MODELS
- G06N3/00—Computing arrangements based on biological models
- G06N3/02—Neural networks
- G06N3/04—Architecture, e.g. interconnection topology
- G06N3/0464—Convolutional networks [CNN, ConvNet]
-
- G—PHYSICS
- G06—COMPUTING OR CALCULATING; COUNTING
- G06N—COMPUTING ARRANGEMENTS BASED ON SPECIFIC COMPUTATIONAL MODELS
- G06N3/00—Computing arrangements based on biological models
- G06N3/02—Neural networks
- G06N3/08—Learning methods
-
- G—PHYSICS
- G06—COMPUTING OR CALCULATING; COUNTING
- G06N—COMPUTING ARRANGEMENTS BASED ON SPECIFIC COMPUTATIONAL MODELS
- G06N3/00—Computing arrangements based on biological models
- G06N3/02—Neural networks
- G06N3/08—Learning methods
- G06N3/0895—Weakly supervised learning, e.g. semi-supervised or self-supervised learning
-
- G—PHYSICS
- G06—COMPUTING OR CALCULATING; COUNTING
- G06N—COMPUTING ARRANGEMENTS BASED ON SPECIFIC COMPUTATIONAL MODELS
- G06N3/00—Computing arrangements based on biological models
- G06N3/02—Neural networks
- G06N3/08—Learning methods
- G06N3/09—Supervised learning
-
- H—ELECTRICITY
- H04—ELECTRIC COMMUNICATION TECHNIQUE
- H04L—TRANSMISSION OF DIGITAL INFORMATION, e.g. TELEGRAPHIC COMMUNICATION
- H04L12/00—Data switching networks
- H04L12/28—Data switching networks characterised by path configuration, e.g. LAN [Local Area Networks] or WAN [Wide Area Networks]
- H04L12/2803—Home automation networks
- H04L12/2823—Reporting information sensed by appliance or service execution status of appliance services in a home automation network
- H04L12/2825—Reporting to a device located outside the home and the home network
-
- F—MECHANICAL ENGINEERING; LIGHTING; HEATING; WEAPONS; BLASTING
- F24—HEATING; RANGES; VENTILATING
- F24F—AIR-CONDITIONING; AIR-HUMIDIFICATION; VENTILATION; USE OF AIR CURRENTS FOR SCREENING
- F24F2110/00—Control inputs relating to air properties
- F24F2110/50—Air quality properties
- F24F2110/64—Airborne particle content
-
- F—MECHANICAL ENGINEERING; LIGHTING; HEATING; WEAPONS; BLASTING
- F24—HEATING; RANGES; VENTILATING
- F24F—AIR-CONDITIONING; AIR-HUMIDIFICATION; VENTILATION; USE OF AIR CURRENTS FOR SCREENING
- F24F2120/00—Control inputs relating to users or occupants
-
- G—PHYSICS
- G05—CONTROLLING; REGULATING
- G05B—CONTROL OR REGULATING SYSTEMS IN GENERAL; FUNCTIONAL ELEMENTS OF SUCH SYSTEMS; MONITORING OR TESTING ARRANGEMENTS FOR SUCH SYSTEMS OR ELEMENTS
- G05B2219/00—Program-control systems
- G05B2219/20—Pc systems
- G05B2219/24—Pc safety
- G05B2219/24019—Computer assisted maintenance
-
- G—PHYSICS
- G05—CONTROLLING; REGULATING
- G05B—CONTROL OR REGULATING SYSTEMS IN GENERAL; FUNCTIONAL ELEMENTS OF SUCH SYSTEMS; MONITORING OR TESTING ARRANGEMENTS FOR SUCH SYSTEMS OR ELEMENTS
- G05B2219/00—Program-control systems
- G05B2219/20—Pc systems
- G05B2219/25—Pc structure of the system
- G05B2219/25255—Neural network
-
- G—PHYSICS
- G05—CONTROLLING; REGULATING
- G05B—CONTROL OR REGULATING SYSTEMS IN GENERAL; FUNCTIONAL ELEMENTS OF SUCH SYSTEMS; MONITORING OR TESTING ARRANGEMENTS FOR SUCH SYSTEMS OR ELEMENTS
- G05B2219/00—Program-control systems
- G05B2219/20—Pc systems
- G05B2219/26—Pc applications
- G05B2219/2614—HVAC, heating, ventillation, climate control
-
- G—PHYSICS
- G05—CONTROLLING; REGULATING
- G05B—CONTROL OR REGULATING SYSTEMS IN GENERAL; FUNCTIONAL ELEMENTS OF SUCH SYSTEMS; MONITORING OR TESTING ARRANGEMENTS FOR SUCH SYSTEMS OR ELEMENTS
- G05B2219/00—Program-control systems
- G05B2219/20—Pc systems
- G05B2219/26—Pc applications
- G05B2219/2638—Airconditioning
-
- G—PHYSICS
- G06—COMPUTING OR CALCULATING; COUNTING
- G06N—COMPUTING ARRANGEMENTS BASED ON SPECIFIC COMPUTATIONAL MODELS
- G06N3/00—Computing arrangements based on biological models
- G06N3/02—Neural networks
- G06N3/08—Learning methods
- G06N3/088—Non-supervised learning, e.g. competitive learning
-
- G—PHYSICS
- G06—COMPUTING OR CALCULATING; COUNTING
- G06T—IMAGE DATA PROCESSING OR GENERATION, IN GENERAL
- G06T17/00—Three dimensional [3D] modelling, e.g. data description of 3D objects
-
- H02J13/1323—
-
- Y—GENERAL TAGGING OF NEW TECHNOLOGICAL DEVELOPMENTS; GENERAL TAGGING OF CROSS-SECTIONAL TECHNOLOGIES SPANNING OVER SEVERAL SECTIONS OF THE IPC; TECHNICAL SUBJECTS COVERED BY FORMER USPC CROSS-REFERENCE ART COLLECTIONS [XRACs] AND DIGESTS
- Y02—TECHNOLOGIES OR APPLICATIONS FOR MITIGATION OR ADAPTATION AGAINST CLIMATE CHANGE
- Y02B—CLIMATE CHANGE MITIGATION TECHNOLOGIES RELATED TO BUILDINGS, e.g. HOUSING, HOUSE APPLIANCES OR RELATED END-USER APPLICATIONS
- Y02B90/00—Enabling technologies or technologies with a potential or indirect contribution to GHG emissions mitigation
- Y02B90/20—Smart grids as enabling technology in buildings sector
-
- Y—GENERAL TAGGING OF NEW TECHNOLOGICAL DEVELOPMENTS; GENERAL TAGGING OF CROSS-SECTIONAL TECHNOLOGIES SPANNING OVER SEVERAL SECTIONS OF THE IPC; TECHNICAL SUBJECTS COVERED BY FORMER USPC CROSS-REFERENCE ART COLLECTIONS [XRACs] AND DIGESTS
- Y04—INFORMATION OR COMMUNICATION TECHNOLOGIES HAVING AN IMPACT ON OTHER TECHNOLOGY AREAS
- Y04S—SYSTEMS INTEGRATING TECHNOLOGIES RELATED TO POWER NETWORK OPERATION, COMMUNICATION OR INFORMATION TECHNOLOGIES FOR IMPROVING THE ELECTRICAL POWER GENERATION, TRANSMISSION, DISTRIBUTION, MANAGEMENT OR USAGE, i.e. SMART GRIDS
- Y04S40/00—Systems for electrical power generation, transmission, distribution or end-user application management characterised by the use of communication or information technologies, or communication or information technology specific aspects supporting them
- Y04S40/12—Systems for electrical power generation, transmission, distribution or end-user application management characterised by the use of communication or information technologies, or communication or information technology specific aspects supporting them characterised by data transport means between the monitoring, controlling or managing units and monitored, controlled or operated electrical equipment
- Y04S40/124—Systems for electrical power generation, transmission, distribution or end-user application management characterised by the use of communication or information technologies, or communication or information technology specific aspects supporting them characterised by data transport means between the monitoring, controlling or managing units and monitored, controlled or operated electrical equipment using wired telecommunication networks or data transmission busses
Definitions
- the technology described herein relates to automated maintenance of an air conditioning system and more particularly to use of artificial intelligence to provide predictive maintenance of an air conditioning system.
- Air conditioning systems are typically inspected periodically (e.g., yearly) to determine their operating status. During those periodic visits, the status of components and general impressions regarding the presence of operating issues, such as deterioration of parts, excessive dust buildup, may be noted. Some remediation (e.g., replacement of parts, cleaning of ducts) may be performed at the time of inspection. But otherwise, the air conditioning system (e.g. , a heating system, an air conditioning system, a heating, ventilation, and air conditioning (HVAC) system) typically operates with its current status unknown between inspections. When an issue does occur, such as an anomaly that results in an air conditioning system outage, it may take time for maintenance to be performed.
- HVAC heating, ventilation, and air conditioning
- Air conditioning system outages can be costly both in terms of lost enjoyment of the air conditioned space during the outage as well as damage to products and occupants that might be spoiled, injured, or otherwise harmed during the air conditioning outage.
- Systems and methods as described herein can provide continuous, real-time monitoring of an air conditioning system as well as Al-powered predictive analysis of future air conditioning system status to provide for proactive maintenance to limit or eliminate the disruptions caused by air conditioning system outages.
- a system can include one or more sensors positioned inside of the air conditioning system configured to transmit current sensor data to a remote location.
- a data repository contains historic sensor data and corresponding air conditioning system status data.
- a neural network is trained using the historic sensor data and the corresponding air conditioning system status data to predict a future air conditioning system status based on the transmitted current sensor data.
- a server computer system is configured to predict the future air conditioning system status based on the current sensor data using the neural network, and a graphical user interface is configured to display the predicted future air conditioning system status to a remote client.
- the current sensor data is stored in the data repository and the neural network is further trained based on the current sensor data.
- a method for maintaining an air conditioning system includes capturing image data inside of the air conditioning system and transmitting the image data to a remote location outside of the air conditioning system.
- the image data is processed at the remote location to determine an image delta value, wherein the image delta value represents a change in the image data over a period of time.
- the image delta value is compared to a threshold value, wherein the threshold value is set based on an evaluation of historic image delta values and corresponding air conditioning system status values or based on a standards setting body.
- An alert signal is transmitted over a computer network when the image delta value exceeds the threshold value.
- a computer-implemented system for maintaining an air conditioning system includes one or more data processors and a non-transitory computer-readable medium encoded with instructions for commanding one or more data processors to execute a method that includes capturing image data inside of the air conditioning system and transmitting the image data to a remote location outside of the air conditioning system.
- the image data is processed at the remote location to determine an image delta value, wherein the image delta value represents a change in the image data over a period of time.
- the image delta value is compared to a threshold value, wherein the threshold value is set based on an evaluation of historic image delta values and corresponding air conditioning system status values.
- An alert signal is transmitted over a computer network when the image delta value exceeds the threshold value.
- a computer-readable medium is encoded with instructions for commanding one or more data processors to execute a method that includes capturing image data inside of the air conditioning system and transmitting the image data to a remote location outside of the air conditioning system.
- the image data is processed at the remote location to determine an image delta value, wherein the image delta value represents a change in the image data over a period of time.
- the image delta value is compared to a threshold value, wherein the threshold value is set based on an evaluation of historic image delta values and corresponding air conditioning system status values.
- An alert signal is transmitted over a computer network when the image delta value exceeds the threshold value.
- Systems and methods as described herein provide for continuous monitoring and collection of data associated with an appliance, such as an air conditioning system. That data may be used to provide user interfaces (e.g., via a computer system connected to a computer network) that identify the current status of the air conditioning system.
- Artificial intelligence may, in certain embodiments, be configured to analyze the captured system data to provide predictions on future behavior of the air conditioning system. For example, the artificial intelligence, trained based on historic air conditioning system metrics and occurrences, may be able to predict when certain components of the air conditioning system (e.g., a filter, a coil) are predicted to fail or experience a performance degradation.
- the artificial intelligence may further be configured to predict the occurrence of an adverse event, such as a microbiological contamination (e.g., mold) event occurring based on current system parameters or trends.
- an adverse event such as a microbiological contamination (e.g., mold) event occurring based on current system parameters or trends.
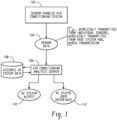
- FIG. 1 is a block diagram depicting a processor-implemented system for providing artificial-intelligence-based maintenance of an air conditioning system.
- An air conditioning system 102 containing one or more sensors (e.g., a camera, a humidity sensor, a temperature sensor, an enthalpy sensor, a magnetic sensor, a substance concentration sensor) captures sensor data 104 and transmits that sensor data 104 to an air conditioning analysis server 106.
- each of the sensors in the air conditioning system 102 includes a wireless transmitter by which it can transmit sensor data 104 directly to the analysis server 106 or to an intermediate device (e.g., a data hub) which can forward sensor data 104 to the analysis server 106 in a wired or wireless fashion.
- the air conditioning analysis server 106 stores the sensor data 104 in a historic AC system data repository 108.
- the server provides analysis of the current air conditioning system 102 based on the sensor data 104, where in certain embodiments, that analysis is provided with reference to historic AC system data 108 for the particular air conditioning system 102 being evaluated, and in certain instances data associated with other air conditioning systems.
- artificial intelligence such as in the form of a neural network, is trained based on historic AC system data 108 (e.g., image data, temperature data, humidity data, dust levels) and corresponding observed (or determined) system statuses (e.g., level of dust corresponding to image data, microbiological contamination determined corresponding to temperature and humidity data, time until filter needs changed based on differential pressure data at that filter).
- the analysis server 106 can provide analysis on the current state of the air conditioning system 102 and predicted future status (e.g., time until cleaning needed, time until microbiological contamination likely under current conditions, time until filters need replaced) in the form of AC system alerts 110 and reporting on AC status user interfaces 112 made available locally at the analysis server 106 or remotely ( e.g., over a computer network or the Internet via a web server, via text message, pager message, robo-telephone calls, email, facsimile, printed message, or the like).
- predicted future status e.g., time until cleaning needed, time until microbiological contamination likely under current conditions, time until filters need replaced
- FIG. 2 is a block diagram depicting example components of an AC analysis server system.
- a sensor enabled AC system 102 includes sensors that capture data such as image data 104 ( e.g., images internal or external to the AC system) and sensor data 106 and transmit that data 104, 106 to an AC analysis server 108.
- the AC analysis server 108 receives the data and can provide one or more of a number of different types of analyses of the current status of the AC system 102 and predicted future status of that system 102. Results of the one or more analyses are output from the AC analysis server 108 via an alert and interface module 110 that can take the form of user interfaces ( e.g., accessed via a web browser and displayed on a computing device) or other types of electronic messages.
- the data received at the AC analysis server may be stored in a historic AC system data repository 114 for future analysis.
- the historic system data stored in the repository 114 for the present AC system and/or other AC systems may also be used for training and refining the analysis logic of the AC analysis server 108.
- each of the analyses that the AC analysis server 108 is configured to perform may utilize artificial intelligence (e.g., neural networks such as feed-forward neural networks, recurrent neural networks, convolutional neural networks, trained using techniques such as supervised learning, unsupervised learning, reinforcement learning).
- artificial intelligence may be trained using historic AC system data from the repository 114 that spans many air conditioning systems present in a variety of different environments over long periods of time ( e.g., years).
- the artificial intelligence can make current AC system 102 status determinations as well as predictions regarding the future status of the AC system 102.
- the artificial intelligence may learn what types of sensor inputs are helpful for identifying AC system conditions (and predicted future system conditions) such that those particular sensor inputs are used in providing live analysis of the current AC system 102.
- An artificial intelligence training module 116 accesses historic AC system data 114 and trains one or more instances of artificial intelligence (e.g., neural networks) to provide current and predictive analysis as described further herein.
- An AC analysis server may be configured to perform analysis regarding a number of different aspects of an AC system. For example, a contaminant level analysis may consider data such as image data 104 and sensor data 106 to determine a cleanliness level in the air conditioning system, such as an air handling unit (AHU) cleanliness determination 120 or a duct cleanliness determination 122. Those determinations may include an evaluation of a current contamination status (e.g., dust level in weight(mass) per area) and/or a prediction of a future contamination status, such as a prediction of when a relevant part of the AC system 102 will be sufficiently contaminated to warrant cleaning. Such predictive statuses may be used to preemptively alert or schedule maintenance so that cleaning can be performed before a more significant service outage (e.g., an AC system 102 breakdown caused by contamination buildup) occurs.
- AHU air handling unit
- AC system 102 shutdowns performed on a long term basis (e.g., once per year) using a vacuum test or visual inspection.
- Such manual operations provide very sparse data and no knowledge about contamination status between inspections.
- AC system events e.g., an introduction of dust at an air system intake based on changing conditions ( e.g., start of a construction project) a fracture in a duct wall that allows significant dust introduction into the AC system 102 causing environment risks (e.g., health risks, damage to equipment in the air controlled region) and risks to the healthy functioning of the AC system) may go undetected for significant periods of time.
- the automated data capture e.g., multiple times per day, hour, minute
- analysis e.g., multiple times per year, month, day, hour, minute
- Data captured automatically may be supplemented with data captured ( e.g., vacuum tests) during maintenance, routine or otherwise, to provide an even more robust data set for analysis ( e.g. , for artificial intelligence training.
- AC systems are also susceptible to microbiological contamination.
- Microbes such as mold, may grow and flourish in an AC system under certain conditions (e.g., high humidity, warm temperature).
- the AC analysis server 108 may be configured at 124 to analyze data from the AC system to indicate at 126 whether there is currently a likely presence of microbiological contamination in the AC system and/or if and when microbiological contamination may occur in the future based on observed conditions in the AC system.
- an AC analysis server 108 may analyze performance and metrics associated with filters in the AC system 102.
- a filter analysis 128 can indicate a current filter status and a prediction on when action should be performed relative to a particular one or more filters at 130 in the AC system 128.
- current and predictive analysis can be performed relative to a heating or cooling coil in the AC system 102.
- a coil analysis 132 considers sensor data (e.g., differential pressure data, enthalpy sensor data) to identify current/predicted status 134 of coils in the system so as to enable maintenance calls including proactive maintenance calls to preempt system malfunctions.
- Air quality is important throughout an AC system, not only in the controlled environment (e.g., at the output of the AC system).
- the quality of air input into the system e.g., from an outside environment
- the AC system 102 e.g., in a duct
- An air quality analysis 136 of air at an AC system intake or within the AC system may provide current or predictive updates on air quality at 138.
- Certain AC systems 102 utilize sanitation equipment that may utilize techniques such as ultraviolet light exposure (e.g., in a duct) or introduction of a chemical substance (e.g., a disinfectant agent, a fragrance) into the air.
- An AC analysis server 108 may receive data that is that is directly indicative (e.g ., from the sanitation equipment) or indirectly indicative (e.g., image data from which light from ultraviolet sanitation equipment can be detected) of functioning of the sanitation equipment.
- Current status and predictions of future status of the sanitation equipment can be made at 140 and output at 142 to the alert and interface module 110.
- An AC analysis server 108 can also be configured to track maintenance of the AC system 102.
- sensor data 106 can include AC system access sensors (e.g., magnetic sensors associated with AC access hatches) that can detect when internals of the AC system 102 are accessed. Based on that access sensor data alone, or in combination with other sensor data such as a decrease in Delta P noted by a differential pressure sensor after a detected access, the AC analysis server 108 can determine that maintenance was performed at 144 and track that maintenance status data 146. For example, the AC analysis server 108 can correlate detected maintenance activity with a maintenance schedule (e.g. routine maintenance, maintenance requested based on an AC analysis server 108 alert) and track the performance of AC system 102 maintenance.
- a maintenance schedule e.g. routine maintenance, maintenance requested based on an AC analysis server 108 alert
- the maintenance analysis 144 can also be configured to detect anomalous access to the AC system (e.g., access that does not correspond with expected access of a maintenance schedule, access for a period of time not likely to be associated with legitimate maintenance, access that is not correlated with a system performance benefit (e.g. improved filter performance)) and issue corresponding alerts that indicate possible malicious intrusion into the AC system 102 ( e.g., to introduce a harmful foreign substance such as a biological agent into the controlled volume).
- An AC analysis server may provide current sensor data values, determined AC system status, and AC system predictions via one or more user interfaces provided to a user device (e.g., a computer system, a smart phone system, an email report, a facsimile).
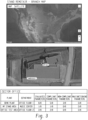
- FIG. 3 depicts a user interface for navigating to data associated with a particular AC system of interface.
- a top display provides a map with selectable indicators for selecting a particular site of interest.
- a bottom display provides an image of a particular location ( e.g., selected from the top map), which enables selection of an AC system servicing all or a portion of that location, such as via a mouse click on a location on the image or a name of a section of the location.
- Text included with the bottom location image may indicate a name of a portion of a location and summary statistics such as a number of status parameters evaluated, a number of parameters indicating operation within specification, a number of parameters of concern operating outside of specification, and a number of parameters for which appropriate data is not being received.
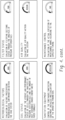
- FIG. 4 depicts an example summary data user interface associated with an air plant.
- the user interface identifies each of a plurality of statuses being tracked along with a current qualitative assessment of the AC system relative to that status.
- the user interface includes two cleanliness statuses, one for the air handling unit (currently at Good status) and the other for a duct (currently at Excellent status) in the AC system.
- the cleanliness statuses provide a most recent image taken along with an estimated dust level (i.e., 0.06 g/m 2 for AHU, 0.073 g/m 2 for duct) to provide further summary data on cleanliness.
- AC system cleanliness is estimated based on image data received from the AC system.
- FIG. 5 depicts two flow diagrams for determining AC system cleanliness.
- images are captured ( e.g., using a digital camera) periodically at 502 and are sent to a server for storage and analysis at 504.
- the images are converted to black and white at 506 and are cropped at 508.
- a pixel analysis is performed at 510 to indicate a number associated with the pixel values of the image.
- a mathematical operation is performed on the pixel value number to determine a dust weight associated with that image.
- the dust weight is provided to a user for viewing on a user interface upon access of the user interface by the user.
- An alert may be proactively sent to the user (e.g., via text message, email, pager message, on the user interface) should the dust weight vale exceed a threshold that could be automatically set based on historical values or artificial intelligence analysis, or via manual operation by the user.
- a pixel value for an image may be determined based on an average pixel value associated with a region of interest of an image, such as a cropped portion of the image associated with a reference object (e.g., a sticker or decal) within the region of interest of the AC system (see the AHU cleanliness and Ducts cleanliness images of FIG. 4 ).
- the average pixel value for the image is calculated and, in one example, is converted to a contamination weight based on a formula.
- the calculated weight contamination weight (e.g., in g/m 2 ) may be compared to a threshold value to determine whether an alert should be issued indicating that the AC system should be cleaned.
- a rate of change of contamination weight (e.g., over the course of two or more images) may be used to estimate when the AC system will be ready to be cleaned, such as via linear or other interpolation techniques.
- a neural network may also be used in combination with one or more contamination weight values to determine current and predictive cleanliness statuses.
- image data is again captured at 552 and sent to an AC analysis server at 554.
- artificial intelligence is used to classify the current state of the AC system based on the image data.
- a neural network may be trained using large numbers of images captured from AC systems along with their corresponding qualitative cleanliness statuses (e.g., Very Clean, Clean, Acceptable, Dirty, Very Dirty).
- the current image received at 554 is provided to the trained neural network to classify the current AC system state.
- the current image may be saved, along with its associated cleanliness state, to further train the neural network at 558.
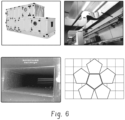
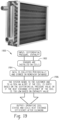
- FIG. 6 is a diagram depicting example locations for image capture devices (e.g., an AHU and a duct system), an example image from a duct system, and an example reference image that may be positioned in the imaged volume as a reference object to normalize captured images across AC systems, such as for instances with different lighting levels in the imaged area ( e.g., a duct, an AHU).
- the reference object may include one or more identifiers such as numbers, bar codes, QR codes, so that a captured image can be associated with its corresponding location when analyzing and storing image data.
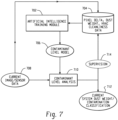
- FIG. 7 is a flow diagram depicting an artificial intelligence training module training a contaminant level model.
- An artificial intelligence training module 702 receives historic AC data 704 from the current AC system and/or other AC systems that has been captured over time. Based on that data and a ssociated estimated or predicted metrics (e.g., estimated contamination weights, qualitative cleanliness assessments, a time until cleaning should be performed), a contaminant level model 706 (e.g., a neural network) is trained to provide those estimated or predicted metrics based on current image, sensor, and or other data 708 via a contaminant level analysis module 710.
- the contaminant value 712 determined using the contaminant level model 706 is output from the analysis for display on a user interface or issuance of an alert.
- the determined contaminant level 712 along with the image/sensor data 708 that resulted in that determined level 712 may be stored at 704 and feedback to the training module 702 in an unsupervised or supervised fashion 714 to further train the contaminant level model 706.
- FIG. 8 is a diagram depicting example cleanliness status and predictive information displayed on a user interface. For each of three cameras in the AC system, a current dust contamination level is calculated and displayed based on pixel values of one or more images from those locations. Based on the current status, a current required action (e.g., continue surveillance, perform maintenance, schedule maintenance) is presented. A predictive analysis (e.g., using an artificial intelligence model) is also provided that predicts when the system will enter into a Bad status level of cleanliness. This prediction may be used to proactively schedule maintenance so that the AC system is cleaned before the expiration of that predicted time period.
- FIG. 9 is a diagram depicting example captured images, estimated dust contamination values based on those captured images, and graphs depicting contamination levels over a period of time. Estimates over time may be utilized to identify trends and to inform predictive analysis.
- An AC analysis system may also make determinations relative to current microbiological contamination in the AC system and predictions on likelihoods associated with microbiological contamination based on current system parameters (e.g., temperature, humidity, measured or determined dust contamination levels).
- FIG. 10 is a flow diagram depicting an example process for assessing system risk of contamination.
- Sensor data is captured at one or more locations of the AC system at 1002 and is transmitted to the AC analysis server at 1004 for storage and analysis.
- Set point thresholds may be utilized at 1006 to issue alerts when one or more sensor data levels alone (e.g., humidity, temperature) or a combination of multiple factors (e.g., a ratio based on temperature, humidity, and dust contamination thresholds) exceeds a threshold.
- FIG. 11 identifies an example where temperature and relative humidity measurements are used to provide a microbiological contamination assessment.
- FIG. 11 depicts tracking of temperature and humidity data over time, where carbon dioxide and volatile concentrations can similarly be tracked and visualized. Based on a weighted value associated with those parameters, a current risk of microbiological contamination can be me made.
- Artificial intelligence, formula, or rules based analysis may also be used to indicate when a system is likely to be at risk for microbiological contamination based on current conditions within the AC system or trends in AC system parameters. In one embodiment, average humidity, temperature, and dust levels over a preceding day are ascertained. Fuzzy logic is used to retrieve a valuation associated with those factors predisposing the AC system to microbiological contamination, and a current risk status is identified based on those values.
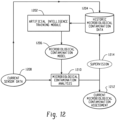
- FIG. 12 is a flow diagram depicting an artificial intelligence training module training a microbiological contamination model.
- An artificial intelligence training module 1202 receives historic microbiological contamination relevant data 1204 from the current AC system and/or other AC systems that has been captured over time. Based on that data and associated estimated or predicted metrics (e.g., estimated current contamination, estimated time to contamination, actual time after data capture when contamination was observed), a microbiological contamination analysis model 1206 (e.g., a neural network) is trained to provide those estimated or predicted metrics based on current image, sensor, and or other data 1208 and trends via a microbiological contamination analysis module 1210.
- the contamination assessment 1212 determined using the microbiological contamination model 1206 is output from the analysis for display on a user interface or issuance of an alert.
- the determined contamination assessment 1212 along with the image/sensor data 1208 that resulted in that determined contamination assessment 1212 may be stored at 1204 and feedback to the training module 1202 in an unsupervised or supervised fashion 1214 to further train the model 1206.
- FIG. 13 depicts microbiological contamination assessments at different points in an AC system.
- a dust contamination (measured, estimated, derived), a measured humidity level, and measured temperature is displayed.
- a microbiological contamination risk is displayed at each location, indicating a current likelihood of contamination based on the displayed metrics.
- a suggested course of action is also displayed for each location.
- FIGS. 14 and 15 depict another example, where temperature and humidity are used as input data for determining a microbiological contamination risk.
- FIG. 16 is a flow diagram depicting an example process for measuring the status of a filter in an AC system.
- Sensor data is captured at 1602 using one or more sensors that are installed at or near a filter (e.g., a sensor with probes positioned before and after the filter that calculates a before and after reading and transmits a single change in pressure metric observed between the probes).
- the sensor data is transmitted to an AC analysis server for storage and analysis at 1604. Evaluations of the current and predicted filter states are made, with alerts and graphical user interface updates being provided based on those analyses at 1606.
- Differential pressure sensors may be utilized to measure aspects of filter status.
- An unclogged filter allows air to pass through with little resistance, such that a measured pressure before the filter is substantially equal to a measured pressure after the filter.
- a clogged filter can result in a backup of air before the filter, such that a pre-filter pressure sensor registers a higher pressure reading that a post-filter pressure sensor.
- a high difference in pressures from before a filter to after a filter can indicate an impediment to the free flow of air through the filter ( e.g., that the filter is clogged).
- An AC analysis server can be configured to determine a current state of a filter based on a current differential pressure sensor reading.
- An analysis server can also provide predictions regarding future filter status (e.g., an amount of time before a filter enters an unsatisfactory state and should be changed) based on trends or artificial intelligence.
- artificial intelligence recognizes patterns in differential pressure data to provide an estimate of when a filter should be replaced based on differential pressure patters in historic systems.
- FIG. 17 is a flow diagram depicting an artificial intelligence training module training a filter model.
- An artificial intelligence training module 1702 receives historic filter performance relevant data 1704 from the current AC system and/or other AC systems that has been captured over time. Based on that data and associated estimated or predicted metrics (e.g., current filter clogged status, estimated time to unsatisfactory filter performance, actual time to unsatisfactory filter performance after data capture), a filter analysis model 1706 (e.g., a neural network) is trained to provide those estimated or predicted metrics based on current image, sensor, and or other data 1708 and trends via a filter analysis module 1710.
- the filter assessment 1712 determined using the filter model 1706 is output from the analysis for display on a user interface or issuance of an alert.
- the determined filter assessment 1712 along with the image/sensor data 1708 that resulted in that determined filter assessment 1712 may be stored at 1704 and feedback to the training module 1702 in an unsupervised or supervised fashion 1714 to further train the model 1706.
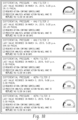
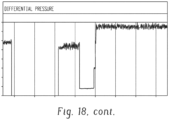
- FIG. 18 depicts example filter performance and prediction user interfaces. For each of a plurality of differential pressure sensors positioned at different filters, a current differential pressure value and corresponding characterization of filter performance (e.g., Excellent, Good, Medium, Bad, Poor) is displayed. A required action based on current performance is displayed. Further, a prediction on when the corresponding filter should be changed to avoid AC performance issues is displayed.
- the predictive analysis may be generated in a variety of ways based on a current filter status and historic performance trends for that filter or other filters, based on a current performance trend associated with that filter, filter type, or other filters, artificial intelligence trained based on historic data associated with other filters, etc.
- the bottom of FIG. 18 depicts differential pressure data associated with one filter over time.
- FIG. 19 depicts a flow diagram depicting a process for monitoring performance of an AC system coil.
- Sensor data is captured at 1902 using one or more sensors that are installed at or near a coil.
- the sensor data is transmitted to an AC analysis server for storage and analysis at 1904.
- Evaluations of the current and predicted coil states are made, with alerts and graphical user interface updates being provided based on those analyses at 1906.
- an AC analysis server may be configured to provide alerts to a user if the coil is deemed dirty based on a differential pressure value or if a heat exchange efficiency of the coil falls below an enthalpy threshold value.
- artificial intelligence recognizes patterns in coil-relevant sensor data prior to an alert being distributed for coil cleaning, providing a time estimate on when coils will need to be cleaned.
- FIG. 20 is a flow diagram depicting an artificial intelligence training module training a coil model.
- An artificial intelligence training module 2002 receives historic coil performance relevant data 2004 from the current AC system and/or other AC systems that has been captured over time. Based on that data and associated estimated or predicted metrics (e.g., current coil status, estimated time to unsatisfactory coil performance, actual time to unsatisfactory coil performance after data capture), a coil analysis model 2006 (e.g., a neural network) is trained to provide those estimated or predicted metrics based on current image, sensor, and or other data 2008 and trends via a coil analysis module 2010.
- the coil assessment 2012 determined using the coil model 2006 is output from the analysis for display on a user interface or issuance of an alert.
- the determined coil assessment 2012 along with the image/sensor data 2008 that resulted in that determined coil assessment 2012 may be stored at 2004 and feedback to the training module 2002 in an unsupervised or supervised fashion 2014 to further train the model 2006.
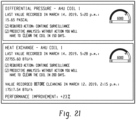
- FIG. 21 depicts an example user interface for providing data and predictions regarding coil status and performance.
- a differential pressure value and qualitative assessment of performance of that coil i.e., Good
- a current action item is displayed along with a prediction of when the coil should be cleaned (e.g., using a neural network that considers differential pressure as an input).
- additional data is provided based on enthalpy sensor data that provides a heat exchange metric.
- the current heat exchange metric value along with a qualitative assessment and suggested current action is provided.
- a prediction of when the coil should be cleaned is also provided ( e.g., using a neural network that considers enthalpy sensor data ( e.g., current, trends) as an input).
- the heat exchange user interface section further depicts a performance improvement (i.e., +23%) observed after a detected cleaning.
- a performance improvement is calculated based on a detected coil maintenance (e.g. , based on a detection of (1) an access to a coil access portal of the AC system using an AC portal magnetic door sensor; (2) the access to the coil access portal being in an appropriate range of time for coil maintenance to have been performed; and (3) a detected improvement in coil performance (e.g., greater than a threshold or percentage improvement).
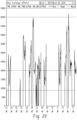
- FIG. 22 depicts example heat exchange data captured and stored for a coil over time.
- FIG. 23 is a flow diagram depicting a method of measuring air quality and making corresponding predictions inside of an AC system.
- Sensor data is captured at 2302 using one or more sensors that are installed at an AC air input or within an AC system.
- the sensor data is transmitted to an AC analysis server for storage and analysis at 2304. Evaluations of the current and predicted air quality states are made, with alerts and graphical user interface updates being provided based on those analyses at 2306.
- an AC analysis server may be configured to provide alerts to a user if the air quality is deemed dirty based on particulate matter, carbon dioxide, carbon monoxide, volatile concentrations, trends, etc..
- artificial intelligence recognizes patterns in air quality-relevant sensor data (e.g., which types of data are predictive, relative importance of sensor data types) prior to an alert being distributed for air quality concerns, providing a time estimate on when air quality action should be taken.
- Particulate matter can be measured using a variety of metrics including counts of particulate matter of different sizes per volume.
- FIG. 24 is a flow diagram depicting an artificial intelligence training module training an air quality model.
- An artificial intelligence training module 2402 receives historic air quality relevant data 2404 from the current AC system and/or other AC systems that has been captured over time. Based on that data and associated estimated or predicted metrics (e.g., current air quality status, estimated time to unsatisfactory air quality, actual time to unsatisfactory air quality after data capture), an air quality analysis model 2406 (e.g., a neural network) is trained to provide those estimated or predicted metrics based on current image, sensor, and or other data 2408 and trends via an air quality analysis module 2410.
- the air quality assessment 2412 determined using the air quality model 2406 is output from the analysis for display on a user interface or issuance of an alert.
- the determined air quality assessment 2412 along with the image/sensor data 2408 that resulted in that determined air quality assessment 2412 may be stored at 2404 and feedback to the training module 2402 in an unsupervised or supervised fashion 2414 to further train the model 2406.
- FIG. 25 depicts a user interface providing indications of air quality at various points within an AC system.
- the top four sections of the user interface provide different measurements of particulates detected in the air at an AC system's air intake.
- Corresponding qualitative assessments and suggested corrective actions e.g., changing a filter to improve quality, monitoring air return rations
- a bottom two sections of the user interface illustrate carbon dioxide measurements at other points within the air conditioning systems and corresponding qualitative assessments and suggested actions.
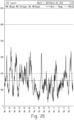
- FIG. 26 depicts example carbon dioxide data captured and stored over time.
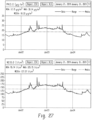
- FIG. 27 depicts example particulate weight and count data captured and stored over a period of time.
- AC systems may also incorporate tools for sanitation or otherwise treating air.
- ultraviolet (UV) light may be introduced into an AC system for antimicrobial purposes.
- disinfectant mists and fragrances may be introduced into AC system air for desired effects.
- Operation and status of such sanitation systems may be monitored.
- the sanitation equipment may generate and send operation data providing information on current status, amount of chemicals introduced, power supply data directly to an AC analysis server.
- operation of sanitation equipment may be indirectly measured using other sensors.
- camera or light detection sensors may be used to observe amounts of UV light output by sanitation equipment.
- FIG. 28 is a flow diagram depicting a method of measuring sanitation equipment function and making corresponding predictions.
- Sensor data is captured at 2802 using one or more sensors that are installed at an AC air input or within an AC system.
- the sensor data is transmitted to an AC analysis server for storage and analysis at 2804. Evaluations of the current and predicted sanitation equipment states are made, with alerts and graphical user interface updates being provided based on those analyses at 2806.
- an AC analysis server may be configured to provide alerts to a user if the sanitation equipment is operating improperly or predicted to operate improperly, such as based on electrical problems, humidity range outside of functional range of sanitation equipment, etc.
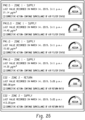
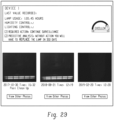
- FIG. 29 depicts graphical user interfaces associated with an ultraviolet light sanitation equipment. A first portion of the user interface indicates an amount of time the light has been detected to be in operation ( e.g., based on captured image data), whether the detected humidity at or near the light is proper, and whether the light is being properly controlled.
- a qualitative assessment of the sanitation equipment is provided along with a suggested action and a prediction regarding when the sanitation equipment should be serviced (e.g., using an artificial intelligence neural network.)
- a bottom portion of the user interface depicts captured images of the sanitation equipment from which operation data can be derived. For example, pixel brightness can be used to detect whether the UV light is operating at a correct intensity, and a count of pixels indicating light emanating ( e.g., light blue pixels) can be used to detect dust contamination of the light.
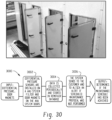
- FIG. 30 is a flow diagram depicting an example method of detecting access to an AC system.
- sensor data such as magnetic door/portal access sensors that sense when a door/portal is opened, differential pressure sensors indicating a drop in pressure associated with a door/portal being opened, timers, and other AC sensors detecting improved system performance after maintenance, occurrence of accesses to an AC system generally, a particular point in an AC system, and performance of maintenance can be detected.
- sensor data such as magnetic door/portal access sensors that sense when a door/portal is opened, differential pressure sensors indicating a drop in pressure associated with a door/portal being opened, timers, and other AC sensors detecting improved system performance after maintenance, occurrence of accesses to an AC system generally, a particular point in an AC system, and performance of maintenance can be detected.
- Such detection can be useful in tracking when and whether routine or alert-prompted maintenance is performed and detection of when and where unscheduled/unauthorized maintenance was made to detect possible nefarious activity and identify a corresponding
- FIG. 30 is a flow diagram depicting a method of detecting AC system access and maintenance.
- Sensor data is captured at 3002 using one or more sensors that are installed at an AC air input or within an AC system.
- the sensor data is transmitted to an AC analysis server for storage and analysis at 3004. Evaluations of system accesses and whether maintenance was performed are made, with alerts and graphical user interface updates being provided based on those analyses at 3006.
- an AC analysis server may be configured to provide alerts to a user if unexpected access to the system occurs, when expected maintenance is more than a threshold period past due, etc.
- FIG. 31 depicts example user interfaces whereby automated maintenance detection is tracked against a maintenance schedule.
- Such user interfaces can be used to track compliance with maintenance protocols.
- an indicator e.g., a green circle
- maintenance is deemed detected when one or more of: (1) an AC system access sensor (e.g., magnetic door sensor, differential pressure system) indicates a system change indicative of access to the AC system, (2) the sensor indicates an access time appropriate for maintenance of the associated area of the AC system ( e.g., not less than a first threshold amount of time, not more than a second threshold of time), and (3) a corresponding AC system performance improvement (e.g., lowered differential pressure at a filter) is observed. Failures to meet one or more of these criteria could be indicative of unauthorized access, lacking maintenance (e.g., opening a portal but not actually performing the work), or other anomaly (e.g., a stowaway in the AC system).
- an AC system access sensor e.g., magnetic door sensor, differential pressure system
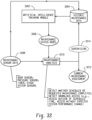
- FIG. 32 is a flow diagram depicting an artificial intelligence training module training a maintenance status model.
- An artificial intelligence training module 3202 receives historic maintenance relevant data 3204 from the current AC system and/or other AC systems that has been captured over time. Based on that data and associated estimated or predicted metrics (e.g., whether maintenance actually was performed, whether an AC system access corresponding to the data actual was deemed anomalous or possibly nefarious), a maintenance analysis model 3206 (e.g., a neural network) is trained to provide those estimated or predicted metrics based on current image, sensor, and or other data 3208 and trends via a maintenance analysis module 3210. The maintenance assessment 3212 determined using the maintenance status model 3206 is output from the analysis for display on a user interface or issuance of an alert.
- a maintenance analysis model 3206 e.g., a neural network
- an alert and corresponding location may be transmitted based on detection of an anomalous or possibly nefarious AC system access.
- the determined maintenance assessment 3212 along with the image/sensor data 3208 that resulted in that determined maintenance assessment 3212 may be stored at 3204 and feedback to the training module 3202 in an unsupervised or supervised fashion 3214 to further train the model 3206.
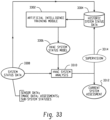
- FIG. 33 is a flow diagram depicting an artificial intelligence training module training an HVAC system status model.
- An artificial intelligence training module 3302 receives historic HVAC system data 3304 from the current AC system and/or other AC systems that has been captured over time. Based on that data and associated estimated or predicted metrics (e.g., whether a system was deemed to need attention or maintenance), an HVAC system status model 3306 (e.g., a neural network) is trained to provide those estimated or predicted metrics based on current image, sensor, and or other data 3308 and trends via a HVAC system analysis module 3310.
- an HVAC system status model 3306 e.g., a neural network
- the HVAC status assessment 3312 determined using the HVAC system status model 3306 is output from the analysis for display on a user interface or issuance of an alert.
- the determined HVAC system status assessment 3312 along with the image/sensor data 3308 that resulted in that determined HVAC system status assessment 3312 may be stored at 3304 and feedback to the training module 3302 in an unsupervised or supervised fashion 3314 to further train the model 3306.
- FIG. 34 is a flow diagram depicting a processor-implemented method for maintaining an air conditioning system.
- a system can include one or more sensors positioned inside of the air conditioning system configured to wirelessly transmit current sensor data to a remote location that is received at 3402.
- a data repository contains historic sensor data and corresponding air conditioning system status data. That data is accessed at 3404
- a neural network is trained at 3406 using the historic sensor data and the corresponding air conditioning system status data to predict a future air conditioning system status based on the wirelessly transmitted current sensor data.
- a server computer system is configured to predict the future air conditioning system status at 3408 based on the current sensor data using the neural network, and a graphical user interface is configured to display the predicted future air conditioning system status to a remote client at 3410.
- the current sensor data is stored at 3412 in the data repository and the neural network is further trained based on the current sensor data.
- data is transmitted via wireless connections, wired connections, or a combination of both.
- FIG. 35 is a flow diagram depicting a method for maintaining an air conditioning system that includes capturing image data inside of the air conditioning system and transmitting the image data to a remote location outside of the air conditioning system at 3502.
- the image data is processed at the remote location to determine an image delta value at 3504, wherein the image delta value represents a change in the image data over a period of time.
- the image delta value is compared to a threshold value at 3506, wherein the threshold value is set based on an evaluation of historic image delta values and corresponding air conditioning system status values.
- An alert signal is transmitted at 3508 over a computer network when the image delta value exceeds the threshold value.
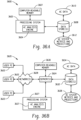
- FIGS. 36A, 36B , and 36C depict example systems for implementing the approaches described herein for maintaining an air conditioning system.
- FIG. 36A depicts an exemplary system 3600 that includes a standalone computer architecture where a processing system 3602 (e.g., one or more computer processors located in a given computer or in multiple computers that may be separate and distinct from one another) includes a computer-implemented AC analysis engine 3604 being executed on the processing system 3602.
- the processing system 3602 has access to a computer-readable memory 3607 in addition to one or more data stores 3608.
- the one or more data stores 3608 may include an AC data database 3610 as well as a AC system metrics and predictions database 3612.
- the processing system 3602 may be a distributed parallel computing environment, which may be used to handle very large-scale data sets.
- FIG. 36B depicts a system 3620 that includes a client-server architecture.
- One or more user PCs 3622 access one or more servers 3624 running an AC analysis engine engine 3637 on a processing system 3627 via one or more networks 3628.
- the one or more servers 3624 may access a computer-readable memory 3630 as well as one or more data stores 3632.
- the one or more data stores 3632 may include an AC data database 3634 as well as an AC system metrics and predictions database 3638.
- FIG. 36C shows a block diagram of exemplary hardware for a standalone computer architecture 3650, such as the architecture depicted in FIG. 36A that may be used to include and/or implement the program instructions of system embodiments of the present disclosure.
- a bus 3652 may serve as the information highway interconnecting the other illustrated components of the hardware.
- a processing system 3654 labeled CPU (central processing unit) e.g., one or more computer processors at a given computer or at multiple computers
- CPU central processing unit
- a non-transitory processor-readable storage medium such as read only memory (ROM) 3658 and random access memory (RAM) 36536, may be in communication with the processing system 3654 and may include one or more programming instructions for performing the method of maintaining an air conditioning system.
- program instructions may be stored on a non-transitory computer-readable storage medium such as a magnetic disk, optical disk, recordable memory device, flash memory, or other physical storage medium.
- computer readable memories 3607, 3630, 3658, 3659 or data stores 3608, 3632, 3683, 3684, 3688 may include one or more data structures for storing and associating various data used in the example systems for maintaining an air conditioning system.
- a data structure stored in any of the aforementioned locations may be used to store data from XML files, initial parameters, and/or data for other variables described herein.
- a disk controller 3690 interfaces one or more optional disk drives to the system bus 3652. These disk drives may be external or internal floppy disk drives such as 3683, external or internal CD-ROM, CD-R, CD-RW or DVD drives such as 3684, or external or internal hard drives 3685. As indicated previously, these various disk drives and disk controllers are optional devices.
- Each of the element managers, real-time data buffer, conveyors, file input processor, database index shared access memory loader, reference data buffer and data managers may include a software application stored in one or more of the disk drives connected to the disk controller 3690, the ROM 3658 and/or the RAM 3659.
- the processor 3654 may access one or more components as required.
- a display interface 3687 may permit information from the bus 3652 to be displayed on a display 3680 in audio, graphic, or alphanumeric format. Communication with external devices may optionally occur using various communication ports 3682.
- the hardware may also include data input devices, such as a keyboard 3679, or other input device 3681, such as a microphone, remote control, pointer, mouse and/or joystick.
- data input devices such as a keyboard 3679, or other input device 3681, such as a microphone, remote control, pointer, mouse and/or joystick.
- the methods and systems described herein may be implemented on many different types of processing devices by program code comprising program instructions that are executable by the device processing subsystem.
- the software program instructions may include source code, object code, machine code, or any other stored data that is operable to cause a processing system to perform the methods and operations described herein and may be provided in any suitable language such as C, C++, JAVA, for example, or any other suitable programming language.
- Other implementations may also be used, however, such as firmware or even appropriately designed hardware configured to carry out the methods and systems described herein.
- the systems' and methods' data may be stored and implemented in one or more different types of computer-implemented data stores, such as different types of storage devices and programming constructs (e.g., RAM, ROM, Flash memory, flat files, databases, programming data structures, programming variables, IF-THEN (or similar type) statement constructs, etc.).
- storage devices and programming constructs e.g., RAM, ROM, Flash memory, flat files, databases, programming data structures, programming variables, IF-THEN (or similar type) statement constructs, etc.
- data structures describe formats for use in organizing and storing data in databases, programs, memory, or other computer-readable media for use by a computer program.
- the computer components, software modules, functions, data stores and data structures described herein may be connected directly or indirectly to each other in order to allow the flow of data needed for their operations.
- a module or processor includes but is not limited to a unit of code that performs a software operation, and can be implemented for example as a subroutine unit of code, or as a software function unit of code, or as an object (as in an object-oriented paradigm), or as an applet, or in a computer script language, or as another type of computer code.
- the software components and/or functionality may be located on a single computer or distributed across multiple computers depending upon the situation at hand.
- a computer-implemented system for maintaining an air conditioning system comprising:
- A2 The system of example A1, wherein the user interface is configured to display a current or future maintenance alert for the air conditioning system based on a plurality of:
- a computer-implemented method for maintaining an air conditioning system comprising:
- a computer-implemented system for maintaining an air conditioning system comprising:
- A16 A non-transitory computer-readable medium encoded with instructions for commanding a system to execute steps that include, comprising:
Landscapes
- Engineering & Computer Science (AREA)
- Physics & Mathematics (AREA)
- Theoretical Computer Science (AREA)
- General Engineering & Computer Science (AREA)
- General Physics & Mathematics (AREA)
- Mathematical Physics (AREA)
- Automation & Control Theory (AREA)
- Evolutionary Computation (AREA)
- Artificial Intelligence (AREA)
- Computational Linguistics (AREA)
- Health & Medical Sciences (AREA)
- Molecular Biology (AREA)
- Computing Systems (AREA)
- Data Mining & Analysis (AREA)
- Biophysics (AREA)
- Biomedical Technology (AREA)
- Software Systems (AREA)
- Life Sciences & Earth Sciences (AREA)
- General Health & Medical Sciences (AREA)
- Chemical & Material Sciences (AREA)
- Combustion & Propulsion (AREA)
- Mechanical Engineering (AREA)
- Signal Processing (AREA)
- Fuzzy Systems (AREA)
- Human Computer Interaction (AREA)
- Computer Networks & Wireless Communication (AREA)
- Air Conditioning Control Device (AREA)
- Testing And Monitoring For Control Systems (AREA)
Priority Applications (1)
| Application Number | Priority Date | Filing Date | Title |
|---|---|---|---|
| EP24181450.8A EP4451081A3 (de) | 2019-09-09 | 2019-09-09 | Systeme und verfahren zur auf künstlicher intelligenz basierten wartung einer klimaanlage |
Applications Claiming Priority (2)
| Application Number | Priority Date | Filing Date | Title |
|---|---|---|---|
| EP24181450.8A EP4451081A3 (de) | 2019-09-09 | 2019-09-09 | Systeme und verfahren zur auf künstlicher intelligenz basierten wartung einer klimaanlage |
| EP19425063.5A EP3789838B1 (de) | 2019-09-09 | 2019-09-09 | Systeme und verfahren zur auf künstlicher intelligenz basierten wartung einer klimaanlage |
Related Parent Applications (1)
| Application Number | Title | Priority Date | Filing Date |
|---|---|---|---|
| EP19425063.5A Division EP3789838B1 (de) | 2019-09-09 | 2019-09-09 | Systeme und verfahren zur auf künstlicher intelligenz basierten wartung einer klimaanlage |
Publications (2)
| Publication Number | Publication Date |
|---|---|
| EP4451081A2 true EP4451081A2 (de) | 2024-10-23 |
| EP4451081A3 EP4451081A3 (de) | 2024-11-13 |
Family
ID=68290195
Family Applications (2)
| Application Number | Title | Priority Date | Filing Date |
|---|---|---|---|
| EP19425063.5A Active EP3789838B1 (de) | 2019-09-09 | 2019-09-09 | Systeme und verfahren zur auf künstlicher intelligenz basierten wartung einer klimaanlage |
| EP24181450.8A Pending EP4451081A3 (de) | 2019-09-09 | 2019-09-09 | Systeme und verfahren zur auf künstlicher intelligenz basierten wartung einer klimaanlage |
Family Applications Before (1)
| Application Number | Title | Priority Date | Filing Date |
|---|---|---|---|
| EP19425063.5A Active EP3789838B1 (de) | 2019-09-09 | 2019-09-09 | Systeme und verfahren zur auf künstlicher intelligenz basierten wartung einer klimaanlage |
Country Status (7)
| Country | Link |
|---|---|
| US (3) | US11156997B2 (de) |
| EP (2) | EP3789838B1 (de) |
| AU (1) | AU2020344110B2 (de) |
| CA (1) | CA3152962A1 (de) |
| ES (1) | ES2986316T3 (de) |
| SA (1) | SA522431882B1 (de) |
| WO (1) | WO2021047975A1 (de) |
Families Citing this family (25)
| Publication number | Priority date | Publication date | Assignee | Title |
|---|---|---|---|---|
| JP6973956B2 (ja) * | 2019-07-04 | 2021-12-01 | 株式会社Kokusai Electric | 基板処理装置、半導体装置の製造方法、プログラムおよび記録媒体 |
| US20210216851A1 (en) * | 2020-01-09 | 2021-07-15 | Electronics And Telecommunications Research Institute | Edge device and method for artificial intelligence inference |
| US11692723B2 (en) * | 2020-03-12 | 2023-07-04 | Honeywell International Inc. | Predictive maintenance convolutional neural networks |
| US11982630B2 (en) * | 2020-04-29 | 2024-05-14 | DataGarden, Inc. | Method and apparatus for cleanliness determination of areas and objects via video monitoring |
| JP7442657B2 (ja) * | 2020-09-05 | 2024-03-04 | 三菱電機株式会社 | 保守管理システム、保守支援装置、保守管理方法、および保守管理プログラム |
| CN113483473A (zh) * | 2021-03-29 | 2021-10-08 | 南方环境有限公司 | 一种基于遗传-神经网络(ga-bp)模型的焊接车间环境控制方法 |
| JP7637889B2 (ja) * | 2021-03-31 | 2025-03-03 | パナソニックIpマネジメント株式会社 | 空気調和装置、及び、制御方法 |
| US20240167723A1 (en) * | 2021-04-16 | 2024-05-23 | Mitsubishi Electric Corporation | Air-conditioning apparatus and air-conditioning system |
| CN117882095A (zh) * | 2021-06-29 | 2024-04-12 | 西门子股份公司 | 方案推荐方法、设备、系统和存储介质 |
| CN115730134A (zh) * | 2021-08-31 | 2023-03-03 | 佛山市顺德区美的电子科技有限公司 | 空调器空气处理模块的推荐方法、服务器、空调器及介质 |
| US11947940B2 (en) * | 2021-10-11 | 2024-04-02 | International Business Machines Corporation | Training data augmentation via program simplification |
| CN113983657A (zh) * | 2021-10-12 | 2022-01-28 | 珠海格力电器股份有限公司 | 一种空调机组运行控制方法、系统、显示终端及空调机组 |
| CN113883695A (zh) * | 2021-11-01 | 2022-01-04 | 东南大学 | 一种基于动态响应的高铁站卫生间自适应通风系统 |
| CN114721352B (zh) * | 2022-04-11 | 2023-07-25 | 华能威海发电有限责任公司 | Dcs系统的状态监测与故障诊断方法及系统 |
| CN115144473B (zh) * | 2022-06-24 | 2025-08-12 | 哈勃智能传感(深圳)有限公司 | 滤网清洁度检测装置和方法 |
| US12339020B1 (en) | 2023-12-21 | 2025-06-24 | Barry Richard Brooks | Smart controls for hybrid refrigeration cycles |
| US12359830B2 (en) * | 2022-09-26 | 2025-07-15 | Google Llc | Systems and methods for predicting refrigerant leakage of a critically charged HVAC/Refrigeration system |
| CN116045446B (zh) * | 2022-12-23 | 2024-12-03 | 珠海格力电器股份有限公司 | 一种空调室外机的自清洁控制方法、模型训练方法及装置 |
| CN115775088B (zh) * | 2023-02-13 | 2023-05-05 | 成都秦川物联网科技股份有限公司 | 一种智慧燃气巡检计划确定方法与物联网系统 |
| CN116717875B (zh) * | 2023-07-04 | 2025-10-14 | 壹品慧数字科技(上海)有限公司 | 一种非侵入式传感器中央空调系统的节能控制方法及装置 |
| US20250075928A1 (en) * | 2023-08-30 | 2025-03-06 | Munters Corporation | Image processing system and method for air conditioning system |
| EP4575941A1 (de) * | 2023-12-21 | 2025-06-25 | Zurich Insurance Company Ltd. | Verfahren zur vorhersage des schimmelwachstums und zur bestimmung seiner ursache |
| CN117911012B (zh) * | 2024-03-20 | 2024-05-28 | 成都思越智能装备股份有限公司 | 基于设备生态检测及运行状态评估的设备健康管理系统 |
| CN118122723A (zh) * | 2024-05-07 | 2024-06-04 | 温州电力建设有限公司 | 基于卷积神经网络的管道清扫方法、装置及设备 |
| CN119268110B (zh) * | 2024-10-14 | 2025-09-26 | 广州精晖机电工程有限公司 | 一种恒温恒湿空调机组除湿热补偿的控制方法及装置 |
Family Cites Families (36)
| Publication number | Priority date | Publication date | Assignee | Title |
|---|---|---|---|---|
| US4948040A (en) * | 1987-06-11 | 1990-08-14 | Mitsubishi Denki Kabushiki Kaisha | Air conditioning system |
| JPH0195958A (ja) | 1987-10-07 | 1989-04-14 | Tokyo Tatsuno Co Ltd | 給油所用サービスユニット |
| JP2002195958A (ja) * | 2000-12-26 | 2002-07-10 | Yamatake Corp | 表面検査方法 |
| US8634014B2 (en) * | 2004-04-05 | 2014-01-21 | Hewlett-Packard Development Company, L.P. | Imaging device analysis systems and imaging device analysis methods |
| US7275377B2 (en) * | 2004-08-11 | 2007-10-02 | Lawrence Kates | Method and apparatus for monitoring refrigerant-cycle systems |
| WO2007019337A2 (en) * | 2005-08-03 | 2007-02-15 | Louis Relle | System and method for indoor air quality environmental sampling and diagnostic evaluation |
| US20170046458A1 (en) * | 2006-02-14 | 2017-02-16 | Power Analytics Corporation | Systems and methods for real-time dc microgrid power analytics for mission-critical power systems |
| FR2918164B1 (fr) | 2007-06-29 | 2009-09-25 | Solios Environnement Sa | Procede de surveillance d'un conduit des fumees reliant un four de cuisson de blocs carbones a un centre de traitement des fumees |
| WO2013059599A1 (en) * | 2011-10-19 | 2013-04-25 | The Regents Of The University Of California | Image-based measurement tools |
| US9082202B2 (en) * | 2012-09-12 | 2015-07-14 | Enlighted, Inc. | Image detection and processing for building control |
| US9958176B2 (en) * | 2013-02-07 | 2018-05-01 | Trane International Inc. | HVAC system with camera and microphone |
| US9618224B2 (en) * | 2013-07-26 | 2017-04-11 | Honeywell International Inc. | Air quality based ventilation control for HVAC systems |
| FR3026510B1 (fr) * | 2014-09-30 | 2016-12-09 | Compagnie Ind Dapplications Thermiques | Dispositif et procede de surveillance du fonctionnement d'un systeme cvca, ensemble comprenant un systeme cvca et un tel dispositif de surveillance, et produit programme d'ordinateur associe |
| DE102015210388A1 (de) | 2015-06-05 | 2016-12-08 | Siemens Aktiengesellschaft | Organische Heterozyklische Alkalimetallsalze als n-Dotierstoffe in der Organischen Elektronik |
| CN107683403B (zh) * | 2015-06-09 | 2020-05-05 | 富士胶片株式会社 | 距离图像获取装置以及距离图像获取方法 |
| US10043288B2 (en) * | 2015-11-10 | 2018-08-07 | Honeywell International Inc. | Methods for monitoring combustion process equipment |
| KR102866743B1 (ko) * | 2016-01-26 | 2025-09-29 | 심보틱 캐나다, 유엘씨 | 케이스 물품 검사 시스템 및 방법 |
| US11048248B2 (en) * | 2016-05-09 | 2021-06-29 | Strong Force Iot Portfolio 2016, Llc | Methods and systems for industrial internet of things data collection in a network sensitive mining environment |
| US10404775B2 (en) * | 2016-07-06 | 2019-09-03 | Tim Seaton | System and method for commercial and residential systems monitoring and notification |
| US10472060B2 (en) * | 2017-02-09 | 2019-11-12 | The Boeing Company | Methods and apparatus to monitor a shock wave proximate a transonic surface |
| US11055797B1 (en) * | 2017-02-24 | 2021-07-06 | Alarm.Com Incorporated | Autonomous property monitoring |
| CN106989489A (zh) * | 2017-04-19 | 2017-07-28 | 珠海格力电器股份有限公司 | 空调过滤装置更换提醒方法、装置及空调 |
| US10353362B2 (en) * | 2017-05-03 | 2019-07-16 | Ul Llc | Method and system for predictive air filter maintenance for sustained indoor air quality |
| CN107504634B (zh) * | 2017-08-03 | 2020-02-11 | 广东美的制冷设备有限公司 | 过滤网的洁净度检测方法、装置、空调器及可读存储介质 |
| US20190107307A1 (en) * | 2017-08-09 | 2019-04-11 | HiberSense, Inc. | System for Management of an HVAC System |
| CN107679649A (zh) * | 2017-09-13 | 2018-02-09 | 珠海格力电器股份有限公司 | 一种电器的故障预测方法、装置、存储介质及电器 |
| CN107606744A (zh) * | 2017-10-09 | 2018-01-19 | 珠海格力电器股份有限公司 | 用于空调的监控设备、方法和空调 |
| US11016129B1 (en) * | 2017-10-20 | 2021-05-25 | Alarm.Com Incorporated | Voltage event tracking and classification |
| WO2019097613A1 (ja) * | 2017-11-15 | 2019-05-23 | 三菱電機株式会社 | 空調管理システム、空調機器、空調管理装置、空調管理方法及びプログラム |
| CN108253587B (zh) * | 2017-11-29 | 2019-08-06 | 珠海格力电器股份有限公司 | 空气清洁度的调整方法及装置 |
| US10834283B2 (en) * | 2018-01-05 | 2020-11-10 | Datamax-O'neil Corporation | Methods, apparatuses, and systems for detecting printing defects and contaminated components of a printer |
| AU2019221098B2 (en) * | 2018-02-19 | 2024-07-25 | BrainBox AI Inc. | Systems and methods of optimizing HVAC control in a building or network of buildings |
| CN108592352B (zh) * | 2018-05-09 | 2020-09-11 | 国家计算机网络与信息安全管理中心 | 水冷空调系统运行状态健康度的预测方法、装置及系统 |
| US20190346170A1 (en) * | 2018-05-14 | 2019-11-14 | Scientific Environmental Design, Inc. | Task ambient hvac system for distributed space conditioning |
| CN110057045B (zh) * | 2019-03-20 | 2021-10-29 | 青岛海尔空调器有限总公司 | 用于空调器的控制方法 |
| CN110210579A (zh) * | 2019-06-19 | 2019-09-06 | 同济大学 | 在线实时监测空调机组微生物污染的方法及装置 |
-
2019
- 2019-09-09 EP EP19425063.5A patent/EP3789838B1/de active Active
- 2019-09-09 ES ES19425063T patent/ES2986316T3/es active Active
- 2019-09-09 EP EP24181450.8A patent/EP4451081A3/de active Pending
- 2019-11-04 US US16/672,651 patent/US11156997B2/en active Active
-
2020
- 2020-09-02 AU AU2020344110A patent/AU2020344110B2/en active Active
- 2020-09-02 CA CA3152962A patent/CA3152962A1/en active Pending
- 2020-09-02 WO PCT/EP2020/074459 patent/WO2021047975A1/en not_active Ceased
-
2021
- 2021-10-20 US US17/505,790 patent/US12147224B2/en active Active
-
2022
- 2022-03-07 SA SA522431882A patent/SA522431882B1/ar unknown
-
2024
- 2024-10-17 US US18/918,229 patent/US20250044786A1/en active Pending
Also Published As
| Publication number | Publication date |
|---|---|
| US20220035361A1 (en) | 2022-02-03 |
| WO2021047975A1 (en) | 2021-03-18 |
| AU2020344110B2 (en) | 2025-05-08 |
| ES2986316T3 (es) | 2024-11-11 |
| US20210071897A1 (en) | 2021-03-11 |
| US11156997B2 (en) | 2021-10-26 |
| EP4451081A3 (de) | 2024-11-13 |
| EP3789838C0 (de) | 2024-06-12 |
| CA3152962A1 (en) | 2021-03-18 |
| EP3789838A1 (de) | 2021-03-10 |
| US12147224B2 (en) | 2024-11-19 |
| EP3789838B1 (de) | 2024-06-12 |
| AU2020344110A1 (en) | 2022-03-24 |
| US20250044786A1 (en) | 2025-02-06 |
| SA522431882B1 (ar) | 2024-11-21 |
Similar Documents
| Publication | Publication Date | Title |
|---|---|---|
| US12147224B2 (en) | Systems and methods for artificial intelligence-based maintenance of an air conditioning system | |
| CN109298697B (zh) | 基于动态基线模型的火电厂系统各部件工作状态评估方法 | |
| CN109240244B (zh) | 基于数据驱动的设备运行状态健康度分析方法及系统 | |
| JP5259797B2 (ja) | 学習型プロセス異常診断装置、およびオペレータ判断推測結果収集装置 | |
| CN119335940A (zh) | 一种基于物联网的污水处理数据实时监控方法及系统 | |
| JP2009070071A (ja) | 学習型プロセス異常診断装置、およびオペレータ判断推測結果収集装置 | |
| US20170169342A1 (en) | System and method for diagnosing at least one component requiring maintenance in an appliance and/or installation | |
| CN113849774A (zh) | 基于寿命分析和健康监测的设备智能维护平台 | |
| CN118446498B (zh) | 一种工业源挥发性有机物处理效率监控系统 | |
| CN117911012A (zh) | 基于设备生态检测及运行状态评估的设备健康管理系统 | |
| CN118783441B (zh) | 一种智慧电网在线安全运维管理系统 | |
| CN118014341A (zh) | 化工园区安全风险评估系统及装置 | |
| JP2009086896A (ja) | コンピュータの障害予測システムおよび障害予測方法 | |
| CN119018738A (zh) | 一种电梯健康状态评估方法、装置、设备及存储介质 | |
| CN114490829B (zh) | 一种故障识别方法、装置、设备及存储介质 | |
| CN118939045A (zh) | 一种实验室环境综合处理系统 | |
| CN120582337B (zh) | 基于新能源箱变的环境监测与管控一体化系统及其方法 | |
| CN119992735A (zh) | 一种面向多场景的ai消防安全监控与自动化预警系统 | |
| CN119541131A (zh) | 一种实验室安全物联智能预警系统 | |
| CN117493129B (zh) | 一种计算机控制设备的运行功率监测系统 | |
| CN119901893B (zh) | 水质监测方法、装置、存储介质及程序产品 | |
| CN120410151B (zh) | 一种游艺设备故障预测管理方法 | |
| CN120144956A (zh) | 一种基于大数据的通风柜参数配置管理方法 | |
| CN120630930A (zh) | 一种实验室故障自动诊断系统及方法 | |
| CN120525372A (zh) | 一种核电站智能应急响应与决策支持系统和方法 |
Legal Events
| Date | Code | Title | Description |
|---|---|---|---|
| PUAI | Public reference made under article 153(3) epc to a published international application that has entered the european phase |
Free format text: ORIGINAL CODE: 0009012 |
|
| STAA | Information on the status of an ep patent application or granted ep patent |
Free format text: STATUS: THE APPLICATION HAS BEEN PUBLISHED |
|
| PUAL | Search report despatched |
Free format text: ORIGINAL CODE: 0009013 |
|
| AC | Divisional application: reference to earlier application |
Ref document number: 3789838 Country of ref document: EP Kind code of ref document: P |
|
| AK | Designated contracting states |
Kind code of ref document: A2 Designated state(s): AL AT BE BG CH CY CZ DE DK EE ES FI FR GB GR HR HU IE IS IT LI LT LU LV MC MK MT NL NO PL PT RO RS SE SI SK SM TR |
|
| AK | Designated contracting states |
Kind code of ref document: A3 Designated state(s): AL AT BE BG CH CY CZ DE DK EE ES FI FR GB GR HR HU IE IS IT LI LT LU LV MC MK MT NL NO PL PT RO RS SE SI SK SM TR |
|
| RIC1 | Information provided on ipc code assigned before grant |
Ipc: G05B 23/02 20060101AFI20241008BHEP |
|
| STAA | Information on the status of an ep patent application or granted ep patent |
Free format text: STATUS: REQUEST FOR EXAMINATION WAS MADE |
|
| 17P | Request for examination filed |
Effective date: 20250512 |