EP4174481B1 - Phasenanalysator, probenanalysator und analyseverfahren - Google Patents
Phasenanalysator, probenanalysator und analyseverfahren Download PDFInfo
- Publication number
- EP4174481B1 EP4174481B1 EP22204572.6A EP22204572A EP4174481B1 EP 4174481 B1 EP4174481 B1 EP 4174481B1 EP 22204572 A EP22204572 A EP 22204572A EP 4174481 B1 EP4174481 B1 EP 4174481B1
- Authority
- EP
- European Patent Office
- Prior art keywords
- phase
- analysis
- screen
- phase analysis
- results
- Prior art date
- Legal status (The legal status is an assumption and is not a legal conclusion. Google has not performed a legal analysis and makes no representation as to the accuracy of the status listed.)
- Active
Links
Images


Classifications
-
- G—PHYSICS
- G01—MEASURING; TESTING
- G01N—INVESTIGATING OR ANALYSING MATERIALS BY DETERMINING THEIR CHEMICAL OR PHYSICAL PROPERTIES
- G01N23/00—Investigating or analysing materials by the use of wave or particle radiation, e.g. X-rays or neutrons, not covered by groups G01N3/00 – G01N17/00, G01N21/00 or G01N22/00
- G01N23/22—Investigating or analysing materials by the use of wave or particle radiation, e.g. X-rays or neutrons, not covered by groups G01N3/00 – G01N17/00, G01N21/00 or G01N22/00 by measuring secondary emission from the material
- G01N23/225—Investigating or analysing materials by the use of wave or particle radiation, e.g. X-rays or neutrons, not covered by groups G01N3/00 – G01N17/00, G01N21/00 or G01N22/00 by measuring secondary emission from the material using electron or ion
- G01N23/2251—Investigating or analysing materials by the use of wave or particle radiation, e.g. X-rays or neutrons, not covered by groups G01N3/00 – G01N17/00, G01N21/00 or G01N22/00 by measuring secondary emission from the material using electron or ion using incident electron beams, e.g. scanning electron microscopy [SEM]
- G01N23/2252—Measuring emitted X-rays, e.g. electron probe microanalysis [EPMA]
-
- H—ELECTRICITY
- H01—ELECTRIC ELEMENTS
- H01J—ELECTRIC DISCHARGE TUBES OR DISCHARGE LAMPS
- H01J37/00—Discharge tubes with provision for introducing objects or material to be exposed to the discharge, e.g. for the purpose of examination or processing thereof
- H01J37/26—Electron or ion microscopes; Electron or ion diffraction tubes
- H01J37/28—Electron or ion microscopes; Electron or ion diffraction tubes with scanning beams
-
- H—ELECTRICITY
- H01—ELECTRIC ELEMENTS
- H01J—ELECTRIC DISCHARGE TUBES OR DISCHARGE LAMPS
- H01J37/00—Discharge tubes with provision for introducing objects or material to be exposed to the discharge, e.g. for the purpose of examination or processing thereof
- H01J37/26—Electron or ion microscopes; Electron or ion diffraction tubes
- H01J37/261—Details
-
- G—PHYSICS
- G01—MEASURING; TESTING
- G01N—INVESTIGATING OR ANALYSING MATERIALS BY DETERMINING THEIR CHEMICAL OR PHYSICAL PROPERTIES
- G01N2223/00—Investigating materials by wave or particle radiation
- G01N2223/40—Imaging
- G01N2223/405—Imaging mapping of a material property
-
- G—PHYSICS
- G01—MEASURING; TESTING
- G01N—INVESTIGATING OR ANALYSING MATERIALS BY DETERMINING THEIR CHEMICAL OR PHYSICAL PROPERTIES
- G01N2223/00—Investigating materials by wave or particle radiation
- G01N2223/60—Specific applications or type of materials
- G01N2223/605—Specific applications or type of materials phases
Definitions
- the present invention relates to a phase analyzer, a sample analyzer, and an analysis method.
- spectrum imaging data in which a position on a sample and an X-ray spectrum are associated with each other, can be obtained.
- an X-ray detector such as an energy-dispersive X-ray spectrometer (EDS) or a wavelength-dispersive X-ray spectrometer (WDS)
- EDS energy-dispersive X-ray spectrometer
- WDS wavelength-dispersive X-ray spectrometer
- JP-A-2018-200270 discloses a phase analyzer in which a graph illustrating an X-ray intensity of each element and a concentration of each element by means of areas is displayed along with a phase map showing a distribution of compounds to facilitate understanding of characteristics of compositions of the compounds.
- phase analysis favorable phase analysis results cannot be obtained unless analysis conditions are appropriate. For that reason, it is required to change analysis conditions and repeat phase analysis to find appropriate conditions. However, when the analysis conditions are changed and the phase analysis is repeated, in order to confirm the phase analysis results obtained prior to the condition change, the phase analysis has to be performed again under the original conditions.
- JP 2021 131412 A discloses an electron microscopy system comprising the display of analysis results on two screens.
- a phase analyzer includes:
- a sample analyzer includes the above phase analyzer.
- An analysis method includes:
- FIG. 1 is a diagram illustrating a configuration of a sample analyzer 100 including a phase analyzer 80 according to an embodiment of the invention.
- the sample analyzer 100 is a scanning electron microscope equipped with an X-ray detector 70. In the sample analyzer 100, by scanning a sample S with an electron probe EP, spectrum imaging data in which a position on the sample S is associated with an X-ray spectrum can be acquired.
- the sample analyzer 100 includes an electron gun 10, a condenser lens 20, a scanning coil 30, an objective lens 40, a sample stage 50, a secondary electron detector 60, the X-ray detector 70, and the phase analyzer 80.
- the electron gun 10 emits an electron beam.
- the electron gun 10 for example, accelerates electrons emitted from a cathode at an anode to emit the electron beam.
- the condenser lens 20 and the objective lens 40 focus the electron beam emitted from the electron gun 10 to form the electron probe EP.
- a probe diameter and a probe current thereof can be controlled by the condenser lens 20.
- the scanning coil 30 two-dimensionally deflects the electron probe EP. By two-dimensionally deflecting the electron probe EP with the scanning coil 30, the sample S can be scanned with the electron probe EP.
- the sample stage 50 can hold the sample S.
- the sample stage 50 has a moving mechanism for moving the sample S.
- the secondary electron detector 60 detects secondary electrons emitted from the sample S when the sample S is irradiated with the electron beam.
- the sample S is scanned by the electron probe EP, and the secondary electrons emitted from the sample S are detected by the secondary electron detector 60, so that a secondary electron image can be obtained.
- the sample analyzer 100 may include a backscattered electron detector that detects backscattered electrons emitted from the sample S when the sample S is irradiated with the electron beam.
- the X-ray detector 70 detects characteristic X-rays emitted from the sample S when the sample S is irradiated with the electron beam.
- the X-ray detector 70 is, for example, an energy-dispersive X-ray detector.
- the X-ray detector 70 may be a wavelength-dispersive X-ray spectroscope. Spectrum imaging data can be obtained by scanning the sample S with the electron probe EP and detecting characteristic X-rays emitted from the sample S with the X-ray detector 70.
- Spectrum imaging data is data in which positions (coordinates) on a sample and spectra based on signals from the sample are associated with each other.
- data in which positions on the sample S are associated with X-ray spectra can be obtained as the spectrum imaging data.
- the sample analyzer 100 while the sample S is scanned with the electron probe EP, the X-ray spectra are collected for each pixel, and the positions on the sample S (coordinates of pixels) and the X-ray spectra are associated with each other and stored.
- the phase analyzer 80 performs phase analysis using the spectrum imaging data and displays phase analysis results. In addition, the phase analyzer 80 can analyze and edit the phase analysis results.
- FIG. 2 is a diagram illustrating a configuration of the phase analyzer 80.
- the phase analyzer 80 includes a processing unit 800, an operation unit 810, a display unit 820, and a storage unit 830.
- the operation unit 810 is used by a user to input operation information and outputs input operation information to the processing unit 800.
- Functions of the operation unit 810 can be implemented by input devices such as a keyboard, a mouse, buttons, a touch panel, and a touch pad.
- the display unit 820 is for displaying images generated by the processing unit 800, and its functions can be realized by a display such as a liquid crystal display (LCD) or a cathode ray tube (CRT).
- LCD liquid crystal display
- CRT cathode ray tube
- the storage unit 830 stores programs and various data for causing a computer to function as each part of the processing unit 800.
- the storage unit 830 also functions as a work area for processing unit 800. Functions of the storage unit 830 can be realized by a hard disk, a random access memory (RAM), or the like.
- the processing unit 800 executes the programs stored in the storage unit 830, and thus functions as a data acquisition unit 802, a condition reception unit 804, a phase analysis unit 806, and a display control unit 808, which will be described below. Functions of the processing unit 800 can be realized by executing a program using hardware such as various processors (a CPU, a DSP, etc.) and ASIC (a gate array, etc.).
- the processing unit 800 includes the data acquisition unit 802, the condition reception unit 804, the phase analysis unit 806, and the display control unit 808.
- the data acquisition unit 802 acquires the spectrum imaging data obtained by analyzing the sample S with the sample analyzer 100.
- the condition reception unit 804 receives an operation for changing conditions for phase analysis.
- the phase analysis unit 806 performs the phase analysis by performing multivariate analysis on the spectrum imaging data. As the phase analysis results, a phase map, a phase spectrum, an area fraction, a phase name (a compound name and compositional information), and the like are obtained.
- the phase map is an image that shows a distribution of compounds.
- the display control unit 808 causes the display unit 820 to display the phase analysis results.
- the data acquisition unit 802 acquires the spectrum imaging data obtained by analyzing the sample S with the sample analyzer 100.
- the sample S is scanned with the electron probe EP to detect the X-rays emitted from the sample S with the X-ray detector 70, and the X-ray spectrum data is acquired at each detected position.
- the detected positions (coordinates on the sample S) and the X-ray spectrum data are associated with each other and stored.
- the spectrum imaging data can be obtained.
- the condition reception unit 804 receives the conditions for phase analysis.
- the conditions for phase analysis are, for example, the number of phases.
- the condition reception unit 804 receives an operation for changing the conditions for phase analysis and acquires information on the number of phases specified by the user.
- the conditions for phase analysis are not limited to the number of phases.
- conditions for phase analysis conditions such as smoothing, pixel binning, normalization of spectrum intensity, and parameters (a size of a region D and a threshold) in a process of combining phases, which will be described later, can be exemplified.
- Smoothing is a process of blurring an image.
- Pixel binning is a process of regarding a plurality of adjacent pixels as one pixel in spectrum imaging data acquired for each pixel. Normalization of spectrum intensity refers to increasing intensity of a peak of interest in a spectrum relative to other peaks. Thus, the peak of interest is treated as a feature of analysis target data in multivariate analysis, which will be described later.
- the parameters in the process of combining phases will be described later in a " ⁇ process of combining edge phases>.” Varying these conditions alters the phase analysis results that are obtained.
- the phase analysis unit 806 performs phase analysis on spectrum imaging data.
- the phase analysis is performed using, for example, multivariate analysis.
- multivariate analysis methods such as self-organizing maps (SOM), a hierarchical clustering method, a K-means method, principal component analysis, singular value decomposition, non-negative matrix decomposition, vertex component analysis, and the like can be exemplified. Also, these methods may be used in combination.
- the phase analysis unit 806 performs the phase analysis in accordance with the conditions received by the condition reception unit 804. For example, in a case in which the condition reception unit 804 receives an operation for specifying the condition for the number of phases, the phase analysis unit 806 performs the phase analysis such that the number of phase maps corresponding to the designated number of phases is created.
- the phase analysis unit 806 may estimate the number of phases using multivariate analysis.
- Cluster analysis is a type of multivariate analysis and is unsupervised learning of collecting similar data in data groups and classifying it.
- cluster analysis a case of estimating the number of phases by combining the self-organizing maps and a hierarchical clustering method will be described.
- the phase analysis unit 806 first creates the self-organizing maps of the spectrum imaging data.
- the phase analysis unit 806 learns the self-organizing maps using spectrum data of each pixel constituting the spectrum imaging data as input vectors. This creates a map space that associates the input vectors with each other.
- a degree of similarity of spectrum data is represented by a distance.
- the phase analysis unit 806 sorts the spectrum data into groups based on the distance on the map space and creates clusters.
- a cluster is a collection of similar input vectors (spectrum data).
- the phase analysis unit 806 uses the clusters obtained using the self-organizing maps as minimum unit clusters and merges the minimum unit clusters using a hierarchical clustering method to create new clusters.
- FIGS. 3 and 4 are diagrams for describing the hierarchical clustering method.
- the phase analysis unit 806 merges the minimum unit clusters C1, C2, C3, C4, C5, C6, C7, C8, C9, and C10 obtained from the self-organizing maps using the hierarchical clustering method to create new clusters.
- the phase analysis unit 806 obtains distances (dissimilarities) between the minimum unit clusters C1, C2, C3, C4, C5, C6, C7, C8, C9, and C10 and merges combinations thereof in descending order of the distance.
- a process of merging can be represented by a dendrogram.
- a distance required to merge two clusters is referred to as a linkage criterion.
- new clusters can be created by cutting the dendrogram at a threshold T.
- the threshold T any number of clusters can be created. In the illustrated example, by cutting the dendrogram at the threshold T, four clusters are created.
- FIG. 5 is a graph illustrating a relationship between the number of clusters and linkage criteria.
- the phase analysis unit 806 obtains the linkage criteria between the minimum unit clusters C1, C2, C3, C4, C5, C6, C7, C8, C9, and C10 and creates the graph (function) indicating the relationship between the number of clusters and the linkage criteria illustrated in FIG. 5 .
- FIG. 6 is a graph illustrating a relationship between the number of clusters and curvatures.
- the phase analysis unit 806 creates the graph indicating the relationship between the number of clusters and the curvatures as illustrated in FIG. 6 from the graph indicating the relationship between the number of clusters and the linkage criteria as illustrated in FIG. 5 .
- the curvature is a curvature at an arbitrary point of the function showing the relationship between the number of clusters and the linkage criteria.
- the phase analysis unit 806 obtains the curvatures for each number of clusters and determines priority based on the curvatures.
- the priority can be expressed, for example, as a ratio of the largest curvature among the curvatures obtained for each number of clusters as a reference. The greater the curvature, the higher the priority.
- the phase analysis unit 806 estimates the number of phases to be four.
- the phase analysis unit 806 performs the phase analysis in accordance with the conditions for phase analysis and creates the phase maps as a result of the phase analysis. In the example illustrated in FIG. 6 , since the number of phases is estimated to be four, the phase analysis unit 806 creates a phase map group consisting of four phase maps.
- the phase analysis unit 806 further creates a phase spectrum from each phase map.
- a phase spectrum is a spectrum obtained by averaging (or integrating) spectra of all pixels that constitute a phase map. Further, the phase analysis unit 806 can perform a process of naming a phase for each phase map (labeling process), a process of obtaining an area fraction of each phase, a process of grouping edge phases, and the like. Each process performed by the phase analysis unit 806 will be described in detail below.
- a phase name is determined using two databases (a first database and a second database).
- a first database a first database
- a second database a second database
- FIG. 7 is a table for describing the first database
- FIG. 8 is a table for describing the second database.
- classification names compound names
- spectrum data and quantitative results are registered.
- the first database may be created by registering acquired spectra by the user, or may be a publicly available or commercially available spectrum database.
- a classification name is a compound name assumed from a quantitative result.
- Spectrum data is data of a acquired X-ray spectrum.
- the quantitative result is a result of performing quantitative calculation on the acquired spectrum.
- SiO 2 is registered as a classification name
- SiO 2 spectrum data is registered as data of a spectral shape
- Si: 47.3269% and O: 52.6731% are registered as a quantitative result.
- composition information is calculated from a compound name.
- SiO 2 is registered as a compound name
- Si: 46.744559% and O: 53.255441% are registered as composition information.
- the phase analysis unit 806 searches for, from the first database and the second database, data that has a high degree of matching with phase data (a phase spectrum and a quantitative result) serving as a naming target and a compound name of the data with a high degree of agreement is used as a phase name thereof.
- phase data a phase spectrum and a quantitative result
- phase analysis unit 806 may perform qualitative and quantitative analysis on phase spectra to obtain phase composition information and may name phases based on the composition information.
- the phase analysis unit 806 calculates an area fraction of each phase map.
- the area fraction can be expressed as a ratio of an area of each phase to an area of the entire map.
- phase map there are cases where two phases cannot be separated at a boundary of the two phases and another phase seems to be present at the boundary between the two phases.
- Another phase present on the boundary between these two phases is referred to as an edge phase.
- This edge phase is not actually present, and thus in a case in which a plurality of edge phases are present, the plurality of edge phases are combined into one.
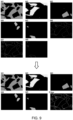
- FIG. 9 is a diagram for describing a process of grouping edge phases.
- FIG. 9 illustrates a phase map M1 of a first phase, a phase map M2 of a second phase, a phase map M3 of a third phase, a phase map M4 of a fourth phase, a phase map M5 of a fifth phase, a phase map M6 of a sixth phase, a phase map M7 of a seventh phase, and a phase map M8 of an eighth phase.
- the sixth phase and the seventh phase indicate edges of the first phase.
- the eighth phase indicates edges of the fifth phase.
- the phase map M6 of the sixth phase, the phase map M7 of the seventh phase, and the phase map M8 of the eighth phase are combined to create a phase map Edge.
- a plurality of edge phases can be combined into one phase map.
- the phase analysis unit 806 determines edge phases from a plurality of phase maps that constitute a phase map group.
- determination is made by focusing on the characteristic that pixels of other phases are often present around pixels of edge phases will be described.
- FIG. 10 is a diagram for describing a method for determining an edge phase.
- a phase A, a phase B, and a phase C are illustrated in FIG. 10 .
- a case of determining whether or not the phase C is an edge phase will be described.
- the region D is a 5 ⁇ 5 region.
- a size of the cutout region D can be set, for example, on a preview screen, which will be described later.
- the number of pixels in each phase included in the region D is counted.
- the phase A has 8 pixels
- the phase B has 12 pixels
- the phase C has 5 pixels.
- the pixel C0 is determined to be an edge-like pixel. In a case in which they match each other, the pixel C0 is not determined to be an edge-like pixel.
- the pixel C0 is determined to be an edge-like pixel.
- the process of cutting out the region D, the process of counting the number of pixels, and the process of determining whether or not the phase with the largest number of pixels matches the phase of the pixel of interest is performed for all pixels belonging to the phase C. Then, a proportion between the total number of pixels belonging to the phase C and the number of pixels determined to be edge-like pixels is calculated. As a result, in a case in which the proportion exceeds a threshold, the phase C is determined as an edge phase. On the other hand, in a case in which the proportion is equal to or less than the threshold, the phase C is not determined to be an edge phase.
- the threshold can be set on a preview screen, which will be described later.
- the edge phases can be extracted from the phase map group.
- the method for determining the edge phase is not limited thereto. For example, it may be determined whether or not a phase is an edge phase from a phase shape, or whether or not it is an edge phase may be determined from a phase spectrum.
- the display control unit 808 displays the phase analysis results performed by the phase analysis unit 806 on an analysis screen (an example of the first screen).
- the analysis screen is displayed on the display unit 820.
- FIG. 11 is a diagram illustrating an example of an analysis screen 2 (a GUI screen).
- a plurality of phase maps and phase spectra are displayed on the analysis screen 2.
- the analysis screen 2 also displays names of each phase, area fractions of each phase, and quantitative results thereof. Further, in a region 202 of the analysis screen 2, an image obtained by synthesizing each phase map and SEM image is displayed.
- phase analysis results it is possible to analyze and edit the phase analysis results.
- qualitative and quantitative analysis of phase spectra, phase combining, phase color changes, phase name changes, and the like can be performed.
- phase spectra can be performed under various conditions.
- phases can be renamed and compared to other phases.
- phase maps with similar distributions can be combined into one phase map, or a plurality of phases with similar compositions can be combined into one phase.
- a plurality of edge phases can be combined into one phase map.
- phase names can be changed.
- phase names may be changed based on results of the qualitative and quantitative analysis of phase spectra.
- the display control unit 808 displays a preview screen (an example of the second screen) along with the analysis screen 2. For example, in a case in which the user changes the phase analysis conditions after analyzing and editing the phase analysis results on the analysis screen 2, the conditions can be changed on the preview screen. Also, on the preview screen, results of the phase analysis performed under the changed conditions are displayed.
- phase analysis results displayed on the preview screen 4 can be applied to the analysis screen 2.
- FIG. 12 is a diagram illustrating an example of the preview screen 4.
- the slider 402 is a GUI component for the user to set the number of clusters. Also, the GUI component for setting the number of clusters is not limited to the slider 402.
- the button 404 is a GUI component for causing the phase analysis unit 806 to set the number of clusters. By pressing the button 404, the number of clusters is set to the number of clusters estimated by the phase analysis unit 806.
- Information for estimating the number of phases is displayed in the information display region 406.
- a dendrogram showing a process of merging clusters using the hierarchical clustering method is displayed.
- the number of clusters can be estimated. For example, a line indicating the threshold T corresponding to the number of clusters set with the slider 402 may be displayed on the dendrogram.
- the information displayed in the information display region 406 is not limited to the dendrogram.
- the information display region 406 may display a graph indicating the relationship between the linkage criteria and the number of clusters illustrated in FIG. 5 .
- the information display region 406 may display both of the dendrogram and the graph indicating the relationship between the linkage criteria and the number of clusters.
- the information display region 406 may not be displayed on the preview screen 4.
- the information display region 406 may be displayed on a screen other than the preview screen 4.
- the slider 408 is a GUI component for setting the edge determination level, that is, for setting the region D in the above-described process for determining the edge phases. Also, the GUI component for setting the edge determination level (region D) is not limited to the slider 408.
- the number of clusters can be set with the slider 402, and the edge determination level can be set with the slider 408.
- the phase analysis conditions that affect the number of phases can be changed.
- the preview screen 4 may display a GUI component for setting a threshold in the process of determining the edge phases.
- the analysis result display region 410 is a region for displaying the phase analysis results.
- phase maps are displayed.
- the analysis result display region 410 may display phase spectra, results of qualitative and quantitative analysis (composition information), phase name information (compound names), and the like. These pieces of information may be displayed near the phase maps, or displayed using tooltips on the phase maps.
- the phase analysis conditions can be changed by using the slider 402 to change the number of clusters, and by using the slider 408 to change the edge determination level (region D).
- the display control unit 808 changes the phase analysis results displayed in the analysis result display region 410 of the preview screen 4 without changing the phase analysis results displayed on the analysis screen 2. That is, the analysis screen 2 displays the phase analysis results from before the conditions are changed, and the preview screen 4 displays the phase analysis results from after the conditions are changed.
- the apply button 412 is a GUI component for applying the phase analysis results displayed on the preview screen 4 to the analysis screen 2.
- the operation of pressing the apply button 412 has been performed here as an operation for applying the phase analysis displayed on the preview screen 4 to the analysis screen 2, the operation for applying the phase analysis displayed on the preview screen 4 to the analysis screen 2 is not particularly limited.
- the close button 414 is a GUI component for closing the preview screen 4 (a window displaying the preview screen 4). By performing an operation of pressing the close button 414, the preview screen 4 is closed and the phase analysis results are discarded.
- the analysis screen 2 and the preview screen 4 can be used to analyze and edit the phase analysis.
- the data acquisition unit 802 acquires the spectrum imaging data.
- the phase analysis unit 806 performs the phase analysis by performing multivariate analysis on the spectrum imaging data. For example, the phase analysis unit 806 creates the self-organizing maps of the spectrum imaging data and creates the minimum unit clusters. Next, the phase analysis unit 806 creates new clusters by merging the minimum unit clusters using the hierarchical clustering method. In this case, the phase analysis unit 806 estimates the number of clusters (the number of phases) based on the curvatures of the function indicating the relationship between the number of clusters and the linkage criteria as illustrated in FIG. 6 .
- the phase analysis unit 806 creates the phase map group consisting of the number of phase maps corresponding to the estimated number of phases.
- the phase analysis unit 806 obtains the compound names (phase names), the area fractions, and the phase spectra in addition to the phase map group. Further, the phase analysis unit 806 performs the qualitative and quantitative analysis on the phase spectra.
- the display control unit 808 causes the display unit 820 to display the analysis screen 2 on which the phase analysis results are displayed.
- the display control unit 808 causes the analysis screen 2 to display the phase maps, the phase spectra, the quantitative results, and the compound names (phase names) as the phase analysis results.
- phase analysis results it is possible to analyze and edit the phase analysis results.
- qualitative and quantitative analysis of phase spectra, phase combining, change of colors of phases, and change of phase names can be performed.
- phase analysis results are determined to be inappropriate as a result of the user confirming the phase analysis results on the analysis screen 2, or as a result of analyzing and editing the phase analysis results, it is required to change the phase analysis conditions and perform new phase analysis. For example, in the phase analysis, if the number of phases set is not appropriate, appropriate phase maps cannot be obtained.
- the display control unit 808 causes the display unit 820 to display the preview screen 4 illustrated in FIG. 12 .
- the same phase analysis results as the phase analysis results displayed on the analysis screen 2 are displayed in the analysis result display region 410 of the preview screen 4.
- the display control unit 808 has caused the preview screen 4 to be displayed when the user performs the operation to open the preview screen 4, but the display control unit 808 may display the preview screen 4 simultaneously with the analysis screen 2.
- the information for setting the number of phases (the number of clusters) is displayed in the information display region 406 of the preview screen 4.
- the information display region 406 displays the dendrogram showing the process of merging the clusters by the hierarchical clustering method.
- the user can check the dendrogram displayed in the information display region 406 and estimate the number of clusters.
- the condition reception unit 804 receives the operation for changing the number of clusters.
- the phase analysis unit 806 performs the phase analysis based on the information on the number of clusters received by the condition reception unit 804 and generates the phase map group configured of the number of phase maps corresponding to the number of clusters. Also, the phase analysis unit 806 obtains the compound names, the area fractions, and the phase spectra and performs the qualitative and quantitative analysis on the phase spectra.
- the display control unit 808 displays the results of the phase analysis performed under the changed conditions of the number of phases on the preview screen 4 and updates the preview screen 4. For that reason, the analysis screen 2 displays the phase analysis results (results of a first phase analysis) before the conditions of the number of phases are changed, and the preview screen 4 displays the phase analysis results from after the conditions of the number of phases are changed (the results of a second phase analysis).
- the condition reception unit 804, the phase analysis unit 806, and the display control unit 808 repeat the above processes, and the results of the phase analysis performed under the changed conditions for the number of phases are displayed on the preview screen 4.
- the analysis screen 2 displays the phase analysis results from before the conditions for the number of phases are changed (results of the first phase analysis)
- the preview screen 4 displays the phase analysis results from after the conditions of the number of phases are changed (results of a third phase analysis).
- the user presses the apply button 412 via the operation unit 810.
- the display control unit 808 causes the analysis screen 2 to display the results of the third phase analysis and updates the analysis screen 2. Since the analysis screen 2 displays the results of the third phase analysis, the results of the third phase analysis can be analyzed and edited.
- the user determines that the results of the first phase analysis are appropriate after the results of the third phase analysis are confirmed, the user performs the operation of pressing the close button 414 via the operation unit 810. Since the results of the first phase analysis are displayed on the analysis screen 2, it is possible to analyze and edit the results of the first phase analysis.
- the phase analyzer 80 operates in the same way when changing the edge determination level (region D). Further, the preview screen 4 may be provided with a GUI component for changing other phase analysis conditions (smoothing, pixel binning, normalization of spectral intensity, parameters in a process of combining phases, etc.). In this case, the phase analyzer 80 operates in the same way as for changing the number of phases described above.
- the phase analyzer 80 includes the data acquisition unit 802 that acquires the spectrum imaging data, the phase analysis unit 806 that performs the phase analysis based on the spectrum imaging data, the display control unit 808 that displays the phase analysis results on the analysis screen 2, and the condition reception unit 804 that receives the operation for changing the phase analysis conditions.
- the phase analysis unit 806 performs the phase analysis under the changed phase analysis conditions when the condition reception unit 804 receives the operation for changing the phase analysis conditions
- the display control unit 808 causes the preview screen 4 to display the results of the phase analysis performed under the changed phase analysis conditions, and in a case in which a predetermined operation is performed, it reflects the phase analysis results displayed on the preview screen 4 on the analysis screen 2.
- phase analyzer 80 the phase analysis results from before the conditions are changed can be displayed on the analysis screen 2 and the phase analysis results from after the conditions are changed can be displayed on the preview screen 4. Accordingly, in the phase analyzer 80, even if the conditions are repeatedly changed, the phase analysis results from before the conditions are changed can be easily confirmed. As a result, for example, the original phase analysis results can be easily reproduced even if the conditions are repeatedly changed.
- phase analysis results are analyzed and edited.
- an amount of work involved in analysis and editing increases, and phases with complex compositions require a lot of labor, such as confirming the results of qualitative and quantitative analysis.
- the phase analysis may be performed under different conditions, but no reasonable results may be obtained, and it can be determined that the initial conditions were optimal.
- the initial conditions were optimal.
- phase analyzer 80 change of the conditions and the phase analysis results from after the conditions are changed are displayed on the preview screen 4, and the phase analysis results from before the conditions are changed are displayed on the analysis screen 2, and thus the phase analysis results from before the conditions are changed can be easily reproduced.
- phase analyzer 80 the phase analysis unit 806 performs the phase analysis using the cluster analysis, and the display control unit 808 displays the dendrogram obtained by the cluster analysis on the preview screen 4. For that reason, the phase analyzer 80 allows the user to logically estimate the number of phases.
- the phase analysis unit 806 creates both the phase maps and the phase spectra when the phase analysis conditions are changed, but the phase spectra may not be created while the preview screen 4 is displaying the phase analysis results, and the phase spectra may be created after the apply button 412 is pressed.
- phase maps are displayed on the preview screen 4, but the phase spectra are not displayed.
- the phase analysis unit 806 creates the phase spectra at a timing when the apply button 412 on the preview screen 4 is pressed, and the display control unit 808 displays the created phase spectra on the analysis screen 2 together with the phase maps.
- the phase analysis unit 806 estimates the number of phases (number of clusters) using the cluster analysis, and the display control unit 808 causes the information display region 406 of the preview screen 4 to display the dendrogram obtained by the cluster analysis.
- the phase analysis unit 806 may estimate the number of phases using principal component analysis
- the display control unit 808 may cause the information display region 406 of the preview screen 4 to display a scree plot created in the process of performing the principal component analysis.
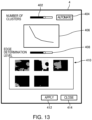
- FIG. 13 is a diagram illustrating an example of the preview screen 4.
- a scree plot is one of methods used to estimate the appropriate number of phases (number of components) in the principal component analysis.
- the scree plot is a graph obtained by plotting calculated principal components and their eigenvalues (variances) by executing the principal component analysis. The user can estimate the appropriate number of phases from a relationship between the number of phases and the eigenvalues.
- phase analyzer 80 the phase analysis unit 806 performs the phase analysis using the principal component analysis, and a display control unit 808 displays the scree plot obtained by the principal component analysis on the preview screen 4. For that reason, the phase analyzer 80 allows the user to logically estimate the number of phases.
- phase analysis unit 806 may perform the phase analysis using singular value decomposition, non-negative matrix decomposition, or vertex component analysis, and the display control unit 808 may display the scree plot obtained by the principal component analysis.
- the phase analysis unit 806 has determined the number of clusters (the number of phases) from the graph indicating the relationship between the number of clusters and the curvatures illustrated in FIG. 6 , but the phase analysis unit 806 may determine cluster number candidates from the graph illustrated in FIG. 6 .
- FIG. 14 is a diagram for describing the process of determining candidates for the number of clusters.
- FIG. 14 illustrates a graph indicating the relationship between the number of clusters and the curvatures.
- the phase analysis unit 806 obtains the curvature for each number of clusters and determines the priority based on the curvature.
- the priority is expressed, for example, as the ratio of the largest curvature among the curvatures obtained for each number of clusters. The greater the curvature, the higher the priority.
- the curvature is the largest in a case in which the number of clusters is "4,” it has the highest priority and is selected as a candidate 1. Also, since the curvature is the second largest in a case in which the number of clusters is "5,” it has the second highest priority and is selected as a candidate 2. In addition, since the curvature is the third largest in a case in which the number of clusters is "3,” it has the third highest priority and is selected as a candidate 3.
- the phase analysis unit 806 determines the case in which the number of phases is 4, the case in which the number of phases is 5, and the case in which the number of phases is 3 as candidates.
- the phase analysis unit 806 determines only the number of clusters with higher priority than a preset reference value of priority as candidates. For that reason, the case in which the number of clusters is "7" has the fourth largest curvature, but the priority is lower than the preset reference value, and thus it is excluded from the candidates.
- the phase analysis unit 806 may list a preset number of candidates for the number of phases. That is, in a case in which the number of candidates is set to three in advance, the phase analysis unit 806 lists three candidates for the number of phases in descending order of priority.
- the phase analysis unit 806 creates phase map groups consisting of the number of phase maps corresponding to the determined number of phases for each candidate of the determined number of phases.
- the display control unit 808 displays the number of phases and the phase map groups on a candidate list screen (an example of a third screen) for each candidate for the number of phases.
- the display control unit 808 displays the phase map groups in descending order of priority.
- FIG. 15 is a diagram illustrating an example of a candidate list screen 6 for displaying phase map group candidates.
- the display control unit 808 displays the phase analysis results performed by the phase analysis unit 806 described above on the candidate list screen 6 illustrated in FIG. 15 .
- the candidate list screen 6 illustrated in FIG. 15 displays a phase map group in which the number of phases is four, a phase map group in which the number of phases is five, and a phase map group in which the number of phases is three. These three phase map groups are arranged in descending order of priority.
- the display control unit 808 displays the compound names (phase names) and each area fraction.
- compound names compound names determined by the phase analysis unit 806 or compound names input by the user are displayed.
- the candidate list screen 6 may display information for the user to select phase map groups, such as phase spectra, a dendrogram, and the like, in addition to the above-described phase names and area fractions.
- FIG. 16 is a diagram schematically illustrating a state in which one phase map group is selected on the candidate list screen 6.
- the user can select one phase map group from a plurality of phase map group candidates displayed.
- the display unit 820 includes a touch panel (an example of the operation unit 810)
- the user performs an operation of touching a desired phase map group with a fingertip FG, so that the user can select one phase map group from the plurality of phase map groups displayed on the candidate list screen 6.
- the phase map group may be selected by operating a mouse or keyboard.
- the display control unit 808 causes the analysis screen 2 to display the selected phase map group (phase analysis results).
- the phase analysis unit 806 performs the multivariate analysis on the spectrum imaging data to determine candidates for the number of phases and creates phase map groups consisting of the number of phase maps corresponding to the number of phases for each candidate, and the display control unit 808 displays the phase map groups on the candidate list screen 6 for each candidate.
- the phase analyzer 80 can determine the candidates for the number of phases and can cause the display unit 820 to display the phase map groups configured of the number of phase maps corresponding to the number of phases for each candidate for the number of phases. Accordingly, the user can easily obtain favorable phase map groups.
- the phase analysis unit 806 obtains the priority of the number of phases based on the results of the multivariate analysis and determines the candidates for the number of phases based on the priority. For that reason, the phase analyzer 80 does not require the user to specify the number of phases.
- the analyzer according to the invention is not limited thereto.
- the analyzer according to the invention may be any device that can obtain spectra based on signals (X-rays, electrons, ions, etc.) from the sample S.
- the analyzer according to the invention is a transmission electron microscope equipped with an energy-dispersive X-ray spectrometer or a wavelength-dispersive X-ray spectrometer, an electron probe microanalyzer, an Auger microprobe, a photoelectron spectrometer, a focused ion beam device, or the like.
Landscapes
- Chemical & Material Sciences (AREA)
- Analytical Chemistry (AREA)
- Physics & Mathematics (AREA)
- Health & Medical Sciences (AREA)
- Life Sciences & Earth Sciences (AREA)
- Biochemistry (AREA)
- General Health & Medical Sciences (AREA)
- General Physics & Mathematics (AREA)
- Immunology (AREA)
- Pathology (AREA)
- Analysing Materials By The Use Of Radiation (AREA)
Claims (8)
- Phasenanalysator (80), umfassend:eine Datenerfassungseinheit (802), die konfiguriert ist, um Bildspektraldaten zu erfassen, in denen eine Position auf einer Probe (S) mit einem Spektrum eines Signals von der Probe (S) verknüpft ist;eine Phasenanalyseeinheit (806), die konfiguriert ist, um eine Phasenanalyse basierend auf den Bildspektraldaten durchzuführen;eine Anzeigesteuereinheit (808), die konfiguriert ist, um Ergebnisse der Phasenanalyse auf einem ersten Bildschirm (2) anzuzeigen; undeine Bedingungsempfangseinheit (804), die konfiguriert ist, um von einem Benutzer eine Anweisung zum Ändern einer Bedingung für die Phasenanalyse zu empfangen,wobei die Phasenanalyseeinheit konfiguriert ist, um eine Phasenanalyse unter der geänderten Bedingung durchzuführen, wenn die Bedingungsempfangseinheit (804) die Anweisung zum Ändern der Bedingung empfangen hat,dadurch gekennzeichnet, dassdie Anzeigesteuereinheit (808) konfiguriert ist, um auf einem zweiten Bildschirm (4) die Ergebnisse der unter den geänderten Bedingungen durchgeführten Phasenanalyse anzuzeigen, während der erste Bildschirm (2) die Ergebnisse der unter den Bedingungen vor der Änderung durchgeführten Phasenanalyse anzeigt,die Anzeigesteuereinheit (808) konfiguriert ist, um auf dem ersten Bildschirm (2) die auf dem zweiten Bildschirm (4) angezeigten Ergebnisse der Phasenanalyse anzuzeigen, wenn eine erste Operation durch den Benutzer auf dem zweiten Bildschirm (4) durchgeführt wurde, unddie Anzeigesteuereinheit (808) konfiguriert ist, um den zweiten Bildschirm (4) zu schließen und den ersten Bildschirm (2) zu veranlassen, die Ergebnisse der unter den Bedingungen vor der Änderung durchgeführten Phasenanalyse anzuzeigen, wobei die Ergebnisse der unter den geänderten Bedingungen durchgeführten Phasenanalyse verworfen werden, wenn eine zweite Operation durch den Benutzer auf dem zweiten Bildschirm (4) durchgeführt wurde.
- Phasenanalysator (80) nach Anspruch 1, bei dem die Bedingung die Anzahl der Phasen ist.
- Phasenanalysator (80) nach Anspruch 1 oder 2, bei dem die Ergebnisse der Phasenanalyse eine Phasenkarte umfassen.
- Phasenanalysator (80) nach einem der Ansprüche 1 bis 3,bei demdie Phasenanalyseeinheit (806) konfiguriert ist, um die Phasenanalyse unter Verwendung einer Clusteranalyse durchzuführen, unddie Anzeigesteuereinheit (808) konfiguriert ist, um auf dem zweiten Bildschirm (4) ein durch die Clusteranalyse erhaltenes Dendrogramm anzuzeigen.
- Phasenanalysator (80) nach einem der Ansprüche 1 bis 3, bei demdie Phasenanalyseeinheit (806) konfiguriert ist, um die Phasenanalyse unter Verwendung der Hauptkomponentenanalyse durchzuführen, unddie Anzeigesteuereinheit (808) konfiguriert ist, um auf dem zweiten Bildschirm (4) ein durch die Hauptkomponentenanalyse erhaltenes Scree-Diagramm anzuzeigen.
- Phasenanalysator (80) nach einem der Ansprüche 1 bis 5, bei demdie Phasenanalyseeinheit (806) konfiguriert ist, um eine multivariate Analyse der Bildspektraldaten durchzuführen, um Kandidaten für die Anzahl der Phasen zu bestimmen,die Phasenanalyseeinheit (806) konfiguriert ist, um für jeden der Kandidaten eine Phasenkartengruppe zu erstellen, die eine der Anzahl der Phasen entsprechende Anzahl von Phasenkarten enthält, unddie Anzeigesteuereinheit (808) konfiguriert ist, um auf einem dritten Bildschirm (6) die Phasenkartengruppe für jeden der Kandidaten anzuzeigen.
- Probenanalysator (100) mit dem Phasenanalysator (80) gemäß einem der Ansprüche 1 bis 6.
- Analyseverfahren, umfassend:Erfassen von Bildspektraldaten, in denen eine Position auf einer Probe (S) mit einem Spektrum eines Signals von der Probe (S) verknüpft ist;Durchführen einer Phasenanalyse auf der Grundlage der Bildspektraldaten;Anzeigen der Ergebnisse der Phasenanalyse auf einem ersten Bildschirm (2);wenn eine Bedingung für die Phasenanalyse von einem Benutzer geändert wurde, Durchführen einer Phasenanalyse unter der geänderten Bedingung und Anzeigen der Ergebnisse der unter der geänderten Bedingung durchgeführten Phasenanalyse auf einem zweiten Bildschirm (4);dadurch gekennzeichnet, dass das Verfahren ferner umfasst:Anzeigen der auf dem zweiten Bildschirm (4) angezeigten Ergebnisse der Phasenanalyse auf dem ersten Bildschirm (2), wenn eine erste Operation durch den Benutzer auf dem zweiten Bildschirm (4) ausgeführt wurde; undSchließen des zweiten Bildschirms (4) und Veranlassen, dass der erste Bildschirm (2) die Ergebnisse der unter den Bedingungen vor der Änderung durchgeführten Phasenanalyse anzeigt, wobei die Ergebnisse der unter den geänderten Bedingungen durchgeführten Phasenanalyse verworfen werden, wenn eine zweite Operation durch den Benutzer auf dem zweiten Bildschirm durchgeführt wurde.
Applications Claiming Priority (1)
| Application Number | Priority Date | Filing Date | Title |
|---|---|---|---|
| JP2021179616A JP7442488B2 (ja) | 2021-11-02 | 2021-11-02 | 相分析装置、試料分析装置、および分析方法 |
Publications (2)
| Publication Number | Publication Date |
|---|---|
| EP4174481A1 EP4174481A1 (de) | 2023-05-03 |
| EP4174481B1 true EP4174481B1 (de) | 2024-08-07 |
Family
ID=84044970
Family Applications (1)
| Application Number | Title | Priority Date | Filing Date |
|---|---|---|---|
| EP22204572.6A Active EP4174481B1 (de) | 2021-11-02 | 2022-10-28 | Phasenanalysator, probenanalysator und analyseverfahren |
Country Status (3)
| Country | Link |
|---|---|
| US (1) | US12469675B2 (de) |
| EP (1) | EP4174481B1 (de) |
| JP (1) | JP7442488B2 (de) |
Families Citing this family (2)
| Publication number | Priority date | Publication date | Assignee | Title |
|---|---|---|---|---|
| JP7476247B2 (ja) * | 2022-02-16 | 2024-04-30 | 日本電子株式会社 | 相分析装置、試料分析装置、および分析方法 |
| JP7702450B2 (ja) * | 2023-07-18 | 2025-07-03 | 日本電子株式会社 | スペクトル処理装置、試料分析装置、およびスペクトル処理方法 |
Citations (1)
| Publication number | Priority date | Publication date | Assignee | Title |
|---|---|---|---|---|
| JP2021131412A (ja) * | 2020-02-18 | 2021-09-09 | 株式会社島津製作所 | 表示システム、分析装置、制御方法、および制御プログラム |
Family Cites Families (9)
| Publication number | Priority date | Publication date | Assignee | Title |
|---|---|---|---|---|
| WO2007119799A1 (ja) * | 2006-04-12 | 2007-10-25 | Japan Health Sciences Foundation | 細胞の心筋分化活性検出用マーカー |
| JP2010060389A (ja) * | 2008-09-02 | 2010-03-18 | Horiba Ltd | 粒子解析装置、データ解析装置、x線分析装置、粒子解析方法及びコンピュータプログラム |
| JP5370180B2 (ja) * | 2010-01-26 | 2013-12-18 | 株式会社島津製作所 | X線分析用表示処理装置 |
| JP6112613B2 (ja) * | 2011-08-19 | 2017-04-12 | 国立大学法人京都大学 | 信号分析装置、信号分析方法及びコンピュータプログラム |
| JP6588362B2 (ja) * | 2016-03-08 | 2019-10-09 | 日本電子株式会社 | 相分析装置、相分析方法、および表面分析装置 |
| JP6868468B2 (ja) * | 2017-05-29 | 2021-05-12 | 日本電子株式会社 | 画像処理装置、表面分析装置、および画像処理方法 |
| JP2020129439A (ja) * | 2019-02-07 | 2020-08-27 | 株式会社日立製作所 | 情報処理システムおよび情報処理方法 |
| JP7381890B2 (ja) * | 2019-04-02 | 2023-11-16 | 日本製鉄株式会社 | 焼結鉱の観察評価方法及び焼結鉱の被還元性評価方法 |
| JP2021026925A (ja) * | 2019-08-07 | 2021-02-22 | 株式会社島津製作所 | 走査型電子顕微鏡 |
-
2021
- 2021-11-02 JP JP2021179616A patent/JP7442488B2/ja active Active
-
2022
- 2022-10-28 EP EP22204572.6A patent/EP4174481B1/de active Active
- 2022-11-01 US US17/978,518 patent/US12469675B2/en active Active
Patent Citations (1)
| Publication number | Priority date | Publication date | Assignee | Title |
|---|---|---|---|---|
| JP2021131412A (ja) * | 2020-02-18 | 2021-09-09 | 株式会社島津製作所 | 表示システム、分析装置、制御方法、および制御プログラム |
Non-Patent Citations (2)
| Title |
|---|
| BOTHA PIETER: "Augmenting SEM-EDS Phase Classification using Data Projection and Cluster Analysis", 16 October 2018 (2018-10-16), XP093023624, Retrieved from the Internet <URL:https://www.linkedin.com/pulse/augmenting-sem-eds-phase-classification-using-data-projection-botha> [retrieved on 20230214] * |
| MÜNCH B. ET AL: "Segmentation of elemental EDS maps by means of multiple clustering combined with phase identification : SEGMENTATION OF ELEMENTAL EDS MAPS", JOURNAL OF MICROSCOPY, vol. 260, no. 3, 14 September 2015 (2015-09-14), GB, pages 411 - 426, XP093024652, ISSN: 0022-2720, DOI: 10.1111/jmi.12309 * |
Also Published As
| Publication number | Publication date |
|---|---|
| EP4174481A1 (de) | 2023-05-03 |
| US12469675B2 (en) | 2025-11-11 |
| US20230135601A1 (en) | 2023-05-04 |
| JP2023068470A (ja) | 2023-05-17 |
| JP7442488B2 (ja) | 2024-03-04 |
Similar Documents
| Publication | Publication Date | Title |
|---|---|---|
| JP5708400B2 (ja) | イメージング質量分析装置及び質量分析データ処理方法 | |
| EP4174481B1 (de) | Phasenanalysator, probenanalysator und analyseverfahren | |
| CN105954307B (zh) | 样品特定的参考光谱库 | |
| JP6242291B2 (ja) | 相分析装置、相分析方法、および表面分析装置 | |
| EP2867656A1 (de) | Clusteranalyse von unbekannten elementen in einem sem-eds-datensatz | |
| CN113808141B (zh) | 成像质量分析装置、以及成像质量分析方法 | |
| US10593072B2 (en) | Image processing apparatus, surface analyzer, and image processing method | |
| EP3062096B1 (de) | Probenspezifische referenzspektrenbibliothek | |
| JP2024086781A (ja) | 表面分析装置 | |
| EP4174480B1 (de) | Phasenanalysator, probenanalysator und analyseverfahren | |
| CN112805559B (zh) | 成像数据解析装置 | |
| EP4231003B1 (de) | Phasenanalysator, probenanalysator und analyseverfahren | |
| US12399142B2 (en) | Scatter diagram display device, scatter diagram display method, and analyzer | |
| EP3073253A1 (de) | Probenspezifische referenzspektrenbibliothek | |
| US12026888B2 (en) | Imaging analyzer | |
| US20250029225A1 (en) | Spectrum Processing Device, Specimen Analyzing Device, and Spectrum Processing Method | |
| CN113994203A (zh) | 分析装置 | |
| CN113508293A (zh) | 成像质量分析装置 |
Legal Events
| Date | Code | Title | Description |
|---|---|---|---|
| PUAI | Public reference made under article 153(3) epc to a published international application that has entered the european phase |
Free format text: ORIGINAL CODE: 0009012 |
|
| STAA | Information on the status of an ep patent application or granted ep patent |
Free format text: STATUS: THE APPLICATION HAS BEEN PUBLISHED |
|
| AK | Designated contracting states |
Kind code of ref document: A1 Designated state(s): AL AT BE BG CH CY CZ DE DK EE ES FI FR GB GR HR HU IE IS IT LI LT LU LV MC ME MK MT NL NO PL PT RO RS SE SI SK SM TR |
|
| STAA | Information on the status of an ep patent application or granted ep patent |
Free format text: STATUS: REQUEST FOR EXAMINATION WAS MADE |
|
| 17P | Request for examination filed |
Effective date: 20231025 |
|
| RBV | Designated contracting states (corrected) |
Designated state(s): AL AT BE BG CH CY CZ DE DK EE ES FI FR GB GR HR HU IE IS IT LI LT LU LV MC ME MK MT NL NO PL PT RO RS SE SI SK SM TR |
|
| GRAP | Despatch of communication of intention to grant a patent |
Free format text: ORIGINAL CODE: EPIDOSNIGR1 |
|
| STAA | Information on the status of an ep patent application or granted ep patent |
Free format text: STATUS: GRANT OF PATENT IS INTENDED |
|
| INTG | Intention to grant announced |
Effective date: 20240313 |
|
| GRAS | Grant fee paid |
Free format text: ORIGINAL CODE: EPIDOSNIGR3 |
|
| GRAA | (expected) grant |
Free format text: ORIGINAL CODE: 0009210 |
|
| STAA | Information on the status of an ep patent application or granted ep patent |
Free format text: STATUS: THE PATENT HAS BEEN GRANTED |
|
| RAP3 | Party data changed (applicant data changed or rights of an application transferred) |
Owner name: JEOL LTD. |
|
| AK | Designated contracting states |
Kind code of ref document: B1 Designated state(s): AL AT BE BG CH CY CZ DE DK EE ES FI FR GB GR HR HU IE IS IT LI LT LU LV MC ME MK MT NL NO PL PT RO RS SE SI SK SM TR |
|
| REG | Reference to a national code |
Ref country code: GB Ref legal event code: FG4D |
|
| REG | Reference to a national code |
Ref country code: CH Ref legal event code: EP |
|
| REG | Reference to a national code |
Ref country code: IE Ref legal event code: FG4D |
|
| REG | Reference to a national code |
Ref country code: DE Ref legal event code: R096 Ref document number: 602022005150 Country of ref document: DE |
|
| REG | Reference to a national code |
Ref country code: LT Ref legal event code: MG9D |
|
| REG | Reference to a national code |
Ref country code: NL Ref legal event code: MP Effective date: 20240807 |
|
| PG25 | Lapsed in a contracting state [announced via postgrant information from national office to epo] |
Ref country code: NO Free format text: LAPSE BECAUSE OF FAILURE TO SUBMIT A TRANSLATION OF THE DESCRIPTION OR TO PAY THE FEE WITHIN THE PRESCRIBED TIME-LIMIT Effective date: 20241107 |
|
| REG | Reference to a national code |
Ref country code: AT Ref legal event code: MK05 Ref document number: 1711477 Country of ref document: AT Kind code of ref document: T Effective date: 20240807 |
|
| PG25 | Lapsed in a contracting state [announced via postgrant information from national office to epo] |
Ref country code: FI Free format text: LAPSE BECAUSE OF FAILURE TO SUBMIT A TRANSLATION OF THE DESCRIPTION OR TO PAY THE FEE WITHIN THE PRESCRIBED TIME-LIMIT Effective date: 20240807 Ref country code: NL Free format text: LAPSE BECAUSE OF FAILURE TO SUBMIT A TRANSLATION OF THE DESCRIPTION OR TO PAY THE FEE WITHIN THE PRESCRIBED TIME-LIMIT Effective date: 20240807 Ref country code: PL Free format text: LAPSE BECAUSE OF FAILURE TO SUBMIT A TRANSLATION OF THE DESCRIPTION OR TO PAY THE FEE WITHIN THE PRESCRIBED TIME-LIMIT Effective date: 20240807 Ref country code: GR Free format text: LAPSE BECAUSE OF FAILURE TO SUBMIT A TRANSLATION OF THE DESCRIPTION OR TO PAY THE FEE WITHIN THE PRESCRIBED TIME-LIMIT Effective date: 20241108 Ref country code: PT Free format text: LAPSE BECAUSE OF FAILURE TO SUBMIT A TRANSLATION OF THE DESCRIPTION OR TO PAY THE FEE WITHIN THE PRESCRIBED TIME-LIMIT Effective date: 20241209 |
|
| PG25 | Lapsed in a contracting state [announced via postgrant information from national office to epo] |
Ref country code: BG Free format text: LAPSE BECAUSE OF FAILURE TO SUBMIT A TRANSLATION OF THE DESCRIPTION OR TO PAY THE FEE WITHIN THE PRESCRIBED TIME-LIMIT Effective date: 20240807 |
|
| PG25 | Lapsed in a contracting state [announced via postgrant information from national office to epo] |
Ref country code: LV Free format text: LAPSE BECAUSE OF FAILURE TO SUBMIT A TRANSLATION OF THE DESCRIPTION OR TO PAY THE FEE WITHIN THE PRESCRIBED TIME-LIMIT Effective date: 20240807 |
|
| PG25 | Lapsed in a contracting state [announced via postgrant information from national office to epo] |
Ref country code: AT Free format text: LAPSE BECAUSE OF FAILURE TO SUBMIT A TRANSLATION OF THE DESCRIPTION OR TO PAY THE FEE WITHIN THE PRESCRIBED TIME-LIMIT Effective date: 20240807 Ref country code: IS Free format text: LAPSE BECAUSE OF FAILURE TO SUBMIT A TRANSLATION OF THE DESCRIPTION OR TO PAY THE FEE WITHIN THE PRESCRIBED TIME-LIMIT Effective date: 20241207 |
|
| PG25 | Lapsed in a contracting state [announced via postgrant information from national office to epo] |
Ref country code: HR Free format text: LAPSE BECAUSE OF FAILURE TO SUBMIT A TRANSLATION OF THE DESCRIPTION OR TO PAY THE FEE WITHIN THE PRESCRIBED TIME-LIMIT Effective date: 20240807 |
|
| PG25 | Lapsed in a contracting state [announced via postgrant information from national office to epo] |
Ref country code: RS Free format text: LAPSE BECAUSE OF FAILURE TO SUBMIT A TRANSLATION OF THE DESCRIPTION OR TO PAY THE FEE WITHIN THE PRESCRIBED TIME-LIMIT Effective date: 20241107 Ref country code: ES Free format text: LAPSE BECAUSE OF FAILURE TO SUBMIT A TRANSLATION OF THE DESCRIPTION OR TO PAY THE FEE WITHIN THE PRESCRIBED TIME-LIMIT Effective date: 20240807 |
|
| PG25 | Lapsed in a contracting state [announced via postgrant information from national office to epo] |
Ref country code: RS Free format text: LAPSE BECAUSE OF FAILURE TO SUBMIT A TRANSLATION OF THE DESCRIPTION OR TO PAY THE FEE WITHIN THE PRESCRIBED TIME-LIMIT Effective date: 20241107 Ref country code: PT Free format text: LAPSE BECAUSE OF FAILURE TO SUBMIT A TRANSLATION OF THE DESCRIPTION OR TO PAY THE FEE WITHIN THE PRESCRIBED TIME-LIMIT Effective date: 20241209 Ref country code: PL Free format text: LAPSE BECAUSE OF FAILURE TO SUBMIT A TRANSLATION OF THE DESCRIPTION OR TO PAY THE FEE WITHIN THE PRESCRIBED TIME-LIMIT Effective date: 20240807 Ref country code: NO Free format text: LAPSE BECAUSE OF FAILURE TO SUBMIT A TRANSLATION OF THE DESCRIPTION OR TO PAY THE FEE WITHIN THE PRESCRIBED TIME-LIMIT Effective date: 20241107 Ref country code: NL Free format text: LAPSE BECAUSE OF FAILURE TO SUBMIT A TRANSLATION OF THE DESCRIPTION OR TO PAY THE FEE WITHIN THE PRESCRIBED TIME-LIMIT Effective date: 20240807 Ref country code: LV Free format text: LAPSE BECAUSE OF FAILURE TO SUBMIT A TRANSLATION OF THE DESCRIPTION OR TO PAY THE FEE WITHIN THE PRESCRIBED TIME-LIMIT Effective date: 20240807 Ref country code: IS Free format text: LAPSE BECAUSE OF FAILURE TO SUBMIT A TRANSLATION OF THE DESCRIPTION OR TO PAY THE FEE WITHIN THE PRESCRIBED TIME-LIMIT Effective date: 20241207 Ref country code: HR Free format text: LAPSE BECAUSE OF FAILURE TO SUBMIT A TRANSLATION OF THE DESCRIPTION OR TO PAY THE FEE WITHIN THE PRESCRIBED TIME-LIMIT Effective date: 20240807 Ref country code: GR Free format text: LAPSE BECAUSE OF FAILURE TO SUBMIT A TRANSLATION OF THE DESCRIPTION OR TO PAY THE FEE WITHIN THE PRESCRIBED TIME-LIMIT Effective date: 20241108 Ref country code: FI Free format text: LAPSE BECAUSE OF FAILURE TO SUBMIT A TRANSLATION OF THE DESCRIPTION OR TO PAY THE FEE WITHIN THE PRESCRIBED TIME-LIMIT Effective date: 20240807 Ref country code: ES Free format text: LAPSE BECAUSE OF FAILURE TO SUBMIT A TRANSLATION OF THE DESCRIPTION OR TO PAY THE FEE WITHIN THE PRESCRIBED TIME-LIMIT Effective date: 20240807 Ref country code: BG Free format text: LAPSE BECAUSE OF FAILURE TO SUBMIT A TRANSLATION OF THE DESCRIPTION OR TO PAY THE FEE WITHIN THE PRESCRIBED TIME-LIMIT Effective date: 20240807 Ref country code: AT Free format text: LAPSE BECAUSE OF FAILURE TO SUBMIT A TRANSLATION OF THE DESCRIPTION OR TO PAY THE FEE WITHIN THE PRESCRIBED TIME-LIMIT Effective date: 20240807 |
|
| PG25 | Lapsed in a contracting state [announced via postgrant information from national office to epo] |
Ref country code: DK Free format text: LAPSE BECAUSE OF FAILURE TO SUBMIT A TRANSLATION OF THE DESCRIPTION OR TO PAY THE FEE WITHIN THE PRESCRIBED TIME-LIMIT Effective date: 20240807 Ref country code: SM Free format text: LAPSE BECAUSE OF FAILURE TO SUBMIT A TRANSLATION OF THE DESCRIPTION OR TO PAY THE FEE WITHIN THE PRESCRIBED TIME-LIMIT Effective date: 20240807 |
|
| PG25 | Lapsed in a contracting state [announced via postgrant information from national office to epo] |
Ref country code: EE Free format text: LAPSE BECAUSE OF FAILURE TO SUBMIT A TRANSLATION OF THE DESCRIPTION OR TO PAY THE FEE WITHIN THE PRESCRIBED TIME-LIMIT Effective date: 20240807 |
|
| PG25 | Lapsed in a contracting state [announced via postgrant information from national office to epo] |
Ref country code: CZ Free format text: LAPSE BECAUSE OF FAILURE TO SUBMIT A TRANSLATION OF THE DESCRIPTION OR TO PAY THE FEE WITHIN THE PRESCRIBED TIME-LIMIT Effective date: 20240807 |
|
| PG25 | Lapsed in a contracting state [announced via postgrant information from national office to epo] |
Ref country code: SK Free format text: LAPSE BECAUSE OF FAILURE TO SUBMIT A TRANSLATION OF THE DESCRIPTION OR TO PAY THE FEE WITHIN THE PRESCRIBED TIME-LIMIT Effective date: 20240807 |
|
| REG | Reference to a national code |
Ref country code: DE Ref legal event code: R097 Ref document number: 602022005150 Country of ref document: DE |
|
| PLBE | No opposition filed within time limit |
Free format text: ORIGINAL CODE: 0009261 |
|
| STAA | Information on the status of an ep patent application or granted ep patent |
Free format text: STATUS: NO OPPOSITION FILED WITHIN TIME LIMIT |
|
| PG25 | Lapsed in a contracting state [announced via postgrant information from national office to epo] |
Ref country code: MC Free format text: LAPSE BECAUSE OF FAILURE TO SUBMIT A TRANSLATION OF THE DESCRIPTION OR TO PAY THE FEE WITHIN THE PRESCRIBED TIME-LIMIT Effective date: 20240807 |
|
| PG25 | Lapsed in a contracting state [announced via postgrant information from national office to epo] |
Ref country code: BE Free format text: LAPSE BECAUSE OF NON-PAYMENT OF DUE FEES Effective date: 20241031 Ref country code: LU Free format text: LAPSE BECAUSE OF NON-PAYMENT OF DUE FEES Effective date: 20241028 |
|
| 26N | No opposition filed |
Effective date: 20250508 |
|
| PG25 | Lapsed in a contracting state [announced via postgrant information from national office to epo] |
Ref country code: FR Free format text: LAPSE BECAUSE OF NON-PAYMENT OF DUE FEES Effective date: 20241031 |
|
| REG | Reference to a national code |
Ref country code: BE Ref legal event code: MM Effective date: 20241031 |
|
| PG25 | Lapsed in a contracting state [announced via postgrant information from national office to epo] |
Ref country code: SE Free format text: LAPSE BECAUSE OF FAILURE TO SUBMIT A TRANSLATION OF THE DESCRIPTION OR TO PAY THE FEE WITHIN THE PRESCRIBED TIME-LIMIT Effective date: 20240807 |
|
| PG25 | Lapsed in a contracting state [announced via postgrant information from national office to epo] |
Ref country code: IE Free format text: LAPSE BECAUSE OF NON-PAYMENT OF DUE FEES Effective date: 20241028 |
|
| PG25 | Lapsed in a contracting state [announced via postgrant information from national office to epo] |
Ref country code: RO Free format text: LAPSE BECAUSE OF FAILURE TO SUBMIT A TRANSLATION OF THE DESCRIPTION OR TO PAY THE FEE WITHIN THE PRESCRIBED TIME-LIMIT Effective date: 20240807 |
|
| PGFP | Annual fee paid to national office [announced via postgrant information from national office to epo] |
Ref country code: DE Payment date: 20251021 Year of fee payment: 4 |
|
| PG25 | Lapsed in a contracting state [announced via postgrant information from national office to epo] |
Ref country code: IT Free format text: LAPSE BECAUSE OF FAILURE TO SUBMIT A TRANSLATION OF THE DESCRIPTION OR TO PAY THE FEE WITHIN THE PRESCRIBED TIME-LIMIT Effective date: 20240807 |