EP3719716A1 - Système d'apprentissage machine pour classifier une zone comme carrossable - Google Patents
Système d'apprentissage machine pour classifier une zone comme carrossable Download PDFInfo
- Publication number
- EP3719716A1 EP3719716A1 EP20163985.3A EP20163985A EP3719716A1 EP 3719716 A1 EP3719716 A1 EP 3719716A1 EP 20163985 A EP20163985 A EP 20163985A EP 3719716 A1 EP3719716 A1 EP 3719716A1
- Authority
- EP
- European Patent Office
- Prior art keywords
- vehicle
- data
- zone
- subzone
- contiguous
- Prior art date
- Legal status (The legal status is an assumption and is not a legal conclusion. Google has not performed a legal analysis and makes no representation as to the accuracy of the status listed.)
- Pending
Links
Images


Classifications
-
- G—PHYSICS
- G06—COMPUTING; CALCULATING OR COUNTING
- G06N—COMPUTING ARRANGEMENTS BASED ON SPECIFIC COMPUTATIONAL MODELS
- G06N20/00—Machine learning
-
- G—PHYSICS
- G07—CHECKING-DEVICES
- G07C—TIME OR ATTENDANCE REGISTERS; REGISTERING OR INDICATING THE WORKING OF MACHINES; GENERATING RANDOM NUMBERS; VOTING OR LOTTERY APPARATUS; ARRANGEMENTS, SYSTEMS OR APPARATUS FOR CHECKING NOT PROVIDED FOR ELSEWHERE
- G07C5/00—Registering or indicating the working of vehicles
- G07C5/008—Registering or indicating the working of vehicles communicating information to a remotely located station
-
- G—PHYSICS
- G07—CHECKING-DEVICES
- G07C—TIME OR ATTENDANCE REGISTERS; REGISTERING OR INDICATING THE WORKING OF MACHINES; GENERATING RANDOM NUMBERS; VOTING OR LOTTERY APPARATUS; ARRANGEMENTS, SYSTEMS OR APPARATUS FOR CHECKING NOT PROVIDED FOR ELSEWHERE
- G07C5/00—Registering or indicating the working of vehicles
- G07C5/08—Registering or indicating performance data other than driving, working, idle, or waiting time, with or without registering driving, working, idle or waiting time
- G07C5/0841—Registering performance data
- G07C5/085—Registering performance data using electronic data carriers
-
- G—PHYSICS
- G08—SIGNALLING
- G08G—TRAFFIC CONTROL SYSTEMS
- G08G1/00—Traffic control systems for road vehicles
- G08G1/01—Detecting movement of traffic to be counted or controlled
- G08G1/0104—Measuring and analyzing of parameters relative to traffic conditions
- G08G1/0108—Measuring and analyzing of parameters relative to traffic conditions based on the source of data
- G08G1/0112—Measuring and analyzing of parameters relative to traffic conditions based on the source of data from the vehicle, e.g. floating car data [FCD]
-
- G—PHYSICS
- G08—SIGNALLING
- G08G—TRAFFIC CONTROL SYSTEMS
- G08G1/00—Traffic control systems for road vehicles
- G08G1/01—Detecting movement of traffic to be counted or controlled
- G08G1/0104—Measuring and analyzing of parameters relative to traffic conditions
- G08G1/0125—Traffic data processing
- G08G1/0129—Traffic data processing for creating historical data or processing based on historical data
-
- G—PHYSICS
- G08—SIGNALLING
- G08G—TRAFFIC CONTROL SYSTEMS
- G08G1/00—Traffic control systems for road vehicles
- G08G1/01—Detecting movement of traffic to be counted or controlled
- G08G1/0104—Measuring and analyzing of parameters relative to traffic conditions
- G08G1/0125—Traffic data processing
- G08G1/0133—Traffic data processing for classifying traffic situation
-
- G—PHYSICS
- G08—SIGNALLING
- G08G—TRAFFIC CONTROL SYSTEMS
- G08G1/00—Traffic control systems for road vehicles
- G08G1/01—Detecting movement of traffic to be counted or controlled
- G08G1/0104—Measuring and analyzing of parameters relative to traffic conditions
- G08G1/0137—Measuring and analyzing of parameters relative to traffic conditions for specific applications
- G08G1/0141—Measuring and analyzing of parameters relative to traffic conditions for specific applications for traffic information dissemination
-
- H—ELECTRICITY
- H04—ELECTRIC COMMUNICATION TECHNIQUE
- H04W—WIRELESS COMMUNICATION NETWORKS
- H04W4/00—Services specially adapted for wireless communication networks; Facilities therefor
- H04W4/30—Services specially adapted for particular environments, situations or purposes
- H04W4/38—Services specially adapted for particular environments, situations or purposes for collecting sensor information
-
- G—PHYSICS
- G01—MEASURING; TESTING
- G01S—RADIO DIRECTION-FINDING; RADIO NAVIGATION; DETERMINING DISTANCE OR VELOCITY BY USE OF RADIO WAVES; LOCATING OR PRESENCE-DETECTING BY USE OF THE REFLECTION OR RERADIATION OF RADIO WAVES; ANALOGOUS ARRANGEMENTS USING OTHER WAVES
- G01S19/00—Satellite radio beacon positioning systems; Determining position, velocity or attitude using signals transmitted by such systems
- G01S19/01—Satellite radio beacon positioning systems transmitting time-stamped messages, e.g. GPS [Global Positioning System], GLONASS [Global Orbiting Navigation Satellite System] or GALILEO
- G01S19/13—Receivers
-
- H—ELECTRICITY
- H04—ELECTRIC COMMUNICATION TECHNIQUE
- H04W—WIRELESS COMMUNICATION NETWORKS
- H04W4/00—Services specially adapted for wireless communication networks; Facilities therefor
- H04W4/30—Services specially adapted for particular environments, situations or purposes
- H04W4/40—Services specially adapted for particular environments, situations or purposes for vehicles, e.g. vehicle-to-pedestrians [V2P]
- H04W4/44—Services specially adapted for particular environments, situations or purposes for vehicles, e.g. vehicle-to-pedestrians [V2P] for communication between vehicles and infrastructures, e.g. vehicle-to-cloud [V2C] or vehicle-to-home [V2H]
Definitions
- Traffic data collection and analysis are routinely conducted by road agencies, for example, government organizations responsible for traffic management, road maintenance and/or road network planning.
- Road agencies may obtain measurements of traffic metrics, (e.g., traffic performance), from traffic data, to understand current traffic conditions at a roadway section of interest, such as a portion of a road or a traffic junction - a location where multiple roads intersect, allowing traffic to change from one road to another (e.g., intersection, roundabout, interchange).
- Traffic metrics are generally used to ascertain an existing, or to predict a future, need of changes to roadway infrastructure and/or traffic control equipment. Examples of traffic metrics include traffic volume, average vehicle speed, vehicle delay, among others.
- Modifications to a roadway network may result from traffic metrics related to traffic flow, driving behaviour, or another traffic/driver information. For example, to increase traffic flow at a heavily congested roadway section an additional lane(s) may be added, to reduce wait times at an intersection control signal timing may be modified, and to deter speeding on a portion of road a traffic calming device, (e.g., a speed bump), may be installed.
- traffic metrics related to traffic flow For example, to increase traffic flow at a heavily congested roadway section an additional lane(s) may be added, to reduce wait times at an intersection control signal timing may be modified, and to deter speeding on a portion of road a traffic calming device, (e.g., a speed bump), may be installed.
- a traffic calming device e.g., a speed bump
- a first technique includes employment of manual counters positioned near a roadway section of interest, (i.e., people observing traffic, then measuring and manually recording vehicle movement.) For instance, to collect traffic data related to interruption of traffic flow at an intersection, a person/people may time the duration each vehicle is stopped prior to entering the intersection. Such a method is manually intensive and prone to human error.
- Another technique for collecting traffic data includes use of sensing equipment.
- movement sensors e.g., pneumatic tubes, video cameras
- This technique requires the purchase or rental, installation, and potentially maintenance, of sensing equipment. Extracting traffic data from video footage necessitates image processing which is usually complex and resource intensive.
- Yet another technique for collecting traffic data includes use of a GPS tracker device installed onboard a vehicle. Traffic data collected via this technique is limited to the data collected by the particular devices, thus multiple passes through a roadway section of interest are needed to gather a sufficient amount of data for the data to be meaningful. Once collected, data from the devices must be uploaded for analysis/processing.
- a traffic analytics system comprising a processing resource, a first data store and a network interface for communicatively coupling to a communication network, the traffic analytics system configured for: defining a plurality of zones corresponding to a plurality of sample vehicle ways, each of the plurality of zones comprising a plurality of first contiguous subzones, the plurality of first contiguous subzones for each of the plurality of zones forming a plurality of second contiguous subzones, selecting vehicle data indicative of vehicle operating conditions of a plurality of corresponding vehicles, generating a plurality of features for each of the plurality of second contiguous subzones based on the vehicle data, generating training data for each of the plurality of second contiguous subzones comprising the plurality of features and defining a classifier using at least one machine learning technique with the training data, the classifier for classifying a subzone as one of a portion of a vehicle way and not a portion of a vehicle way.
- the vehicle data includes a subset of raw vehicle data or a subset of raw vehicle data and data interpolated therefrom.
- the traffic analytics system is configured for receiving from a remote second data store the subset of raw vehicle data, the second data store communicatively coupled to the communication network.
- the traffic analytics system is configured for communicating with a first data management system communicatively coupled to the communication network for receiving the subset of raw vehicle data therefrom.
- the first data management system is a managed cloud data warehouse for performing analytics on data stored therein.
- the traffic analytics system comprises a second data management system having the subset of raw vehicle data stored therein.
- the second data management system is a managed cloud data warehouse for performing analytics on data stored therein.
- the traffic analytics system is configured for storing the subset of raw vehicle data in the first data store.
- the classifier classifies a subzone of a type of vehicle way indicative of one of the types of vehicle ways of the plurality of sample vehicle ways.
- each zone of the plurality of zones defines an area encompassing a corresponding sample vehicle way.
- defining the plurality of zones comprises: obtaining geographic coordinate data indicating a location of a reference point proximate the corresponding sample vehicle way, defining a reference area relative to the location of the reference point for encompassing the corresponding sample vehicle way and partitioning the reference area into the plurality of first contiguous subzones.
- partitioning the reference area comprises partitioning all portions of the reference area into the plurality of first contiguous subzones.
- the reference area is defined at a same relative location to the reference point proximate the corresponding vehicle way. In another embodiment the reference area is defined at a distance substantially 25m radially from the reference point.
- each contiguous subzone of the plurality of second contiguous subzones is defined by latitude and longitude pairs.
- partitioning the reference area into the plurality of first contiguous subzones comprises subdividing the reference area into a grid of latitude and longitude lines. In another embodiment partitioning the reference area into the plurality of first contiguous subzones comprises subdividing the reference area into the plurality of first contiguous subzones according to a hierarchical geospatial indexing system.
- subdividing the reference area into the plurality of first contiguous subzones according to a hierarchical geospatial indexing system comprises subdividing the reference area into first contiguous subzones according to a Geohash indexing system.
- subdividing the reference area into the plurality of first contiguous subzones according to a Geohash indexing system comprises subdividing the reference area into the plurality of first contiguous subzones according to the Geohash indexing system having a Geohash precision of substantially 9.
- subdividing the reference area into the first contiguous subzones according to a hierarchical geospatial indexing system comprises subdividing the reference area into first contiguous subzones according to a H3 hierarchical geospatial indexing system.
- partitioning the reference area into the plurality of first contiguous subzones comprises defining a subzone encompassing the reference point and building a grid of contiguous subzones therefrom until all portions of the reference area are partitioned by the grid of the plurality of first contiguous subzones.
- generating a plurality of features based on vehicle data indicative of vehicle operating conditions for a plurality of corresponding vehicles comprises generating the plurality of features based on vehicle data indicative of at least one of position, speed, and ignition state of a vehicle, the ignition state indicating a state of one of ON or OFF.
- generating a plurality of features based on vehicle data comprises generating a plurality of features based on date and time data indicative of a date and time vehicle operating conditions is logged.
- the vehicle data comprises raw vehicle data corresponding to a location within the plurality of zones. In another embodiment the vehicle data comprises raw vehicle data corresponding to a position within at least one traffic zone encompassing at least one zone of the plurality of zones. In yet another embodiment the at least one traffic zone encompasses each zone of the plurality of zones.
- data interpolated from the subset of raw vehicle data is dependent on the dimensions of each of the plurality of second contiguous subzones.
- the traffic analytics system is configured for filtering data indicative at least one of an outlier or duplicate value from the vehicle data.
- generating the plurality of features for each of the plurality of second contiguous subzones, for at least one second contiguous subzone comprises generating subzone-related features from a first subset of vehicle data corresponding to a location within the at least one second contiguous subzone.
- generating subzone-related features from a first subset of vehicle data corresponding to a location within the at least one second contiguous subzone comprises generating subzone related features selected from the group of: minimum vehicle speed, maximum vehicle speed, average vehicle speed, median vehicle speed, standard deviation of vehicle speed, minimum ignition, maximum ignition, total number of ignitions on, total number of ignitions off, average number of ignitions, ignition ratio, minimum number of vehicle visits/day, maximum number of vehicle visits/day, average number of vehicle visits/day, median number of vehicle visits/day, standard deviation of number of vehicle visits/day, minimum unique number of vehicle visits/day, maximum unique number of vehicle visits/day, median unique number of vehicle visits/day, standard deviation of unique number of vehicle visits/day, average unique number of vehicle visits/day, total number of vehicle visits, total number of unique vehicle visits, and average number of visits/vehicle.
- generating the plurality of features for each of the plurality of second contiguous subzones, for at least one second contiguous subzone comprises generating subzone-related features based on the first subset of vehicle data and a second subset of vehicle data including vehicle data for a same vehicle temporally subsequent thereto.
- generating the subzone-related features for each of the plurality of second contiguous subzones, for at least one second contiguous subzone comprises generating subzone related features selected from the group of: average time to park, minimum time to park, maximum time to park, median time to park, and standard deviation of time to park.
- generating the plurality of features for each of the plurality of second contiguous subzones, for at least one second contiguous subzone comprises generating subzone-related features based on the first subset of vehicle data and a second subset of vehicle data further including vehicle data for a same vehicle temporally preceding and subsequent thereto.
- generating the subzone-related features for each of the plurality of second contiguous subzones, for at least one second contiguous subzone comprises generating subzone related features selected from the group of: average dwell time, minimum dwell time, maximum dwell time, median dwell time, and standard deviation of dwell time.
- generating the plurality of features for each of the plurality of second contiguous subzones, for at least one second contiguous subzone comprises generating generating zone-related features based on a third subset of vehicle data corresponding to a position within a corresponding zone or from a portion of the subzone-related features.
- generating the zone-related features comprises generating the zone-related features selected from the group of: zone minimum ignition off, zone maximum ignition off, zone average vehicle speed, zone maximum vehicle speed, zone minimum vehicle speed, zone average number of unique visits/day, zone minimum number of unique visits/day, zone maximum number of unique visits/day, zone average median number of unique visits/day, and zone total average number of unique visits/day.
- generating the zone-related features are comprises generating the zone-related features based on the portion of the subzone-related features and selected from the group of: zone average time to park, zone maximum time to park, zone minimum time to park, zone maximum dwell time, zone minimum dwell time, zone median dwell time, zone average dwell time, zone minimum number of unique visits, zone average number of unique visits, zone maximum number of unique visits, zone average total number of visits, zone maximum total number of visits, and zone minimum total number of visits.
- generating the zone-related features comprises generating the zone-related features are generated based on the third subset of vehicle data instances corresponding to a position within the corresponding zone and selected from the group of: zone total number of visits and zone total number of unique visits.
- generating the plurality of features includes generating subzone-zone-related features from a relationship of a portion of the plurality of subzone-related features to a portion of the zone-related features of a corresponding zone.
- generating subzone-zone-related features comprises generating subzone-zone-related features selected from the group of: minimum vehicle speed ratio, average vehicle speed ratio, maximum vehicle speed ratio, minimum ignition off ratio, maximum ignition off ratio, maximum dwell time ratio, minimum dwell time ratio, average median dwell time ratio, average dwell time ratio, minimum time to park ratio, average time to park ratio, maximum time to park ratio, minimum number of unique vehicle visits ratio, maximum number of unique vehicle visits ratio, average number of unique vehicle visits ratio, total number of vehicle unique visits ratio, minimum unique number of vehicle visits/day ratio, maximum unique number of vehicle visits/day ratio, average unique number of vehicle visits/day ratio, total unique number of vehicle visits/day ratio, average median unique number of vehicle visits/day ratio, minimum total number of vehicle visits ratio, maximum total number of vehicle visits ratio, average total number of vehicle visits ratio, and total number of vehicle visits ratio.
- the traffic analytics system is configured for, for each first contiguous subzone of the plurality of first contiguous subzones of the plurality of zones, for obtaining spatial relationship data for each thereof to a corresponding zone and generating at least one feature from the spatial relationship data.
- the traffic analytics system is configured for, for each first contiguous subzone of the plurality of first contiguous subzones of each of the plurality of zones, obtaining spatial relationship data for each thereof to the plurality of first contiguous subzones and generating at least one feature from the spatial relationship data.
- the spatial relationship data is indicative of the distance between the first contiguous subzone and a centre point of a corresponding zone. In another embodiment the spatial relationship data is indicative of the distance between a centre point of the first contiguous subzone and the centre point of the corresponding zone. In yet another embodiment the spatial relationship data is indicative of the number of adjacent first contiguous subzones of the plurality of first contiguous subzones to the first contiguous subzone. In an embodiment the number of adjacent first contiguous subzones of the plurality of first contiguous subzones to the first contiguous subzone is the number of neighbours of a Geohash.
- each training data for at least one second contiguous subzone of the plurality of second contiguous subzones comprises an indication that the at least one second contiguous subzone is one of a vehicle way class or a not-vehicle way class.
- the traffic analytics system is configured for, for two or more zones of the plurality of zones having one or more common first contiguous subzones, associating the one or more common first contiguous subzones with a unique zone of the two or more zones.
- associating each of the one or more common first contiguous subzones with a unique zone comprises calculating the distance between each first contiguous subzone of the one or more common first contiguous subzones and a location of a centre point of the two or more zones and assigning the one or more common first contiguous subzones to the zone of which the distance is shortest.
- the same relative location to the reference point is defined by classifier data associated with the classifier.
- first contiguous subzone dimensions are defined by the classifier data associated with the classifier.
- Geohash precision is defined by classifier data associated with the classifier.
- the spatial relationship data is indicative of the number of adjacent first contiguous subzones to a subzone having vehicle data corresponding to a location therein. In another embodiment the spatial relationship data is indicative of the number of neighbours of a Geohash having vehicle data corresponding to a location therein.
- Telematics is a method of monitoring a vehicle using an onboard monitoring device for gathering and transmitting vehicle operation information.
- a vehicle may include a car, truck, recreational vehicle, heavy equipment, tractor, snowmobile or other transportation asset.
- a monitoring device may detect environmental operating conditions associated with a vehicle, for example, outside temperature, attachment status of an attached trailer, and temperature inside an attached refrigeration trailer.
- a monitoring device may also detect operating conditions of an associated vehicle, such as position, (e.g., geographic coordinates), speed, and acceleration, among others.
- raw vehicle data is transmitted from an onboard monitoring device to a remote subsystem, (e.g., server).
- Raw vehicle data may include information indicating the identity of the onboard monitoring device (e.g., device identifier, device ID) and/or the identity of the associated vehicle the onboard monitoring device is aboard.
- Specific and non-limiting examples of raw vehicle data includes device ID data, position data, speed data, ignition state data, (e.g. indicates whether vehicle ignition is ON or OFF), and date and time data indicative of a date and time vehicle operating conditions were logged by the monitoring device.
- Raw vehicle data transmitted and collected over a period of time forms historical vehicle data which may be stored by the remote subsystem for future analysis of a single vehicle or fleet performance.
- a single fleet may comprise many vehicles, and thus large volumes of raw vehicle data (e.g., terabytes, petabytes, exabytes...) may be transmitted to, and stored by, a remote subsystem.
- Telematics systems are discussed in further detail below with reference to FIGs. 1A , 1B , 1C and FIG. 2 .
- Processing historical vehicle data corresponding to positions within a roadway section of interest may provide an alternative technique for obtaining traffic data and/or traffic metrics that avoid some of the drawbacks of existing techniques described in the foregoing.
- a method for obtaining traffic data and/or traffic metrics from historical vehicle data may include obtaining a location (e.g., boundary coordinates) of a roadway section of interest.
- a road agency may store geographic data describing a roadway system comprising the roadway section of interest on a publicly accessible server, such as a server accessible via the Internet.
- the geographic data may be in the form of a geospatial file (e.g., shape file (.shp), GeoJSON (.geojson)), or other file format, from which geographical coordinates of boundaries delineating roads forming the roadway system may be extracted.
- a geospatial file including boundary coordinates of the roadway section of interest is accessed, and latitude, longitude (Lat/Long) coordinates of a plurality of points defining the boundaries thereof are extracted from the geospatial file.
- a plurality of raw vehicle data instances corresponding to a position within boundaries of the roadway section of interest are selected from the historical vehicle data and processed for providing traffic data and/or traffic metrics relating to the roadway section of interest.
- obtaining traffic data and/or traffic metrics for a roadway section of interest from historical vehicle data includes obtaining and processing vehicle speed data for determining an average speed of vehicles traversing a roadway section of interest.
- the roadway section of interest is in the form of a portion of a road (i.e., a road portion.)
- the location of the road portion is determined. For instance, geographical coordinates of boundaries of the road portion are extracted, for example, from a shape file (.shp) or a GeoJSON file (.geojson).
- historical vehicle data comprises raw vehicle data instances corresponding to a plurality of vehicles which may be indicative of device ID, vehicle position, speed, and date & time the vehicle position and speed were logged.
- a subset of raw vehicle data instances corresponding to a location within the boundaries of the road portion are selected from historical vehicle data and a cumulative speed of all vehicles that have traversed the road portion are divided by the number thereof to provide an average speed traffic metric.
- This is only one method of obtaining traffic data and/or traffic metrics from historical vehicle data and is not intended to limit embodiments to this example.
- GISs geographic information systems
- web mapping services e.g., Google Maps, developed by Google® of Mountain View, California, USA
- geospatial information describing locations e.g., boundary information
- high volumes of different data types are collected via a variety of data collection techniques. This data is then processed to provide geospatial information.
- Some exemplary data collection techniques include aerial and satellite image capture, video recording, Light Detection and Ranging (LiDAR), road surveying, and crowdsourcing.
- Some web mapping services may provide geospatial roadway-related information, such as Lat/Long coordinates of road boundaries, via interactive maps.
- geospatial roadway-related information such as Lat/Long coordinates of road boundaries
- Such functionality is not designed to enable easy extraction of boundary information in large quantities and/or in a suitable machine-readable data format.
- roadway boundary information may be available in a suitable machine-readable data format a GIS, for example, however, at a cost.
- Described herein are alternative techniques for defining locations of roadway sections that may avoid some issues of known techniques described in the foregoing.
- related traffic data and/or traffic metrics related thereto may be determined by processing raw vehicle data instances corresponding to positions within a roadway section of interest, as described above.
- a vehicle way may include an area used by vehicles for movement and/or parking.
- vehicle ways include traffic-designated areas, such as by road agencies, for channeling traffic flow (e.g., roads, traffic junctions), and for parking (e.g., street parking spaces, commercial parking lots).
- Traffic-designated areas such as by road agencies, for channeling traffic flow (e.g., roads, traffic junctions), and for parking (e.g., street parking spaces, commercial parking lots).
- Vehicle ways may also include areas that are not traffic-designated areas. For instance, areas that have not been created and/or maintained by a road agency or commercial entity for vehicle use, nonetheless are repeatedly used thereby.
- a vehicle way includes an ad hoc vehicle way.
- An example of an ad hoc vehicle way includes a beaten path created by frequent flow of vehicles for accessing a natural attraction, such as a lake, river, or forested area, for which no access road was available.
- Another example of an ad hoc vehicle way includes a portion of a field frequently used to accommodate overflow vehicles of a nearby parking lot.
- FIGs. 6Ai-6Avi Illustrated in FIGs. 6Ai-6Avi are simplified diagrams of various exemplary types of vehicle ways, including: circular traffic junction 602, (i.e., roundabout) having circular road segment 604 and road segments 606, 607, 608 and 609 for channeling vehicles therethrough; three way traffic junction 612 (i.e., intersection) having road segments 614, 616, and 617 for channeling vehicles therethrough; traffic junction 618 (i.e., highway off-ramp) having road segments 619, 620, and 622 for channeling vehicles therethrough; parking lot 624, having parking area 626 and entry/exit 629 for channelling vehicles in and out thereof; road portion 650 having opposing lanes 643a and 643b; and on-street parking space 644.
- the exemplary vehicle ways of FIGs. 6Ai-6Avi are provided for example purposes only and embodiments are not intended to be limited to the examples described herein.
- a defined vehicle way may be described by any data format provided the data indicates the location (e.g., the unique location of the vehicle way on the Earth's surface) occupied thereby.
- a vehicle way may be defined by a plurality of points defining the boundaries of the vehicle way.
- the geographic coordinates of the plurality of points may be, for example, stored in a text file, such as a comma-separated values (.csv) file.
- boundaries may be described in a geospatial file, for instance a shape file (.shp) or a GeoJSON file (.geojson), from which geographic coordinates of vehicle way boundaries may be obtained.
- Geohash is a known public domain hierarchical geospatial indexing system which uses a Z-order curve to hierarchically subdivide the latitude/longitude grid into progressively smaller cells of grid shape.
- a Geohash string indicates a unique geographical area (e.g., cell).
- a vehicle way may be described by data indicative of a plurality of Geohash strings indicating the Geohash cells occupied by the vehicle way.
- a vehicle way may be described in numerous data formats and embodiments are not intended to be limited to examples described herein.
- Some embodiments described herein relate to techniques for defining a vehicle way comprising processing data indicative of vehicle operation conditions of a plurality of vehicles that have travelled within a known area, that is, an area of which the location thereof is defined. Processing such data may provide an indication as to whether the known area is a portion of the vehicle way. In other words, processing such data may provide an indication as to whether the vehicle way occupies the known area.
- Processing data may also include processing other data indicative of vehicle operation conditions of another plurality of vehicles that have travelled within other known areas proximate the known area. Furthermore, processing data may also include processing spatial relationship data of the known area to other known areas proximate thereto.
- Some embodiments described herein relate to defining a vehicle way by defining a relationship between vehicle operating conditions of vehicles that have operated proximate known areas and the likelihood the known areas are portions of a vehicle way.
- Some embodiments described herein relate to techniques for defining a vehicle way using machine learning techniques using historical vehicle data, (e.g., raw vehicle data), and/or data derived therefrom to define the location of the vehicle way.
- historical vehicle data e.g., raw vehicle data
- a traffic analytics system may be configured to access historical vehicle data associated with known areas and define one or more classification models that are related to operating conditions of corresponding vehicles, and then operate in accordance with the one or more models.
- each such classification model may receive as input, data (i.e., features), derived from historical vehicle data related to vehicles that have operated within a known area, within a plurality of known areas, and a spatial relationship of the known area to the other known areas, and output an indication the known area is a portion of a vehicle way.
- a vehicle way includes areas frequently used and/or employed by vehicles.
- the phrases 'frequently used' and 'repeatedly employed' are relative to the time period of logging of the historical vehicle data.
- data i.e., features
- derived from historical vehicle data related to vehicles that have travelled within a known area are input to a classification model for use thereof.
- the output of the classifier may not provide meaningful data when applied for defining the vehicle way of interest.
- Network configuration 100 includes telematics system 102, traffic analytics system 104, remote system 106, and communication network 110.
- Communication network 110 may be communicatively coupled to telematics system 102, traffic analytics system 104, and remote system 106, enabling communication therebetween.
- traffic analytics system 104 may communicate with telematics system 102, and remote system 106 for receiving historical vehicle data or a portion thereof via communication network 110.
- FIG. 1B is a simplified diagram of network configuration 100 illustrating communication path 112 between traffic analytics system 104 and telematics system 102 and communication path 113 between traffic analytics system 104 and remote system 106.
- FIG. 1C is a simplified diagram of another exemplary network configuration 101 with which some embodiments may operate.
- Network configuration 101 includes telematics system 102, traffic analytics system 104, remote system 106, data management system 108 and communication network 110.
- Communication network 110 may be communicatively coupled to telematics system 102, traffic analytics system 104, remote system 106, and data management system 108, enabling communication therebetween.
- telematics system 102 may transmit raw vehicle data and/or historical vehicle data to data management system 108 for the storage thereof, as illustrated by communication path 114.
- Traffic analytics system 104 may be configured for communicating with data management system 108, for receiving historical vehicle data or a portion thereof via communication network 110, as illustrated by communication path 116. Traffic analytics system 104 may also be configured for communicating with remote system 106.
- Remote system 106 may be another telematics system from which traffic analytics system 104 receives historical vehicle data. Alternatively, remote system 106 may store historical vehicle data collected by one or more telematics systems and/or similar vehicle monitoring systems.
- remote system 106 may provide external data to traffic analytics system 104.
- remote system 106 is a map service provider that provides geospatial information regarding roadway systems, traffic control equipment, and/or jurisdictional boundary information, among other geospatial information to traffic analytics system 104.
- remote system 106 may be a customer system to which traffic analytics system 104 transmits output data in the form of raw data, a web page, or in another data format.
- Communication network 110 may include one or more computing systems and may be any suitable combination of networks or portions thereof to facilitate communication between network components. Some examples of networks include, Wide Area Networks (WANs), Local Area Networks (LANs), Wireless Wide Area Networks (WWANs), data networks, cellular networks, voice networks, among other networks, which may be wired and/or wireless. Communication network 110 may operate according to one or more communication protocols, such as, General Packet Radio Service (GPRS), Universal Mobile Telecommunications Service (UMTS), GSM, Enhanced Data Rates for GSM Evolution (EDGE), LTE, CDMA, LPWAN, Wi-Fi, Bluetooth, Ethernet, HTTP/S, TCP, and CoAP/DTLS, or other suitable protocol. Communication network 110 may take other forms as well.
- GPRS General Packet Radio Service
- UMTS Universal Mobile Telecommunications Service
- GSM Global System for Mobile Communications
- EDGE Enhanced Data Rates for GSM Evolution
- LTE Long Term Evolution
- CDMA Code Division Multiple Access
- LPWAN Long Term Evolution
- Telematics system 102 comprises telematics subsystem 210 (e.g., server) having a first network interface 206 and onboard monitoring devices 202, 203, and 204 communicatively coupled therewith via communication network 207.
- telematics subsystem 210 e.g., server
- Communication network 207 may include one or more computing systems and may be any suitable combination of networks or portions thereof to facilitate communication between network components. Some examples of networks include, Wide Area Networks (WANs), Local Area Networks (LANs), Wireless Wide Area Networks (WWANs), data networks, cellular networks, voice networks, among other networks, which may be wired and/or wireless. Communication network 207 may operate according to one or more communication protocols, such as, General Packet Radio Service (GPRS), Universal Mobile Telecommunications Service (UMTS), GSM, Enhanced Data Rates for GSM Evolution (EDGE), LTE, CDMA, LPWAN, Wi-Fi, Bluetooth, Ethernet, HTTP/S, TCP, and CoAP/DTLS, or other suitable protocol. Communication network 207 may take other forms as well.
- GPRS General Packet Radio Service
- UMTS Universal Mobile Telecommunications Service
- GSM Global System for Mobile Communications
- EDGE Enhanced Data Rates for GSM Evolution
- LTE Long Term Evolution
- CDMA Code Division Multiple Access
- LPWAN Long
- Telematics system 102 may comprise another network interface 208 for communicatively coupling to another communication network, such as communication network 110.
- Telematics subsystem 210 may comprise a plurality of servers, data stores, and other devices, configured in a centralized, distributed or other arrangement.
- a vehicle may include a car, truck, recreational vehicle, heavy equipment, tractor, snowmobile, or other transportation asset.
- Onboard monitoring devices 202-204 may transmit raw vehicle data associated with vehicles 212-214. Raw vehicle data transmitted and collected over a period of time forms historical vehicle data which may be stored by remote subsystem 210.
- a monitoring device is associated with a particular vehicle.
- each thereof may be assigned a unique device ID that is uniquely associated with a vehicle information number (VIN) of vehicles 212-214, respectively.
- VIN vehicle information number
- This enables an instance of received raw vehicle data to be associated with a particular vehicle.
- vehicle-specific raw vehicle data may be discernable among other raw vehicle data in the historical vehicle data.
- a telematics system may comprise many vehicles, such as hundreds, thousands and tens of thousands or more.
- huge volumes of raw vehicle data may be received and stored by remote telematics subsystem 210.
- monitoring devices comprise sensing modules configured for sensing and/or measuring a physical property that may indicate an operating condition of a vehicle.
- sensing modules may sense and/or measure a vehicle's position, (e.g., GPS coordinates), speed, direction, rates of acceleration or deceleration, for instance, along the x-axis, y-axis, and/or z-axis, altitude, orientation, movement in the x, y, and/or z direction, ignition state, transmission and engine performance, among others.
- Monitoring device 202 may comprise a sensing module for determining vehicle position.
- the sensing module may utilize Global Positioning System (GPS) technology (e.g., GPS receiver) for determining the geographic position (Lat/Long coordinates) of vehicle 212.
- GPS Global Positioning System
- the sensing module utilizes another a global navigation satellite system (GNSS) technology, such as, GLONASS or BeiDou.
- GNSS global navigation satellite system
- the sensing module may further utilize another kind of technology for determining geographic position.
- sensing module may provide other vehicle operating information, such as speed.
- vehicle position information may be provided according to another geographic coordinate system, such as, Universal Transverse Mercator, Military Grid Reference System, or United States National Grid.
- a vehicle may include various control, monitoring and/or sensor modules for detecting vehicle operating conditions. Some specific and non-limiting examples include, an engine control unit (ECU), a suspension and stability control module, a headlamp control module, a windscreen wiper control module, an anti-lock braking system module, a transmission control module, and a braking module.
- ECU engine control unit
- a vehicle may have any combination of control, monitoring and/or sensor modules.
- a vehicle may include a data/communication bus accessible for monitoring vehicle operating information, provided by one or more vehicle control, monitoring and/or sensor modules.
- a vehicle data/communication bus may operate according to an established data bus protocol, such as the Controller Area Network bus (CAN-bus) protocol that is widely used in the automotive industry for implementing a distributed communications network.
- CAN-bus Controller Area Network bus
- Specific and non-limiting examples of vehicle operation information provided by vehicle monitoring and/or sensor modules include, ignition state, fuel tank level, intake air temp, and engine RPM among others.
- Monitoring device 202 may comprise a monitoring module operable to communicate with a data/communication bus of vehicle 212.
- Monitoring module may communicate via a direct connection, such as, electrically coupling, with a data/communication bus of vehicle 212 via a vehicle communication port, (e.g., diagnostic port/communication bus, OBDII port).
- vehicle communication port e.g., diagnostic port/communication bus, OBDII port
- monitoring module may comprise a wireless communication interface for communicating with a wireless interface of the data/communication bus of vehicle 212.
- a monitoring module may communicate with other external devices/systems that detect operating conditions of the vehicle.
- Monitoring device 202 may be configured to wirelessly communicate with telematics subsystem 210 via a wireless communication module. In some embodiments, monitoring device 202 may directly communicate with one or more networks outside vehicle 212 to transmit data to telematics subsystem 210.
- a person of ordinary skill will recognize that functionality of some modules may be implemented in one or more devices and/or that functionality of some modules may be integrated into the same device.
- Monitoring devices 202-204 may transmit raw vehicle data, indicative of vehicle operation information collected thereby, to telematics subsystem 210.
- the raw vehicle data may be transmitted at predetermined time intervals, (e.g. heartbeat), intermittently, and/or according to other predefined conditions.
- Raw vehicle data transmitted from monitoring devices 202-204 may include information indicative of device ID, position, speed, ignition state, and date and time operating conditions are logged, for instance, in an onboard data store.
- raw vehicle data may comprise data indicative of numerous other vehicle operating conditions.
- Raw vehicle data may be transmitted from a monitoring device when a vehicle is moving, stationary, and during both ON and OFF ignition states.
- raw vehicle data received and stored by a subsystem over a period of time forms historical vehicle data.
- historical vehicle data may be stored by telematics subsystem 210 in a database, such as database 209, as shown.
- a period of time may include, for example, 3 months, 6 months, 12 months, or another duration of time.
- FIG. 3A and FIG. 3B Illustrated in FIG. 3A and FIG. 3B there are two exemplary traffic analytics systems 104 including traffic analytics system 104a and traffic analytics system 104b, as shown respectively.
- FIG. 3A is a simplified block diagram of exemplary traffic analytics system 104a comprising a processing resource 302, data store 304, and network interface 306.
- processing resource 302 and data store 304 may be communicatively coupled by a system communication bus, a wired network, a wireless network, or other connection mechanism and arranged to carry out various operations described herein.
- two or more of these components may be integrated together in whole or in part.
- Network interface 306 may be interoperable with communication network 110 and may be configured to receive data from various network components of the network configuration 100, 101 such as telematics system 102, remote system 106, data management system 108, and possibly other network components. Traffic analytics system 104a, 104b may communicate with one or more of these network components for obtaining historical vehicle data, or portions thereof. For instance, once received, data store 304 may store subsets of raw vehicle data in a database, such as database 309.
- traffic analytics system 104a is configured to intemperate with data management system 108 for obtaining historical vehicle data and/or a portion thereof.
- data management system 108 may manage and store large volumes (e.g., big data) and multiple types of data.
- Data management system 108 may comprise a relational database, for storing historical vehicle data, or a portion thereof, collected by one or more telematics or vehicle monitoring systems.
- Data management system 108 may include a web service that enables interactive analysis of large datasets stored in a remote data store.
- Traffic analytics system 104a may be configured to interoperate with such a data management system for obtaining raw vehicle data from historical vehicle data stored therein and managed thereby.
- An example of such a data management system is a managed cloud data warehouse for performing analytics on data stored therein, such as BigQueryTM, available from Google® of Mountain View, California, USA.
- FIG. 3B is a simplified block diagram of second exemplary traffic analytics system 104b comprising processing resource 302, data store 304, data management system 305 and network interface 306.
- processing resource 302, data store 304, and data management system 305 may be communicatively coupled by a system communication bus, a wired network, a wireless network, or other connection mechanism and arranged to carry out various operations described herein.
- two or more of these components may be integrated together in whole or in part.
- Data management system 305 may comprise a data store including database for storing historical vehicle data or a portion thereof.
- data management system 305 stores and manages large volumes (e.g., big data) and multiple types of data.
- data management system 305 may comprise a relational database, for storing historical vehicle data collected by one or more telematics or vehicle monitoring systems, or a portion thereof.
- database 309 of data management system 305 stores subsets of raw vehicle data from historical vehicle data for processing by analytics system 104b.
- data management system 305 may include and/or access a web service that enables interactive analysis of large datasets stored in a remote data store.
- An example of such a data management system is a managed cloud data warehouse for performing analytics on data stored therein, such as BigQuery.
- exemplary traffic analytics system 104b receives and stores historical vehicle data in data management system 305 and operates on subsets of historical vehicle data in accordance with operations described herein.
- Processing resource 302 may include one or more processors and/or controllers, which may take the form of a general or a special purpose processor or controller.
- processing resource 302 may be, or include, microprocessors, microcontrollers, application specific integrated circuits, digital signal processors, and/or other data processing devices.
- Processing resource 302 may be a single device or distributed over a network.
- Data store 304 may be or include one or more non-transitory computer-readable storage media, such as optical, magnetic, organic, or flash memory, among other data storage devices and may take any form of computer readable storage media. Data store 304 may be a single device or may be distributed over a network.
- Processing resource 302 may be configured to store, access, and execute computer-readable program instructions stored in data store 304, to perform the operations of traffic analytics system 104a, 104b described herein.
- processing resource 302 may be configured to receive historical vehicle data and may execute a classification model for defining a vehicle way. Other functions are described below.
- Traffic analytics system 104a, 104b may be configured to access, receive, store, analyze and process raw vehicle data for defining a classification model and/or executing a classification model. For example, traffic analytics system 104a, 104b may select and process raw vehicle data of a plurality of vehicles corresponding to a known area, for determining whether the known area is likely to be a portion of a vehicle way. Other examples and corresponding operations are also possible.
- traffic analytics system 104a, 104b may include and/or communicate with a user interface.
- the user interface may be located remote from traffic analytics system 104a, 104b.
- traffic analytics system 104a, 104b may communicate with a user interface via network interface 306.
- Other examples are also possible.
- traffic analytics system 104a, 104b is shown as a single system, however, it may include multiple computing systems, such as servers, storage devices, and other distributed resources, configured to perform operations/processes described herein. Operations and processes performed by traffic analytics system 104a, 104b described herein may be performed by another similarly configured and arranged system.
- traffic analytics system 104a, 104b is configured to obtain, store and process historical vehicle data.
- traffic analytics system 104a, 104b obtains first historical vehicle data 404 from telematics system 102 and stores it in database 309.
- FIG. 4A is a conceptual diagram of database 309.
- traffic analytics system 104a, 104b organizes first historical vehicle data 404 by vehicle, via associated device ID.
- datasets 412-414 of database 309 comprise raw vehicle data indicative of vehicle operation information of vehicles 212-214, respectively.
- FIG. 4B Shown in FIG. 4B is a conceptual diagram of dataset 412.
- each row thereof represents a first raw vehicle data instance 406 indicative of vehicle operation information collected by monitoring device 202 at different points in time.
- First raw vehicle data instances 406 of dataset 412 are organized sequentially in time, from DT0 to DT5.
- a first raw vehicle data instance 406 includes device ID data, speed data, position data, (e.g., LAT/LONG), ignition state data, and date and time data, (e.g., timestamp), as shown.
- Vehicle-position data points 420 represents a position of vehicle 212 at different points in time, DT0-DT5. As shown, the position of vehicle 212 changes position at each temporally subsequent point in time.
- database 309 comprising first historical vehicle data 404 is described as organized into vehicle-specific datasets 412-414.
- vehicle-specific datasets 412-414 One of ordinary skill appreciates that historical vehicle data may be organized in numerous manners.
- An intelligent telematics system includes aspects of a telematics system and a traffic analytics system, such as, telematics system 102 and traffic analytics system 104a, 104b.
- FIG. 5A is a simplified diagram of an alternative embodiment with which some embodiments may operate.
- intelligent telematics system 500a comprising onboard monitoring devices 202, 203, and 204, telematics subsystem 210 (e.g., server), traffic analytics system 104a, communicatively coupled via communication network 207.
- Intelligent telematics system 500a may also include network interface 506 compatible for interfacing with a communication network for communicating with other network components.
- network interface 506 may be interoperable with communication network 110 and may be configured to receive data from various network components of the network configuration 100, 101 such as remote system 106.
- monitoring devices 202-204 may be configured to wirelessly communicate with telematics subsystem 210 via a wireless communication module. In some embodiments, monitoring devices 202-204 may directly communicate with one or more networks outside respective vehicles to transmit data to telematics subsystem 210.
- monitoring devices 202-204 may directly communicate with one or more networks outside respective vehicles to transmit data to telematics subsystem 210.
- functionality of some modules may be implemented in one or more devices and/or that functionality of some modules may be integrated into the same device.
- Monitoring devices 202-204 may transmit raw vehicle data, indicative of vehicle operation information collected thereby, to telematics subsystem 210, as represented by communication path 510.
- raw vehicle data received and stored by telematics subsystem 210 over a period of time forms historical vehicle data.
- historical vehicle data may be stored by telematics subsystem 210 in database 209.
- a period of time may include, for example, 3 months, 6 months, 12 months, or another duration of time.
- subsets of raw vehicle data selected from historical vehicle data stored in database 209 may be stored in another database, for instance, database 309 for processing by traffic analytics system 104a.
- raw vehicle data is transmitted by telematics subsystem 210 and received by traffic analytics system 104a via communication path 512, as shown.
- FIG. 5B is a simplified diagram of another alternative embodiment with which some embodiments may operate. Shown in FIG. 5B is intelligent telematics system 500b comprising onboard monitoring devices 202, 203, and 204 and traffic analytics system 104b, communicatively coupled therewith via communication network 207.
- intelligent telematics system 500b comprising onboard monitoring devices 202, 203, and 204 and traffic analytics system 104b, communicatively coupled therewith via communication network 207.
- Intelligent telematics system 500b may also include network interface 506 compatible for interfacing with a communication network for communicating with other network components.
- network interface 506 may be interoperable with communication network 110 and may be configured to receive data from various network components of the network configuration 100, 101, such as remote system 106.
- monitoring devices 202-204 may be configured to wirelessly communicate with traffic analytics system 104b via a wireless communication module. In some embodiments, monitoring devices 202-204 may directly communicate with one or more networks outside respective vehicles to transmit data to traffic analytics system 104b.
- monitoring devices 202-204 may directly communicate with one or more networks outside respective vehicles to transmit data to traffic analytics system 104b.
- functionality of some modules may be implemented in one or more devices and/or that functionality of some modules may be integrated into the same device.
- Monitoring devices 202-204 may transmit raw vehicle data, indicative of vehicle operation information collected thereby, to traffic analytics system 104b via communication path 514, as shown.
- raw vehicle data received and stored by traffic analytics system 104b over a period of time forms historical vehicle data.
- historical vehicle data may be stored by traffic analytics system 104b in database 209 in data management system 305.
- a period of time may include, for example, 3 months, 6 months, 12 months, or another duration of time.
- subsets of raw vehicle data selected from historical vehicle data stored in database 209 may be stored in another database, for instance, database 309 for processing by traffic analytics system 104b.
- raw vehicle data is transmitted by telematics subsystem 210 and received by traffic analytics system 104a.
- Traffic analytics system 104b may be configured to perform operations of telematics system 201 as described herein.
- intelligent telematics system 500a, 500b may be configured to include and/or communicate with a user interface.
- the user interface may be located remote therefrom.
- intelligent telematics system 500a, 500b may communicate with a user interface via network interface 506.
- network interface 506. Other examples are also possible.
- a classifier defining a relationship between operation of a plurality of vehicles having operated in a known area and a probability the known area is a portion of a vehicle way may be defined by processing corresponding historical vehicle data. For example, such processing may provide features (e.g., data indicative of variables/attributes, or measurements of properties) of the known area.
- a machine learning algorithm may be trained with training data comprising features to recognize patterns therein and generalize a relationship between the features and an outcome that the known area is occupied by the vehicle way.
- FIG. 7 Shown in FIG. 7 is a flow diagram of a process 700 for defining a classifier for use in defining a vehicle way according to some embodiments.
- a classifier is for providing an indication that a known area is, or is not, a portion of a vehicle way.
- a classifier may provide as output a likelihood (e.g., probability) a known area is a portion of a vehicle way.
- a classifier may output an indication (e.g., binary value) that a known area is, or is not, a portion of a vehicle way.
- Process 700 is described below as being carried out by traffic analytics system 104a. Alternatively, process 700 may be carried out by telematics-analytic system 104b, intelligent telematics system 500a, 500b, another system, a combination of other systems, subsystems, devices or other suitable means provided the operations described herein are performed. Process 700 may be automated, semi-automated and some blocks thereof may be manually performed.
- a classifier may be defined according to a type and/or subtype of vehicle way that is to be defined using the classifier.
- types of vehicle ways include, traffic junctions, road segments, parking lots, and ad hoc vehicle ways.
- subtypes of vehicle ways include: subtypes of traffic junctions, including roundabouts, intersections, on-ramps, and off-ramps; subtypes of parking lots including single entry and single exit parking lots, single entry and multiple exit parking lots, and multiple entry and single exit parking lots; and subtypes of road segments including one way, two way, multi-lane, and divided highways.
- a subtype may be considered another type of vehicle way.
- a subtype may be considered another type of vehicle way.
- Block 701 will be further described below in reference to FIG. 8 .
- a plurality of sample vehicle ways of only parking lot type is identified for defining a classifier for use in defining parking lots.
- a plurality of sample vehicle ways for defining a classifier for use in defining a vehicle way in the form of a traffic junction comprises traffic junctions only.
- the plurality of sample vehicle ways may include one or more of the following traffic junctions, 3-way intersections, 4-way intersections, n-way intersections, roundabouts, and any other portion of a road system where multiple roads intersect allowing vehicular traffic to change from one road to another.
- a plurality of sample vehicle ways for defining a classifier for use in defining a subtype of a traffic junction in the form of an intersection only comprises intersections (e.g., 3-way intersections, 4-way intersections). Defining a classifier for use for defining a particular type or subtype of vehicle way may provide a more accurate classifier.
- a classifier defined with sample vehicle ways of only one type and/or one subtype of vehicle way may be suitable for use in defining vehicle ways of a different type and/or subtype of vehicle way.
- a classifier may be defined for defining all types of vehicle ways.
- a classifier for use in defining a vehicle way in the form of an intersection is defined according to process 700.
- FIG. 8 shown is a simplified diagram of area 800 comprising a roadway system including a plurality of sample vehicle ways in the form of sample intersections 802a-802f.
- Area 800 also comprises parking lots 805, roadway sections 806, and non-traffic designated areas 807 (e.g., greenspace, sidewalks).
- areas 807 e.g., greenspace, sidewalks.
- sample intersections 802a-802f are also shown to be part of the same roadway network.
- sample vehicle ways may be selected from different roadway systems located in different cities, countries and/or continents.
- selection of an appropriate number and type(s) of sample vehicle ways will become apparent during definition (e.g., training and verification) of the classifier.
- Block 702 will be further described below in reference to FIGs. 6Ai-6Avi , 6Bi-6Bvi , 6C , FIG. 8 , FIG. 9 , FIGs. 10A-10B , FIGs. 11A-11F , FIGs. 12A-12D , and FIGs. 13A-13B .
- a zone includes an area encompassing an associated vehicle way.
- FIG. 6C is a conceptual diagram of elements of a vehicle way, including a bridge element 670 coupled to an employed element 671.
- bridge element 670 comprises an area for traversal of a vehicle for transitioning therefrom to employed element 671.
- Employed element 671 comprises an area in which the vehicle manoeuvres, such as for moving and/or parking.
- a vehicle way may have one or more of each of bridge elements and employed elements.
- FIG. 6Bi-6Bvi Shown in FIG. 6Bi-6Bvi are conceptual diagrams of some specific and non-limiting examples of zones encompassing the vehicle ways of FIG. 6Ai-6Avi .
- zone 611 encompasses circular traffic junction 602.
- Elements of circular traffic junction 602 include bridge elements 628 of road segments 606-609 and employed element 630 of circular road segment 604.
- a vehicle traverses one of bridge elements 628 to enter (i.e., transition into) employed element 630. Once inside employed element 630, the vehicle moves therethrough (i.e., maneuvers) and exits (i.e., transitions) employed element 630 via a bridge element 628.
- circular traffic junction 602 comprises four bridge elements 628 and one employed element 630.
- Zone 613 encompasses intersection 612.
- Elements of intersection 612 includes three bridge elements 632 for instance, road segments 614, 616, and 617 and one employed element 634 where road segments 614, 616 and 617 intersect.
- Zone 615 encompasses traffic junction 618.
- Elements of traffic junction 618 includes two bridge elements 638 including off-ramp portion 622 and main road 620 portion and one employed element such as off-ramp portion 648.
- Zone 640 encompasses parking lot 624.
- Elements of parking lot 624 includes a bridge element 642 of entry/exit 629 and an employed element 668 including parking area 626.
- Zone 652 encompasses road portion 650.
- Elements of road portion 650 includes two bridge elements 654 of road portions 650 and an employed element 656 of road portion 650.
- Zone 660 encompasses a bridge element 662 of on-street parking space 644 and an employed element 664 of on-street parking space 644.
- elements may include physical boundaries of a road surface such as a sidewalk, road shoulder, and lane divider, among others.
- a vehicle way may not have any physical boundaries, such as a beaten path created by frequent flow of vehicles for accessing a natural attraction as described above.
- zone 666 encompassing partial elements of intersection 612 - only portions of bridge elements 632 and employed element 634.
- zone 666 encompasses an insufficient portion of intersection 612, only a portion of historical vehicle data associated therewith will be processed for defining a classifier. As such, the performance of the defined classifier may be poor.
- a dimension that is too large should also be avoided.
- a zone should be large enough to encompass a vehicle way, however, not too large such that it includes extraneous areas.
- a zone that is too large may result in unnecessary processing of extraneous historical vehicle data.
- dimensions of a zone may affect computing resources and processing time for defining and/or using a classification model.
- each zone encompassing a vehicle way comprises a plurality of contiguous known areas, also referred to herein as subzones.
- Each subzone may have boundaries defined in accordance with a geographic coordinate system representing a unique two-dimensional space on the Earth's surface. For example, a zone may be partitioned by subdividing the zone into a grid of contiguous subzones bound by pairs of latitude and longitude lines. As such, the unique location of each subzone known.
- Each subzone in the plurality of contiguous subzones within a zone shares a boundary with at least one other subzone.
- the plurality of contiguous subzones serves to facilitate organization of all points therein as each subzone comprises an aggregate of a portion of points within a zone. A point located within boundaries of a subzone may be uniquely associated therewith.
- a subzone may include a portion of a vehicle way overlapping another portion of a vehicle way.
- the subzone may represent a portion of an overpass that overlaps a portion of a roadway thereunder.
- a subzone may include a portion of a vehicle way overlapped by another portion of a vehicle way.
- the subzone may represent a portion of a roadway that is overlapped by a portion of an overpass.
- zone dimensions may be determined according to the shape and size of an associated vehicle way.
- FIG. 9 is a simplified diagram of a plurality exemplary zones 908a-908f defined for sample intersections 802a-802f, respectively.
- the dimensions of each zone are such that the elements of each associated vehicle way are encompassed thereby.
- sample vehicle ways e.g., sample intersections 802a-802f vary relatively in shape and size, so may respective zones 908a-908f.
- Each of the plurality of zones 908a-908f is partitioned into a plurality of contiguous subzones 910a-910f.
- each of zones 908a-908f may be subdivided into a grid of contiguous subzones bound by pairs of latitude and longitude lines.
- each of zones 908a-908f may be different in dimension, each thereof may comprise a different number of subzones 910a-910f, as shown.
- zone 908b is smaller than zone 908f and accordingly, has fewer subzones 910b than the number of subzones 910f in zone 908f.
- geographic coordinate data of a location e.g., LAT/LONG
- a reference point indicates a general area in which a vehicle way may be located.
- a user may view a georeferenced map of area 800 on a display and manually identify a reference point proximate sample intersection 802a.
- the georeferenced map may be accessed via a web page of an online map service, such as a Google Maps.
- the user may choose reference point 803a on or near sample intersection 802a, as shown in FIG. 8 .
- the location of reference point 803a may be obtained, by the user selecting point 803a on the georeferenced map with a pointer, causing text indicating geographic coordinates, (e.g., LAT/LONG), thereof to appear on the display.
- LAT/LONG geographic coordinates
- a location of a reference point proximate a vehicle way may be obtained through use of a GPS enabled device or another geographic coordinate sensing device.
- a GPS enabled device or another geographic coordinate sensing device.
- Point data indicative of the location of reference point 803a may be provided to traffic analytics system 104a, for example, via a user interface or data file accessed by traffic analytics system 104a.
- the reference point may be at or near the centre point of a zone.
- a zone may be defined by subdividing a reference area into a grid of contiguous subzones according to a hierarchical geospatial indexing system, such as Geohash.
- Geohash is a known public domain hierarchical geospatial indexing system which uses a Z-order curve to hierarchically subdivide the latitude/longitude grid into progressively smaller cells of grid shape. Each cell is rectangular and represents an area bound by a unique pair of latitude and longitude lines corresponding to an alphanumeric string, known as a Geohash string and/or Geohash code.
- a Geohash system the size of a cell depends on a user defined length of a string.
- the hierarchical structure of Geohash grids progressively refines spatial granularity as the length of string increases. For example, shown in FIG. 11A is table 1102 defining the relationship between string length and approximate cell dimensions. As string length increases, cell dimensions decrease, as shown. Cell size is also influenced by a cell's longitudinal location. Cell width reduces moving away from the equator (to 0 at the poles) due to the nature of longitudinal lines converging as they extend away therefrom. Table 1102 provides an approximation of Geohash cell dimensions located along the equator.
- FIG. 11F is a simplified conceptual diagram of cell 1132, defined by latitude and longitude lines 1134 and 1136, respectively.
- Shown in FIG. 11B is a simplified functional block diagram of an exemplary Geohash encode function 1108, for mapping a point to a cell.
- Encode function 1108 outputs string 'ezs42' corresponding to cell 1132 having dimensions 4.89km x 4.89km.
- encode function 1108 will map any point within cell 1132 to the same string, 'ezs42.'
- FIG. 11C is a simplified functional block diagram of an exemplary Geohash decode function 1110 for resolving a string to the centre point of the corresponding cell.
- string 'ezs42' is input to decode function 1110 and decoded to cell 1132 centre point 1135 at LAT/LONG coordinates '42.60498047, -5.60302734.
- decode function 1110 resolves an input string to LAT/LONG coordinates of one point only, specifically, the centre point of the corresponding cell.
- FIG. 11D is a simplified functional block diagram of an exemplary Geohash bounds function 1112 for resolving a string into °N/°S, °W/°E line pairs that bound the corresponding cell.
- string 'ezs42' is input to bounds function 1112 which outputs (42.626953125°N, 42.5830078125°N), (-5.5810546875°E, -5.625°E) line pairs bounding cell 1132, as shown in FIG. 11F .
- FIG. 11E is a simplified functional block diagram of an exemplary Geohash neighbours function 1114 for determining the closest 8 neighbouring (e.g., adjacent) cells to a given cell.
- string 'ezs42' is input into neighbours function 1114 which outputs strings of the closest 8 neighbouring cells at relative positions NW, W, NE, W, E, SW, S, and SE to cell 1132.
- FIG. 11G is a simplified conceptual of cell 1132 and its 8 closest neighbouring cells 1140.
- each of the plurality of zones 908a-908f of FIG. 9 is partitioned into a plurality of contiguous subzones 910a-910f, respectively, in the form of Geohash cells.
- sample vehicle ways may be selected from various locations and thus may be located at different longitudes.
- dimensions of Geohash cells across a plurality of zones may differ at different longitudes.
- zone dimensions may be dependent on dimensions that are likely to encompass most vehicle ways to be defined using a classifier.
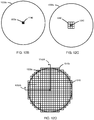
- FIG. 10A is a simplified diagram of a plurality of reference areas 1008a-1008f of a same dimension defined for sample intersections 802a-802f, respectively. Dimensions of reference areas 1008a-1008f are approximated to encompass most intersections within an intersection population that may be defined by a classifier.
- reference areas 1008a-1008f are circular in shape having a radius R. In some instances, a reference area may be defined relative to the location of the reference point of the vehicle way.
- reference areas 1008a-1008f are centred about reference points 803a-803f of sample intersections 802a-802f. Accordingly, reference areas 1008a-1008f are defined by radius R extending from the reference points 803a-803f respectively.
- the inventor determined a reference area defined radially 25m from the reference point encompasses most intersections within an intersection population of interest whilst avoiding extraneous areas.
- optimal zone dimensions may vary according to the classifier.
- One of ordinary skill will appreciate that an optimal zone dimensions will become apparent during definition of the classifier.
- FIG. 10B is a simplified conceptual diagram of a plurality of exemplary zones 1010a-1010f imposed on sample intersections 802a-802f, each comprising a plurality of contiguous subzones 1011a-1011f.
- reference areas 1008a-1008f of FIG. 10A are partitioned into a plurality of contiguous subzones in the form of Geohash cells.
- FIG. 12A is a flow diagram of one exemplary process 1200 for subdividing a reference area into a grid of Geohash cells.
- Subdividing a reference area into a grid of Geohash cells process 1200 begins at block 1202 wherein a reference point of a sample vehicle way is mapped to a Geohash cell.
- a reference point of a sample vehicle way is mapped to a Geohash cell.
- LAT/LONG coordinates of reference point 803a is input into encode function 1108 and the corresponding Geohash string is output thereby.
- FIG. 12B Shown in FIG. 12B is a simplified diagram of reference area 1008a, including reference point 803a and cell 1240, the Geohash cell to which reference point 803a was mapped.
- Geohash cell 1240 serves as a centre cell from which a grid of contiguous Geohash cells for subdividing reference area 1008a is formed.
- FIG. 12C is a simplified conceptual diagram of centre cell 1240 and its 8 closest neighbouring cells 1242.
- Block 1204 repeats a similar step of determine neighbouring cells of neighbouring cells until reference area 1008a is completely subdivided into a grid of contiguous Geohash cells, as shown in FIG. 12D .
- Block 1204 may utilize Geohash bounds function 1112 to determine when to stop process 1200.
- coordinates for the boundary of reference area 1008 may be input into bounds function 1112 to determine which Geohash cells in the grid include the boundary. Once the entire boundary is within a Geohash process 1200 may stop.
- bounds function 1112 may be input into bounds function 1112 to determine which Geohash cells in the grid include the boundary.
- the associated zone may be defined by peripheral edges of the plurality of contiguous subzones. For instance, once reference areas 1008a-1008f are defined, they are partitioned into a plurality of contiguous subzones 1010a-1010b and the peripheral edges 1248 of each thereof define zones 1011a-1011f.
- subzones are not limited to a particular dimension, size or shape.
- these attributes may affect processing time and resources for defining and/or using a classification model. For instance, higher precision subzones, will increase the number of subzones for processing in comparison to lower precision subzones for a given zone.
- Embodiments described herein are not limited to partitioning a zone with Geohashes.
- a zone may be partitioned according to another hierarchical geospatial indexing system, e.g., H3 - Uber's Hexagonal Hierarchical Spatial Index, or other system.
- a zone may be partitioned according to another method for subdividing geographical space.
- a zone may be defined in multiple ways. For instance, a plurality of contiguous subzones may be defined by creating a zone of a shape unique to a corresponding sample vehicle way, as shown in FIG. 9 . In another instance, a reference area may be partitioned into a plurality of contiguous subzones to create a zone, as shown in FIG. 10B .
- the methods for defining a zone described herein are examples only and are not intended to limit embodiments.
- subzone data may be formed.
- subzone data may comprise information indicating a unique identifier and location (e.g., geographic coordinates of boundaries) of the subzone.
- Subzone data may also comprise information indicating the closest neighbours of the subzone and/or other subzone related information.
- FIG. 13A is a simplified conceptual diagram of exemplary subzone data 1302 formed for zone 1010a.
- subzone data 1302 comprises Geohash string data which serves as a unique identifier of each subzone.
- the location of a Geohash cell i.e. subzone
- subzone data may comprise unique ID data which serves as a unique identifier of each subzone and boundary coordinates of boundaries thereof, such as LAT/LONG pairs.
- FIG. 13B is a simplified conceptual diagram of subzone data 1304 formed for zone 1010a comprising Geohash string data which serves as a unique identifier of each subzone and LAT/LONG pairs defining boundaries of each Geohash.
- subzone data may include information indicative of a Geohash cell's 8 closest neighbours.
- two or more of a plurality of zones may overlap, for example, zones 1010d and 1010f of FIG. 10B .
- a subzone within more than one zone may skew training and/or output of a classification model.
- vehicle data associated with subzones within multiple zones may be overrepresented in training and result in a biased classifier.
- a subzone common to multiple zones may be associated with a unique zone and then each of the multiple zones is redefined to include a new unique plurality of subzones.
- subzone data of the multiple zones are modified in accordance with the redefinition thereof. Block 704 will be described in further detail below with reference to FIGs. 14A-14C , FIGs. 15A-15B , and FIGs. 16A-16B .
- the distance between the common subzone and each of the centre subzones of the multiple zones is calculated.
- the common subzone is uniquely associated with the zone having a centre subzone that is the shortest distance thereto.
- FIG. 14A is a simplified conceptual diagram of zones 1010d and 1010f comprising centre subzones 1404 and 1406 respectively, and a plurality of common subzones located within overlapping portion 1402 thereof.
- FIG 14B is an enlarged view of a portion of zones 1010d and 1010f comprising overlapping portion 1402 that includes subzone 1408.
- Distance D1 between common subzone 1408 and centre subzone 1404 of zone 1010d is shorter than distance D2 between common subzone 1408 and centre subzone 1406 of zone 1010f, as shown.
- common subzone 1408 is uniquely associated with zone 1010d and zone 1010f is redefined to not include common subzone 1408.
- Each subzone within portion 1402 is analyzed and then uniquely associated with one of zones 1010d and 1010f followed by the redefinition thereof.
- FIG. 14C is a simplified conceptual diagram of redefined zones 1010d and 1010f.
- FIG. 15A is a simplified conceptual diagram of zone 1010a comprising vehicle-position data points 1502 representing positions of vehicles indicated by raw vehicle data.
- FIG. 15B shown is an enlarged view of portion 1012 of area 800 imposed on the diagram of FIG 15A .
- Vehicle-position data points 1502 are present within sample vehicle way 802a, areas 1504 in parking lots 805, portion 1508 of side street 1506, as well as in portions 1510 of green space areas 807, as shown.
- Vehicle-position data points found in portions 1510 may be due to GPS error or other position sensing technology error.
- a classifier for identifying subzones as portions of a vehicle way will be defined based on raw vehicle data associated with the subzones and corresponding zone.
- FIG. 15B illustrates how vehicle traffic may be dispersed in a zone in practise. However, a classifier may be used to identify only those subzones that are occupied by the vehicle way based on raw vehicle data associated with the entire zone.
- FIG. 16A shows an enlarged view of portion 1012 of area 800 comprising sample intersection 802a and paths 1602, 1604 and 1606 of one or more vehicles that have traversed therethrough.
- a same vehicle may have traversed sample intersection 802a at three different time intervals.
- three unique vehicles may have traversed sample intersection 802a.
- Paths 1602, 1604 and 1606 may be have been traversed by any combination of one or more vehicles.
- FIG. 16B shown is conceptual diagram of zone 1010a and vehicle position-data points 1608 representing position data of raw vehicle data instances that correspond to a position along paths 1602, 1604 and 1606.
- no vehicle-position data points correspond to path 1606.
- Data collected by a monitoring device when inside a zone may depend on various factors, such as, the frequency a monitoring device collects operation information, the size of the zone, or other predefined criteria for collecting data, among others. As a result, there may be instances when a monitoring device collects little-to-no data when traversing a zone.
- a subset of raw vehicle data associated with each of the plurality of zones is selected from historical vehicle data.
- traffic analytics system 104a may access historical vehicle data, such as historical vehicle data in database 209, for selecting the subset stored by traffic analytics system 104a via communication network 110.
- the subset of raw vehicle data may be selected based on positions inside a zone.
- the subset of raw vehicle data may be selected based on positions inside and outside the zone.
- FIG. 16C illustrates vehicle position-data points corresponding to positions within portion 1012 of area 800. Including raw vehicle data corresponding to positions both inside and outside zone 1010a in the subset enables inclusion of raw vehicle data corresponding to the positions on path 1604, represented by vehicle-position data points 1616. This also enables inclusion of more raw vehicle instances corresponding to paths 1602 and 1606, represented by vehicle-position data points 1618.
- FIG. 16D illustrates vehicle-position data points 1621 corresponding to interpolated data instances.
- Selecting raw vehicle data corresponding to locations inside and outside a zone, at block 706, and then interpolating data therefrom at block 708, may provide more meaningful data for the purpose of training a machine learning algorithm in comparison to training based on raw vehicle data instances corresponding to locations inside a zone only.
- Block 708 is described further below with reference to FIGs. 16E-16F , FIG. 17 , and FIGs. 18A-18B .
- data instances are interpolated in dependence on the dimensions of subzones of a zone.
- interpolating data such that there is one of an interpolated instance or raw vehicle data instance corresponding to a position in each subzone along a given path of a vehicle.
- FIG. 16E shown is a conceptual diagram of zone 1010a comprising plurality of subzones 1011a of approximate dimension 4.77m x 4.77m.
- data instances are interpolated such that there is at least one of an interpolated instance or raw vehicle data instance corresponding to a location in each subzone.
- data may be interpolated from raw vehicle data corresponding to positions only inside a zone.
- the subset of raw vehicle data associated with a zone comprises raw vehicle data corresponding to positions within a traffic zone.
- a traffic zone may encompass a unique zone.
- a traffic zone may encompass more than one zone.
- FIG. 17 is a simplified diagram of an exemplary implementation of traffic zone 1700 encompassing zones 1010a-1010f. For instance, geographic coordinates of boundaries 1702 of traffic zone 1700 are provided to traffic analytics system 104a for defining traffic zone 1700.
- FIG. 18A is a simplified block diagram of process 1800a for obtaining data, hereinafter referred to as vehicle data, for generating features.
- Vehicle data may be indicative of vehicle operating conditions for a plurality of corresponding vehicles.
- data may be a subset of raw vehicle data selected from first historical vehicle data 404 that corresponds to a location within a zone and/or traffic zone.
- boundary data 1802 comprises zone boundary data and/or traffic zone data indicative of locations of boundaries of a zone and/or a traffic zone, respectively.
- raw vehicle data is selected from first historical vehicle data 404 based on boundary data 1802 to form first vehicle data 1810.
- FIG. 18B is a simplified block diagram of an alternative process 1800b for obtaining vehicle data for generating features.
- data may be a subset of raw vehicle data selected from first historical vehicle data 404 that corresponds to a location within a zone and/or traffic zone.
- boundary data 1802 comprises zone boundary data and/or traffic zone data indicative of locations of boundaries of a zone and traffic zone, respectively.
- raw vehicle data is selected from first historical vehicle data 404 based on boundary data 1802.
- data is interpolated from the raw vehicle data selected in block 1802 and first vehicle data 1810 comprising the raw vehicle data and the data interpolated therefrom is formed.
- raw vehicle data selected from first historical vehicle data 404 may be selected based on date and time operating conditions are logged. For instance, raw vehicle data corresponding to a particular date and/or time range is selected. For example, only raw vehicle data collected over the last 3 months may be selected.
- the selected data is pre-processed, the selected data is pre-processed, such as, by removing outliers (e.g., unlikely speed values), duplicate values, and the like.
- outliers e.g., unlikely speed values
- features for each of the plurality of subzones of each of the plurality of zones are extracted from vehicle data.
- Features of the types described herein may include features that are present in a vehicle data instance or a subset of vehicle data instances and/or features derived therefrom.
- Features present in an instance or a subset of instances may include numeric values that are explicitly set out therein.
- Specific and non-limiting examples of such features include, a minimum or maximum numeric value in the subset (where a minimum/maximum may be absolute and/or relative). The minimum or maximum data value may require some analysis, such as a comparison of values, but the minimum/maximum value itself will be a value found within the subset.
- a plurality of vehicle data instances in a vehicle data subset may be analyzed to determine a maximum speed of the subset.
- Block 710 is further described below with reference to FIGs. 19A-19B , FIGs. 20A-20E , FIG. 21 , FIGs. 22A-22B , FIG. 23 , and FIGs. 24A-24B .
- Derived features may describe an instance or subset of vehicle data instances, but include a value not found therein. Instead, a value of a derived feature may be derived from the instance or subset, such as obtained through performing one or more computations on the instance or subset. Specific and non-limiting examples of derived features include average speed, total number of vehicle visits and ignition ratio.
- a derived feature may describe a first derived feature forming a second derivative of the first derived feature. Additional derivatives of features may also be possible.
- the features may additionally or alternatively be derived from the performance of one or more statistical computations on a vehicle data subset.
- a derived feature that may be employed may include standard deviation, mean, and median of values found in a vehicle data subset. For example, standard deviation, mean, and/or median of speed values of vehicles that have traversed a subzone.
- the features may be prepared for use in training the model, for instance, by traffic analytics system 104a.
- Preparing the data may include various functions such as removing outliers (e.g., unlikely speed values), duplicate values, and the like.
- FIG. 19A is a conceptual block diagram of a feature extraction function for generating features from vehicle data.
- a subset of vehicle data for each of the plurality of subzones of the plurality of zones may be selected from vehicle data based on subzone data. Once selected, the subset of vehicle data is analyzed and/or computations are performed thereon to extract/generate subzone features 1906. For each subzone in each zone, a plurality of features is generated. These features may be used to identify patterns in the features by a machine learning algorithm during training for defining a classifier.
- a subset of vehicle data is be selected from first vehicle data 1810 based on subzone data 1902 for each of the plurality of subzones of zones 1010a-1010f.
- the subset of vehicle data instances is analyzed and/or computations are performed thereon to extract/generate features 1906.
- a plurality of features e.g., F1-Fn
- FIG. 19B is an exemplary table 1908 representing data comprising a plurality of features for each Geohash.
- a plurality of subzone-related features is based on and/or derived from a subset of vehicle data associated with each subzone.
- the subset is a first subset of vehicle data corresponding to a position within a subzone.
- Subzone-related features indicate measurements/attributes of vehicle operating conditions of at least one vehicle that has operated in the subzone.
- FIG. 20A is a conceptual diagram of portion 2002 of zone 1010a as demarcated by line 1250A-1250A of FIG. 12D .
- Portion 2002 comprises subzone 2004, as shown.
- An enlarged view of subzone 2004 is depicted in FIG. 20B comprising vehicle-position data points 2006 each thereof indicative of a position of one or more vehicles that have entered subzone 2004 at one point in time.
- FIG. 20C Illustrated in FIG. 20C is a simplified functional block diagram of a function that may be implemented at block 1904.
- First vehicle data 1810 and subzone 2004 subzone data 2007 is provided in block 2008 and a first subset of vehicle data corresponding to a position within subzone 2004 may be selected.
- the first subset of vehicle data is represented by the vehicle-position data points 2006 shown in FIG. 20B .
- the first subset of vehicle data is processed at block 2010. For instance, the first subset of vehicle data instances may be analyzed and/or have computations performed thereon at block 2010 to form at least one feature 2012.
- FIG. 20D is a table 2014 representing an example of a first subset of vehicle data corresponding to a position within subzone 2004.
- Position data 2018 of each instance 2016 is represented by vehicle-position data points 2006 as shown in FIG. 20B .
- Subzone-related features formed from processing the first subset of vehicle data are indicative of attributes/measurements of vehicle operating data of vehicles with corresponding device IDs ID1, ID2, ID3, ID4, when operating in subzone 2004. These subzone-related features may be used by the ML algorithm to identify patterns. For descriptive purposes, only 4 vehicles are shown to have entered subzone 2004, in this example. In practice however, the number of vehicles that may enter a subzone may be more or less than four.
- Table 1 Subzone-related features Minimum vehicle speed Maximum vehicle speed Average vehicle speed Median vehicle speed Standard deviation of vehicle speed Minimum ignition Maximum ignition Total number of ignitions on Total number of ignitions off Average number of ignitions Ignition ratio Total number of vehicle visits Average number of visits/vehicle Minimum number of vehicle visits/day Maximum number of vehicle visits/day Average number of vehicle visits/day Median number of vehicle visits/day Standard deviation of number of vehicle visits/day Minimum unique number of vehicle visits/day Maximum unique number of vehicle visits/day Median unique number of vehicle visits/day Standard deviation of unique number of vehicle visits/day Average unique number of visits/day Total number of unique vehicle visits.
- FIG. 20E is a table of exemplary subzone-related features and feature values based on the subset of vehicle data instances. Other features may be based on and/or be derived from the first subset of vehicle data.
- Ignition state indicates whether a vehicle is in a driveable state or not.
- an internal combustion engine (ICE) vehicle has an ignition state of on when the engine is on.
- An ICE vehicle has an ignition state of off when the engine is off, even if electrical power is provided to vehicle circuitry by the battery.
- an electric vehicle (EV) has an ignition state of on when electricity is provided to the EV's electric motor, whereas the ignition state is off when no electricity is provided to the EV's electric motor.
- the minimum ignition feature of a subzone has a value of 1 only when all vehicles that have entered a subzone have an ignition state of 1. This may indicate that the vehicle way is not employed as a parking area.
- the maximum ignition feature has a value of 0 only when all vehicles in a subzone have an ignition state of off. This may indicate that the subzone is a portion of vehicle way employed as a parking area.
- subzone-related features may be based on and/or derived from the first subset of vehicle data and a second subset of vehicle data including vehicle data temporally preceding and/or subsequent thereto for a same vehicle.
- the first and second subsets of vehicle data may be processed for providing subzone-related features indicative of dwell time of a vehicle within a given subzone.
- Shown in FIG. 21 is a simplified diagram of subzone 2004 and vehicle-position data point 2006 representing a vehicle position at T1 according to vehicle data.
- a dwell time of a vehicle within subzone 2004 may be determined by obtaining vehicle data corresponding to the same vehicle at a preceding point in time, T0, and a subsequent point in time, T2, represented by vehicle-position data points 2106 and 2108 respectively.
- the time TA (2110) between the time a vehicle enters subzone 2004 and arrives at position 2006, and the time TB (2112) between the time the vehicle leaves position 2006 and exits subzone 2004 may be determined.
- subzone-related features may be based on and/or derived from the first subset of vehicle data and a third subset of vehicle data including vehicle data corresponding to vehicle data temporally subsequent thereto for a same vehicle.
- subzone-related features relates to the travel time of a vehicle between a location within a subzone and the first location the vehicle ignition state is off. In other words, the travel time between a position within a subzone and position the vehicle parks, i.e., time to park.
- FIG. 22A is a simplified diagram of a path of a vehicle that has traversed subzone 2004 having a related vehicle data instance corresponding to vehicle-position data point 2006 at time T1, as shown.
- Each temporally subsequent vehicle data instance is represented by a vehicle-position data points 2204 at times T1- T14 each representing a new location of a same vehicle at consecutive points in time as the vehicle travels along path 2200.
- Vehicle-position data point 2206 at T14 represents the first location the vehicle ignition is turned off, indicating that the car has parked.
- the time to park is calculated to provide subzone-related features such as, average time to park, minimum time to park, maximum time to park, median time to park, and standard deviation of time to park.
- Table 2210 of FIG. 22B represents a third subset of vehicle data corresponding to vehicle-position data points 2204 at times T1-T14.
- a vehicle ignition is ON and the speed is 0 km/hr, such as at T9.
- the speed is 0 km/hr, such as at T9.
- the ignition is on. For instance, at red lights, stop signs, heavy traffic (stop-and-go), picking up passengers, going through a drive through, among others.
- zone-related features may be based on and/or derived from a fourth subset of vehicle data instances associated with the zone and/or subzone-related features.
- Table 2 lists specific and non-limiting examples of such zone-related features. These zone-related features may be determined for each subzone of the plurality of subzones for each zone of the plurality of zones.
- Table 2 Zone-Related Features Zone Minimum Ignition OFF Zone Maximum Ignition OFF Zone Average Vehicle Speed Zone Maximum Vehicle Speed Zone Minimum Vehicle Speed Zone Minimum Vehicle Speed Zone Average Number of Unique Visits/Day Zone Minimum Number of Unique Visits/Day Zone Maximum Number of Unique Visits/Day Zone Average Median Number of Unique Visits/Day Zone Total Average Number of Unique Visits/Day
- zone average speed may be determined by selecting a subset of vehicle data instances corresponding to a position within a zone and calculating the average speed therefrom.
- zone average speed may be determined by calculating an average of the average speed subzone-related features of all subzones in a zone.
- zone-related features may be based on and/or derived from a fifth subset of vehicle data instances associated with the zone.
- Table 3 lists specific and non-limiting examples of such zone-related features. These zone-related features may be determined for each subzone of the plurality of subzones for each zone of the plurality of zones.
- Table 3 Zone-Related Features Zone Total Number of Visits Zone Total Number of Unique Visits
- zone total number of visits may be determined by selecting a subset of vehicle data instances corresponding to a position within a zone and calculating the total number of vehicles that correspond to the zone.
- zone-related features may be based on and/or derived from another portion of subzone-related features.
- Table 4 lists specific and non-limiting examples of such zone-related features. These zone-related features may be determined for each subzone of the plurality of subzones for each zone of the plurality of zones.
- Zone-Related Features Zone Average Time to Park Zone Maximum Time to Park Zone Minimum Time to Park Zone Maximum Dwell Time Zone Minimum Dwell Time Zone Median Dwell Time Zone Average Dwell Time Zone Minimum Number Of Unique Visits Zone Average Number Of Unique Visits Zone Maximum Number Of Unique Visits Zone Average Total Number of Visits Zone Maximum Total Number of Visits Zone Minimum Total Number of Visits Zone Minimum Total Number of Visits Zone Minimum Total Number of Visits Zone Minimum Total Number of Visits Zone Minimum Total Number of Visits Zone Minimum Total Number of Visits Zone Minimum Total Number of Visits Zone Minimum Total Number of Visits Zone Minimum Total Number of Visits Zone Minimum Total Number of Visits Zone Minimum Total Number of Visits Zone Minimum Total Number of Visits Zone Minimum Total Number of Visits Zone Minimum Total Number of Visits Zone Minimum Total Number of
- zone average dwell time may be determined by calculating an average of the average dwell time subzone-related features of all subzones in a zone.
- subzone-zone-related features may be based on and/or derived from a portion of subzone-related features in relationship to a portion of zone-related features. Subzone-zone-related features are determined for each subzone of the plurality of subzones for each zone of the plurality of zones.
- Table 5 Subzone-Zone-Related Features Minimum Vehicle Speed Ratio Average Vehicle Speed Ratio Maximum Vehicle Speed Ratio Minimum Ignition Off Ratio Maximum Ignition Off Ratio Maximum Dwell Time Ratio Minimum Dwell Time Ratio Average Median Dwell Time Ratio Average Dwell Time Ratio Minimum Time to Park Ratio Average Time to Park Ratio Maximum Time to Park Ratio Minimum Number of Unique Vehicle Visits Ratio Maximum Number of Unique Vehicle Visits Ratio Average Number of Unique Vehicle Visits Ratio Minimum Unique Number of Vehicle Visits/Day Ratio Maximum Unique Number of Vehicle Visits/Day Ratio Average Unique Number of Vehicle Visits/Day Ratio Average Unique Number of Vehicle Visits/Day Ratio Average Median Unique Number of Vehicle Visits/Day Ratio Minimum Total Number of Vehicle Visits Ratio Maximum Total Number of Vehicle Visits Ratio Average Total Number of Vehicle Visits Ratio Total Number of Vehicle Unique Visits Ratio Total Number of Vehicle Visits Ratio Total Number of Vehicle Visits Ratio Total Number of Vehicle Visit
- subzone-zone-related feature average speed ratio may be determined by calculating the ratio of subzone-related feature average speed to zone-related feature, zone average speed.
- raw vehicle data may be selected from historical vehicle data based on a particular date and/or time period. As such, values of features described herein may vary accordingly.
- spatial-related features may be based on and/or derived from spatial relationship data of a subzone to the zone. According to an embodiment, spatial-related features may be based on and/or derived from a spatial relationship data of a subzone to the plurality of subzones, or a portion thereof, of a zone.
- a spatial-related feature may be based on and/or derived from the distance of the subzone to the centre point of a zone.
- one method for determining the distance between a subzone and the centre point of a zone comprises, determining a location of a centre point of the subzone and the location of the centre point of the centre subzone of a zone. Next, the distance therebetween is calculated.
- FIG. 23 shown in FIG. 23 is a simplified diagram of portion 2002 including centre point 2006 of subzone 2004, and reference point 803a, which may be a centre point, of zone 1010a.
- the distance 2304 between centre point 2006 and reference point 803a is determined, for instance, by using the Haversine formula.
- a feature may be based on and/or derived from the number of subzones adjacent the subzone (e.g., number of Geohash neighbours).
- FIG. 24A is a simplified conceptual diagram of portion 2002 including subzone 2004 having 8 adjacent subzones 2402.
- FIG. 24B is also a simplified conceptual diagram of portion 2002 including subzone 2404 having 4 adjacent subzones 2406.
- the features for subzones 2004 and 2404 may have values 8 and 4 respectively.
- features for subzones 2004 and 2404 may have values be derived therefrom.
- a feature may be based on and/or derived from the number of subzones adjacent the subzone (e.g., number of Geohash neighbours) having vehicle data corresponding to a location therein.
- FIG. 24A shows subzone 2004 having 8 adjacent subzones 2402. If no vehicle data corresponds to 3 of those adjacent subzones the value of the feature is 5. In other words, if vehicles did not enter 3 of the 8 subzones, the number of adjacent subzones having vehicle data corresponding to a location therein is 5.
- Spatial-related features are determined for each subzone of the plurality of subzones for each zone of the plurality of zones.
- training data is formed. For instance, for each subzone, above described features are determined to create training data. Training data further includes an indication of the class of each subzone.
- FIG. 25A Shown in FIG. 25A is a conceptual diagram of a portion of sample vehicle way in the form of sample intersection 802a and zone 1010a imposed thereon. Shaded subzones 2502 of zone 1010a indicate that they are portions of sample intersection 802, whereas the unshaded subzones 2504 are not portions of sample intersection.
- Table 2510 of FIG 25B represents training data including subzone ID, a plurality of features generated for each associated subzone, and a class label, indicating a subzone is one of a 'vehicle way' class, (e.g., a portion of sample vehicle way, such as sample intersection 802a) or a 'not-vehicle way' class (e.g., not a portion of a sample vehicle way).
- a 'vehicle way' class e.g., a portion of sample vehicle way, such as sample intersection 802a
- a 'not-vehicle way' class e.g., not a portion of
- a machine learning technique such as random forest technique, is implemented using training data to define a classifier for classifying a subzone as one of a vehicle way class or not-vehicle way class.
- the training data used may include all or a portion of the features described herein. Optionally, other features may be included in the training data.
- FIG. 26 is a high-level flow diagram of an exemplary process 2600 for using a machine learning technique to define a classifier for classifying subzones.
- Process 2600 begins at block 2602 where training data, such as training data represented by table 2510, is input to a machine learning algorithm.
- a classifier that is generated by training the ML algorithm is verified, and at block 2606 the performance of the classifier is evaluated. If the classifier meets performance criteria, (e.g., passes verification) process 2600 ends at block 2610. However, if the performance criteria are not met, (e.g., fails verification), the process 2600 continues to block 2608 where modifications to training data or machine learning algorithm parameters may be performed and process 2600 continues until the defined classifier meets the required performance criteria.
- performance criteria e.g., passes verification
- modifications to other parameters may also be performed should performance criteria not be met.
- performance criteria such as, the relative position of the reference areas from the reference points and/or subzone dimensions (e.g., Geohash precision).
- classifier data associated with the classifier may be generated.
- Such classifier data may be indicative of the relative position of the reference areas from the reference points that were used for defining the classifier.
- the classifier data may also be indicative of subzone dimensions (e.g., Geohash precision) of subzones used for defining the classifier. This classifier data may be useful when using the classifier for defining a vehicle way.
- Each classifier may have unique classifier data associated therewith.
- the techniques described herein may be embodied in computer-executable instructions implemented as software, including as application software, system software, firmware, middleware, embedded code, or any other suitable type of computer code.
- Such computer-executable instructions may be written using any of several suitable programming languages and/or programming or scripting tools and may be compiled as executable machine language code or intermediate code that is executed on a framework or virtual machine.
- Computer-executable instructions implementing the techniques described herein may, in some embodiments, be encoded on one or more computer-readable media to provide functionality to the media.
- Computer-readable media include magnetic media such as a hard disk drive, optical media such as a Compact Disk (CD) or a Digital Versatile Disk (DVD), Blu-Ray disk, a persistent or non-persistent solid-state memory (e.g., Flash memory, Magnetic RAM, etc.), or any other suitable storage media.
- “computer- readable media” also called “computer-readable storage media” refers to tangible storage media. Tangible storage media are non-transitory and have at least one physical, structural component.
- At least one physical, structural component has at least one physical property that may be altered in some way during a process of creating the medium with embedded information, a process of recording information thereon, or any other process of encoding the medium with information. For example, a magnetization state of a portion of a physical structure of a computer-readable medium may be altered during a recording process.
- traffic analytics system 104a, 104b and intelligent telematics system 500a, 500b may additionally have one or more components and peripherals, including input and output devices. These devices can be used, among other things, to present a user interface. Examples of output devices that can be used to provide a user interface include printers or display screens for visual presentation of output and speakers or other sound generating devices for audible presentation of output. Examples of input devices that can be used for a user interface include keyboards, and pointing devices, such as mice, touch pads, and digitizing tablets. As another example, traffic analytics system 104a, 104b and intelligent telematics system 500a, 500b may receive input information through speech recognition or in other audible format.
- Embodiments have been described where the techniques are implemented in circuitry and/or computer-executable instructions. It should be appreciated that some embodiments may be in the form of a method or process, of which at least one example has been provided. The acts performed as part of the method or process may be ordered in any suitable way. Accordingly, embodiments may be constructed in which acts are performed in an order different than illustrated, which may include performing some acts simultaneously, even though shown as sequential acts in illustrative embodiments.
- Various aspects of the embodiments described above may be used alone, in combination, or in a variety of arrangements not specifically discussed in the embodiments described in the foregoing and is therefore not limited in its application to the details and arrangement of components set forth in the foregoing description or illustrated in the drawings. For example, aspects described in one embodiment may be combined in any manner with aspects described in other embodiments.
- Embodiments of the present invention provide one or more technical effects.
- the ability to define locations of vehicle ways of a particular type. Provides alternative techniques compared to prior art for locating vehicle ways.
- Vehicle a transportation asset, some examples include: a car, truck, recreational vehicle, heavy equipment, tractor, and snowmobile.
- Vehicle way an area frequently used by vehicles, i.e., an area on the Earth's surface repeatedly employed by vehicles.
- a vehicle way may include an area employed by vehicles for movement and/or parking.
- Location a unique geographic location of an object on the Earth's surface.
- Point location/Location of a point defines a unique two-dimensional location of a point on the Earth's surface, for example, geographic coordinate pair, latitude/longitude.
- Area location/Location of an area a unique two-dimensional space on the Earth's surface.
- Known area an area of which the location thereof is defined.
- Monitoring device a device onboard a vehicle for detecting environmental operating conditions associated with a vehicle and transmitting raw vehicle data indicative thereof.
- Raw vehicle data data including vehicle operation information indicative of vehicle operating conditions and the date and time vehicle operating conditions were logged.
- Raw vehicle data may include information for identifying an onboard monitoring device and/or a vehicle the monitoring device is aboard.
- Historical vehicle data raw vehicle data collected over a period of time.
- Vehicle data raw vehicle data and data interpolated therefrom or raw vehicle data.
- Zone an area encompassing an associated vehicle way.
- Subzone portion of a zone.
- Classifier a classification model defined by using a machine learning technique for classifying an object.
- a classifier classifies a subzone (e.g., a known area) as a vehicle way class or not-vehicle way class.
- Feature data indicative of variables/attributes, or measurements of properties of a phenomenon being observed and/or data derived therefrom.
- a feature is a numerical representation of a subzone.
Priority Applications (1)
| Application Number | Priority Date | Filing Date | Title |
|---|---|---|---|
| DE20163985.3T DE20163985T1 (de) | 2019-04-04 | 2020-03-18 | Maschinenlernsystem um ein gebiet als befahrbar zu klassifizieren |
Applications Claiming Priority (1)
| Application Number | Priority Date | Filing Date | Title |
|---|---|---|---|
| US201962829539P | 2019-04-04 | 2019-04-04 |
Publications (1)
| Publication Number | Publication Date |
|---|---|
| EP3719716A1 true EP3719716A1 (fr) | 2020-10-07 |
Family
ID=69845952
Family Applications (3)
| Application Number | Title | Priority Date | Filing Date |
|---|---|---|---|
| EP20163940.8A Active EP3719714B1 (fr) | 2019-04-04 | 2020-03-18 | Système d'apprentissage machine pour classifier une zone comme carrossable |
| EP20163960.6A Pending EP3719715A1 (fr) | 2019-04-04 | 2020-03-18 | Procédé d'apprentissage machine pour classifier une zone comme carrossable |
| EP20163985.3A Pending EP3719716A1 (fr) | 2019-04-04 | 2020-03-18 | Système d'apprentissage machine pour classifier une zone comme carrossable |
Family Applications Before (2)
| Application Number | Title | Priority Date | Filing Date |
|---|---|---|---|
| EP20163940.8A Active EP3719714B1 (fr) | 2019-04-04 | 2020-03-18 | Système d'apprentissage machine pour classifier une zone comme carrossable |
| EP20163960.6A Pending EP3719715A1 (fr) | 2019-04-04 | 2020-03-18 | Procédé d'apprentissage machine pour classifier une zone comme carrossable |
Country Status (4)
| Country | Link |
|---|---|
| US (5) | US10699564B1 (fr) |
| EP (3) | EP3719714B1 (fr) |
| DE (3) | DE20163940T1 (fr) |
| ES (3) | ES2793575T1 (fr) |
Families Citing this family (14)
| Publication number | Priority date | Publication date | Assignee | Title |
|---|---|---|---|---|
| US10877947B2 (en) | 2018-12-11 | 2020-12-29 | SafeGraph, Inc. | Deduplication of metadata for places |
| US11531109B2 (en) * | 2019-03-30 | 2022-12-20 | Intel Corporation | Technologies for managing a world model of a monitored area |
| US10699564B1 (en) | 2019-04-04 | 2020-06-30 | Geotab Inc. | Method for defining intersections using machine learning |
| US11403938B2 (en) | 2019-04-04 | 2022-08-02 | Geotab Inc. | Method for determining traffic metrics of a road network |
| US11335191B2 (en) | 2019-04-04 | 2022-05-17 | Geotab Inc. | Intelligent telematics system for defining road networks |
| US11335189B2 (en) | 2019-04-04 | 2022-05-17 | Geotab Inc. | Method for defining road networks |
| US11341846B2 (en) | 2019-04-04 | 2022-05-24 | Geotab Inc. | Traffic analytics system for defining road networks |
| US11837084B2 (en) * | 2019-05-13 | 2023-12-05 | Nippon Telegraph And Telephone Corporation | Traffic flow estimation apparatus, traffic flow estimation method, traffic flow estimation program, and storage medium storing traffic flow estimation program |
| US11530961B2 (en) | 2019-11-07 | 2022-12-20 | Geotab, Inc. | Vehicle vocation system |
| US11762914B2 (en) | 2020-10-06 | 2023-09-19 | SafeGraph, Inc. | Systems and methods for matching multi-part place identifiers |
| US11899696B2 (en) * | 2020-10-06 | 2024-02-13 | SafeGraph, Inc. | Systems and methods for generating multi-part place identifiers |
| CN117581568A (zh) * | 2021-04-30 | 2024-02-20 | 瑞典爱立信有限公司 | 确定终端装置的移动路径 |
| US11922704B2 (en) | 2021-12-15 | 2024-03-05 | GM Global Technology Operations LLC | System and method for detecting road and lane connections at intersections |
| CN117496476B (zh) * | 2024-01-02 | 2024-03-26 | 安徽蔚来智驾科技有限公司 | 路网生成方法、可读存储介质及智能设备 |
Citations (6)
| Publication number | Priority date | Publication date | Assignee | Title |
|---|---|---|---|---|
| US20110106416A1 (en) * | 2009-04-22 | 2011-05-05 | Christopher Laurence Scofield | Predicting expected road traffic conditions based on historical and current data |
| US20170076227A1 (en) * | 2014-03-03 | 2017-03-16 | Inrix Inc., | Traffic obstruction detection |
| EP3032454B1 (fr) * | 2014-12-10 | 2018-09-26 | Honda Research Institute Europe GmbH | Procédé et système pour une analyse de scène à base de rayon adaptatif d'espaces de trafic sémantique et véhicule équipé d'un tel système |
| US20190024781A1 (en) * | 2017-07-24 | 2019-01-24 | Caterpillar Inc. | System and method for predicting and responding to soft underfoot conditions |
| US10216189B1 (en) * | 2017-08-23 | 2019-02-26 | Uber Technologies, Inc. | Systems and methods for prioritizing object prediction for autonomous vehicles |
| US10235882B1 (en) * | 2018-03-19 | 2019-03-19 | Derq Inc. | Early warning and collision avoidance |
Family Cites Families (168)
| Publication number | Priority date | Publication date | Assignee | Title |
|---|---|---|---|---|
| US5488559A (en) | 1993-08-02 | 1996-01-30 | Motorola, Inc. | Map-matching with competing sensory positions |
| US7551104B2 (en) | 2001-08-16 | 2009-06-23 | Welping Meng | Traffic control method and apparatus |
| AUPS065802A0 (en) | 2002-02-20 | 2002-03-14 | Rhino Advertising Pty Limited | A method of placing visible advertising |
| JP4255007B2 (ja) * | 2003-04-11 | 2009-04-15 | 株式会社ザナヴィ・インフォマティクス | ナビゲーション装置、およびその旅行時間算出方法 |
| US20110298603A1 (en) | 2006-03-06 | 2011-12-08 | King Timothy I | Intersection Collision Warning System |
| US7460948B2 (en) | 2006-03-10 | 2008-12-02 | Gm Global Technology Operations, Inc. | Traffic notification system for reporting traffic anomalies based on historical probe vehicle data |
| KR101539774B1 (ko) | 2006-03-16 | 2015-07-29 | 엠.브루베이커 커티스 | 이동 객체에 하이퍼-관련 광고의 표시를 통한 수익 획득 시스템 및 방법 |
| US8457682B2 (en) | 2008-03-04 | 2013-06-04 | Dbsd Satellite Services G.P. | Method and system for integrated satellite assistance services |
| EP2223043A1 (fr) | 2007-12-28 | 2010-09-01 | Tele Atlas B.V. | Procédé et appareil de combinaison d'une première division d'une première base de données de cartes numériques et d'une seconde division d'une seconde base de données de cartes numériques |
| US8284069B2 (en) * | 2008-07-15 | 2012-10-09 | Cadec Global, Inc. | System and method for detecting a boundary crossing event |
| GB0822893D0 (en) | 2008-12-16 | 2009-01-21 | Tele Atlas Bv | Advanced speed profiles - Further updates |
| CN101764434B (zh) * | 2008-12-22 | 2014-05-14 | 爱信艾达株式会社 | 受电引导装置 |
| WO2011023246A1 (fr) | 2009-08-25 | 2011-03-03 | Tele Atlas B.V. | Système de navigation pour véhicule et procédé associé |
| US9466212B1 (en) | 2010-01-05 | 2016-10-11 | Sirius Xm Radio Inc. | System and method for improved updating and annunciation of traffic enforcement camera information in a vehicle using a broadcast content delivery service |
| EP2545539A4 (fr) | 2010-03-11 | 2017-12-27 | Inrix, Inc. | Apprentissage de chemins de navigation routière basé sur le comportement agrégé des conducteurs |
| US20160086393A1 (en) | 2010-05-17 | 2016-03-24 | The Travelers Indemnity Company | Customized vehicle monitoring privacy system |
| US11465640B2 (en) | 2010-06-07 | 2022-10-11 | Affectiva, Inc. | Directed control transfer for autonomous vehicles |
| US8327284B2 (en) * | 2010-08-24 | 2012-12-04 | Apple Inc. | Acquisition and presentation of dynamic media asset information for events |
| US9484046B2 (en) | 2010-11-04 | 2016-11-01 | Digimarc Corporation | Smartphone-based methods and systems |
| GB201018815D0 (en) | 2010-11-08 | 2010-12-22 | Tomtom Int Bv | High-definition weather for improved routing and navigation systems |
| JP5632762B2 (ja) | 2011-01-25 | 2014-11-26 | パナソニック株式会社 | 測位情報形成装置、検出装置、及び測位情報形成方法 |
| EP2500887B1 (fr) | 2011-03-17 | 2020-09-09 | Harman Becker Automotive Systems GmbH | Description d'un segment de route au moyen de la norme ISO 17572-3 |
| US8630958B2 (en) | 2011-06-03 | 2014-01-14 | Cardinal Optimization, Inc. | Systems and methods for multi-vehicle resource allocation and routing solutions |
| US9014955B2 (en) | 2011-07-20 | 2015-04-21 | Sumitomo Electric Industries, Ltd. | Traffic evaluation device non-transitory recording medium and traffic evaluation method |
| US11074495B2 (en) | 2013-02-28 | 2021-07-27 | Z Advanced Computing, Inc. (Zac) | System and method for extremely efficient image and pattern recognition and artificial intelligence platform |
| US9916538B2 (en) | 2012-09-15 | 2018-03-13 | Z Advanced Computing, Inc. | Method and system for feature detection |
| US9298575B2 (en) | 2011-10-12 | 2016-03-29 | Lytx, Inc. | Drive event capturing based on geolocation |
| US9020760B2 (en) | 2012-02-08 | 2015-04-28 | Telogis, Inc. | System for classifying streets for vehicle navigation |
| US9014876B2 (en) | 2012-06-19 | 2015-04-21 | Telogis, Inc. | System for processing fleet vehicle operation information |
| GB201211636D0 (en) | 2012-06-29 | 2012-08-15 | Tomtom Belgium Nv | Method and apparatus for detecting deviations from map data |
| US9412271B2 (en) | 2013-01-30 | 2016-08-09 | Wavetronix Llc | Traffic flow through an intersection by reducing platoon interference |
| GB2522728A (en) | 2014-01-31 | 2015-08-05 | Cambridge Consultants | Monitoring device |
| US9779357B1 (en) | 2013-03-07 | 2017-10-03 | Steve Dabell | Method and apparatus for providing estimated patrol properties and historic patrol records |
| US8963740B2 (en) | 2013-03-14 | 2015-02-24 | Microsoft Corporation | Crowd-sourced parking advisory |
| US9437107B2 (en) | 2013-03-15 | 2016-09-06 | Inrix, Inc. | Event-based traffic routing |
| US20140279707A1 (en) | 2013-03-15 | 2014-09-18 | CAA South Central Ontario | System and method for vehicle data analysis |
| WO2014197497A2 (fr) | 2013-06-03 | 2014-12-11 | The Morey Corporation | Systèmes, procédés et appareils de traçage de bien géospatial, pour acquérir, manipuler et présenter des métadonnées télématiques |
| US9830813B2 (en) | 2013-06-18 | 2017-11-28 | Carnegie Mellon University, A Pennsylvania Non-Profit Corporation | Smart and scalable urban signal networks: methods and systems for adaptive traffic signal control |
| KR101753331B1 (ko) | 2013-07-30 | 2017-07-03 | 주식회사 위트 | 대역폭 결합, 끊김 없는 이동성과 흐름 기반 라우팅을 구비한 p2p 차량 애드혹 네트워크 |
| US8935036B1 (en) | 2013-09-06 | 2015-01-13 | State Farm Mutual Automobile Insurance Company | Systems and methods for updating a driving tip model using telematics data |
| US9293041B2 (en) | 2014-04-02 | 2016-03-22 | International Business Machines Corporation | Traffic monitoring via telecommunication data |
| US9142127B1 (en) * | 2014-04-29 | 2015-09-22 | Maxwell Consulting, LLC | Systems and methods for traffic guidance nodes and traffic navigating entities |
| JP2015212863A (ja) | 2014-05-01 | 2015-11-26 | 住友電気工業株式会社 | 交通信号制御装置、交通信号制御方法、及びコンピュータプログラム |
| US20150363828A1 (en) | 2014-06-16 | 2015-12-17 | Rsm Technologies Inc. | Traffic adaptive digital billboard control system |
| US9783159B1 (en) | 2014-07-21 | 2017-10-10 | State Farm Mutual Automobile Insurance Company | Methods of theft prevention or mitigation |
| AU2015296645A1 (en) * | 2014-07-28 | 2017-02-16 | Econolite Group, Inc. | Self-configuring traffic signal controller |
| US9759812B2 (en) * | 2014-10-02 | 2017-09-12 | Trimble Inc. | System and methods for intersection positioning |
| US20160148507A1 (en) * | 2014-11-20 | 2016-05-26 | Blyncsy, Inc. | Traffic system for monitoring, analyzing, and modulating traffic patterns |
| JP6421580B2 (ja) | 2014-12-15 | 2018-11-14 | 住友電気工業株式会社 | 交通信号制御装置、コンピュータプログラム、及び交通信号制御方法 |
| KR20160087713A (ko) * | 2015-01-14 | 2016-07-22 | 유영근 | 통행차량 검지를 위한 검지영역 설정 방법과 이를 이용한 교통 신호 제어방법. |
| US10726863B2 (en) * | 2015-04-27 | 2020-07-28 | Otocon Inc. | System and method for locating mobile noise source |
| US20160364739A1 (en) * | 2015-06-09 | 2016-12-15 | Inrix, Inc. | Driver movement analysis |
| JP6498542B2 (ja) * | 2015-06-17 | 2019-04-10 | 日立建機株式会社 | 管制制御システム及び車載端末装置 |
| CN104978420B (zh) * | 2015-06-30 | 2018-09-07 | 百度在线网络技术(北京)有限公司 | 行车路线匹配方法和装置 |
| US20170072850A1 (en) | 2015-09-14 | 2017-03-16 | Pearl Automation Inc. | Dynamic vehicle notification system and method |
| US20170089717A1 (en) * | 2015-09-29 | 2017-03-30 | Garmin Switzerland Gmbh | Use of road lane data to improve traffic probe accuracy |
| US11250335B2 (en) | 2015-10-26 | 2022-02-15 | NetraDyne, Inc. | Joint processing for embedded data inference |
| WO2017079341A2 (fr) | 2015-11-04 | 2017-05-11 | Zoox, Inc. | Extraction automatisée d'informations sémantiques pour améliorer des modifications de cartographie différentielle pour véhicules robotisés |
| US9734455B2 (en) | 2015-11-04 | 2017-08-15 | Zoox, Inc. | Automated extraction of semantic information to enhance incremental mapping modifications for robotic vehicles |
| US10096253B2 (en) | 2015-11-30 | 2018-10-09 | Honeywell International Inc. | Methods and systems for presenting diversion destinations |
| WO2017100306A1 (fr) | 2015-12-07 | 2017-06-15 | Uptake Technologies, Inc. | Dispositif d'analyse local |
| US10013820B2 (en) | 2015-12-15 | 2018-07-03 | Freeport-Mcmoran Inc. | Vehicle speed-based analytics |
| US10395332B1 (en) | 2016-01-22 | 2019-08-27 | State Farm Mutual Automobile Insurance Company | Coordinated autonomous vehicle automatic area scanning |
| US10386192B1 (en) | 2016-01-22 | 2019-08-20 | State Farm Mutual Automobile Insurance Company | Autonomous vehicle routing |
| US9903733B2 (en) | 2016-03-17 | 2018-02-27 | Honda Motor Co., Ltd. | Vehicular communications network and methods of use and manufacture thereof |
| WO2017157449A1 (fr) | 2016-03-17 | 2017-09-21 | Swiss Reinsurance Company Ltd. | Système télématique et procédé correspondant associé |
| US10346131B2 (en) | 2016-03-25 | 2019-07-09 | International Business Machines Corporation | Spatial predicates evaluation on geohash-encoded geographical regions |
| US10042055B2 (en) | 2016-04-20 | 2018-08-07 | Here Global B.V. | Traffic volume estimation |
| US10151592B2 (en) | 2016-04-28 | 2018-12-11 | Here Global B.V. | Map matching quality evaluation |
| WO2017192358A1 (fr) * | 2016-05-06 | 2017-11-09 | Pcms Holdings, Inc. | Procédé et système de détection collaborative pour mise à jour de couches de carte dynamiques |
| BR112018074698A2 (pt) | 2016-05-30 | 2019-03-19 | Nissan Motor Co., Ltd. | método de detecção de objeto e aparelho de detecção de objeto |
| US20170349148A1 (en) | 2016-06-03 | 2017-12-07 | GM Global Technology Operations LLC | Method and apparatus for detecting road condition data and weather condition data using vehicular crowd-sensing |
| CN109416873B (zh) | 2016-06-24 | 2022-02-15 | 瑞士再保险有限公司 | 具有自动化风险控制系统的自主或部分自主机动车辆及其相应方法 |
| WO2018019354A1 (fr) | 2016-07-25 | 2018-02-01 | Swiss Reinsurance Company Ltd. | Appareil pour un moteur de recherche de connexion télématique, basé sur un score et dynamique, et agrégateur et procédé correspondant |
| US11715369B2 (en) | 2016-08-15 | 2023-08-01 | University Of Southern California | Latent space model for road networks to predict time-varying traffic |
| WO2018039142A1 (fr) | 2016-08-22 | 2018-03-01 | Rapidsos, Inc. | Analyse prédictive de détection d'urgence et gestion d'intervention |
| US10438493B2 (en) | 2016-08-24 | 2019-10-08 | Uber Technologies, Inc. | Hybrid trip planning for autonomous vehicles |
| US10712746B2 (en) | 2016-08-29 | 2020-07-14 | Baidu Usa Llc | Method and system to construct surrounding environment for autonomous vehicles to make driving decisions |
| US10359295B2 (en) | 2016-09-08 | 2019-07-23 | Here Global B.V. | Method and apparatus for providing trajectory bundles for map data analysis |
| WO2018046102A1 (fr) | 2016-09-10 | 2018-03-15 | Swiss Reinsurance Company Ltd. | Système automatisé basé sur la télématique avec déclenchement et fonctionnement commandés par score de systèmes de transfert de risque d'économie de partage automatisé et procédé correspondant |
| US10733460B2 (en) | 2016-09-14 | 2020-08-04 | Nauto, Inc. | Systems and methods for safe route determination |
| WO2018053175A1 (fr) | 2016-09-14 | 2018-03-22 | Nauto Global Limited | Systèmes et procédés de détermination de quasi-collision |
| US10565279B2 (en) * | 2016-10-05 | 2020-02-18 | Uber Technologies, Inc. | Contextual search for location services |
| US10857994B2 (en) | 2016-10-20 | 2020-12-08 | Motional Ad Llc | Identifying a stopping place for an autonomous vehicle |
| US11627450B2 (en) | 2016-10-20 | 2023-04-11 | Motional Ad Llc | Identifying stopping place for autonomous vehicle |
| US10331129B2 (en) | 2016-10-20 | 2019-06-25 | nuTonomy Inc. | Identifying a stopping place for an autonomous vehicle |
| US10040464B2 (en) | 2016-10-21 | 2018-08-07 | Westinghouse Air Brake Technologies Corporation | System and method for providing location and navigation services using positive train control data |
| KR101927182B1 (ko) * | 2016-11-15 | 2018-12-10 | 현대자동차 주식회사 | 위험상황 경고 장치 및 위험상황 경고 방법이 구현된 컴퓨터로 판독 가능한 기록매체 |
| US10943283B2 (en) | 2016-11-18 | 2021-03-09 | Cummins Inc. | Service location recommendation tailoring |
| US11194846B2 (en) | 2016-11-28 | 2021-12-07 | Here Global B.V. | Method and apparatus for providing automated generation of parking restriction data using machine learning |
| JP6638633B2 (ja) * | 2016-12-06 | 2020-01-29 | トヨタ自動車株式会社 | 自動運転システム |
| US10429194B2 (en) | 2016-12-30 | 2019-10-01 | DeepMap Inc. | High definition map updates with vehicle data load balancing |
| US9969386B1 (en) * | 2017-01-10 | 2018-05-15 | Mitsubishi Electric Research Laboratories, Inc. | Vehicle automated parking system and method |
| US11619951B2 (en) | 2017-01-23 | 2023-04-04 | Massachusetts Institute Of Technology | On-demand high-capacity ride-sharing via dynamic trip-vehicle assignment with future requests |
| US20180210892A1 (en) | 2017-01-25 | 2018-07-26 | Uber Technologies, Inc. | Object or image search within a geographic region by a network system |
| US20180233035A1 (en) | 2017-02-10 | 2018-08-16 | Nec Europe Ltd. | Method and filter for floating car data sources |
| US10352709B1 (en) * | 2017-02-15 | 2019-07-16 | Amazon Technologies, Inc. | Identification of road segments |
| US10095234B2 (en) | 2017-03-07 | 2018-10-09 | nuTonomy Inc. | Planning for unknown objects by an autonomous vehicle |
| US20180281815A1 (en) | 2017-03-31 | 2018-10-04 | Uber Technologies, Inc. | Predictive teleassistance system for autonomous vehicles |
| US10339808B2 (en) | 2017-04-03 | 2019-07-02 | Here Global B.V. | Predicting parking vacancies based on activity codes |
| US9769616B1 (en) * | 2017-04-04 | 2017-09-19 | Lyft, Inc. | Geohash-related location predictions |
| US20180299893A1 (en) | 2017-04-18 | 2018-10-18 | nuTonomy Inc. | Automatically perceiving travel signals |
| WO2018208591A1 (fr) | 2017-05-06 | 2018-11-15 | The Texas A&M University System | Procédé et système de communication pour véhicule et surveillance de la sécurité d'un environnement de conduite pour fournir des avertissements précoces en temps réel |
| US10060751B1 (en) * | 2017-05-17 | 2018-08-28 | Here Global B.V. | Method and apparatus for providing a machine learning approach for a point-based map matcher |
| US11816981B2 (en) | 2017-05-23 | 2023-11-14 | D.R Roads A.I Ltd. | Traffic monitoring and management systems and methods |
| US20180365995A1 (en) | 2017-06-14 | 2018-12-20 | Trw Automotive U.S. Llc | Automobile communication system using unmanned air vehicle intermediary |
| US10433120B2 (en) | 2017-06-16 | 2019-10-01 | At&T Intellectual Property I, L.P. | Network broadcast of data to internet of things (IOT) devices using a dedicated system information block (SIB) in long term evolution (LTE) and/or fifth generation (5G) next radio networks |
| US10600322B2 (en) | 2017-06-21 | 2020-03-24 | International Business Machines Corporation | Management of mobile objects |
| US10496099B2 (en) | 2017-07-18 | 2019-12-03 | Uatc, Llc | Systems and methods for speed limit context awareness |
| US10579063B2 (en) | 2017-07-21 | 2020-03-03 | Uatc, Llc | Machine learning for predicting locations of objects perceived by autonomous vehicles |
| US10330486B2 (en) | 2017-08-08 | 2019-06-25 | Gm Global Technology Operations Llc. | Context-aware vehicle communications system and control logic with adaptive crowd-sensing capabilities |
| US10313413B2 (en) | 2017-08-28 | 2019-06-04 | Banjo, Inc. | Detecting events from ingested communication signals |
| WO2019048034A1 (fr) | 2017-09-06 | 2019-03-14 | Swiss Reinsurance Company Ltd. | Système électronique d'identification de suivi et de consignation pour dispositifs télématiques, et procédé correspondant associé |
| US10809728B2 (en) | 2017-09-15 | 2020-10-20 | Here Global B.V. | Lane-centric road network model for navigation |
| US20190101914A1 (en) | 2017-10-02 | 2019-04-04 | Allstate Insurance Company | Data Processing System with Machine Learning Engine for Providing Driving Data Analysis and Vehicle Control Functions |
| US11692837B2 (en) | 2017-10-18 | 2023-07-04 | Here Global B.V. | Automatic discovery of optimal routes for flying cars and drones |
| US10606270B2 (en) | 2017-10-18 | 2020-03-31 | Luminar Technologies, Inc. | Controlling an autonomous vehicle using cost maps |
| US20190120640A1 (en) | 2017-10-19 | 2019-04-25 | rideOS | Autonomous vehicle routing |
| EP3698340A4 (fr) | 2017-10-20 | 2021-07-14 | Zendrive, Inc. | Procédé et système pour communications véhiculaires |
| US10755558B2 (en) | 2017-10-25 | 2020-08-25 | Here Global B.V. | Method, apparatus, and system for detecting venue trips and related road traffic |
| US10967862B2 (en) | 2017-11-07 | 2021-04-06 | Uatc, Llc | Road anomaly detection for autonomous vehicle |
| US20190147320A1 (en) * | 2017-11-15 | 2019-05-16 | Uber Technologies, Inc. | "Matching Adversarial Networks" |
| US10650670B2 (en) | 2017-11-16 | 2020-05-12 | Here Global B.V. | Method and apparatus for publishing road event messages |
| US10198002B2 (en) * | 2017-11-21 | 2019-02-05 | GM Global Technology Operations LLC | Systems and methods for unprotected left turns in high traffic situations in autonomous vehicles |
| US10629069B2 (en) | 2017-12-14 | 2020-04-21 | Here Global B.V. | Method and apparatus for providing a localized link-centric metric for directional traffic propagation |
| US10908614B2 (en) | 2017-12-19 | 2021-02-02 | Here Global B.V. | Method and apparatus for providing unknown moving object detection |
| US10726644B2 (en) | 2017-12-22 | 2020-07-28 | Lyft, Inc. | Fleet maintenance management for autonomous vehicles |
| US10775186B2 (en) | 2017-12-29 | 2020-09-15 | ANI Technologies Private Limited | Method and system for predicting traffic conditions |
| US10670411B2 (en) | 2017-12-29 | 2020-06-02 | Lyft Inc. | Efficient matching of service providers and service requests across a fleet of autonomous vehicles |
| WO2019168869A1 (fr) | 2018-02-27 | 2019-09-06 | Nvidia Corporation | Détection en temps réel de voies et de limites par des véhicules autonomes |
| US10798368B2 (en) | 2018-03-13 | 2020-10-06 | Lyft, Inc. | Exposure coordination for multiple cameras |
| US11544584B2 (en) | 2018-03-26 | 2023-01-03 | Adp, Inc. | Commute distance optimization |
| US10816981B2 (en) | 2018-04-09 | 2020-10-27 | Diveplane Corporation | Feature analysis in computer-based reasoning models |
| FR3079956B1 (fr) * | 2018-04-10 | 2021-12-24 | Transdev Group | Dispositif electronique et procede de surveillance d'une zone d'intersection routiere a destination de vehicule(s) automobile(s) autonome(s), programme d'ordinateur associe |
| US10559197B2 (en) * | 2018-04-13 | 2020-02-11 | Toyota Jidosha Kabushiki Kaisha | Remote vehicle control at intersections |
| US10818165B2 (en) | 2018-04-19 | 2020-10-27 | Here Global B.V. | Method, apparatus, and system for propagating learned traffic sign data in a road network |
| US11107347B2 (en) * | 2018-04-27 | 2021-08-31 | Cubic Corporation | Adaptively controlling traffic movements for driver safety |
| US10306430B1 (en) | 2018-04-27 | 2019-05-28 | Lyft, Inc. | Vehicle-to-infrastructure communication |
| US11138745B2 (en) | 2018-04-30 | 2021-10-05 | Uatc, Llc | Object association for autonomous vehicles |
| US10909866B2 (en) | 2018-07-20 | 2021-02-02 | Cybernet Systems Corp. | Autonomous transportation system and methods |
| US10942030B2 (en) | 2018-08-17 | 2021-03-09 | Lyft, Inc. | Road segment similarity determination |
| US11861458B2 (en) | 2018-08-21 | 2024-01-02 | Lyft, Inc. | Systems and methods for detecting and recording anomalous vehicle events |
| US10698408B2 (en) | 2018-08-30 | 2020-06-30 | Pony Ai Inc. | Distributed sensing for vehicle navigation |
| US20200098253A1 (en) | 2018-09-25 | 2020-03-26 | Smev Ag Smart Mobility Evolution | Procedure and apparatus for controlling a traffic management system |
| US10909188B2 (en) * | 2018-10-12 | 2021-02-02 | Black Hills Ip Holdings, Llc | Machine learning techniques for detecting docketing data anomalies |
| US10922966B2 (en) | 2018-10-31 | 2021-02-16 | Mitsubishi Electric Research Laboratories, Inc. | System and method for asymmetric traffic control |
| US10852726B2 (en) | 2018-11-13 | 2020-12-01 | Toyota Research Institute, Inc. | Systems and methods for transitioning a vehicle from an autonomous driving mode to a manual driving mode |
| US10789535B2 (en) | 2018-11-26 | 2020-09-29 | Cartica Ai Ltd | Detection of road elements |
| US11322025B2 (en) | 2018-12-12 | 2022-05-03 | Here Global B.V. | Method and system for validating existence of roadwork |
| US11681294B2 (en) * | 2018-12-12 | 2023-06-20 | Here Global B.V. | Method and system for prediction of roadwork zone |
| US10891518B1 (en) * | 2018-12-14 | 2021-01-12 | Waymo Llc | Auto labeler |
| US20200209005A1 (en) | 2018-12-26 | 2020-07-02 | Didi Research America, Llc | Systems and methods for loading object geometry data on a vehicle |
| US11153721B2 (en) | 2018-12-27 | 2021-10-19 | Intel Corporation | Sensor network enhancement mechanisms |
| US10990105B2 (en) | 2018-12-28 | 2021-04-27 | Beijing Voyager Technology Co., Ltd. | Vehicle-based virtual stop and yield line detection |
| US10991244B2 (en) | 2018-12-28 | 2021-04-27 | Beijing Voyager Technology Co., Ltd. | On-board vehicle stop cause determination system |
| US20200211370A1 (en) | 2018-12-28 | 2020-07-02 | Didi Research America, Llc | Map editing using vehicle-provided data |
| US11164406B2 (en) | 2019-01-25 | 2021-11-02 | Ford Global Technologies, Llc | Real-time emissions estimation and monitoring |
| US11567514B2 (en) | 2019-02-11 | 2023-01-31 | Tesla, Inc. | Autonomous and user controlled vehicle summon to a target |
| US11118916B2 (en) | 2019-02-14 | 2021-09-14 | Here Global B.V. | Method, apparatus, and system for providing a campaign management platform to discover map data |
| US10750374B1 (en) | 2019-02-22 | 2020-08-18 | Toyota Jidosha Kabushiki Kaisha | Managing regionalized vehicular communication |
| US11145197B2 (en) | 2019-03-13 | 2021-10-12 | Mitsubishi Electric Research Laboratories, Inc. | Joint control of vehicles traveling on different intersecting roads |
| US11086322B2 (en) | 2019-03-19 | 2021-08-10 | Gm Cruise Holdings Llc | Identifying a route for an autonomous vehicle between an origin and destination location |
| US11181922B2 (en) | 2019-03-29 | 2021-11-23 | Zoox, Inc. | Extension of autonomous driving functionality to new regions |
| US11335191B2 (en) | 2019-04-04 | 2022-05-17 | Geotab Inc. | Intelligent telematics system for defining road networks |
| US10699564B1 (en) | 2019-04-04 | 2020-06-30 | Geotab Inc. | Method for defining intersections using machine learning |
| US11335189B2 (en) | 2019-04-04 | 2022-05-17 | Geotab Inc. | Method for defining road networks |
| US11403938B2 (en) | 2019-04-04 | 2022-08-02 | Geotab Inc. | Method for determining traffic metrics of a road network |
| US11341846B2 (en) | 2019-04-04 | 2022-05-24 | Geotab Inc. | Traffic analytics system for defining road networks |
-
2019
- 2019-06-18 US US16/444,228 patent/US10699564B1/en active Active
- 2019-06-21 US US16/448,694 patent/US11423773B2/en active Active
- 2019-06-21 US US16/448,657 patent/US11410547B2/en active Active
- 2019-08-08 US US16/535,527 patent/US10916127B2/en active Active
-
2020
- 2020-03-18 DE DE20163940.8T patent/DE20163940T1/de active Pending
- 2020-03-18 EP EP20163940.8A patent/EP3719714B1/fr active Active
- 2020-03-18 EP EP20163960.6A patent/EP3719715A1/fr active Pending
- 2020-03-18 DE DE20163960.6T patent/DE20163960T1/de active Pending
- 2020-03-18 EP EP20163985.3A patent/EP3719716A1/fr active Pending
- 2020-03-18 ES ES20163940T patent/ES2793575T1/es active Pending
- 2020-03-18 ES ES20163960T patent/ES2794019T1/es active Pending
- 2020-03-18 ES ES20163985T patent/ES2794585T1/es active Pending
- 2020-03-18 DE DE20163985.3T patent/DE20163985T1/de active Pending
- 2020-05-08 US US16/870,859 patent/US11443617B2/en active Active
Patent Citations (6)
| Publication number | Priority date | Publication date | Assignee | Title |
|---|---|---|---|---|
| US20110106416A1 (en) * | 2009-04-22 | 2011-05-05 | Christopher Laurence Scofield | Predicting expected road traffic conditions based on historical and current data |
| US20170076227A1 (en) * | 2014-03-03 | 2017-03-16 | Inrix Inc., | Traffic obstruction detection |
| EP3032454B1 (fr) * | 2014-12-10 | 2018-09-26 | Honda Research Institute Europe GmbH | Procédé et système pour une analyse de scène à base de rayon adaptatif d'espaces de trafic sémantique et véhicule équipé d'un tel système |
| US20190024781A1 (en) * | 2017-07-24 | 2019-01-24 | Caterpillar Inc. | System and method for predicting and responding to soft underfoot conditions |
| US10216189B1 (en) * | 2017-08-23 | 2019-02-26 | Uber Technologies, Inc. | Systems and methods for prioritizing object prediction for autonomous vehicles |
| US10235882B1 (en) * | 2018-03-19 | 2019-03-19 | Derq Inc. | Early warning and collision avoidance |
Non-Patent Citations (1)
| Title |
|---|
| "THE 2013 INTERNATIONAL JOINT CONFERENCE ON NEURAL NETWORKS (IJCNN)", 4 August 2013, IEEE, ISSN: 2161-4393, article V. B. AZEVEDO ET AL.: "Real-time road surface mapping using stereo matching, v-disparity and machine learning", pages: 1 - 8, XP032542305 * |
Also Published As
| Publication number | Publication date |
|---|---|
| US11443617B2 (en) | 2022-09-13 |
| DE20163940T1 (de) | 2021-02-25 |
| US10916127B2 (en) | 2021-02-09 |
| US20200320862A1 (en) | 2020-10-08 |
| US11423773B2 (en) | 2022-08-23 |
| ES2793575T1 (es) | 2020-11-16 |
| EP3719714A1 (fr) | 2020-10-07 |
| DE20163985T1 (de) | 2021-02-25 |
| US20200320863A1 (en) | 2020-10-08 |
| ES2794585T1 (es) | 2020-11-18 |
| DE20163960T1 (de) | 2021-01-28 |
| EP3719714B1 (fr) | 2023-07-26 |
| EP3719715A1 (fr) | 2020-10-07 |
| US20200320865A1 (en) | 2020-10-08 |
| US20200320861A1 (en) | 2020-10-08 |
| ES2794019T1 (es) | 2020-11-17 |
| US10699564B1 (en) | 2020-06-30 |
| US11410547B2 (en) | 2022-08-09 |
Similar Documents
| Publication | Publication Date | Title |
|---|---|---|
| EP3719714B1 (fr) | Système d'apprentissage machine pour classifier une zone comme carrossable | |
| US11335191B2 (en) | Intelligent telematics system for defining road networks | |
| US11699100B2 (en) | System for determining traffic metrics of a road network | |
| US11341846B2 (en) | Traffic analytics system for defining road networks | |
| US11335189B2 (en) | Method for defining road networks | |
| US11315422B2 (en) | Glare detection system and methods for automated vehicular control | |
| US20190051172A1 (en) | Method and apparatus for providing a confidence-based road event message | |
| US11237007B2 (en) | Dangerous lane strands | |
| US9911332B1 (en) | Method, apparatus, and computer program product for parking likelihood estimation based on probe data collection | |
| EP4001843A1 (fr) | Procédé, appareil et système permettant de créer des cartes doublement numérisées | |
| CN110708664A (zh) | 一种交通流感知方法、装置及计算机存储介质、电子设备 | |
| EP4012336A2 (fr) | Procédé, appareil et système permettant d'identifier des zones spéciales et de nettoyer des données de carte | |
| US11898868B2 (en) | System and method for identifying redundant road lane detections | |
| EP3922947A2 (fr) | Système d'analyse du trafic pour définir les réseaux routiers | |
| EP3919860A1 (fr) | Système télématique intelligent permettant de définir des réseaux routiers | |
| EP3913551A1 (fr) | Procédé de définition de réseaux routiers | |
| EP3617651B1 (fr) | Utilisation d'une base de données géographiques comprenant des informations au niveau des voies pour la prédiction des paramètres de circulation |
Legal Events
| Date | Code | Title | Description |
|---|---|---|---|
| PUAI | Public reference made under article 153(3) epc to a published international application that has entered the european phase |
Free format text: ORIGINAL CODE: 0009012 |
|
| STAA | Information on the status of an ep patent application or granted ep patent |
Free format text: STATUS: THE APPLICATION HAS BEEN PUBLISHED |
|
| AK | Designated contracting states |
Kind code of ref document: A1 Designated state(s): AL AT BE BG CH CY CZ DE DK EE ES FI FR GB GR HR HU IE IS IT LI LT LU LV MC MK MT NL NO PL PT RO RS SE SI SK SM TR |
|
| AX | Request for extension of the european patent |
Extension state: BA ME |
|
| REG | Reference to a national code |
Ref country code: ES Ref legal event code: BA2A Ref document number: 2794585 Country of ref document: ES Kind code of ref document: T1 Effective date: 20201118 |
|
| REG | Reference to a national code |
Ref country code: DE Ref legal event code: R210 |
|
| STAA | Information on the status of an ep patent application or granted ep patent |
Free format text: STATUS: REQUEST FOR EXAMINATION WAS MADE |
|
| 17P | Request for examination filed |
Effective date: 20210325 |
|
| RBV | Designated contracting states (corrected) |
Designated state(s): AL AT BE BG CH CY CZ DE DK EE ES FI FR GB GR HR HU IE IS IT LI LT LU LV MC MK MT NL NO PL PT RO RS SE SI SK SM TR |
|
| STAA | Information on the status of an ep patent application or granted ep patent |
Free format text: STATUS: EXAMINATION IS IN PROGRESS |
|
| 17Q | First examination report despatched |
Effective date: 20220228 |