EP3394939B1 - System und verfahren zur etikettenfreien zytometrie basierend auf brillouin-lichtstreuung - Google Patents
System und verfahren zur etikettenfreien zytometrie basierend auf brillouin-lichtstreuung Download PDFInfo
- Publication number
- EP3394939B1 EP3394939B1 EP16880115.7A EP16880115A EP3394939B1 EP 3394939 B1 EP3394939 B1 EP 3394939B1 EP 16880115 A EP16880115 A EP 16880115A EP 3394939 B1 EP3394939 B1 EP 3394939B1
- Authority
- EP
- European Patent Office
- Prior art keywords
- brillouin
- sample
- lens
- cells
- detection unit
- Prior art date
- Legal status (The legal status is an assumption and is not a legal conclusion. Google has not performed a legal analysis and makes no representation as to the accuracy of the status listed.)
- Active
Links
Images







Classifications
-
- G—PHYSICS
- G01—MEASURING; TESTING
- G01N—INVESTIGATING OR ANALYSING MATERIALS BY DETERMINING THEIR CHEMICAL OR PHYSICAL PROPERTIES
- G01N15/00—Investigating characteristics of particles; Investigating permeability, pore-volume or surface-area of porous materials
- G01N15/10—Investigating individual particles
- G01N15/14—Optical investigation techniques, e.g. flow cytometry
- G01N15/1434—Optical arrangements
-
- G—PHYSICS
- G01—MEASURING; TESTING
- G01N—INVESTIGATING OR ANALYSING MATERIALS BY DETERMINING THEIR CHEMICAL OR PHYSICAL PROPERTIES
- G01N15/00—Investigating characteristics of particles; Investigating permeability, pore-volume or surface-area of porous materials
- G01N15/10—Investigating individual particles
- G01N15/14—Optical investigation techniques, e.g. flow cytometry
- G01N15/1456—Optical investigation techniques, e.g. flow cytometry without spatial resolution of the texture or inner structure of the particle, e.g. processing of pulse signals
- G01N15/1459—Optical investigation techniques, e.g. flow cytometry without spatial resolution of the texture or inner structure of the particle, e.g. processing of pulse signals the analysis being performed on a sample stream
-
- G—PHYSICS
- G01—MEASURING; TESTING
- G01N—INVESTIGATING OR ANALYSING MATERIALS BY DETERMINING THEIR CHEMICAL OR PHYSICAL PROPERTIES
- G01N15/00—Investigating characteristics of particles; Investigating permeability, pore-volume or surface-area of porous materials
- G01N15/10—Investigating individual particles
- G01N15/14—Optical investigation techniques, e.g. flow cytometry
- G01N15/1468—Optical investigation techniques, e.g. flow cytometry with spatial resolution of the texture or inner structure of the particle
- G01N15/147—Optical investigation techniques, e.g. flow cytometry with spatial resolution of the texture or inner structure of the particle the analysis being performed on a sample stream
-
- G—PHYSICS
- G01—MEASURING; TESTING
- G01N—INVESTIGATING OR ANALYSING MATERIALS BY DETERMINING THEIR CHEMICAL OR PHYSICAL PROPERTIES
- G01N15/00—Investigating characteristics of particles; Investigating permeability, pore-volume or surface-area of porous materials
- G01N15/01—Investigating characteristics of particles; Investigating permeability, pore-volume or surface-area of porous materials specially adapted for biological cells, e.g. blood cells
-
- G—PHYSICS
- G01—MEASURING; TESTING
- G01N—INVESTIGATING OR ANALYSING MATERIALS BY DETERMINING THEIR CHEMICAL OR PHYSICAL PROPERTIES
- G01N15/00—Investigating characteristics of particles; Investigating permeability, pore-volume or surface-area of porous materials
- G01N15/10—Investigating individual particles
- G01N2015/1006—Investigating individual particles for cytology
-
- G—PHYSICS
- G01—MEASURING; TESTING
- G01N—INVESTIGATING OR ANALYSING MATERIALS BY DETERMINING THEIR CHEMICAL OR PHYSICAL PROPERTIES
- G01N15/00—Investigating characteristics of particles; Investigating permeability, pore-volume or surface-area of porous materials
- G01N15/10—Investigating individual particles
- G01N15/14—Optical investigation techniques, e.g. flow cytometry
- G01N2015/1493—Particle size
- G01N2015/1495—Deformation of particles
-
- G—PHYSICS
- G01—MEASURING; TESTING
- G01N—INVESTIGATING OR ANALYSING MATERIALS BY DETERMINING THEIR CHEMICAL OR PHYSICAL PROPERTIES
- G01N21/00—Investigating or analysing materials by the use of optical means, i.e. using sub-millimetre waves, infrared, visible or ultraviolet light
- G01N21/62—Systems in which the material investigated is excited whereby it emits light or causes a change in wavelength of the incident light
- G01N21/63—Systems in which the material investigated is excited whereby it emits light or causes a change in wavelength of the incident light optically excited
- G01N21/636—Systems in which the material investigated is excited whereby it emits light or causes a change in wavelength of the incident light optically excited using an arrangement of pump beam and probe beam; using the measurement of optical non-linear properties
- G01N2021/638—Brillouin effect, e.g. stimulated Brillouin effect
Definitions
- the present invention relates to a method and system for performing a label-free cell analysis based on Brillouin-light-scattering techniques.
- the method and system according to the present invention are based on Brillouin spectroscopy enabling simultaneous analysis of multiple samples and/or multiple points in a sample along the illuminating direction.
- the system and method according to the present invention can be employed in conjunction with a microfluidic system to analyze physical properties of cells without contact in non-disturbing manner.
- subcellular physical properties can be obtained by analyzing the Brillouin spectrum of a cell.
- Brillouin scattering is the phenomena of inelastic light scattering induced by acoustic phonon of a material.
- high-resolution spectrometer such as a multi-pass scanning Fabry-Perot interferometer is usually used in conventional Brillouin spectroscopy ( Lindsay S M, Burgess S and Shepherd I W, "Correction of Brillouin linewidths measured by multipass Fabry-Perot spectroscopy," Appl. Opt. 16(5), 1404-1407 (1977 )).
- VIPA phased array
- Xiao S, Weiner A M and Lin C "A Dispersion Law for Virtually Imaged Phased-Array Spectral Dispersers Based on Paraxial Wave Theory," IEEE J. Quantum Electronics 40(4), 420-426 (2004 ) and enables measuring all of the spectral components simultaneously by a CCD camera with high throughput.
- Xiao S, Weiner A M and Lin C "A Dispersion Law for Virtually Imaged Phased-Array Spectral Dispersers Based on Paraxial Wave Theory," IEEE J. Quantum Electronics 40(4), 420-426 (2004 ) and enables measuring all of the spectral components simultaneously by a CCD camera with high throughput.
- laser-scanning confocal Brillouin microscopy in biological tissue was performed at low illumination power and integration time, where each point in the sample is illuminated sequentially.
- the Brillouin spectrum was analyzed to create Brillouin-based elasticity maps ( Scarcelli G and Yun S H, "Confocal Brillouin microscopy for three-dimensional mechanical imaging," Nature Photonics 2, 39-43 (2007 ); Girard M J A, Dupps W J, Baskaran M, Scarcelli G, Yun S H, Quigley H A, Sigal I A and Strouthidis N G, “ Translating Ocular Biomechanics into Clinical Practice: Current State and Future Prospects," Curr. Eye Res. 40(1), 1-18 (2015 )).
- Brillouin spectroscopy allows non-invasive measurement of mechanical properties by measuring the frequency spectrum of acoustically-induced light scattering within a sample.
- Brillouin microscopy at sub-micron resolutions enabled the measurement of cell physicochemical properties ( Scarcelli G, Polacheck WJ, Nia HT, Patel K, Grodzinsky AJ, Kamm RD, Yun SH, "Noncontact three-dimensional mapping of intracellular hydromechanical properties by Brillouin microscopy ", Nat Methods. 12, 1132-1134 (2015 )).
- cell mechanical properties critically regulate many cellular functions, e.g. proliferation, migration, gene expression as well as system-level behaviors, e.g. tissue morphogenesis, metastasis, and angiogenesis.
- cytoskeleton is a dynamic and adaptive 3D structure that fills the cytoplasm, and thus maintains the overall shape of the cell.
- the movement of the nucleus must be coordinated with the cytoskeletal dynamics, and, as such, undergoes complex changes in position, stiffness, and shape, which in turn will affect the migration efficiency.
- both changes in the cytoskeleton and nucleus will affect the ability for cells to attach and move. Therefore, the ability to characterize the stiffness of cytoskeleton and nucleus can result in potent mechanical biomarkers for the metastatic potential of cancer cells.
- a method according to claim 1 is provided to simultaneously obtain one or more Brillouin metrics associated with a Brillouin scattering spectrum at multiple points within a sample.
- the sample is illuminated by a light beam along a first direction, wherein the illuminating light is provided by an illuminating source having a single wavelength in the UV, visible, or IR regime, either fixed or tunable around its center value.
- a Brillouin scattered light emitted from the sample in response to the illuminating light beam is collected and sent to an optical arrangement to induce a spectral dispersion and subsequently to a detection unit to generate a spatio-spectral pattern of the Brillouin scattered light.
- the optical arrangement and the detection unit are positioned along a second direction wherein the angle between the first direction and the second direction is any angle greater than 0°.
- the optical arrangement includes a virtually imaged phased array (VIPA), a Fabry-perot etalon, or an echelle grating and further omprises optical elements to modify size, shape, and/or angular spread of the spatio-spectral pattern in an optical path from the sample to the detection unit.
- the illuminating light beam is generated by a laser source and the detection unit is a CCD, CMOS camera, or an array of detectors.
- a spatio-spectral pattern of the Brillouin scattered light is detected onto the detection unit such that multiple points of the sample along the illuminating light beam are measured simultaneously.
- the spatio-spectral pattern is calibrated at each spatial point at the detection unit.
- One or more Brillouin metrics are calculated in the final step at each measured sample point based on the detected spatio-spectral pattern, wherein the one or more Brillouin metrics at each measured sample point are indicative of physical characteristics of the sample consisting of viscoelastic modulus, mass density, refractive index, electrostriction, and combination thereof, and the Brillouin metrics are selected from the group consisting of: Brillouin frequency shift, Brillouin spectrum line width, Brillouin gain or loss spectrom, and a combination thereof.
- a system according to claim 12 is provided to simultaneously obtain one or more Brillouin metrics associated with a Brillouin scattering spectrum at multiple points within a sample, wherein the sample is a biological sample including a biological organism, tissue, or biological cells.
- the system comprises a microfluidic device comprising one or more microfluidic channels, which microfluidic channels optionally contain 2D substrates or 3D extracellular matrices, wherein the biological sample is in the one or more microfluidic channels, and wherein when the biological sample is biological cells, the biological cells adhere to the 2D substrates or are cultured within the 3D extracellular matrices.
- the sample is illuminated by a light beam provided by a light source along a first direction.
- the illuminating light is provided by an illuminating source having a single wavelength in the UV, visible, or IR regime, either fixed or tunable around its center value.
- One or more lenses collect a Brillouin scattered light emitted from the sample in response to the illuminating light beam and guide the Brillouin scatted light to an optical arrangement to induce a spectral dispersion and subsequently to a detection unit
- the optical arrangement to induce a spectral dispersion includes a virtually imaged phased array (VIPA), a Fabry-Perot etalon, or an echelle grating.
- the optical arrangement, the one or more lenses, and the detection unit are positioned along a second direction, wherein the angle between the first direction and the second direction is any angle greater than 0°.
- the illuminating light beam is generated by a laser source and the detection unit is a CCD, CMOS camera, or an array of detectors.
- a spatio-spectral pattern of the Brillouin scattered light is detected onto the detection unit such that multiple points of the sample along the illuminating light beam are measured simultaneously.
- a processor in communication with the detection unit calibrates the spatio-spectral pattern at each spatial point at the detection unit to account for the angular dispersion at the VIPA. Furthermore, the processor calculates one or more Brillouin metrics at each measured sample point based on the detected spatio-spectral pattern. The one or more
- Brillouin metrics are selected from the group consisting of: Brillouin frequency shift, Brillouin spectrum line width, Brillouin gain or loss spectrum, and a combination thereof.
- the one or more Brillouin metrics at each measured sample point are indicative of physical characteristics of the sample, whereby the physical characteristics of the sample are selected from the group consisting of: viscoelastic modulus, mass density, refractive index, electrostriction, and a combination thereof.
- the present invention relates to a method and system of label-free cell analysis based on Brillouin spectroscopy.
- Brillouin scattered light emitted from a cell sample allows one to obtain physical information characterizing the sample.
- the sample is illuminated by a light beam along a first direction, and the emitted by the sample Brillouin scattered light is collected and detected along a second direction. Multiple positions of the sample along the first direction can be measured simultaneously thereby effectively improving the measurement throughput.
- biological cells in a sample can be classified based on subcellular information obtained from the Brillouin spectrum.
- Brillouin frequency shift is used as a metric.
- the mechanical and/or physical properties of a sample include viscoelastic modulus, mass density, refractive index, and electrostriction.
- Other metrics such as Brillouin spectrum line width, Brillouin gain or loss spectrum, and a combination thereof can be used for determining mechanical and/or physical properties of the measured sample.
- FIG. 1 demonstrates a Brillouin spectroscopy setup for a point-by-point scanning mode using epi-detection with a microfluidic channel 111.
- an incoming laser beam 110 is first guided by a beam splitter 113 and then focused onto the microfluidic channel 111 by an objective lens 112.
- the excited Brillouin scattering light is collected by the same objective lens 112 and guided to a collimator 115 by the beam splitter 113 and a mirror 114.
- the collimated beam after the collimator 115 is first focused by a cylindrical lens 116 and then sent into a VIPA 117.
- Different spectral components of incoming scattering light are separated in space by the VIPA 117 and focused by a spherical lens 118 to generate a spectral pattern.
- the spectral pattern is then imaged by a spherical lens 119 onto a detection unit 120.
- the detection unit 120 may be a camera.
- the spherical lens 119 may be not necessary and as such the camera 120 can be placed directly at the front focal plane of the spherical lens 118.
- FIG. 2 relates to one embodiment of the current invention using multiplexed Brillouin spectroscopy in conjunction with a microfluidic chip.
- an incoming illumination light beam 210 is reshaped by an objective lens 211 to generate a pencil beam within a microfluidic chip 212 having a sample.
- the detection path (along x-direction) leading to a detection unit 227 is orthogonal to the illumination path (along y-direction).
- the detection unit 227 may be a camera.
- the scattering light generated within the chip 212 is first collected by a second objective lens 220 and an intermediate image is generated at the focal plane of a tube lens 221.
- a spatial filter or aperture 228 is positioned in an intermediate image plane to reject out-of-focus light coming from the sample.
- a spherical lens 222 is placed such that the intermediate image is on its back focal plane, thus the light is collimated by the spherical lens 222.
- the collimated light is then focused by a cylindrical lens 223 in z-direction onto a VIPA 224.
- Different spectral components of incoming scattering light are separated in space by the VIPA 224 and focused by spherical lens 225 to generate spectral pattern.
- the spectral pattern is then imaged by spherical lens 226 onto a camera 227.
- three groups of beam lines with indicate different positions of the sample. It can be seen in FIG.
- the spherical lens 226 may be omitted such that the camera 227 is placed directly at the front focal plane of the spherical lens 225.
- the collimated beam from different position has different angle in xy-plane for the VIPA 224.
- This will result in an additional spatial shift of the spectra for the off-axis points with regard to the on-axis point, and thus the spectra along spatial dimension (i.e. y-direction) are not straight but curved on the camera 227. Accordingly, the incident angles of the scattering light from different points across the illumination line are different. This means that the scattering from different points in the sample will have slightly different path-length and dispersion within the VIPA etalon.
- the imaging magnification that occurs at the intermediate imaging plane of the lens 221 was minimized. After the spectral dispersion has occurred at the VIPA 224, the imaging magnification can be restored without affecting the curvature of spectral lines on the camera 227.
- the spectral calibration may be required.
- the spectral calibration can be performed at each pixel of the spatial line (corresponding to one point of the sample) using the location of the unshifted illuminating beam line at the various diffraction orders of the VIPA etalon.
- the illuminating beam lines are not available, there are two unknown parameters that are needed for calibration at each spatial point: free spectral range (FSR) and spectral dispersion factor. Therefore, a combination of results of two or more known samples is sufficient to solve for the unknown parameters.
- FSR free spectral range
- spectral dispersion factor spectral dispersion factor
- the spatial calibration can be avoided by using another embodiment of the current invention based on the multiplexed Brillouin spectroscopy as demonstrated in FIG. 3 .
- FIG. 3 illustrates a multiplexed Brillouin spectroscopy setup using a lens array according to another embodiment of the present invention.
- the illuminating path is the same as that in FIG. 2 .
- a microfluidic chip 312 is illuminated by the reshaped beam of the light 310 using the objective lens 311.
- the detection path (along x-direction) is in the normal direction of the illumination path (along y-direction).
- the scattering light generated within the chip 312 is first collected by a second objective lens 320.
- An intermediate image is generated at the focal plane of the tube lens 321.
- a spatial filter or aperture 330 is positioned in an intermediate image plane to reject out-of-focus light coming from the sample.
- each lenslet of the lens array 322 only accepts light from small portion of the intermediate image so that the entire image is divided into many sections and each is collimated by a lenslet independently. Because each small section is approximated as on-axis for a lenslet and all of the lenslets are well aligned, the overall collimated beam is parallel and the corresponding spectra will be straight.
- the collimated light is then sent into a VIPA 224.
- a pair of cylindrical lenses 325 and 326 is used to compress the output light of the VIPA 224 in order to fit the aperture of the lenslet of a second lens array 327.
- the spectral pattern is generated at the front focal plane of the lens array 327 and imaged onto the detection unit 329 by a spherical lens 328.
- the detection unit 329 may be a camera.
- the spherical lens 328 may be omitted, such that a camera 329 can be placed directly at the front focal plane of the lens array 327.
- the objective lens 211 in the illumination path (along y-axis) has a numerical aperture (NA) of 0.0175
- the objective lens 220 in the detection path (along x-axis) has a NA of 0.1
- the VIPA 224 has a free spectral range (FSR) of 17 GHz and entrance window of 20 mm.
- the camera 227 is an electron multiplying coupled charge device (EMCCD).
- FIGs.4a-e show the raw images captured by the camera when the knife edge was at different position. In these images, multiple spectral orders in spectral domain were shown. Each order contains a group of three fringes, with two Brillouin frequencies (Stokes and anti-Stokes shift) at both sides and laser frequency in between.
- FIG. 4a-e show the raw images captured by the camera when the knife edge was at different position. In these images, multiple spectral orders in spectral domain were shown. Each order contains a group of three fringes, with two Brillouin frequencies (Stokes and anti-Stokes shift) at both sides and laser frequency in between.
- 4f shows a linear relationship between the knife edge's movement and measured displacement. It indicated that one pixel of the camera is corresponding to a size of 2.45 ⁇ m of the sample. It also indicates that the current setup as shown in FIG. 2 can measure as large as 800 ⁇ m of the sample, so that more than 300 points can be measured simultaneously.
- a microfluidic channel made of fused silica glass has a width of 100 ⁇ m and a depth of 250 ⁇ m.
- the channel layer was sandwiched by two glass windows with a width of 500 ⁇ m.
- the channel located in the middle of a 2.54 cm by 5.08 cm (1-inch by 2-inch) chip, whose sides were polished to allow light beam to pass through.
- the chip was up-straight placed so that the liquid can flow in the channel along z-direction.
- the laser beam 210 illuminates the channel from the side of the chip.
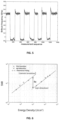
- FIG. 5 indicates that the flowing liquid in the microfluidic channel can be clearly identified by the multiplexed Brillouin spectroscopy. This experiment demonstrates the capability of the current invention in the application of flow cytometry.
- the signal-to-noise ratio (SNR) between the current invention ( FIG. 2 ) and conventional epi-detection setup ( FIG. 1 ) was compared.
- the SNR of each setup was measured at different input power density of the light and exposure time of the camera.
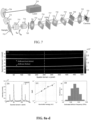
- FIG. 6 indicates that this invention is shot-noise limited (theoretical fitting) and has much higher SNR than conventional epi-detection at the same input energy density. In other words, this invention enables faster measurement than conventional epi-detection at the same SNR level.
- stimulated Brillouin scattering is usually much stronger than spontaneous Brillouin scattering.
- two lasers with tunable wavelength can be used to generate stimulated Brillouin scattering within the microfluidic channel to further enhance the signal.
- Example 2 relates to characterization of the multiplexed (line-scanned) Brillouin spectroscopy according to the embodiment of the current invention as shown in FIG. 7.
- FIG. 7 demonstrates a line-scanned Brillouin spectroscopy setup including a mirror 724, objective lenses 711, 713, and 714, a spherical lens 715 for beam collimation, cylindrical lenses 716, 718, and 719, and a spherical lens 722 for imaging purpose.
- a spatial filter or aperture 725 is positioned in an intermediate image plane to reject out-of-focus light coming from the sample.
- the spectral resolution of the spectrometer according to FIG. 7 was characterized in the current example.
- the light source 710 was a single mode 532-nm cw (continuous-wave) laser (Torus, LaserQuantum).
- a plastic cuvette 712 containing pure methanol is used as a sample.
- the original dispersion pattern obtained by the camera 723 is shown in FIG. 8a .
- the two gray lines of the top and bottom are elastic scattering frequency (same as laser's frequency) and the two bright lines in between are Brillouin frequencies (Stokes and Anti-Stokes components).
- the horizontal axis and vertical axis correspond to spatial and spectral domain, respectively.
- FIG. 8b shows the Brillouin spectrum at the location indicated by the dotted line in FIG. 8a . Since the free spectral range of the VIPA was 17 GHz, it could be calculated that the spectral resolution was 0.177 GHz per pixel. The finesse of about 35 was also confirmed by calculating the ratio of the space of successive laser frequency's peak and the full width at half maximum. The accuracy of the estimated Brillouin frequency shift was characterized by calculating the signal-to-noise-ratio (SNR) for each pixel in spatial domain. ) FIG. 8c shows a logarithmic plot of the SNR versus illumination energy. The SNRs in FIG. 8c were calculated with different illumination energy.
- SNR signal-to-noise-ratio
- FIG. 8d shows the representative distribution of the estimated Brillouin frequency at a single point for 100 times measurements, which has a Gaussian shape. The standard deviation of this distribution was used to estimate the accuracy of the estimated Brillouin frequency. In this case it is 8.5 MHz, which corresponds to the relative uncertainty of 0.22 %.
- a knife edge was placed right after the cuvette 712, but before the detection objective lens 713.
- a translational stage carrying the knife edge was moved in x-direction with step size of 25.4 ⁇ m, and the corresponding image of the knife edge was monitored by the spectrometer's camera 723.
- the result is shown in FIG. 9 .
- the measured data was linearly fitted, and thus the spatial resolution was calculated as 3.29 ⁇ m per pixel.
- the camera 723 had 512 by 512 pixels in total, which corresponded to nearly 1.68 mm in the sample plane. As shown in FIG.
- the spectral lines were not perfectly straight across the spatial dimension but had slight curvature due to the deviation of the incident angles of off-axis points at the VIPA 717. This curvature may result in variation of spectral resolution across the camera; the variation was minimized to less than 0.2 MHz per pixel, i.e. no more than 10 MHz within more than 1-mm spatial field of view. In some embodiments, this error can be avoided by calibration of spectral resolution at each point if necessary.
- Example 3 relates to characterization of two-dimensional and three-dimensional imaging based on the multiplexed Brillouin spectroscopy according to FIG. 7 .
- FIG. 10a shows a picture of the PMMA lens taken before filling cuvette with index-matching liquid.
- the lower is zoomed-in picture of the PMMA lens, the scale bar has a length of 500 ⁇ m.
- the PMMA lens was placed into a plastic cuvette, which was pre-filled with refractiveindex-matching liquid to reduce the scattering at the surface of the sample.
- the cuvette was carried by a vertically placed motorized translation stage, which enabled us to scan the sample in y-direction.
- the cuvette (sample 712 in FIG. 7 ) has a size of 10 mm by 10 mm.
- the margin of the PMMA lens was attached to the tip of a syringe's needle using optical adhesive, and then the end of the needle was fixed to the wall of the cuvette.
- the motorized translational stage T-LSM025A, Zaber
- the maximum speed of the translational stage can be as fast as 7 mm/s.
- a LabView program is used to synchronize the stage movement and camera acquisition so that the scanning could be carried out automatically.
- the laser power was 70 mW, and the exposure time of the camera was 0.1 second.
- the speed of the stage was set as 50 ⁇ m/sec so that 300 frames were captured within 30 seconds, which corresponded to a displacement of 1.5 mm in total.
- FIG. 10b is a snapshot of the representative signal acquired by the camera 723, in which only Brillouin frequency components were shown because the elastic frequencies were blocked by the slit 720. It is clearly shown in FIG. 10b that the PMMA lens was surrounded by the matching liquid.
- FIGs. 10c and 10d show the Brillouin spectra of the index-matching liquid and PMMA at a single point, respectively. The dots and solid curves correspond to measured and fitted data, respectively. Using the characterization data of the spectral resolution, the Brillouin frequency shifts of PMMA and the matching liquid were determined as 11.32 GHz and 9.11 GHz, respectively.
- FIG. 11 shows 2D and 3D Brillouin images of the PMMA lens.
- FIG. 11a indicates the scanned cross-section along the dotted line in FIG. 10a .
- the arrow indicates an illumination beam.
- FIG. 11b shows the 2D imaging of the PMMA lens immerged in the matching liquid based on the measured Brillouin frequency shift.
- the overall size of the image was around 1.1 mm by 1.5 mm.
- the interface between the PMMA lens and the matching liquid can be clearly seen from the image, and the inner region of the PMMA lens is pretty uniform.
- there is cross-talk between two Brillouin signatures corresponding to each material This cross-talk effect will introduce an ambiguous region at the interface if the two materials have similar Brillouin shift.
- FIG. 11d shows five slices of obtained cross-section images as the PMMA lens is moved along z-axis using another translational stage.
- the illuminating beam may be a laser beam and the detection unit 120, 227, 329, and 723may be a CCD, CMOS camera, or an array of detectors.
- the illuminating light is provided by an illuminating source having a single wavelength in the UV, visible, or IR regime, either fixed or tunable around its center value.
- the sample may be placed on a moving platform to move relative to the illuminating light beam during imaging or acquisition.
- the illuminating light beam may be moving relative to a static sample during imaging.
- the sample may be a biological sample including biological organism, tissue, or biological cells.
- the biological cells are living cells.
- the biological cells may be suspended, adherent to 2D substrates, or cultured within 3D extracellular matrices while measuring Brillouin metrics.
- the spectrum detected on the camera 120, 227, 329, and 723 is a spatio-spectral pattern of the Brillouin scattered light.
- One or more Brillouin metrics can be calculated at each measured sample point based on the detected spatio-spectral pattern.
- a Brillouin metric may be a Brillouin frequency shift, Brillouin spectrum line width, Brillouin gain or loss spectrum, and a combination thereof.
- Each of the Brillouin metrics measured at a sample point is indicative of physical characteristics of the sample at this point.
- physical characteristics of the sample may be viscoelastic modulus, density, refractive index, electrostriction, and combination thereof.
- the metric associated with the Brillouin scattered light is a Brillouin frequency shift.
- FIGs. 2, 3 , and 7 illustrate illumination and detection path arranged under the angle of 90 degrees, both setups can be implemented with the illumination and detection paths arranged at any angle greater than zero relative to each other.
- an optical arrangement to induce spectral dispersion may comprise spherical lenses, cylindrical lenses, VIPA.
- the optical arrangement comprises elements 222, 223, 224, 225, and 226 of FIG. 2 ; elements 322, 323, 324, 325, 326, 327, and 328 of FIG. 3 ; and elements 715, 716, 717, 719, 720, and 722 of FIG. 7 .
- the optical arrangement inducing a spectral dispersion comprises a virtually imaged phased array (VIPA), a Fabry-Perot etalon, or an echelle grating.
- the optical arrangement further comprises optical elements to modify size, shape, and/or angular spread of the spatio-spectral pattern in an optical path from the sample to the detection unit.
- the illuminating light beam is reshaped by a first lens 211, 311, and 711 to generate a pencil beam within a container containing the sample.
- a spatial light modulator or deformable mirror FIG. 7 , mirror 724) may be used to reshape the illuminating light beam entering a first lens ( FIG. 7 , lens 711).
- the Brillouin scattered light generated within a sample container is collected by a first imaging system comprising the second lens 220, 320, 713 and generating an intermediate image at a focal plane of a third lens 221, 321, 715.
- a magnification of the intermediate image is optimized to minimize an angular dispersion of the measured sample points at the VIPA 224, 324, and 717.
- a spatial filter or aperture 228, 330, and 725 may be used in an intermediate image plane to reject out-of-focus light coming from the sample.
- a second imaging system which is a combination of elements 222, 225, 226 of FIG. 2 , elements 322, 326, 327, and 328 of FIG. 3 , and elements 715, 718, and 722 of FIG. 7 , projects the intermediate image onto the detection unit 227, 329, 723, wherein the optical arrangement, including the VIPA, is in an infinity space of the second imaging system.
- the Brillouin scattered light is collimated by a spherical lens ( FIG. 2 , lens 222; FIG. 7 , lens 715) and focused by a cylindrical lens ( FIG. 2 , lens 223; FIG.
- the Brillouin scattered light is collimated by a first lens array 322, wherein each lenslet of the first lens array only accepts light from a portion of the intermediate image, wherein the entire image is divided into multiple sections, each section collimated by a lenslet independently.
- the output light of the VIPA is compensated by a pair of cylindrical lens 325 and 326 to fit an aperture of a lenslet of a second lens array 327.
- the Brillouin spatio-spectral pattern is generated at a front focal plane of the second lens array 327 and imaged onto the detection unit 329.
- a narrowband filter to absorb the laser line in the spatio-spectral pattern the narrowband filter selected from the group consisting of: an absorption gas cell and a Fabry-Perot etalon device.
- the wavelength of the illuminating source and the wavelength absorbed by the narrowband filter are locked to each other.
- the Brillouin spatio-spectral pattern is calibrated by measuring on the detection unit 227, 329, 723 a distance between different laser or elastic scattering lines generated by different orders of diffraction of the optical arrangement.
- reference materials of known Brillouin properties are used to calculate the spectral dispersion properties of the optical arrangement.
- the spectral efficiency of angled geometries were compared with traditional setups using confocal epi-detection configuration as demonstrated in FIG. 1 .
- the differential cross-section is independent to the scattering angle ( Girard M J A, Dupps W J, Baskaran M, Scarcelli G, Yun S H, Quigley H A, Sigal I A and Strouthidis N G, "Translating Ocular Biomechanics into Clinical Practice: Current State and Future Prospects", Curr. Eye Res.
- low NA ill is usually preferred in order to generate a long illumination beam line uniform across the field of view.
- the scattering efficiency in orthogonal and epi-detection is determined by the overlap between the illumination volume and detection volume, therefore one can design angledgeometries to be as efficient as epi-detection per single point measurement to maximize the parallelization advantage.
- the multiplex Brillouin spectroscopy can accomplish the scan of a mm-sized sample with few-micron resolution within tens of seconds compared to greater than one hour in epi-detection.
- the measurable size along the beam line is determined by both the illumination NA and the pixel number of the camera.
- the spatial resolution is determined by the detection NA (x-direction, along the beam line) and illumination NA (y- and z- direction).
- the angled configuration has inherently less background noise than epi-detection.
- back reflections of the illuminating light are easily coupled into the spectrometer and contribute to the background noise.
- the line-scanned configuration because the illumination and detection path are arranged orthogonally, the back reflection can be completely avoided.
- the line-scanned configuration since only the region that is illuminated by the line beam is excited, the line-scanned configuration has similar function of optical sectioning as confocal configuration.
- the extinction ratio of the spectrometer is limited. This makes it challenging to measure interfaces or optically opaque samples, such as intralipid medium or tissue.
- the line-scan configuration can be combined with existing methods that can suppress the background noise such as apodization, narrow band-pass filtering, and gas-chamber narrow absorption filtering.
- Another aspect of the current invention relates to a system and method for classifying living cells based on subcellular physical (mechanical) properties.
- the cells to be classified may be human, animal, or plant cells.
- the subcellular physical information is obtained from the spectral analysis of the Brillouin light scattering related to the acoustic properties inside the cells.
- the classification can be based on either cell population or individual cells.
- cells can be analyzed in suspended conditions, adherent to 2D substrates, and/or cultured within 3D synthetic/natural extracellular matrices.
- cells can be analyzed in static conditions or via cell flow.
- the cells can be cultured and prepared in vitro and delivered to a probe beam using microfluidic devices.
- the subcellular information at different regions of the cells can be acquired in several settings taking advantage of standard or custom microfluidic devices.
- Cells can be analyzed in nearly all settings associated with flow cytometry or other cell analysis techniques.
- cells can be measured while flowing inside a microfluidic channel, mapped when they stay still in suspension, encapsulated in droplets of 3D gels or other extracellular matrices according to known methods, and/or while forming cell aggregates.
- cells can be analyzed in other settings (such as in dishes, or flasks, or plate arrays) while adherent onto substrates, or within 3D gels or while forming aggregates by guiding Brillouin acquisition of subcellular information with a bright-field or confocal imaging modality. Based on the acquired physical phenotyping, different types of cells or same type of cells in different phases of the cell cycle can be distinguished. In one embodiment, cell response to drugs can be analyzed. The analysis can be performed on either population of cells or on individual cells.
- FIG. 12 illustrates an exemplary embodiment of the current invention resulting from a novel combination of an epi-detection path to excite/collect Brillouin signal, a monitoring imaging modality, a microfluidic device (or other cell plating device), a Brillouin spectrometer and a computer with software that links all of these sub-components.
- a first incoming illuminating beam 1210 is focused onto one spot inside a microfluidic device 1230 by using a beam splitter 1211 and an objective lens 1212.
- the illuminating laser beam 1210 may be a laser beam. In one embodiment, the first incoming laser beam 1210 is focused into spot of 1 to 10 ⁇ m.
- the backward Brillouin scattering light is collected by the same objective lens 1212 and guided to a Brillouin spectrometer 1215 via the beam splitter 1211, a reflected mirror 1213, and a coupling lens 1214.
- the Brillouin spectrometer 1215 is a device that can measure the Brillouin frequency shift accurately.
- One example of the Brillouin spectrometer 1215 is disclosed in Scarcelli Polachech 2015 Nature Methods Above the microfluidic device 1230, there is a bright-field microscope consisting of a second light source 1220 (usually has a different wavelength from laser beam 1210), a beam splitter 1221, a tube lens 1222, an objective lens 1224, and a 2D image recording device 1225.
- the microscope setup further contains a spectral filter 1223, which blocks the light from the laser beam 1210, but allows the light from a light source 1220 to pass.
- the objective lenses 1212 and 1224 are adjusted to make sure the focused spot from the objective lens 1212 is on the image plane of the objective lens 1224.
- a software interface may be used to synchronize the bright field image obtained by the 2D image recording device 1225 and the Brillouin signal of the Brillouin spectrometer 1215. By doing this, the Brillouin signal can be assigned to a right location of the measured sample.
- FIG. 13 illustrates a snapshot of the interface used in conjunction with the Brillouin spectroscopy setup of FIG. 12 .
- the primary function of the interface is to simultaneously record a raw Brillouin signal 1310 (spatio-spectral pattern) and bright-field image 1320 of the microfluidic device having cells therein.
- the two white dots 1310 are Brillouin signals (spatio-spectral pattern), and the distance between the dots represents the Brillouin peaks.
- the distance from the laser line to the Brillouin peak is the desired frequency shift.
- the Brillouin shift can be measured by calculating the distance between two Brillouin peaks; in this case, shorter distance between the two peaks corresponds to bigger frequency shift and thus higher stiffness).
- FIG. 14 a non-limiting example of how the Brillouin signal detection could be implemented in practice is illustrated.
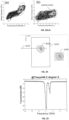
- FIGs. 14a-c are snapshots of both a raw Brillouin signal (spatio-spectral pattern) and a bright-field image acquired simultaneously at 0.85 sec, 1.35 sec, and 1.65 sec, respectively.
- the snapshots show a cell flowing inside a channel, from top to bottom.
- the circle 1402 indicates the location of the illuminating (probe) beam spot that the cells are crossing.
- FIGs. 14d-f show time traces of the Brillouin frequency shift calculated from the raw Brillouin signal of FIGs. 14a-c . From the synchronized images of FIGs.
- the original location of the Brillouin signal can be identified without ambiguity.
- this capability can be also used to guide a Brillouin probe beam to specific locations by incorporating image processing techniques and either translating the cell container or controlling the position of the Brillouin probe beam.
- the microfluidic device 1230 as shown in FIG. 12 can be placed on a 2D translational stage in order to align cells to a focused probe beam spot.
- the microfluidic device 1230 may be a straight channel with rectangular cross-section or a channel with circular cross-section as in the majority of flow cytometers. If the size of the channel (by way of example, 100 ⁇ m by 100 ⁇ m) is much larger than the size of the cell (by way of example, 10 ⁇ m to 20 ⁇ m in diameter), cells may flow through the microfluidic device 1230 at random locations thus diminishing accuracy and potentially throughput of the measurement.
- hydrodynamic focusing techniques called sheath flow can be implemented. This is an effective way to ensure that the center of each cell is consistently aligned to the focused spot of the probe beam 1210.
- FIGs. 15a-b illustrate a comparison of experimental data obtained by using the sheath flow technique ( FIG. 15b ) and obtained without using the sheath flow technique ( FIG. 15a ).
- FIG. 15b By adjusting the flow rate and acquisition time of the spectrometer 1215, several locations of one cell can be probed when the cell passed across the light beam 1210.
- the average of all the Brillouin frequency shifts acquired within a cell was calculated to describe the average stiffness of a single cell. Therefore, in FIG. 15a-b , each data point of the histogram represents one cell.
- the results show that the spread (linewidth of the distribution) of the measured data is about 40% narrowed by using the sheath flow technique because the artificial broadening caused by a non-sheath flow is removed.
- the NIH 3T3 cell line was used in the experiment.
- a second approach may be used to align the flowing cell to the focused spot of the laser beam 1210.
- the schematic of the concept is shown in FIG. 16 .
- This approach can be also implemented within the setup shown in FIG. 12 with the following modifications.
- the focused spot of the laser beam 1210 locates in the center of the field of view of the microscope.
- the focused spot 1620 was moved to the bottom of the microfluidic channel 1610 and set at the middle point along the x-direction, i.e., at x 0 .
- a cell 1630 is flowing along y-direction (from top to bottom), once it appears in the field of view, its location (x 1 ) and the horizontal shift (x 0 -x 1 ) with respect to the focused spot 1620 can be determined.
- the translational stage carrying the microfluidic channel 1610 can be either automatically or manually moved to align the cell 1630 to the focused spot 1620 perfectly.
- the Brillouin probe beam can be adjusted with laser scanning accessories (e.g.
- FIG.17a A representative experimental result obtained by using the Brillouin spectroscopy setup of FIG. 12 is shown in FIG.17a .
- Cells were cultured and suspended in a buffer solution right before the experiment.
- Phosphate-Buffered Saline (PBS) was used as a buffer solution.
- the histogram of FIG. 17a consists of three parts, which are outlined by three solid curves 1702, 1704, and 1706.
- the first peak 1704 is the signature of the PBS, which can be easily recognized, located, and removed as shown in FIG. 17b .
- the appearance of the PBS's signature in the measured data is expected since the light beam 1210 will only probe buffer solution within the time interval between two adjacent cells.
- NIH 3T3 cell line may be used for the cell flowing experiment as described above.
- curve-fitting methods can be used to extract the signature of the cells from FIG. 17a .
- a linear superposition of three Gaussian distributions 1702, 1704, and 1706 was used to fit the original histogram. Since the signature of the PBS solution 1704 can be well determined by fitting the data of FIG. 17b in advance, this information can be used as known parameters of the fitting.
- the information of the cells was obtained by subtracting the signature of the PBS solution 1704, as shown in FIG. 17c . It is clear that the histogram of FIG. 17c consists of two peaks, which are the superposition of two Gaussian distributions 1708 and 1710. In fact, Gaussian distributions 1708 and 1710 represent mechanical signatures from different regions (i.e., cytoplasm and nucleus) within the cells.
- FIG. 17a is a histogram illustrating the distribution of Brillouin frequency shifts measured for a collection of points along the line where the cells flowing through the channel cross the laser.
- FIG. 18a is fitted by a superposition of two Gaussian distributions 1802 and 1804.
- FIG. 18b is a histogram resulting from the 2D Brillouin images of flowing cells fitted by a superposition of two Gaussian distributions 1806 and 1808.
- twenty nine (29) cells were measured. It is shown that the histograms in FIGs. 18a and 18b share the same features, including the two-peak profiles and the frequency shifts of each peak. It is noted, that the number of cells and measurement as specified above is not limiting and any number of cells and measurements can be used to obtained the histograms of FIGs. 18a-b .
- FIG. 17c corresponds to the mechanical signature of cytoplasm/cytoskeleton and nucleus.
- Fluorescence dye was used to stain only the nucleus of the cell, and then both the bright-field/fluorescence image ( FIG 19a and b ) and 2D Brillouin image ( FIG. 19d ) of the same cell were acquired.
- FIG. 19c obtained by merging the images of FIGs. 19a-b with Brillouin 2D image of FIG. 19d
- nucleus can be separated from cytoplasm.
- the histogram of both the nucleus and cytoplasm are plotted together in FIG. 19e , where the peak 1904 is from the nucleus (corresponding to fluorescence region of FIG.
- the mechanical signature of the nucleus and cytoplasm can be distinguished in a cell population by a flow experiment using the Brillouin spectroscopy setup of FIG. 12 obtaining Brillouin frequencies at multiple points within the cells as the cells cross the probe beam.
- the combined fluorescence/Brillouin configuration can be used to accurately assign or image-guide Brillouin acquisition of specific subcellular components labelled with fluorescence.
- the capability to classify cells based on subcellular physical (mechanical) phenotyping is demonstrated.
- Cytochalasyn D Cytochalasyn D
- the cytoskeleton consists of three main polymers: actin, microtubules, and intermediate filaments.
- actin actin
- microtubules microtubules
- intermediate filaments The F-actin is the polymerized state of actin and has a dominant role in controlling cell shape and mechanical properties.
- CytoD is a drug that inhibits the polymerization of the F-actin. It was reported that F-actin will be dramatically reduced in attached cells treated with CytoD as a result the cell overall will decrease its stiffness ( Wakatsuki T, Schwab B, Thompson NC, Elson EL. "Effects of cytochalasin D and latrunculin B on mechanical properties of cells.”, J Cell Sci. 114, 1025-1036 (2001 )). At a subcellular level both nucleus and cytoskeleton will decrease stiffness as actin is present in both.
- nucleus and cytoskeleton are mechanically connected, the nucleus sustains pre-stress from the cytoskeleton ( Wang N, Tytell JD, Ingber DE. "Mechanotransduction at a distance: mechanically coupling the extracellular matrix with the nucleus", Nat Rev Mol Cell Biol. 10, 75-82 (2009 )).
- the disruption of the F-actin should also reduce the pre-stress so that eventually soften the nucleus ( Chalut KJ, Höpfler M, Lauteneller F, Boyde L, Chan CJ, Ekpenyong A, Martinez-Arias A, Guck J. "Chromatin decondensation and nuclear softening accompany Nanog downregulation in embryonic stem cells", Biophys J. 103, 2060-2070 (2012 )).
- CytoD is applied on cells and then detached using trypsin. After that, the treated cells are re-suspended in PBS and measured in the setup of FIG. 12 .
- three doses of CytoD were used.
- the CytoD doses were 0.5 ug/ml, 2 ug/ml, and 5 ug/ml.
- the treated cells (279, 232, and 577) were probed for each doses and untreated cells (268) were probed for control.
- the average value over the whole cell was used to represent mechanical phenotyping of the cell.
- the results in FIG. 20a indicate the dose dependent effect of CytoD on the stiffness of the cells.
- the average Brillouin frequency shift value over the whole cell can be used to obtain highthroughput mechanical phenotyping.
- NIH 3T3 cell line was used to carry out the experiment.
- the method described with the reference to FIGs. 17a-c can acquire subcellular information.
- FIGs. 20b-e corresponding to different doses of CytoD
- the Brillouin frequency shift of peaks 2004, 2008, 2012, and 2016 got smaller and thus moved to the left from FIG. 20b to FIG. 20e .
- peaks 2002, 2006, 2010, 2014, which represent the cytoplasm have almost no change in this experiment.
- FIG. 21 illustrates a Brillouin spectroscopy setup according to another embodiment of the current invention.
- a second optical modality is added to acquire a co-registered confocal fluorescence image of the cell simultaneously when the cell is probed by the Brillouin beam.
- the second optical modality may comprise a dichroic mirror 2127, a tube lens 2122, a pinhole mask 2126, and a photo-detector 2125.
- the dichroic mirror 2127 will let the laser beam 2110 and the Brillouin signal pass through but reflects the fluorescence light.
- the confocal configuration has better transverse and lateral optical resolution by rejecting fluorescence light from the out-of-focus plane.
- fluorescently labelled cells can be used to identify a subregion of a cell (e.g., nucleus) and the focused spot of laser beam 2110 can be used to directly excite fluorescence emission. Then, the confocal configuration is used to detect the fluorescence emission light by a camera 2125. Based on the intensity of the fluorescence emission light, one can accurately determine the location of the focused spot (and thus the Brillouin signal) inside the cell so that the Brillouin signal can be assigned to a targeted point. This modality can also be used to guide the Brillouin beam to a specific region of the cell during measurement. In yet another embodiment, in addition to the inverted configuration, the upright configuration of the confocal microscope can be used.
- the confocal configuration will be on the top of the microfluidic device 2130.
- the fluorescent information can also be used to estimate the amount of non-cellular medium (e.g. PBS) present in the three-dimensional imaging voxel in order to calibrate measurements at the edge of a cell.
- PBS non-cellular medium
- the image in FIG. 22 is obtained by using the Brillouin spectroscopy setup according to the embodiment of FIG. 21 , but with bright-field fluorescence rather than confocal microscopy. Fluorescence dye was used to stain the nucleus of the cells subsequently delivered into the microfluidic device 2130. Once the cells stayed still in suspension, a 2D mapping of a single cell was performed by moving the microfluidic device. Since Brillouin beam spot and fluorescence light are overlapped with each other in space, the Brillouin signal can be linked to the fluorescence intensity for each measured point.
- FIG. 22 One possible way of representing the result is shown in FIG. 22 . Each point represents one measurement taken in a certain region within a cell, and the different colors encode the relative density of the data points.
- the dashed circles indicate the measured points from the nucleus (fluorescence region) and cytoplasm (non-fluorescence region), respectively.
- FIG. 23 As an example of classifying cells using the embodiment of Fig. 21 , effect of CytoD on the cells was analyzed. Both Brillouin and fluorescence 2D imaging of cells with and without treatment was done, and the method of FIG. 22 was used to analyze the data. The result is shown in FIG. 23 , in which (a) and (b) are results of control group and CytoD treated group, respectively. It is observed that the nucleus is much softened after the cell is treated with CytoD.
- the Brillouin signal is acquired in a point by point-scanning mode, which is a limitation of the overall throughput. As such, it may be difficult to acquire enough subcellular points per cells to analyze individual cells. Thus the embodiments of FIGs. 12 and 21 are useful for cell population analysis, but may be less powerful for single cell mechanical phenotyping and thus would not be suitable for cell sorting applications.
- One solution to this issue is to lower the flow speed to have enough subcellular points for single cell analysis.
- Another solution is to employ more than one spectrometer to measure more than one location at one time.
- the Brillouin spectroscopy setup according to FIG. 7 can measure multiple points of a cell at the same time.
- the beam from a laser source 710 is first guided by a mirror 724 and then focused by an objective lens 711 to be an illuminating line beam in x-direction.
- the line beam shines into the channel of a microfluidic device 712 from its edge.
- the cells can pass through the line beam by flowing along y-direction.
- the Brillouin scattering signal excited by the line beam is detected by a parallel configuration of a Brillouin spectrometer, which consists of a pair of objective lens 713 and 714, a collimated lens 715, a cylindrical lens 716, a dispersion device (i.e., VIPA) 717, cylindrical lenses 718 and 719, a mask 720, a spherical lens 722, and a high-sensitive CCD camera 723.
- a Brillouin spectrometer which consists of a pair of objective lens 713 and 714, a collimated lens 715, a cylindrical lens 716, a dispersion device (i.e., VIPA) 717, cylindrical lenses 718 and 719, a mask 720, a spherical lens 722, and a high-sensitive CCD camera 723.
- the multiplexed Brillouin spectrometer of FIG. 7 can simultaneously obtain Brillouin signals from many points along the illuminating line beam. For example, by choosing proper objective lenses and adjusting the optics within the spectrometer, the resolution of less than 1 ⁇ m can be achieved in x-direction. Since the typical size of a cell is around 10 to 15 ⁇ m, around 10 points for one shot and up to greater than 100 points for a single cell when it is flowing through can be captured. This dataset would surely give enough information to obtain the subcellular mechanics of a single cell.
- the embodiment in FIG. 7 thus offers one a more effective way to classify a single cell based on its subcellular mechanical phenotyping.
- the setup of FIG. 7 in addition to the right angled arrangement of the illumination path and detection path, the setup of FIG. 7 can also work at any angle greater than 0 °, including arrangement angles of 45° and 60°.
- FIG. 24 shows a conceptual sketch of the embodiment of FIG. 7 .
- the illumination laser line 2410 illuminates the microfluidic channel 2430 from its left edge (x-direction), and a cell 2420 flows inside the channel along y-direction.
- the cell 2420 encounters the laser line 2410, Brillouin signals from the illuminated region of the cell 2420 will be acquired simultaneously.
- the whole cell body can be scanned by the line beam.
- a 2D image 2440 of the cell 2420 can be reconstructed, as shown in FIG. 24 .
- the embodiment of FIG. 7 can be further improved by adding filtering elements to remove spurious light from laser reflected or scattered from the cell, or the channel.
- the Fabry-Perot filter can be used.
- the Fabry-Perot filter is actually an etalon that allows light with selected frequency to pass and block the others.
- the transmission peak of the filter can be adjusted to overlap with the Brillouin signal.
- the spurious light has a different frequency from Brillouin signal so that will be suppressed.
- the method of FIG. 7 may introduce alignment issues and potential artifacts that should be resolved with an accurate calibration.
- an absorption gas chamber can be used ( Piironen P, Eloranta EW. "Demonstration of a high-spectral-resolution lidar based on an iodine absorption filter", Opt. Lett. 19, 234-236 (1994 )).
- the gas chamber does not introduce spectral dispersion via the redirection of beam and thus is highly suitable for parallel spectrometer.
- the gas chamber is usually fabricated from glass and contains vapors from specific atomic element which has a welldefined absorption spectrum. The light passes through the gas chamber via entrance and exit windows without introducing any optical distortion.
- the absorption gas has a very narrow (less than 1 GHz) molecular absorption spectra at specific optical wavelength.
- a gas chamber whose absorption line overlaps perfectly with the wavelength of the laser source 710 can be designed.
- the gas chamber could be placed between the lenses 712 and 713, and the spurious light (with the same wavelength of laser source 710) will be absorbed while the Brillouin signal will pass through.
- the linewidth of the absorption spectrum is so narrow that any small drift of the laser's frequency will make the gas chamber ineffective.
- FIG. 25 shows a measured absorption spectrum of a gas chamber containing Rubidium gas.
- This gas chamber works at the wavelength of 780.24 nm, and the result shows that when the chamber was heated up to 94.5 degree C, the peak absorption is about 34dB with an insert loss of 2dB.
- the gained spectral extinction allows for measuring biological samples that have a strong background noise.
- FIG. 26 An exemplary setup of the current invention is shown in FIG. 26 .
- a verticallypolarized laser beam 2628 is first reflected by the polarized beam splitter (PBS) 2634 and focused into the center of a microfluidic channel 2624 from the bottom side by objective lens 2632.
- PBS polarized beam splitter
- a 11-mW single-mode linearly-polarized 532-nm cw laser was used as a light source to excite Brillouin scattering.
- QWP quarter-wave plate
- the backward scattered light was collected by the same objective lens 2632 and passed through the QWP 2626 again.
- the circularly-polarized light is eventually turned into horizontally-polarized one which is totally transmitted by the PBS 2634.
- the scatted light is then guided by a mirror 2630 and coupled into the Brillouin spectrometer 2638 by a fiber coupling lens (FC) 2636.
- the Brillouin spectrometer 2638 is constructed by a standard two-stage virtually imaged phased array (VIPA) in the crossaxis configuration.
- VIPA virtually imaged phased array
- the dashed arrows indicate the flowing direction of the cells inside the channel 2624.
- a red LED 2616 was used for illumination and a long-pass filter is used for blocking the Brillouin beam.
- the wavelength of the LED 2616 may be 660 nm; the long-pass filter may be FEL0600, Thorlabs.
- the location of the focused Brillouin beam was pre-determined by removing the long-pass filter (LP) 2612.
- LP long-pass filter
- a narrow-band filter was placed in front of the Brillouin spectrometer 2638.
- a CCD camera 2610 and the Brillouin spectrometer 2638 were synchronized by a LabVIEW program so that the spectrometer's data can be assigned to the corresponding location of the measured sample.
- the sampling time of the spectrometer was set as 50 ms.
- FIG. 27a-d shows measurement procedures of a cell flow experiment based on obtaining Brillouin frequencies at multiple points within the cells.
- the Brillouin spectrometer 2638 records signals continuously.
- a cell passes through the beam location (white dots indicated by the arrows), its Brillouin shift is measured.
- the chip used in the setup of FIG. 26 has a single straight channel 2624 with sheath flow configuration at the inlet.
- the cross-section of the channel has a size of 150 ⁇ m (width) by 50 ⁇ m (depth), and the length is about 50 mm.
- the chip is assembled on the 2D stage of the microscope and connected to a syringe pump for delivering the cells suspension into the channel.
- a sheath flow technique may be used to align the cells into the center of the channel.
- the flow velocity is about 20-40 ⁇ m/s.
- the overall throughput varies from about 160 to 300 cells per hour with an average of 230 cells per hour.
- Cells are cultured and re-suspended in a solution of phosphate-buffered saline (PBS) without Mg2+ and Ca2+.
- PBS phosphate-buffered saline
- the final cell concentration is 1 to 10 million cells/ml.
- old culture medium is aspirated out and replaced with 100 ng/mL trichostatin A (TSA) solution in complete growth media.
- TSA trichostatin A
- Cells are then incubated for 2 hours. After incubation, cells are harvested using 0.25% trypsin-EDTA, centrifuged at 250xg for 5 minutes and re-suspended in PBS without Mg2+ and Ca2+ at approximately 2.5 million cells/mL.
- the Vybrant DyeCycle Ruby stain (ThermoFisher) was used and the suggested protocol was followed. In short, 1 ⁇ L stain is added to cell suspension with concentration of 0.5 million cells per mL and mixed well. The final stain concentration is 5 ⁇ M. The mixture is then incubated at 37°C for 15-30 minutes and protected from light. Cells without washing are then ready for fluorescence experiment. In one embodiment, NIH 3T3 cell line is used for experiment.
- cell suspension is delivered into the microfluidic channel slowly using a syringe pump. Once the cells are filled in the channel, pump is stopped. After several minutes, cells would settle down to the bottom of the channel, but still keep a rounded shape.
- the height of the laser beam spot is then adjusted to the center of the cell, and 2D scanning is performed in the horizontal plane by scanning the stage of the microscope. The step size of the scan is set as 0.5 ⁇ m in both dimensions. In one embodiment, NIH 3T3 cell line is used for the experiment.
- a cell suspended in a buffer usually has a round shape.
- the diameter of a cell ranges from 10 ⁇ m to 20 ⁇ m. Since the focused Brillouin beam has a spot size of about 0.5 ⁇ m, multiple positions can be measured when the cell flows across the beam spot.
- the Brillouin spectrometer acquires data continuously at the rate of 20 Hz.
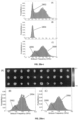
- FIGs.27a-d demonstrate the measurement procedures. Specifically, FIGs. 27a-c illustrates as a cell flows through the microfluidic channel at different times (t1, t2, and t3). The scale bar is 30 ⁇ m. A white dot indicated by the arrow is the location of the laser beam spot. In FIG. 27d , time trace of the Brillouin signal is presented. Dots represent measured data and the solid line is a guide of eye.
- FIGs.28a-c represent the distribution of Brillouin frequency shifts measured for five hundred seventy seven (577) cells. Each data point corresponds to one measurement event of the Brillouin spectrometer measuring the Brillouin frequency shift.
- the time window is usually wider than the lasting time of each cell event. Therefore, the mechanical signatures of both the cells and the PBS buffer are recorded and shown in FIG. 28a .
- the first peak 2802 of the histogram is a signature of the PBS buffer, which can be easily identified based on its Brillouin frequency shift.
- this signature was characterized by only flowing the PBS buffer, and the result is shown in FIG.28b .
- the flow data can be well fitted by a normal distribution, which indicates the Brillouin shift of 7.51 GHz with the width of 0.047 GHz.
- the mechanical signature of the cells can be extracted by removing the signature 2804 of the PBS buffer from FIG.28a , and the result is shown in FIG.28c .
- the signatures of cells reveal two peaks.
- a linear superposition of two normal distributions 2806 and 2808 was used to fit the measured data.
- the results are indicated by the solid curves 2806 and 2808 in FIG.28c , with central frequencies of 7.57 GHz and 7.80 GHz, respectively.
- the nucleus is usually the stiffest organelle of a cell ( Friedl, P., Wolf, K. & Lammerding, J. "Nuclear mechanics during cell migration", Current Opinion in Cell Biology 23, 55-64 (2011 ); Girard M J A, Dupps W J, Baskaran M, Scarcelli G, Yun S H, Quigley H A, Sigal I A and Strouthidis N G, “Translating Ocular Biomechanics into Clinical Practice: Current State and Future Prospects", Curr. Eye Res. 40(1), 1-18 (2015 )). Therefore, the solid curves are the signatures of cytoplasm and nucleus, respectively.
- the volume ratio of the nucleus for 3T3 cell is reported larger than 30%, which implies a diameter ratio of cytoplasm to nucleus is around 3:7. Therefore, during the flow experiment based on obtaining Brillouin frequencies at multiple points within the cells, the signature of nucleus has more than twice chance than the cytoplasm to be measured by the Brillouin spectrometer, which is also confirmed by the amplitude of the two peaks 2806 and 2808 in Fig. 28c .
- Suspended cell has a rounded shape which can be approximated as a sphere for simplicity.
- the center of the cells can be aligned to the location of a laser beam spot in width direction as they flow through the microfluidic channel. Since the depth of the channel is larger than cell size, the center of cell will vary from one cell to another in depth direction. If this is the case, one line in the cross section containing the diameter of each single cell will be sampled when the cell passes across the laser beam spot.
- the measurements of the Brillouin frequency shifts during cell flow represent the mechanics of cell population, they were compared with the images of the cross section passing through the center of cells. Specifically, 2D images of cells were obtained, as shown in FIG. 29a.
- FIG.29b shows the distribution of all of the images data of FIG. 29a representing the overall mechanics of cell population fitted by a superposition of two curves 2902 and 2904 is shown.
- the distribution of the Brillouin flow data corresponding to a collection of points along the line where cells cross the laser is plotted in FIG.29c and fitted by a superposition of curves 2908 and 2906.
- the cells are aligned via sheath flow so that one diameter is sensed by the fixed beam spot.
- the beam spot is actually mapping a cross section passing through that diameter.
- fluorescent dye was used to stain only the nucleus of a cell. Then bright-field (I), fluorescent (II), and Brillouin 2D (IV) images were acquired, as shown in FIG. 30 .
- Chromatin decondensation softens nucleus
- Chromatin is a complex of DNA and proteins that forms chromosomes within the nucleus. Its function is to efficiently package DNA into a small volume to fit into the nucleus of a cell and protect the DNA structure and sequence. Accumulating studies suggest that the condensation level of the chromatin is tightly related to the stiffness of the nucleus. For example, chromatin decondensation results in reduction in the stiffness of the nucleus. Conversely, an increase in chromatin condensation leads to a stiffened nucleus. In one embodiment, the mechanical cytometry was used to characterize the effect of chromatin decondensation caused by TSA, a histone deacetylase inhibitor.
- FIG. 31a-c provides an experimental observation of nucleus's softening by chromatin decondensation.
- three hundred fifty six (356) and three hundred fifty three (353) cells are collected from a TSA treated and control group (not TSA treated), respectively.
- the Brillouin shift of the nucleus moved from 7.80 GHz (curve 3108) to 7.71 GHz (curve 3104), which indicates distinct softening of the nucleus.
- the Brillouin shift of the cytoplasm almost stayed the same (7.56 GHz (curves 3102 and 3106)) meaning that the cytoplasm was not affected by TSA.
- bars 3110 and 3112 associated with the average Brillouin shift for cytoplasm of TSA treated and control cells, respectively, have the same height, indicating no change in Brillouin frequency.
- bars 3114 and 3116 associated with the average Brillouin shift for nucleus of TSA treated and control cells, respectively, have different heights, indicating a change in Brillouin frequency.
- the mechanical cytometry according to the present invention can identify nuclear signature of cells using on-chip Brillouin technique. It provides a label-free, non-contact, and non-invasive method to measure the mechanical properties of nucleus of cell population.
- the overall throughput is about 230 cells per hour, which is much more efficient than existing techniques such as Atomic Force Microscopy (AFM) and micropipette aspiration.
- the mechanical cytometry according to the current invention can be used to evaluate the effect of chromatin decondensation on the stiffness of the nucleus. Distinct softening after TSA treatment is found. Since the changes of nuclear stiffness involves in many important activities of cell, such as migration, differentiation and malignant transformation, the mechanical cytometry according to the current invention has a potential to find applications where an efficient and label-free characterization of nuclear mechanics of cell population is needed.
- the method for classifying biological cells according to the present invention is based on measuring a Brillouin scattering spectrum at multiple points within each biological cell.
- One or more metrics related to subcellular physical properties are determined at different spatial points within the biological cells based on the measured Brillouin scattering spectrum.
- the biological cells are classified based on the subcellular physical properties at different spatial points within the biological cells.
- a histogram for the Brillouin frequency shift including each measured point within the biological cells is generated.
- a linear superposition of Gaussian distributions is applied to fit the histogram.
- each peak within the histogram is determined, wherein each peak represents mechanical signatures from different regions within the cells.
- the physical properties at different spatial points within the biological cells are correlated to the determined mechanical signatures.
- the biological sample may include biological organisms, tissues, or biological cells.
- the biological cells are living cells.
- the Brillouin frequency shift is selected as a metric.
- the step of determining subcellular physical properties at different spatial points within the biological cells comprises forming an image and segmenting out parameters based on spatially-based differences in the determined physical signatures.
- the physical properties of the sample are selected from the group consisting of: viscoelastic modulus, density, refractive index, electrostriction, and a combination thereof.
- the container having the biological sample is a microfluidic channel of a microfluidic device.
- the biological cells flow through the microfluidic channel while the spectrum is measured.
- a bright-field 2D image is acquired simultaneously with the Brillouin light spectral pattern to identify an original location of the Brillouin scattering and to guide the illuminating light beam to a specific location within the microfluidic channel.
- one or more Brillouin metrics are used in combination with fluorescence, Raman, forward and side scattering, to create a multi-dimensional histogram to classify biological cells.
- a merged image including 2D bright-field and 2D fluorescence cell images is compared with a cell image based on the Brillouin frequency shift to separate a nucleus from a cytoplasm.
- the Brillouin frequency shift may be measured in a point scanning mode or in a multiplexed scanning mode.
- the extracted physical properties obtained from within cells may refer to analysis of a single biological cell or population of biological cells.
- the histogram representing the Brillouin spectrum has two peaks corresponding to cytoplasm and nucleus, respectively.
- modified biological cells are distinguished from intact biological cells based on subcellular mechanical characteristics of the cells defined by the Brillouin spectrum, wherein the cells are modified by drugs targeting subcellular components such as cytoskeleton or nucleus. The subcellular physical properties are used to sort cells.
- FIG. 32 is a block diagram illustrating the system according to one embodiment of the current invention.
- a Brillouin spectrometer 3202 provides a spatio-spectral pattern 3404 of the Brillouin scattered light and the Brillouin light spectrum to a user interface 3208.
- a processor 3206 is in communication with the Brillouin spectrometer 3202, the user interface 3208, and memory 3210. The processor 3206 is configured to execute instructions in the memory 3210.
- the memory 3210 comprises instructions for calculating one or more Brillouin metrics at each measured sample point based on the detected spatio-spectral pattern.
- the memory 3210 comprises instructions for extracting one or more metrics related to subcellular physical properties at different spatial points within biological cells based on the measured Brillouin scattering spectrum and classifying the biological cells based on physical properties at different spatial points within the biological cells. Furthermore, the memory 3210 may comprise instructions for plotting a histogram for the Brillouin frequency shift and communicating the histogram to the user interface 3208; applying a linear superposition of Gaussian distributions to fit the histogram; determining each peak within the histogram, wherein the peaks represent mechanical signatures from different regions within the cells; and removing data associated with the media from the histogram.
Landscapes
- Chemical & Material Sciences (AREA)
- General Physics & Mathematics (AREA)
- Pathology (AREA)
- Health & Medical Sciences (AREA)
- Life Sciences & Earth Sciences (AREA)
- Analytical Chemistry (AREA)
- Biochemistry (AREA)
- General Health & Medical Sciences (AREA)
- Dispersion Chemistry (AREA)
- Physics & Mathematics (AREA)
- Immunology (AREA)
- Investigating, Analyzing Materials By Fluorescence Or Luminescence (AREA)
- Investigating Or Analysing Materials By Optical Means (AREA)
- Measuring Or Testing Involving Enzymes Or Micro-Organisms (AREA)
- Investigating Or Analysing Biological Materials (AREA)
- Apparatus Associated With Microorganisms And Enzymes (AREA)
- Engineering & Computer Science (AREA)
- Signal Processing (AREA)
Claims (24)
- Verfahren zum gleichzeitigen Erhalten von einer oder mehreren Metriken, die mit einem Brillouin-Streuspektrum an mehreren Punkten innerhalb einer Probe verknüpft sind, wobei das Verfahren aufweist:Beleuchten der Probe durch einen Lichtstrahl (210) entlang einer ersten Richtung, wobei das Beleuchtungslicht (210) durch eine Beleuchtungsquelle (710, 1220), die eine einzelne Wellenlänge in dem UV-, sichtbaren, oder IR-Regime aufweist, die entweder festgelegt oder um ihren Zentralwert einstellbar ist, bereitgestellt ist;Sammeln von Brillouin-Streulicht, das von der Probe als Reaktion auf das Beleuchten mit dem Lichtstrahl emittiert wird;Senden des Brillouin-Streulichts zu einer optischen Anordnung (223 bis 226, 322 bis 328, 715 bis 722), um eine spektrale Dispersion zu induzieren, und zu einer Erfassungseinheit (227, 329, 723), um ein räumlich spektrales Muster des Brillouin-Streulichts zu erzeugen, wobei die optische Anordnung und die Erfassungseinheit entlang einer zweiten Richtung positioniert sind, und wobei die optische Anordnung ein virtuell abgebildetes phasengesteuertes Feld (virtually imaged phased array, VIPA) (224, 324, 717), ein Fabry-Perot-Etalon, oder ein Echellegitter aufweist, und ferner optische Elemente, um eine Größe, Form, und/oder eine Winkelspreizung des Raumspektralmusters in einem optischen Pfad von der Probe zu der Erfassungseinheit zu modifizieren, aufweist;wobei optional der Beleuchtungslichtstrahl durch eine Laserquelle erzeugt wird, und die Erfassungseinheit eine CCD, CMOS-Kamera oder eine Anordnung von Detektoren ist;wobei der Winkel zwischen der ersten Richtung und der zweiten Richtung irgendein Winkel, der größer als 0° ist, ist;Erfassen des Raumspektralmusters des Brillouin-Streulichts auf die Erfassungseinheit, wobei mehrere Punkte der Probe entlang des Beleuchtungslichtstrahls gleichzeitig gemessen werden;Kalibrieren des Spektralmusters an jedem Raumpunkt an der Erfassungseinheit; undBerechnen der einen oder mehreren Brillouin-Metriken an jedem gemessenen Probenpunkt basierend auf dem erfassten Raumspektralmuster; wobei die einen oder mehreren Brillouin-Metriken an jedem gemessenen Probenpunkt indikativ für physikalische Charakteristiken der Probe, die aus einem viscoelastischen Modus, einer Massendichte, einem Brechungsindex, einer Elektrostriktion, und einer Kombination davon bestehen, ist, und die Brillouin-Metriken aus der Gruppe, die eine Brillouin-Frequenzverschiebung, eine Brillouin-Spektrumslinienbreite, ein Brillouin-Gewinn- oder Verlustspektrum oder eine Kombination davon bestehen.
- Verfahren nach Anspruch 1, das ferner ein Erzeugen eines Bildes der Probe basierend auf den einen oder mehreren Brillouin-Metriken, die an jedem gemessenen Probenpunkt berechnet werden, aufweist, wobei die Probe sich relativ zu dem Beleuchtungslichtstrahl während eines Abbildens bewegt, oder der Beleuchtungslichtstrahl sich relativ zu der statischen Probe während eines Abbildens bewegt.
- Verfahren nach einem der Ansprüche 1 bis 2, wobei die Probe eine biologische Probe einschließlich einem biologischen Organismus, einem Gewebe, oder biologischen Zellen ist; wobei die biologische Probe in einem oder mehreren Kanälen einer Mikroflüssigkeitseinrichtung ist; wobei die biologischen Zellen in einer Lösung suspendiert, 2D-Substraten anhaftend oder in 3D extrazellulären Matrizen kultiviert sind.
- Verfahren nach Anspruch 3, wobei die biologische Probe biologische Zellen, die lebende Zellen sind, ist.
- Verfahren nach Anspruch 1, wobei die physikalischen Eigenschaften der biologischen Probe basierend auf dem Spektrum des Brillouin-Streulichts, das von der Probe erzeugt wird, erhalten werden, wobei das Verfahren optional ein Umformen des Beleuchtungslichtstrahls durch eine erste Linse aufweist, um einen Bleistiftstrahl innerhalb eines Behälters, der die Probe enthält, zu erzeugen, wobei ein räumlicher Lichtmodulator oder ein verformbarer Spiegel optional zusätzlich verwendet werden, um den Beleuchtungslichtstrahl, der in eine erste Linse eintritt, umzuformen.
- Verfahren nach einem der Ansprüche 1 bis 5, das ferner ein Sammeln von Brillouin-Streulicht, das innerhalb eines Probenbehälters erzeugt wird, durch eine zweite Linse und ein Erzeugen eines Zwischenbildes an einer Brennebene einer dritten Linse aufweist, wobei eine Vergrößerung des Zwischenbildes optimiert ist, um eine Winkeldispersion der gemessenen Probenpunkte zu minimieren, und das optional ein Verwenden eines Raumfilters oder eine Blende in einer Zwischenbildebene aufweist, um Außerfokuslicht, das von der Probe kommt, zurückzuweisen.
- Verfahren nach Anspruch 6, das ferner Verwenden eines zweiten Abbildungssystems aufweist, um das Zwischenbild auf die Erfassungseinheit zu projizieren, wobei die optische Anordnung, um eine spektrale Dispersion zu induzieren, ein VIPA enthält und in einer Unendlichstellung des zweiten Abbildungssystems ist.
- Verfahren nach Anspruch 1, das ferner ein Kollimieren des Brillouin-Streulichts durch eine sphärische Linse und ein Fokussieren des kollimierten Lichts durch eine zylindrische Linse in einer z-Richtung auf das VIPA aufweist, wobei kollimierte Strahlen von verschiedenen Positionen verschiedene Winkel in einer xy-Ebene für das VIPA haben, und das optional ferner ein Modifizieren eines Ausgabelichts des VIPA durch mehrere zylindrische oder sphärische Linsen aufweist, um das Brillouin-Raumspektralmuster in einem scharfen Fokus auf die Erfassungseinheit zu platzieren.
- Verfahren nach Anspruch 1, das ferner ein Kollimieren des Brillouin-Streulichts durch eine erste Linsenanordnung aufweist, wobei jede Mikrolinse der ersten Linsenanordnung nur Licht von einem Anteil des Zwischenbildes akzeptiert, wobei das ganze Bild in mehrere Abschnitte eingeteilt ist, jeder Abschnitt durch eine Mikrolinse unabhängig kollimiert wird, und das Verfahren optional ferner ein Komprimieren des Ausgabelichts des VIPA durch ein Paar von zylindrischen Linsen aufweist, um es an eine Öffnung einer Mikrolinse einer zweiten Linsenanordnung anzupassen, wobei das Brillouin-Raumspektralmuster an einer vorderen Brennebene der zweiten Linsenanordnung erzeugt wird und auf die Erfassungseinheit abgebildet wird.
- Verfahren nach einem der Ansprüche 1 bis 9, wobei der Kalibrierungsschritt ferner ein Messen eines Abstands zwischen verschiedenen Laser oder elastischen Streulinien auf der Erfassungseinheit, die durch verschiedene Beugungsordnungen durch die optische Anordnung erzeugt werden, aufweist, und optional ferner ein Verwenden von Referenzmaterialien mit bekannten Brillouin-Eigenschaften aufweist, um spektrale Dispersionseigenschaften der optischen Anordnung zu berechnen, um eine spektrale Dispersion zu induzieren.
- Verfahren nach einem der Ansprüche 1 bis 10, das ferner ein Verwenden eines Schmalbandfilters, um die Laserlinie in dem Raumspektralmuster zu absorbieren, aufweist, wobei der Schmalbandfilter aus der Gruppe, die aus einer Absorptionsgaszelle und einer Fabry-Perot-Etalon-Einrichtung besteht, ausgewählt ist, wobei die Wellenlänge der Beleuchtungsquelle und die Wellenlänge, die durch den Schmalbandfilter absorbiert wird, optional miteinander gekoppelt sind.
- System zum gleichzeitigen Erhalten von einer oder mehreren Brillouin-Metriken, die mit einem Brillouin-Streuspektrum an mehreren Punkten innerhalb einer Probe verknüpft sind, wobei die Probe eine biologische Probe einschließlich eines biologischen Organismus, eines Gewebes oder biologischen Zellen ist, wobei das System aufweist:eine Mikroflüssigkeitseinrichtung (1230), die einen oder mehrere Mikroflüssigkeitskanäle aufweist, wobei die Mikroflüssigkeitskanäle optional 2D-Substrate oder 3D extrazelluläre-Matrizen enthalten, wobei die biologische Probe in den einen oder mehreren Mikroflüssigkeitskanälen ist, und wobei, wenn die biologische Probe biologische Zellen ist, die biologischen Zellen an den 2D-Substraten anhaften oder innerhalb der 3D extrazellulären Matrizen kultiviert sind;eine Beleuchtungsquelle (710, 1220), die die Probe in der Mikroflüssigkeitseinrichtung durch einen Lichtstrahl (210) entlang einer ersten Richtung beleuchtet;wobei das Beleuchtungslicht durch eine Beleuchtungsquelle, die eine einzelne Wellenlänge in dem UV-, sichtbaren oder IR-Regime aufweist, die entweder festgelegt oder um ihren Zentralwert einstellbar ist, bereitgestellt ist;eine oder mehrere Linsen (1212), die ein Brillouin-Streulicht, das von der Probe als Reaktion auf das Beleuchten mit dem Lichtstrahl emittiert wird, sammeln;eine optische Anordnung auf (223 bis 226, 322 bis 328, 715 bis 722), um das Brillouin-Streulicht von der einen oder den mehreren Linsen zu empfangen, wobei die optische Anordnung dazu da ist, eine spektrale Dispersion zu induzieren;wobei die optische Anordnung ein virtuell abgebildetes phasengesteuertes Feld (virtually imaged phased array, VIPA), ein Fabry-Pero-Etalon oder ein Echellegitter enthält, um eine spektrale Dispersion zu induzieren;eine Erfassungseinheit (227, 329, 723), um ein Raumspektralmuster des Brillouin-Streulichts zu erfassen, wobei die einen oder mehrere Linsen, die optische Anordnung und die Erfassungseinheit entlang einer zweiten Richtung positioniert sind, wobei mehrere Punkte der Probe entlang des Beleuchtungslichtstrahls gleichzeitig gemessen werden;wobei das Beleuchtungslicht durch eine Laserquelle erzeugt wird und die Erfassungseinheit eine CCD, CMOS-Kamera oder eine Anordnung von Detektoren ist;wobei der Winkel zwischen der ersten Richtung und der zweiten Richtung irgendein Winkel, der größer als 0° ist, ist;einen Prozessor (3206), der Instruktionen ausführt, um:das Spektralmuster an jedem Raumpunkt der Erfassungseinheit zu kalibrieren; undeine oder mehrere Brillouin-Metriken an jedem gemessenen Probenpunkt basierend auf dem erfassten Raumspektralmuster zu berechnen; wobei die einen oder mehreren Brillouin-Metriken aus der Gruppe, die aus einer Brillouin-Frequenzverschiebung, einer Brillouin-Spektrumlinienbreite, einem Brillouin-Gewinn- oder Verlustspektrum, und einer Kombination daraus besteht, ausgewählt sind; wobei die einen oder mehreren Brillouin-Metriken an jedem gemessenen Probenpunkt indikativ für physikalische Charakteristiken der Probe sind; wobei physikalische Charakteristiken der Probe aus der Gruppe, die aus einem viscoelastischen Modulus, einer Massendichte, einem Brechungsindex, einer Elektrostriktion und einer Kombination daraus besteht, ausgewählt sind.
- System nach Anspruch 12, wobei ein Bild der Probe basierend auf den einen oder mehreren Brillouin-Metriken, die an jedem gemessenen Probenpunkt berechnet sind, erzeugt wird, wobei sich die Probe relativ zu dem Beleuchtungslichtstrahl während eines Abbildens bewegt, oder sich der Beleuchtungslichtstrahl relativ zu der statischen Probe während eines Abbildens bewegt.
- System nach Anspruch 12, wobei die optische Anordnung ferner optische Elemente, um eine Größe, Form und/oder eine Winkelspreizung des Raumspektralmusters zu modifizieren, in einem optischen Pfad von der Probe zu der Erfassungseinheit aufweist, um eine Spektraldispersion zu induzieren.
- System nach Anspruch 14, wobei die biologische Probe biologische Zellen, die in einer Lösung suspendiert, 2D-Substraten anhaftend oder innerhalb von 3D extrazellulären Matrizen kultiviert sind, ist.
- System nach einem der Ansprüche 12 bis 15, wobei die biologische Probe biologische Zellen ist, und die biologischen Zellen lebendige Zellen sind.
- System nach Anspruch 12, wobei die physikalischen Eigenschaften der biologischen Probe basierend auf dem Spektrum des Brillouin-Streulichts, das von der Probe erzeugt wird, erhalten werden.
- System nach einem der Ansprüche 12 bis 17, wobei der Beleuchtungslichtstrahl durch eine erste Linse umgeformt wird, um einen Bleistiftstrahl innerhalb eines Behälters, der die Probe enthält, zu erzeugen, wobei die optische Anordnung optional einem Raumlichtmodulator oder einen verformbaren Spiegel enthält, um den Beleuchtungslichtstrahl, der in eine erste Linse eintritt, umzuformen.
- System nach einem der Ansprüche 12 bis 18, wobei das Brillouin-Streulicht, das innerhalb eines Probencontainers erzeugt wird, durch eine zweite Linse gesammelt wird und ein Zwischenbild an einer Brennebene einer dritten Linse erzeugt wird, wobei optional eine Vergrößerung des Zwischenbildes optimiert ist, um eine Winkeldispersion der gemessenen Probenpunkte zu minimieren; wobei optional das System ferner einen Raumfilter oder eine Blende in einer Zwischenbildebene aufweist, um Außerfokuslicht, das von der Probe kommt, zurückzuweisen.
- System nach Anspruch 19, das ferner ein zweites Abbildungssystem, um das Zwischenbild auf die Erfassungseinheit zu projizieren, aufweist, wobei die optische Anordnung, um eine spektrale Dispersion zu erzeugen, die das VIPA enthält, an einer Unendlichstellung des zweiten Abbildungssystems ist.
- System nach Anspruch 12, wobei die optische Konfiguration ein VIPA enthält, und das Brillouin-Streulicht durch eine sphärischen Linse kollimiert ist und das kollimierte Licht durch eine zylindrische Linse in einer z-Richtung auf das VIPA fokussiert wird, wobei kollimierte Strahlen von verschiedenen Positionen verschiedene Winkel in einer xy-Ebene für das VIPA haben, wobei optional ein Ausgabelicht des VIPA durch mehrere zylindrische und sphärische Linsen modifiziert wird, um das Brillouin-Raumspektralmuster in einem scharfen Fokus auf die Erfassungseinheit zu platzieren.
- System nach Anspruch 12, wobei das Brillouin-Streulicht durch eine erste Linsenanordnung kollimiert wird, wobei jede Mikrolinse der ersten Linsenanordnung nur Licht von einem Anteil des Zwischenbildes akzeptiert, wobei das ganze Bild in mehrere Abschnitte eingeteilt ist, jeder Abschnitt durch eine Mikrolinse unabhängig kollimiert wird, wobei optional das Ausgabelicht des VIPA durch ein Paar von zylindrischen Linsen komprimiert wird, um es an eine Öffnung einer Mikrolinse einer zweiten Linsenanordnung anzupassen, wobei das Brillouin-Raumspektralmuster an einer vorderen Brennebene der zweiten Linsenanordnung erzeugt und auf die Erfassungseinheit abgebildet wird.
- System nach einem der Ansprüche 12 bis 22, wobei der Prozessor, der Instruktionen zum Kalibrieren des Spektralmusters an jedem Raumpunkt an der Erfassungseinheit ausführt, zusätzlich Instruktionen zum Messen eines Abstands zwischen verschiedenen Laser oder elastischen Streulinien, die durch unterschiedliche Beugungsordnungen der optischen Anordnung erzeugt werden, ausführt, und ferner optional ein Verwenden von Referenzmaterialien mit bekannten Brillouin-Eigenschaften aufweist, um die spektralen Dispersionseigenschaften der optischen Anordnung, um eine spektrale Dispersion zu induzieren, zu berechnen.
- System nach einem der Ansprüche 12 bis 23, das ferner einen Schmalbandfilter, um die Laserlinie in dem Raumspektralmuster zur absorbieren, aufweist, wobei der Schmalbandfilter aus der Gruppe, die aus einer Absorptionsgaszelle und einer Fabry-Perot-Etalon-Einrichtung besteht, ausgewählt ist, wobei die Wellenlänge der Beleuchtungsquelle und die Wellenlänge, die durch den Schmalbandfilter absorbiert wird, optional miteinander gekoppelt sind.
Applications Claiming Priority (5)
| Application Number | Priority Date | Filing Date | Title |
|---|---|---|---|
| US201562270982P | 2015-12-22 | 2015-12-22 | |
| US201662323176P | 2016-04-15 | 2016-04-15 | |
| US201662339512P | 2016-05-20 | 2016-05-20 | |
| US201662425070P | 2016-11-21 | 2016-11-21 | |
| PCT/US2016/068405 WO2017112896A1 (en) | 2015-12-22 | 2016-12-22 | System and method of label-free cytometry based on brillouin light scattering |
Publications (3)
| Publication Number | Publication Date |
|---|---|
| EP3394939A1 EP3394939A1 (de) | 2018-10-31 |
| EP3394939A4 EP3394939A4 (de) | 2019-08-07 |
| EP3394939B1 true EP3394939B1 (de) | 2024-11-20 |
Family
ID=59065998
Family Applications (1)
| Application Number | Title | Priority Date | Filing Date |
|---|---|---|---|
| EP16880115.7A Active EP3394939B1 (de) | 2015-12-22 | 2016-12-22 | System und verfahren zur etikettenfreien zytometrie basierend auf brillouin-lichtstreuung |
Country Status (4)
| Country | Link |
|---|---|
| US (2) | US10386288B2 (de) |
| EP (1) | EP3394939B1 (de) |
| JP (1) | JP7138050B2 (de) |
| WO (1) | WO2017112896A1 (de) |
Families Citing this family (29)
| Publication number | Priority date | Publication date | Assignee | Title |
|---|---|---|---|---|
| CN109313119B (zh) * | 2016-06-20 | 2021-11-02 | 普莱尔股份公司 | 用于检测和/或表征流体携带的颗粒的装置和方法 |
| US11143555B2 (en) | 2017-01-27 | 2021-10-12 | University Of Maryland, College Park | Methods and devices for reducing spectral noise and spectrometry systems employing such devices |
| JP7148530B2 (ja) * | 2017-03-01 | 2022-10-05 | ユニバーシティ オブ メリーランド,カレッジ パーク | 核の機械的シグネチャに基づく細胞分類 |
| WO2018224688A1 (en) * | 2017-06-08 | 2018-12-13 | Lumito Ab | A method of analysing a sample for at least one analyte |
| AU2018317474B2 (en) * | 2017-08-18 | 2023-11-09 | The General Hospital Corporation | Systems and methods for brillouin spectroscopy and imaging of tissues |
| EP3467563A1 (de) * | 2017-10-06 | 2019-04-10 | Siemens Healthcare GmbH | Mikroskopiervorrichtung |
| EP3704767B1 (de) * | 2017-10-30 | 2023-12-27 | University of Maryland, College Park | Brillouin-abbildungssystem und verfahren mit solchem system |
| US10929716B2 (en) * | 2018-09-12 | 2021-02-23 | Molecular Devices, Llc | System and method for label-free identification and classification of biological samples |
| US11060912B2 (en) | 2018-12-06 | 2021-07-13 | University Of Maryland, College Park | Multi-stage parallel spectroscopy systems and methods |
| US10989591B2 (en) | 2019-02-08 | 2021-04-27 | University Of Maryland, College Park | Methods and arrangements to enhance optical signals within aberrated or scattering samples |
| CN109856807B (zh) * | 2019-02-15 | 2020-12-22 | 哈尔滨工程大学 | 一种基于透镜阵列的二次分像方法 |
| KR102394398B1 (ko) * | 2019-06-03 | 2022-05-06 | 주식회사 브릴리온포토닉스 | 프로브형 브릴루앙 광산란 측정 장치 |
| CN110426372B (zh) * | 2019-07-16 | 2021-10-22 | 南昌航空大学 | 一种扫频式布里渊散射体弹性模量成像检测方法 |
| CN110907318B (zh) * | 2019-11-07 | 2021-02-09 | 中国科学院遥感与数字地球研究所 | 一种近地面大气总悬浮颗粒物质量浓度遥感物理估算方法 |
| BR112022017163A2 (pt) * | 2020-02-27 | 2022-11-08 | Intelon Optics Inc | Método e sistema para medir pelo menos uma propriedade biomecânica de uma estrutura celular reprodutiva |
| US11879827B2 (en) | 2020-04-29 | 2024-01-23 | Becton, Dickinson And Company | Methods for modulation and synchronous detection in a flow cytometer and systems for same |
| WO2022031815A1 (en) | 2020-08-04 | 2022-02-10 | University Of Maryland, College Park | Full-field brillouin microscopy systems and methods |
| EP3978905A1 (de) | 2020-10-02 | 2022-04-06 | Université Côte d'Azur | Optoakustische überwachungsvorrichtung zur charakterisierung von zellen |
| CN112697179B (zh) * | 2020-11-17 | 2023-06-20 | 浙江工业大学 | 一种基于AdaBoost的布里渊频移提取方法 |
| GB2629259B (en) * | 2021-07-21 | 2025-05-28 | Element Biosciences Inc | Optical systems for nucleic acid sequencing and methods thereof |
| CN114371147B (zh) * | 2021-12-30 | 2024-03-29 | 北京无线电计量测试研究所 | 可准确测量介质横向与纵向声学声子速度的共焦显微装置 |
| CN115508313B (zh) * | 2022-08-02 | 2025-08-08 | 南昌航空大学 | 一种线阵扫描布里渊散射弹性成像装置 |
| FR3144659B1 (fr) * | 2022-12-30 | 2025-12-05 | Commissariat Energie Atomique | Dispositif et procédé d’analyse par spectroscopie Brillouin |
| US12546721B2 (en) * | 2023-01-23 | 2026-02-10 | Lightsense Technology, Inc. | Multispectral detection and classification of bacteria utilizing scattering and/or absorbance, excitation, emissions utilizing machine learning |
| US20240272073A1 (en) * | 2023-02-13 | 2024-08-15 | Wayne State University | Versatile multimodal optical modality based on brillouin light scattering and photoacoustic effect |
| EP4579211A1 (de) * | 2023-12-29 | 2025-07-02 | Malvern Panalytical Limited | Partikelcharakterisierung |
| WO2025168660A1 (de) * | 2024-02-06 | 2025-08-14 | Leibniz-Institut Für Naturstoff-Forschung Und Infektionsbiologie E. V. - Hans-Knöll-Institut (Hki) | Optische messvorrichtung, messverfahren und auswerteverfahren |
| IT202400005674A1 (it) * | 2024-03-14 | 2025-09-14 | Crestoptics S P A | Sistema perfezionato di rivelazione brillouin |
| CN121140886A (zh) * | 2025-11-19 | 2025-12-16 | 南昌航空大学 | 一维燃烧场组分浓度与温度的高精度测量装置及方法 |
Family Cites Families (18)
| Publication number | Priority date | Publication date | Assignee | Title |
|---|---|---|---|---|
| GB8920571D0 (en) | 1989-09-12 | 1989-10-25 | Carr Robert J G | Examination of objects of macromolecular size |
| US5784162A (en) * | 1993-08-18 | 1998-07-21 | Applied Spectral Imaging Ltd. | Spectral bio-imaging methods for biological research, medical diagnostics and therapy |
| JPH0772066A (ja) * | 1993-03-17 | 1995-03-17 | Shinichi Ito | 高純度物質中微粒子散乱光検出装置及び分散式ファブリ・ペロー型分光装置並びに平行平面鏡の製造方法及び波長安定化装置 |
| EP0868535B9 (de) | 1996-01-23 | 2007-05-09 | Qiagen Genomics, Inc. | Verfahren und zusammenstellungen zur sequenzbestimmung von nukleinsäuremolekulen |
| US20030113821A1 (en) | 2000-07-12 | 2003-06-19 | Akikuni Yagita | Means of assaying immune function |
| US8115919B2 (en) * | 2007-05-04 | 2012-02-14 | The General Hospital Corporation | Methods, arrangements and systems for obtaining information associated with a sample using optical microscopy |
| US20090004670A1 (en) | 2007-06-29 | 2009-01-01 | Jingwu Zhang | Methods for fabricating surface enhanced fluorescent (sef) nanoparticles and their applications in bioassays |
| US8184298B2 (en) * | 2008-05-21 | 2012-05-22 | The Board Of Trustees Of The University Of Illinois | Spatial light interference microscopy and fourier transform light scattering for cell and tissue characterization |
| US8810796B2 (en) * | 2009-04-21 | 2014-08-19 | Michigan Aerospace Corporation | Light processing system and method |
| CN102439393B (zh) * | 2009-05-15 | 2014-08-20 | 密歇根宇航公司 | 范围成像激光雷达 |
| US20120225475A1 (en) * | 2010-11-16 | 2012-09-06 | 1087 Systems, Inc. | Cytometry system with quantum cascade laser source, acoustic detector, and micro-fluidic cell handling system configured for inspection of individual cells |
| EP3838123A1 (de) | 2011-04-29 | 2021-06-23 | The General Hospital Corporation | Verfahren und anordnungen zur gewinnung von informationen und zur bereitstellung von analysen für biologische gewebe |
| US9498122B2 (en) | 2013-06-18 | 2016-11-22 | Avedro, Inc. | Systems and methods for determining biomechanical properties of the eye for applying treatment |
| JP6143289B2 (ja) | 2013-07-16 | 2017-06-07 | 国立研究開発法人理化学研究所 | 水晶体の弾性測定方法、水晶体の弾性測定装置、及び水晶体の老視判定装置 |
| US20160151202A1 (en) | 2013-07-19 | 2016-06-02 | The General Hospital Corporation | System, method and arrangements for modifying optical and mechanical properties of biological tissues |
| JP6325660B2 (ja) | 2013-10-11 | 2018-05-16 | バーフェリヒト ゲゼルシャフト ミット ベシュレンクテル ハフツング | 診断システム及び診断方法 |
| CN103884703B (zh) | 2014-03-10 | 2016-10-05 | 北京理工大学 | 分光瞳激光差动共焦布里渊-拉曼光谱测量方法及装置 |
| WO2017053592A1 (en) | 2015-09-23 | 2017-03-30 | The Regents Of The University Of California | Deep learning in label-free cell classification and machine vision extraction of particles |
-
2016
- 2016-12-22 EP EP16880115.7A patent/EP3394939B1/de active Active
- 2016-12-22 US US15/388,582 patent/US10386288B2/en active Active
- 2016-12-22 WO PCT/US2016/068405 patent/WO2017112896A1/en not_active Ceased
- 2016-12-22 JP JP2018553041A patent/JP7138050B2/ja active Active
-
2019
- 2019-07-23 US US16/520,134 patent/US10670511B2/en active Active
Also Published As
| Publication number | Publication date |
|---|---|
| WO2017112896A1 (en) | 2017-06-29 |
| US20200018685A1 (en) | 2020-01-16 |
| JP7138050B2 (ja) | 2022-09-15 |
| US10386288B2 (en) | 2019-08-20 |
| EP3394939A4 (de) | 2019-08-07 |
| US10670511B2 (en) | 2020-06-02 |
| US20170176318A1 (en) | 2017-06-22 |
| JP2019508710A (ja) | 2019-03-28 |
| EP3394939A1 (de) | 2018-10-31 |
Similar Documents
| Publication | Publication Date | Title |
|---|---|---|
| US10670511B2 (en) | System and method of label-free cytometry based on Brillouin light scattering | |
| US10598594B2 (en) | Cell classification based on mechanical signature of nucleus | |
| US10732092B2 (en) | Analysis of single cell mechanical phenotyping for metastatic detection | |
| EP3589196B1 (de) | Zellklassifizierung auf der basis der mechanischen signatur des zellkerns | |
| US7697576B2 (en) | Cytological analysis by raman spectroscopic imaging | |
| US9830501B2 (en) | High throughput partial wave spectroscopic microscopy and associated systems and methods | |
| US20060281068A1 (en) | Cytological methods for detecting a disease condition such as malignancy by Raman spectroscopic imaging | |
| US20070178067A1 (en) | System and method for cytological analysis by raman spectroscopic imaging | |
| US20060253261A1 (en) | Digitizing biology | |
| US20120200850A1 (en) | Cytological methods for detecting a condition such as transplant efficiency by raman spectroscopic imaging | |
| US20180313758A1 (en) | High throughput method and apparatus for measuring multiple optical properties of a liquid sample | |
| EP3635373B1 (de) | Analyse von mechanischer einzelzellenphänotypisierung zur erkennung von metastasen | |
| Mousoulis et al. | Single cell spectroscopy: Noninvasive measures of small-scale structure and function | |
| US12313829B2 (en) | Fast scanning microscope systems, and related optics and methods | |
| EP4463690A1 (de) | Vorrichtung und verfahren zur fluoreszenzabbildung | |
| WO2007011571A2 (en) | Digitizing biology | |
| Baria | Multimodal imaging for tissue diagnostics by combined two-photon and Raman microscopy | |
| Lefort et al. | Design of an optimized distal optic for non linear endomicroscopy | |
| Qi | Advances in Raman and Surface-Enhanced Raman Spectroscopy: Instrumentation, Plasmonic Engineering and Biomolecular Sensing | |
| EP1906814A2 (de) | Digitalisierende biologie |
Legal Events
| Date | Code | Title | Description |
|---|---|---|---|
| STAA | Information on the status of an ep patent application or granted ep patent |
Free format text: STATUS: THE INTERNATIONAL PUBLICATION HAS BEEN MADE |
|
| PUAI | Public reference made under article 153(3) epc to a published international application that has entered the european phase |
Free format text: ORIGINAL CODE: 0009012 |
|
| STAA | Information on the status of an ep patent application or granted ep patent |
Free format text: STATUS: REQUEST FOR EXAMINATION WAS MADE |
|
| 17P | Request for examination filed |
Effective date: 20180720 |
|
| AK | Designated contracting states |
Kind code of ref document: A1 Designated state(s): AL AT BE BG CH CY CZ DE DK EE ES FI FR GB GR HR HU IE IS IT LI LT LU LV MC MK MT NL NO PL PT RO RS SE SI SK SM TR |
|
| AX | Request for extension of the european patent |
Extension state: BA ME |
|
| DAV | Request for validation of the european patent (deleted) | ||
| DAX | Request for extension of the european patent (deleted) | ||
| A4 | Supplementary search report drawn up and despatched |
Effective date: 20190704 |
|
| RIC1 | Information provided on ipc code assigned before grant |
Ipc: G01N 15/10 20060101ALI20190628BHEP Ipc: H01S 3/108 20060101ALI20190628BHEP Ipc: G01N 21/63 20060101ALI20190628BHEP Ipc: H01S 3/30 20060101ALI20190628BHEP Ipc: G01N 15/14 20060101ALI20190628BHEP Ipc: H01S 3/00 20060101AFI20190628BHEP Ipc: G01N 15/00 20060101ALI20190628BHEP |
|
| STAA | Information on the status of an ep patent application or granted ep patent |
Free format text: STATUS: EXAMINATION IS IN PROGRESS |
|
| 17Q | First examination report despatched |
Effective date: 20211115 |
|
| P01 | Opt-out of the competence of the unified patent court (upc) registered |
Effective date: 20230530 |
|
| REG | Reference to a national code |
Free format text: PREVIOUS MAIN CLASS: H01S0003000000 Ref country code: DE Ref legal event code: R079 Ref document number: 602016090345 Country of ref document: DE Ipc: G01N0015143400 |
|
| GRAP | Despatch of communication of intention to grant a patent |
Free format text: ORIGINAL CODE: EPIDOSNIGR1 |
|
| STAA | Information on the status of an ep patent application or granted ep patent |
Free format text: STATUS: GRANT OF PATENT IS INTENDED |
|
| RIC1 | Information provided on ipc code assigned before grant |
Ipc: H01S 3/108 20060101ALI20240522BHEP Ipc: H01S 3/30 20060101ALI20240522BHEP Ipc: H01S 3/00 20060101ALI20240522BHEP Ipc: G01N 21/63 20060101ALI20240522BHEP Ipc: G01N 15/00 20060101ALI20240522BHEP Ipc: G01N 15/10 20060101ALI20240522BHEP Ipc: G01N 15/14 20060101ALI20240522BHEP Ipc: G01N 15/1434 20240101AFI20240522BHEP |
|
| INTG | Intention to grant announced |
Effective date: 20240611 |
|
| GRAS | Grant fee paid |
Free format text: ORIGINAL CODE: EPIDOSNIGR3 |
|
| GRAA | (expected) grant |
Free format text: ORIGINAL CODE: 0009210 |
|
| STAA | Information on the status of an ep patent application or granted ep patent |
Free format text: STATUS: THE PATENT HAS BEEN GRANTED |
|
| AK | Designated contracting states |
Kind code of ref document: B1 Designated state(s): AL AT BE BG CH CY CZ DE DK EE ES FI FR GB GR HR HU IE IS IT LI LT LU LV MC MK MT NL NO PL PT RO RS SE SI SK SM TR |
|
| REG | Reference to a national code |
Ref country code: GB Ref legal event code: FG4D |
|
| REG | Reference to a national code |
Ref country code: CH Ref legal event code: EP |
|
| REG | Reference to a national code |
Ref country code: DE Ref legal event code: R096 Ref document number: 602016090345 Country of ref document: DE |
|
| REG | Reference to a national code |
Ref country code: IE Ref legal event code: FG4D |
|
| PGFP | Annual fee paid to national office [announced via postgrant information from national office to epo] |
Ref country code: DE Payment date: 20241126 Year of fee payment: 9 |
|
| REG | Reference to a national code |
Ref country code: LT Ref legal event code: MG9D |
|
| REG | Reference to a national code |
Ref country code: NL Ref legal event code: MP Effective date: 20241120 |
|
| PG25 | Lapsed in a contracting state [announced via postgrant information from national office to epo] |
Ref country code: IS Free format text: LAPSE BECAUSE OF FAILURE TO SUBMIT A TRANSLATION OF THE DESCRIPTION OR TO PAY THE FEE WITHIN THE PRESCRIBED TIME-LIMIT Effective date: 20250320 Ref country code: HR Free format text: LAPSE BECAUSE OF FAILURE TO SUBMIT A TRANSLATION OF THE DESCRIPTION OR TO PAY THE FEE WITHIN THE PRESCRIBED TIME-LIMIT Effective date: 20241120 Ref country code: PT Free format text: LAPSE BECAUSE OF FAILURE TO SUBMIT A TRANSLATION OF THE DESCRIPTION OR TO PAY THE FEE WITHIN THE PRESCRIBED TIME-LIMIT Effective date: 20250320 |
|
| PG25 | Lapsed in a contracting state [announced via postgrant information from national office to epo] |
Ref country code: FI Free format text: LAPSE BECAUSE OF FAILURE TO SUBMIT A TRANSLATION OF THE DESCRIPTION OR TO PAY THE FEE WITHIN THE PRESCRIBED TIME-LIMIT Effective date: 20241120 Ref country code: NL Free format text: LAPSE BECAUSE OF FAILURE TO SUBMIT A TRANSLATION OF THE DESCRIPTION OR TO PAY THE FEE WITHIN THE PRESCRIBED TIME-LIMIT Effective date: 20241120 |
|
| REG | Reference to a national code |
Ref country code: AT Ref legal event code: MK05 Ref document number: 1743976 Country of ref document: AT Kind code of ref document: T Effective date: 20241120 |
|
| PG25 | Lapsed in a contracting state [announced via postgrant information from national office to epo] |
Ref country code: BG Free format text: LAPSE BECAUSE OF FAILURE TO SUBMIT A TRANSLATION OF THE DESCRIPTION OR TO PAY THE FEE WITHIN THE PRESCRIBED TIME-LIMIT Effective date: 20241120 |
|
| PG25 | Lapsed in a contracting state [announced via postgrant information from national office to epo] |
Ref country code: ES Free format text: LAPSE BECAUSE OF FAILURE TO SUBMIT A TRANSLATION OF THE DESCRIPTION OR TO PAY THE FEE WITHIN THE PRESCRIBED TIME-LIMIT Effective date: 20241120 |
|
| PG25 | Lapsed in a contracting state [announced via postgrant information from national office to epo] |
Ref country code: NO Free format text: LAPSE BECAUSE OF FAILURE TO SUBMIT A TRANSLATION OF THE DESCRIPTION OR TO PAY THE FEE WITHIN THE PRESCRIBED TIME-LIMIT Effective date: 20250220 |
|
| PG25 | Lapsed in a contracting state [announced via postgrant information from national office to epo] |
Ref country code: LV Free format text: LAPSE BECAUSE OF FAILURE TO SUBMIT A TRANSLATION OF THE DESCRIPTION OR TO PAY THE FEE WITHIN THE PRESCRIBED TIME-LIMIT Effective date: 20241120 Ref country code: GR Free format text: LAPSE BECAUSE OF FAILURE TO SUBMIT A TRANSLATION OF THE DESCRIPTION OR TO PAY THE FEE WITHIN THE PRESCRIBED TIME-LIMIT Effective date: 20250221 Ref country code: AT Free format text: LAPSE BECAUSE OF FAILURE TO SUBMIT A TRANSLATION OF THE DESCRIPTION OR TO PAY THE FEE WITHIN THE PRESCRIBED TIME-LIMIT Effective date: 20241120 |
|
| PG25 | Lapsed in a contracting state [announced via postgrant information from national office to epo] |
Ref country code: PL Free format text: LAPSE BECAUSE OF FAILURE TO SUBMIT A TRANSLATION OF THE DESCRIPTION OR TO PAY THE FEE WITHIN THE PRESCRIBED TIME-LIMIT Effective date: 20241120 |
|
| PG25 | Lapsed in a contracting state [announced via postgrant information from national office to epo] |
Ref country code: RS Free format text: LAPSE BECAUSE OF FAILURE TO SUBMIT A TRANSLATION OF THE DESCRIPTION OR TO PAY THE FEE WITHIN THE PRESCRIBED TIME-LIMIT Effective date: 20250220 |
|
| PG25 | Lapsed in a contracting state [announced via postgrant information from national office to epo] |
Ref country code: SM Free format text: LAPSE BECAUSE OF FAILURE TO SUBMIT A TRANSLATION OF THE DESCRIPTION OR TO PAY THE FEE WITHIN THE PRESCRIBED TIME-LIMIT Effective date: 20241120 |
|
| PG25 | Lapsed in a contracting state [announced via postgrant information from national office to epo] |
Ref country code: DK Free format text: LAPSE BECAUSE OF FAILURE TO SUBMIT A TRANSLATION OF THE DESCRIPTION OR TO PAY THE FEE WITHIN THE PRESCRIBED TIME-LIMIT Effective date: 20241120 |
|
| PG25 | Lapsed in a contracting state [announced via postgrant information from national office to epo] |
Ref country code: EE Free format text: LAPSE BECAUSE OF FAILURE TO SUBMIT A TRANSLATION OF THE DESCRIPTION OR TO PAY THE FEE WITHIN THE PRESCRIBED TIME-LIMIT Effective date: 20241120 |
|
| PG25 | Lapsed in a contracting state [announced via postgrant information from national office to epo] |
Ref country code: RO Free format text: LAPSE BECAUSE OF FAILURE TO SUBMIT A TRANSLATION OF THE DESCRIPTION OR TO PAY THE FEE WITHIN THE PRESCRIBED TIME-LIMIT Effective date: 20241120 |
|
| PG25 | Lapsed in a contracting state [announced via postgrant information from national office to epo] |
Ref country code: SK Free format text: LAPSE BECAUSE OF FAILURE TO SUBMIT A TRANSLATION OF THE DESCRIPTION OR TO PAY THE FEE WITHIN THE PRESCRIBED TIME-LIMIT Effective date: 20241120 |
|
| PG25 | Lapsed in a contracting state [announced via postgrant information from national office to epo] |
Ref country code: CZ Free format text: LAPSE BECAUSE OF FAILURE TO SUBMIT A TRANSLATION OF THE DESCRIPTION OR TO PAY THE FEE WITHIN THE PRESCRIBED TIME-LIMIT Effective date: 20241120 |
|
| PG25 | Lapsed in a contracting state [announced via postgrant information from national office to epo] |
Ref country code: IT Free format text: LAPSE BECAUSE OF FAILURE TO SUBMIT A TRANSLATION OF THE DESCRIPTION OR TO PAY THE FEE WITHIN THE PRESCRIBED TIME-LIMIT Effective date: 20241120 |
|
| REG | Reference to a national code |
Ref country code: CH Ref legal event code: PL |
|
| PG25 | Lapsed in a contracting state [announced via postgrant information from national office to epo] |
Ref country code: LU Free format text: LAPSE BECAUSE OF NON-PAYMENT OF DUE FEES Effective date: 20241222 |
|
| REG | Reference to a national code |
Ref country code: DE Ref legal event code: R097 Ref document number: 602016090345 Country of ref document: DE |
|
| PG25 | Lapsed in a contracting state [announced via postgrant information from national office to epo] |
Ref country code: SE Free format text: LAPSE BECAUSE OF FAILURE TO SUBMIT A TRANSLATION OF THE DESCRIPTION OR TO PAY THE FEE WITHIN THE PRESCRIBED TIME-LIMIT Effective date: 20241120 |
|
| PG25 | Lapsed in a contracting state [announced via postgrant information from national office to epo] |
Ref country code: MC Free format text: LAPSE BECAUSE OF FAILURE TO SUBMIT A TRANSLATION OF THE DESCRIPTION OR TO PAY THE FEE WITHIN THE PRESCRIBED TIME-LIMIT Effective date: 20241120 |
|
| PLBE | No opposition filed within time limit |
Free format text: ORIGINAL CODE: 0009261 |
|
| STAA | Information on the status of an ep patent application or granted ep patent |
Free format text: STATUS: NO OPPOSITION FILED WITHIN TIME LIMIT |
|
| REG | Reference to a national code |
Ref country code: BE Ref legal event code: MM Effective date: 20241231 |
|
| PG25 | Lapsed in a contracting state [announced via postgrant information from national office to epo] |
Ref country code: BE Free format text: LAPSE BECAUSE OF NON-PAYMENT OF DUE FEES Effective date: 20241231 |
|
| PG25 | Lapsed in a contracting state [announced via postgrant information from national office to epo] |
Ref country code: FR Free format text: LAPSE BECAUSE OF NON-PAYMENT OF DUE FEES Effective date: 20250120 |
|
| PG25 | Lapsed in a contracting state [announced via postgrant information from national office to epo] |
Ref country code: CH Free format text: LAPSE BECAUSE OF NON-PAYMENT OF DUE FEES Effective date: 20241231 |
|
| 26N | No opposition filed |
Effective date: 20250821 |
|
| PG25 | Lapsed in a contracting state [announced via postgrant information from national office to epo] |
Ref country code: IE Free format text: LAPSE BECAUSE OF NON-PAYMENT OF DUE FEES Effective date: 20241222 |
|
| GBPC | Gb: european patent ceased through non-payment of renewal fee |
Effective date: 20250220 |
|
| PG25 | Lapsed in a contracting state [announced via postgrant information from national office to epo] |
Ref country code: GB Free format text: LAPSE BECAUSE OF NON-PAYMENT OF DUE FEES Effective date: 20250220 |
|
| PG25 | Lapsed in a contracting state [announced via postgrant information from national office to epo] |
Ref country code: CY Free format text: LAPSE BECAUSE OF FAILURE TO SUBMIT A TRANSLATION OF THE DESCRIPTION OR TO PAY THE FEE WITHIN THE PRESCRIBED TIME-LIMIT Effective date: 20241120 |