EP3333660A1 - Anomalieprädiktordiagnosesystem und anomalieprädiktordiagnoseverfahren - Google Patents
Anomalieprädiktordiagnosesystem und anomalieprädiktordiagnoseverfahren Download PDFInfo
- Publication number
- EP3333660A1 EP3333660A1 EP16833062.9A EP16833062A EP3333660A1 EP 3333660 A1 EP3333660 A1 EP 3333660A1 EP 16833062 A EP16833062 A EP 16833062A EP 3333660 A1 EP3333660 A1 EP 3333660A1
- Authority
- EP
- European Patent Office
- Prior art keywords
- waveform
- time
- diagnosis
- operation process
- learning
- Prior art date
- Legal status (The legal status is an assumption and is not a legal conclusion. Google has not performed a legal analysis and makes no representation as to the accuracy of the status listed.)
- Granted
Links
Images


Classifications
-
- G—PHYSICS
- G05—CONTROLLING; REGULATING
- G05B—CONTROL OR REGULATING SYSTEMS IN GENERAL; FUNCTIONAL ELEMENTS OF SUCH SYSTEMS; MONITORING OR TESTING ARRANGEMENTS FOR SUCH SYSTEMS OR ELEMENTS
- G05B23/00—Testing or monitoring of control systems or parts thereof
- G05B23/02—Electric testing or monitoring
- G05B23/0205—Electric testing or monitoring by means of a monitoring system capable of detecting and responding to faults
- G05B23/0259—Electric testing or monitoring by means of a monitoring system capable of detecting and responding to faults characterized by the response to fault detection
- G05B23/0283—Predictive maintenance, e.g. involving the monitoring of a system and, based on the monitoring results, taking decisions on the maintenance schedule of the monitored system; Estimating remaining useful life [RUL]
-
- G—PHYSICS
- G05—CONTROLLING; REGULATING
- G05B—CONTROL OR REGULATING SYSTEMS IN GENERAL; FUNCTIONAL ELEMENTS OF SUCH SYSTEMS; MONITORING OR TESTING ARRANGEMENTS FOR SUCH SYSTEMS OR ELEMENTS
- G05B23/00—Testing or monitoring of control systems or parts thereof
- G05B23/02—Electric testing or monitoring
- G05B23/0205—Electric testing or monitoring by means of a monitoring system capable of detecting and responding to faults
- G05B23/0218—Electric testing or monitoring by means of a monitoring system capable of detecting and responding to faults characterised by the fault detection method dealing with either existing or incipient faults
- G05B23/0224—Process history based detection method, e.g. whereby history implies the availability of large amounts of data
- G05B23/024—Quantitative history assessment, e.g. mathematical relationships between available data; Functions therefor; Principal component analysis [PCA]; Partial least square [PLS]; Statistical classifiers, e.g. Bayesian networks, linear regression or correlation analysis; Neural networks
-
- G—PHYSICS
- G05—CONTROLLING; REGULATING
- G05B—CONTROL OR REGULATING SYSTEMS IN GENERAL; FUNCTIONAL ELEMENTS OF SUCH SYSTEMS; MONITORING OR TESTING ARRANGEMENTS FOR SUCH SYSTEMS OR ELEMENTS
- G05B23/00—Testing or monitoring of control systems or parts thereof
- G05B23/02—Electric testing or monitoring
- G05B23/0205—Electric testing or monitoring by means of a monitoring system capable of detecting and responding to faults
- G05B23/0259—Electric testing or monitoring by means of a monitoring system capable of detecting and responding to faults characterized by the response to fault detection
- G05B23/0264—Control of logging system, e.g. decision on which data to store; time-stamping measurements
-
- G—PHYSICS
- G05—CONTROLLING; REGULATING
- G05B—CONTROL OR REGULATING SYSTEMS IN GENERAL; FUNCTIONAL ELEMENTS OF SUCH SYSTEMS; MONITORING OR TESTING ARRANGEMENTS FOR SUCH SYSTEMS OR ELEMENTS
- G05B2219/00—Program-control systems
- G05B2219/30—Nc systems
- G05B2219/32—Operator till task planning
- G05B2219/32201—Build statistical model of past normal proces, compare with actual process
-
- G—PHYSICS
- G05—CONTROLLING; REGULATING
- G05B—CONTROL OR REGULATING SYSTEMS IN GENERAL; FUNCTIONAL ELEMENTS OF SUCH SYSTEMS; MONITORING OR TESTING ARRANGEMENTS FOR SUCH SYSTEMS OR ELEMENTS
- G05B23/00—Testing or monitoring of control systems or parts thereof
- G05B23/02—Electric testing or monitoring
- G05B23/0205—Electric testing or monitoring by means of a monitoring system capable of detecting and responding to faults
- G05B23/0259—Electric testing or monitoring by means of a monitoring system capable of detecting and responding to faults characterized by the response to fault detection
- G05B23/0275—Fault isolation and identification, e.g. classify fault; estimate cause or root of failure
- G05B23/0281—Quantitative, e.g. mathematical distance; Clustering; Neural networks; Statistical analysis
-
- G—PHYSICS
- G06—COMPUTING OR CALCULATING; COUNTING
- G06F—ELECTRIC DIGITAL DATA PROCESSING
- G06F2218/00—Aspects of pattern recognition specially adapted for signal processing
- G06F2218/08—Feature extraction
-
- G—PHYSICS
- G06—COMPUTING OR CALCULATING; COUNTING
- G06F—ELECTRIC DIGITAL DATA PROCESSING
- G06F2218/00—Aspects of pattern recognition specially adapted for signal processing
- G06F2218/08—Feature extraction
- G06F2218/10—Feature extraction by analysing the shape of a waveform, e.g. extracting parameters relating to peaks
-
- G—PHYSICS
- G06—COMPUTING OR CALCULATING; COUNTING
- G06F—ELECTRIC DIGITAL DATA PROCESSING
- G06F2218/00—Aspects of pattern recognition specially adapted for signal processing
- G06F2218/12—Classification; Matching
-
- G—PHYSICS
- G06—COMPUTING OR CALCULATING; COUNTING
- G06F—ELECTRIC DIGITAL DATA PROCESSING
- G06F2218/00—Aspects of pattern recognition specially adapted for signal processing
- G06F2218/12—Classification; Matching
- G06F2218/14—Classification; Matching by matching peak patterns
-
- G—PHYSICS
- G06—COMPUTING OR CALCULATING; COUNTING
- G06F—ELECTRIC DIGITAL DATA PROCESSING
- G06F2218/00—Aspects of pattern recognition specially adapted for signal processing
- G06F2218/12—Classification; Matching
- G06F2218/16—Classification; Matching by matching signal segments
-
- G—PHYSICS
- G07—CHECKING-DEVICES
- G07C—TIME OR ATTENDANCE REGISTERS; REGISTERING OR INDICATING THE WORKING OF MACHINES; GENERATING RANDOM NUMBERS; VOTING OR LOTTERY APPARATUS; ARRANGEMENTS, SYSTEMS OR APPARATUS FOR CHECKING NOT PROVIDED FOR ELSEWHERE
- G07C3/00—Registering or indicating the condition or the working of machines or other apparatus, other than vehicles
-
- Y—GENERAL TAGGING OF NEW TECHNOLOGICAL DEVELOPMENTS; GENERAL TAGGING OF CROSS-SECTIONAL TECHNOLOGIES SPANNING OVER SEVERAL SECTIONS OF THE IPC; TECHNICAL SUBJECTS COVERED BY FORMER USPC CROSS-REFERENCE ART COLLECTIONS [XRACs] AND DIGESTS
- Y02—TECHNOLOGIES OR APPLICATIONS FOR MITIGATION OR ADAPTATION AGAINST CLIMATE CHANGE
- Y02P—CLIMATE CHANGE MITIGATION TECHNOLOGIES IN THE PRODUCTION OR PROCESSING OF GOODS
- Y02P90/00—Enabling technologies with a potential contribution to greenhouse gas [GHG] emissions mitigation
- Y02P90/02—Total factory control, e.g. smart factories, flexible manufacturing systems [FMS] or integrated manufacturing systems [IMS]
Definitions
- the present invention relates to an abnormality predictor diagnosis system and the like that diagnose a mechanical facility for the presence of an abnormality predictor.
- a technique that diagnoses a mechanical facility for the presence of an abnormality predictor based on detection values of a sensor installed in the mechanical facility.
- Patent Literature 1 describes an abnormality predictor diagnosis device that divides an operation schedule of a mechanical facility into multiple time slots, learns a cluster which indicates a normal range of the mechanical facility by clustering time-series data for each time slot, and diagnoses the mechanical facility for the presence of an abnormality predictor based on the cluster.
- Patent Literature 2 describes a plant monitoring device that obtains image data as learning data with 15-minute intervals, the image data indicating a temperature distribution of a plant to be monitored, learns a normal pattern of a temperature change using a neural network based on the learning data, and further identifies the presence or absence of abnormality of the plant to be monitored, based on the normal pattern.
- Patent Literature 2 As described above, a normal pattern is learned based on the image data obtained with 15-minute intervals. However, the temperature distribution of a plant to be monitored varies every moment, and when the time-series waveform is attempted to be reflected in a normal pattern accurately, the amount of computation in a neural network becomes huge. Therefore, the technique described in Patent Literature 2 also has more room for improvement in diagnostic accuracy.
- an object of the present invention to provide an abnormality predictor diagnosis system and the like capable of diagnosing a mechanical facility for the presence of an abnormality predictor with high accuracy.
- an abnormality predictor diagnosis system includes: a sensor data acquisition means that acquires sensor data including a detection value of a sensor installed in a mechanical facility in which a predetermined operation process is repeated; a learning means that sets a learning target of a time-series waveform of the sensor data in a period in which the mechanical facility is known to be normal, extracts a start point of the waveform at a start time of the operation process, a plurality of extremum points including a local maximum point and a local minimum point of the waveform, and an end point of the waveform at an end time of the operation process as feature points, acquires the detection value of the sensor at the feature points and an elapsed time which is from the start time of the operation process and corresponds to each of the feature points, as waveform data indicating the waveform, determines the time-series waveform of the sensor data to be a normal waveform based on the waveform data for the operation process repeated, converts the normal waveform
- an abnormality predictor diagnosis system and the like that diagnose a mechanical facility for the presence of an abnormality predictor with high accuracy.
- FIG. 1 is a configuration diagram of an abnormality predictor diagnosis system 1 according to a first embodiment.
- the abnormality predictor diagnosis system 1 is a system that diagnoses a mechanical facility 2 for the presence of an abnormality predictor based on sensor data including detection values of a sensor (not illustrated) installed in the mechanical facility 2.
- the above-mentioned “abnormality predictor” is a precursor to an occurrence of abnormality of the mechanical facility 2, and "abnormality predictor diagnosis” is to diagnose for the presence of an abnormality predictor.
- the mechanical facility 2 is, for instance, a chemical plant, and includes a reactor, and a device (not illustrated) that loads chemical substances to the reactor. Then, a predetermined "operation process" is repeated in the mechanical facility 2, thus predetermined chemical substances are generated in each process.
- the type of the mechanical facility 2 is not limited to this, and may be a pharmaceutical plant, a production line, a gas engine, a gas turbine, a power generation facility, a medical facility, or a communication facility.
- a sensor (not illustrated) which detects predetermined physical quantities (such as a temperature, a pressure, a flow rate, a current, a voltage) is installed.
- a physical quantity detected by the sensor is transmitted to the abnormality predictor diagnosis system 1 as sensor data via a network N.
- the sensor data also includes identification information of the mechanical facility 2, identification information of the sensor, and a signal indicating the start and end of an "operation process" which is repeated in the mechanical facility 2.
- the configuration of diagnosis of the mechanical facility 2 for the presence of an abnormality predictor based on the detection values of a sensor will be described, the sensor being one of multiple sensors installed in the mechanical facility 2 and sensitively reflecting an abnormality predictor of the mechanical facility 2.
- FIG. 2 is a waveform diagram illustrating a change in the detection values of the sensor. It is to be noted that the horizontal axis of FIG. 2 indicates time and the vertical axis indicates detection value of the sensor (not illustrated) installed in the mechanical facility 2.
- the 1st time operation process is executed in the mechanical facility 2 in the time slot from time t01 to time t02, and the 2nd time operation process is executed in the time slot from time t02 to time t03. Since the operation process is repeated in this manner, when the mechanical facility 2 is normal, the detection values of the sensor in the operation processes have a similar (that is, quite analogous) waveform.
- a time-series waveform (a waveform of each operation process) of sensor data is learned as a normal model based on the sensor data obtained in a predetermined learning period (see FIG. 2 ) in which the mechanical facility 2 is known to be normal, and the presence of an abnormality predictor of the mechanical facility 2 is determined based on the normal model.
- the details of the normal model will be described later.
- the abnormality predictor diagnosis system 1 includes a communication means 11, a sensor data acquisition means 12, a sensor data storage means 13, a data mining means 14, a diagnostic result storage means 15, a display control means 16, and a display means 17.
- the communication means 11 receives information including sensor data from the mechanical facility 2 via a network N.
- a router which receives information in accordance with a communication protocol of TCP/IP can be used as the communication means 11.
- the sensor data acquisition means 12 acquires the sensor data included in the information received by the communication means 11 via the network N, and stores the acquired sensor data in the sensor data storage means 13.
- the sensor data acquired by the sensor data acquisition means 12 is stored, for instance, as a database. It is to be noted that a magnetic disk device, an optical disk device, a semiconductor memory device and the like may be used as the sensor data storage means 13.
- the data mining means 14 learns a normal model of the waveform of detection values of the sensor by data mining that is a statistical data classification technique, and diagnoses the mechanical facility 2 for the presence of an abnormality predictor based on the normal model. The details of the data mining means 14 will be described later.
- a diagnostic result of the data mining means 14 is stored.
- the above-mentioned diagnostic result includes identification information of the mechanical facility 2, and the presence or absence of an abnormality predictor of the mechanical facility 2.
- the display control means 16 outputs to the display means 17 a control signal for displaying the diagnostic result of the data mining means 14. For instance, the display control means 16 displays a diagnostic result on the display means 17 in a matrix format with a row indicating the name of each a mechanical facility 2 and a column indicating the date of diagnosis.
- the display means 17 is, for instance, a liquid crystal display, and displays a diagnostic result in accordance with the control signal inputted from the display control means 16.
- FIG. 3 is a configuration diagram of the data mining means 14 included in the abnormality predictor diagnosis system 1.
- the data mining means 14 includes a learning means 141 and a diagnosis means 142.
- the learning means 141 learns a normal waveform of detection values of a sensor (not illustrated) as a normal model by clustering that is one of the techniques of data mining.
- the learning means 141 includes a learning target data acquisition unit 141a, a feature point extraction unit 141b, a feature point storage unit 141c, a cluster learning unit 141d, and a learning result storage unit 141e.
- the learning target data acquisition unit 141a acquires sensor data (that is, learning target data) which is a learning target from the sensor data storage means 13. Specifically, the learning target data acquisition unit 141a acquires sensor data for each operation process of the mechanical facility 2, the sensor data being acquired in a predetermined learning period (see FIG. 2 ) in which the mechanical facility 2 is known to be normal.
- the feature point extraction unit 141b extracts a "feature point" of the time-series waveform of the sensor data.
- the "feature point” includes points of the start time and end time of each operation process, in addition to a local maximum point and a local minimum point of the time-series waveform of the sensor data.
- a local maximum point and a local minimum point are also collectively called an "extremum point”.
- FIG. 4 is an explanatory diagram related to feature points of the waveform of sensor data.
- FIG. 4 illustrates the detection value of the sensor in the 1st time operation process illustrated in FIG. 2 .
- the feature point extraction unit 141b (see FIG. 3 ) identifies local maximum points M1, M2, and a local minimum point m of the waveform of the detection value as well as a start point s which is the start time of the 1st time operation process, and an end point e which is the end time of the 1st time operation process. For each of the start point s, the local maximum point M1, the local minimum point m, the local maximum point M2, and the end point e, the feature point extraction unit 141b identifies the detection value of the sensor, and an elapsed time from the time t01 at which the operation process has started. In other words, the feature point extraction unit 141b identifies detection values p1 to p5 illustrated in FIG. 4 , and elapsed times ⁇ t1 to ⁇ t5.
- the sensor data also includes a signal indicating the start and end of the operation process.
- the feature point extraction unit 141b (see FIG. 3 ) identifies the start point s and the end point e based on the signal. Also, the local maximum points M1, M2, and the local minimum point m are identified based on the change rate of each detection value that changes every moment. That is, a point, at which the change rate of the detection value of the sensor shifts from a positive to a negative, should be a local maximum point, and a point, at which the change rate shifts from a negative to a positive, should be a local minimum point.
- the feature point extraction unit 141b stores the detection values p1 to p5 and the elapsed times ⁇ t1 to ⁇ t5 in five feature points illustrated in FIG. 4 in the feature point storage unit 141c as a group of waveform data (data having 10-dimensional vector).
- the above-mentioned waveform data is a group of data indicating a normal waveform of the sensor data.
- the feature point extraction unit 141b extracts feature points similarly for the 2nd to nth time operation processes included in the learning period (see FIG. 2 ), and stores the feature points in the feature point storage unit 141c as the waveform data (detection values of the sensor, and elapsed times from the start time of the operation process).
- FIG. 5 is an explanatory diagram of data stored in the feature point storage unit 141c. It is to be noted that in FIG. 5 , the start point s (see FIG. 4 ) which is the start time of an operation process is referred to as “the 1st feature point”. Similarly, the local maximum point M1, the local minimum point m, the local maximum point M2, and the end point e are referred to as "the 2nd feature point", “the 3rd feature point”, “the 4th feature point", “the 5th feature point”.
- the waveform data is stored as a database.
- the waveform data (see the left end column in FIG. 5 ) of the 1st time operation process includes the detection values p1 to p5 (see FIG. 4 ), and the elapsed times ⁇ t1 to ⁇ t5 (see FIG. 4 ).
- the block of these pieces of waveform data is used in the cluster learning unit 141d (see FIG. 3 ) described subsequently when a 10-dimensional feature vector is generated. The same goes with the 2nd to nth time operation processes included in the learning period (see FIG. 2 ).
- the cluster learning unit 141d illustrated in FIG. 3 converts the above-mentioned waveform data into a feature vector, and clusters each feature vector, thereby learning a cluster that indicates a normal waveform of detection values of the sensor.
- FIG. 6 is an explanatory diagram of a cluster learned by the cluster learning unit 141d.
- a cluster J illustrated in FIG. 6 is the area identified by a cluster center c and a cluster radius r in a multi-dimensional vector space, and is learned based on the sensor data acquired in the learning period (see FIG. 2 ) .
- the time-series waveform of detection values of the sensor in the 1st time operation process is represented by a feature vector with component values obtained by performing normalization processing on the detection values p1 to p5 of the sensor and the elapsed times ⁇ t1 to ⁇ t5 from the start time of the operation process.
- the "normalization processing” is processing that divides the detection values and elapsed times by representative values (such as an average value, a standard deviation) to convert the values and elapsed times to dimensionless quantities to allow comparison between the quantities.
- Each • symbol (n symbols are present) illustrated in FIG. 6 is a feature vector, and corresponds to the waveform of the detection values of the sensor in one of the 1st to nth time operation processes (see FIG. 2 ).
- a feature vector (• symbol) is illustrated in a three-dimensional vector space in FIG. 6
- the waveform of the detection values of the sensor is actually represented by a 10-dimensional feature vector. This is because the five feature points (the start point s, the local maximum point M1, the local minimum point m, the local maximum point M2, and the end point e) illustrated in FIG. 4 are each identified by a detection value of the sensor and an elapsed time.
- (the number of feature points) ⁇ 2 is the number of dimensions of a feature vector that represents a normal waveform.
- the sensor data in operation processes that is, detection values acquired in time-series
- the sensor data in operation processes provides similar waveforms (see FIG. 2 ). Therefore, when the mechanical facility 2 is normal, the feature vectors indicating waveforms are often densely spaced.
- the cluster learning unit 141d (see FIG. 3 ) classifies n feature vectors indicated by • symbols of FIG. 6 into groups called clusters.
- clusters are learned by using k-means method which is non-hierarchical clustering.
- the cluster learning unit 141d first assigns a cluster to each feature vector at random, and calculates the center (the cluster center c, see FIG. 6 ) of each assigned cluster.
- the cluster center c is, for instance, the centroid of multiple feature vectors belonging to a cluster.
- the cluster learning unit 141d determines the distance between a predetermined feature vector and each cluster center c, and reassigns the feature vector to a cluster with the shortest distance.
- the cluster learning unit 141d executes such processing on all feature vectors.
- the cluster learning unit 141d completes cluster generation processing, or otherwise recalculates the cluster center c from a newly assigned cluster.
- the cluster learning unit 141d then calculates the coordinate values of the cluster center c (see FIG. 6 ), and the cluster radius r (see FIG. 6 ) for each cluster.
- the cluster radius r is, for instance, the average value of the distances between the cluster center c and the feature vectors belonging to the cluster.
- the method of calculating the cluster radius r is not limited to this. For instance, a feature vector farthest from the cluster center c among the feature vectors belonging to the cluster is identified, and the distance between the feature vector and the cluster center c may be the cluster radius r. In this manner, the cluster learning unit 141d learns the cluster J (see FIG. 6 ) as a normal model representing the waveform of the detection values of the sensor.
- the cluster learning unit 141d stores cluster information on the generated cluster in the learning result storage unit 141e (see FIG. 3 ).
- the cluster information which is the result of learning by the cluster learning unit 141d, is stored as a database.
- the cluster information includes the cluster center c (see FIG. 6 ), the cluster radius r (see FIG. 6 ), and identification information of the mechanical facility 2.
- the diagnosis means 142 diagnoses the mechanical facility 2 for the presence of an abnormality predictor based on comparison between the cluster (normal model) learned by the learning means 141, and the time-series waveform of the diagnosis target sensor data.
- the diagnosis means 142 includes a diagnosis target data acquisition unit 142a, a feature point extraction unit 142b, an abnormality measure calculation unit 142c, a diagnosis unit 142d, and a contribution level calculation unit 142e.
- the diagnosis target data acquisition unit 142a acquires the diagnosis target sensor data (that is, the diagnosis target data) from the sensor data storage means 13. That is, the diagnosis target data acquisition unit 142a acquires sensor data acquired in the diagnosis period (see FIG. 2 ) after the learning period is completed, for each operation process repeated in the mechanical facility 2.
- the feature point extraction unit 142b extracts a feature point of the diagnosis target data. That is, the feature point extraction unit 142b extracts a start point, a local maximum point, a local minimum point, and an end point included in the time-series waveform of the diagnosis target data as the feature points. It is to be noted that the method of extracting a feature point is the same as the processing performed by the feature point extraction unit 141b included in the learning means 141.
- the feature point extraction unit 142b outputs information on the extracted feature points (specifically, the detection values p1 to p5 which provide the feature points, and the elapsed times ⁇ t1 to ⁇ t5: see FIG. 4 ) to the abnormality measure calculation unit 142c and the contribution level calculation unit 142e as the waveform data indicating the diagnosis target data.
- the abnormality measure calculation unit 142c calculates an abnormality measure u which indicates a degree of abnormality, based on the cluster information stored in the learning result storage unit 141e, and the waveform data inputted from the feature point extraction unit 142b. Specifically, the abnormality measure calculation unit 142c performs normalization processing on the detection values and the elapsed times included in the waveform data to convert the detection values and the elapsed times to feature vectors. As described above, the number of dimensions of a feature vector is (the number of feature points) ⁇ 2.
- the abnormality measure calculation unit 142c reads cluster information (that is, a normal model) from the learning result storage unit 141e, and calculates an abnormality measure u of the diagnosis target data based on comparison between the cluster information and the above-described feature vector.
- the abnormality measure calculation unit 142c outputs the calculated abnormality measure u to the diagnosis unit 142d, and outputs the distance d to the contribution level calculation unit 142e.
- the abnormality measure calculation unit 142c stores the diagnosis target data and abnormality measure u in association with each other in the diagnostic result storage means 15.
- the diagnosis unit 142d diagnoses the mechanical facility 2 for the presence of an abnormality predictor based on the abnormality measure u inputted from the abnormality measure calculation unit 142c.
- the diagnosis unit 142d diagnoses the mechanical facility 2 as "abnormality predictor is not present".
- the diagnosis unit 142d stores a result of the diagnosis in the diagnostic result storage means 15 in association with the diagnosis target data.
- the contribution level calculation unit 142e calculates a contribution level for each of the detection values p1 to p5, and the elapsed times ⁇ t1 to ⁇ t5 that provide the five feature points (the start point s, the local maximum point M1, the local minimum point m, the local maximum point M2, and the end point e illustrated in FIG. 4 ).
- the contribution level i k is calculated in this manner, and when an abnormality predictor occurs, it is possible to recognize the magnitude of each detection value is too large or too small, or the manner (waveform) of the change is abnormal or not. For instance, when the contribution levels i 1 to i 5 corresponding to the detection values p1 to p5 are relatively high, a user can recognize that the detection value of the sensor is too large or too small.
- an abnormality predictor has occurred (that is, timing of occurrence of abnormality predictor) when ⁇ t1 has elapsed since the start of the operation process.
- the contribution level calculation unit 142e stores the calculated contribution level i k in the diagnostic result storage means 15 in association with the diagnosis target data.
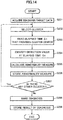
- FIG. 7 is a flowchart illustrating the processing of the abnormality predictor diagnosis system 1.
- the abnormality predictor diagnosis system 1 executes learning processing by the learning means 141 (see FIG. 3 ).
- FIG. 8 is a flowchart of the learning processing executed by the learning means 141.
- step S1011 the learning means 141 acquires learning target data from the sensor data storage means 13 by the learning target data acquisition unit 141a. That is, the learning means 141 acquires sensor data in the 1st time operation process as the learning target out of the sensor data acquired in a predetermined learning period (see FIG. 2 ) in which the mechanical facility 2 is known to be in normal operation.
- step S1012 the learning means 141 extracts the feature points of the time-series waveform of the learning target data by the feature point extraction unit 141b. That is, learning means 141 extracts the start point s, the local maximum point M1, the local minimum point m, the local maximum point M2, and the end point e illustrated in FIG. 4 , and identifies the detection values p1 to p5 and the elapsed times ⁇ t1 to ⁇ t5. As described above, these detection values p1 to p5 and the elapsed times ⁇ t1 to ⁇ t5 provide a group of waveform data that indicates a normal waveform of the sensor data.
- step S1013 the learning means 141 stores the information on the feature points (in short, the waveform data) extracted in step S1012 in the feature point storage unit 141c.
- step S1014 the learning means 141 determines whether or not another operation process is present, in which a feature point has not been extracted in the learning period (see FIG. 2 ).
- the processing of the learning means 141 returns to step S1011.
- the processing of the learning means 141 proceeds to step S1015.
- step S1015 the learning means 141 learns a cluster by the cluster learning unit 141d, the cluster being a normal model of the time-series waveform of the sensor data. Specifically, the learning means 141 normalizes the feature points extracted in step S1013 to convert into a feature vector, and clusters each feature vector to learn clusters.
- step S1016 the learning means 141 stores a result of the learning in step S1015. Specifically, the learning means 141 stores the cluster center c (see FIG. 6 ), and the cluster radius r (see FIG. 6 ) of each cluster in the learning result storage unit 141e. After the processing in step S1016 is performed, the learning means 141 completes a series of learning processing (END).
- step S102 the abnormality predictor diagnosis system 1 executes diagnostic processing by the diagnosis means 142 (see FIG. 3 ).
- FIG. 9 is a flowchart of the diagnostic processing executed by the diagnosis means 142.
- step S1021 the diagnosis means 142 acquires the diagnosis target data from the sensor data storage means 13 by the diagnosis target data acquisition unit 142a. Specifically, the diagnosis means 142 acquires the sensor data in the 1st time operation process as a diagnosis target out of the sensor data acquired in the diagnosis period (see FIG. 2 ) after the learning period is completed.
- step S1022 the diagnosis means 142 extracts the feature points of the time-series waveform of the diagnosis target data by the feature point extraction unit 142b.
- the diagnosis means 142 calculates an abnormality measure u of the diagnosis target data by the abnormality measure calculation unit 142c. Specifically, the diagnosis means 142 normalizes the diagnosis target data to convert into a feature vector, and calculates an abnormality measure u based on a cluster, among the clusters, having the cluster center c closest to the feature vector of the diagnosis target data.
- step S1024 the diagnosis means 142 calculates the contribution level i k for each of the detection values and elapsed times included in the diagnosis target data by the contribution level calculation unit 142e.
- the contribution i k calculated by the contribution level calculation unit 142e is stored in the diagnostic result storage means 15, and is further displayed on the display means 17 (see FIG. 1 ) by the display control means 16 (see FIG. 1 ). This allows a user to recognize whether each detection value is too large or too small, whether the waveform of the detection value is abnormal, and also the time at which an abnormality predictor of the mechanical facility 2 has occurred.
- step S1026 the diagnosis means 142 stores a result of the diagnosis in step S1025 into the diagnostic result storage means 15.
- the diagnosis means 142 then diagnoses the presence of an abnormality predictor similarly for the 2nd and subsequent time operation processes in the diagnosis period (see FIG. 2 ). It is to be noted that an abnormality measure u is calculated for multiple operation processes, and the mechanical facility 2 may be diagnosed for the presence of an abnormality predictor based on the calculation result (for instance, the number of times of occurrence in which an abnormality measure u exceeds a predetermined threshold value) .
- the information stored in the diagnostic result storage means 15 is displayed on the display means 17 (see FIG. 1 ) by the display control means 16 (see FIG. 1 ).
- the feature points of the time-series waveform of the sensor data are extracted and represented by a multi-dimensional feature vector as a group of waveform data. Therefore, a normal waveform of the sensor data can be learned by clustering the above-mentioned feature vector. If a normal waveform is learned based on the sensor data for each sampling period in which a physical quantity is detected, a great quantity (for instance, tens of thousands of pieces) of sensor data is acquired in one-time operation process, and the amount of computation needed for learning clusters becomes huge. In contrast, in this embodiment, clusters are learned based on the feature points of the waveform of the sensor data, and thus a normal waveform of the sensor data can be learned by a relatively small amount of computation. Also, the waveform data indicating the waveform of the sensor data in the diagnosis period is compared with a cluster which is a result of learning, and thus the mechanical facility 2 can be diagnosed for the presence of an abnormality predictor with high accuracy.
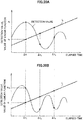
- FIG. 10A is a waveform diagram of sensor data at a normal time and at the time of occurrence of abnormality predictor of the mechanical facility 2. It is to be noted that the dashed-line waveform illustrated in FIG. 10A indicates the sensor data acquired when the mechanical facility 2 is in normal operation (one-time operation process). In addition, the solid-line waveform indicates the sensor data acquired when an abnormality predictor of the mechanical facility 2 occurs (one-time operation process).
- the detection values at the feature points Q3 A , Q4 A are greater than those at a normal time.
- the 10-dimensional feature vector based on the feature points Q1 A to Q5 A is present outside the cluster as a result of learning, and thus is diagnosed as "abnormality predictor is present" by the diagnosis unit 142d.
- the contribution level of the detection values at the feature points Q3 A , Q4 A has a relatively large value. Therefore, although the elapsed times at the feature points Q1 A to Q5 A are normal, a user can recognize that the sizes are abnormal.
- FIG. 10B is another example of a waveform diagram of sensor data at a normal time and at the time of occurrence of abnormality predictor of the mechanical facility 2. It is to be noted that the dashed-line waveform illustrated in FIG. 10B indicates the sensor data acquired when the mechanical facility 2 is in normal operation, and the solid-line waveform indicates the sensor data acquired when an abnormality predictor of the mechanical facility 2 occurs.
- the detection values at feature points Q1 B to Q5 B are the same as those at a normal time (dashed line), the elapsed times from the start time of an operation process at the feature points Q3 B , Q4 B are shorter than those at a normal time.
- the 10-dimensional feature vector based on the feature points Q1 B to Q5 B is present outside the cluster as a result of learning, and thus is diagnosed as "abnormality predictor is present" by the diagnosis unit 142d.
- the contribution level of the elapsed times at the feature points Q3 B , Q4 B has a relatively large value. Therefore, although the detection value at each of the feature points Q3 B , Q4 B is normal, a user can recognize that the elapsed time is abnormal.
- a feature vector is generated based on only the detection values of a sensor, and thus when the waveform illustrated in FIG. 10B is acquired, it is highly probable that the mechanical facility 2 is erroneously diagnosed as "abnormality predictor is not present".
- greater importance is placed on the time-series waveform in addition to the magnitude of each detection value.
- the mechanical facility 2 can be properly diagnosed as "abnormality predictor is present" by the diagnosis unit 142d.
- the mechanical facility 2 is diagnosed for the presence of an abnormality predictor based on the sensor data acquired from one sensor
- the invention is not limited to this.
- the mechanical facility 2 may be diagnosed for the presence of an abnormality predictor based on the sensor data acquired from multiple sensors.
- a cluster corresponding to each of the sensors is individually learned by the cluster learning unit 141d using the same method as in the first embodiment. For instance, when sensor data is acquired from three sensors, at least three clusters are learned by the cluster learning unit 141d.
- a cluster corresponding to a sensor for which sensor data is acquired is identified out of multiple pieces of sensor data acquired in the diagnosis period, and the abnormality measure u is calculated based on the comparison with the cluster. It is to be noted that in one-time operation process, the abnormality measures u for the number (for instance, three) of sensors are calculated. Therefore, a user can identify the occurrence position of an abnormality predictor in the mechanical facility 2 based on the abnormality measures u displayed on the display means 17 and the installation positions of the sensors.
- the diagnosis unit 142d diagnoses the mechanical facility 2 as "abnormality predictor is present".
- a sensor which sensitively reflect an occurrence of an abnormality predictor may be identified beforehand, the abnormality measure based on the sensor may be weighted.
- a logic circuit may be constructed, which receives input of a signal indicating whether or not the abnormality measure of the sensor data exceeds a predetermined threshold value, and the presence of an abnormality predictor may be diagnosed by the logic circuit.
- a filter which attenuates the harmonics included in the time-series waveform of the sensor data, may be added to the configuration described in the first embodiment.
- the harmonics included in the waveform of the learning target data are attenuated by the filter, and a cluster (normal model) is learned by the learning means 141 based on the waveform after being attenuated.
- the harmonics included in the waveform of the diagnosis target data are attenuated by the filter, and the mechanical facility 2 is diagnosed for the presence of an abnormality predictor based on the waveform after being attenuated. This can reduces unnecessary extraction of many feature points by the feature point extraction units 141b, 142b.
- the feature point extraction unit 141b may extract an extremum point as a feature point, for which the absolute value of the difference between the detection value of the sensor at the extremum point, and the detection value of the sensor a predetermined time before (or a predetermined time after) the time which provides the extremum point is greater than or equal to a predetermined threshold value.
- the feature point extraction unit 142d included in the diagnosis means 142 This can moderately reduce the number of feature points extracted from the waveform that varies finely.
- the above-mentioned filter (not illustrated) may be used together, and the local maximum points and the local minimum points are identified from the waveform with the harmonics attenuated by the filter, and the "feature points" may be further extracted based on the absolute value.
- An abnormality predictor diagnosis system 1A differs from the first embodiment in that the abnormality predictor diagnosis system 1A extracts the feature points of the waveform of sensor data, and learns clusters individually for each of the feature points. It is to be noted that the entire configuration of the abnormality predictor diagnosis system 1A is the same as that of the first embodiment (see FIG. 1 ). Also, similarly to the first embodiment, a predetermined operation process is repeated in the mechanical facility 2. Thus, a portion different from the first embodiment will be described, and a description of a redundant portion is omitted.
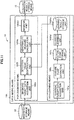
- FIG. 11 is a configuration diagram of a data mining means 14A included in the abnormality predictor diagnosis system 1A according to the second embodiment.
- a learning means 141A includes a learning target data acquisition unit 141a, a feature point extraction unit 141b, a feature point storage unit 141c, a cluster learning unit 141Ad, and a learning result storage unit 141Ae.
- the cluster learning unit 141Ad learns a cluster individually for each of the feature points extracted by the feature point extraction unit 141b. For instance, similarly to the first embodiment (see FIG. 4 ), when the start point s, the local maximum point M1, the local minimum point m, the local maximum point M2, and the end point e are extracted as the feature points in one-time operation process of the mechanical facility 2, the cluster learning unit 141Ad learns a cluster for each of the five feature points. These clusters provide a normal model that indicates the time-series waveform for the detection values of a sensor.
- the cluster learning unit 141Ad generates a two-dimensional feature vector based on a detection value p1 (see FIG. 4 ) of the start point s of learning target data, and an elapsed time ⁇ t1 (see FIG. 4 ) from the start of an operation process.
- the cluster learning unit 141Ad generates a two-dimensional feature vector similarly for other feature points: the local maximum point M1, the local minimum point m, the local maximum point M2, and the end point e (see FIG. 4 ).
- the cluster learning unit 141Ad determines a cluster center c (see FIG. 6 ) and a cluster radius r (see FIG. 6 ) by clustering each feature vector. Furthermore, the cluster learning unit 141Ad stores cluster information as a learning result into the learning result storage unit 141Ae.
- the cluster information (the cluster center c, the cluster radius r) is stored as a database, for instance.
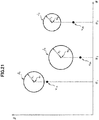
- FIG. 12 is an explanatory diagram illustrating a relationship between feature points and clusters. It is to be noted that the dashed line indicates the sensor data acquired in a learning period (one-time operation process) in which the mechanical facility 2 is known to be in normal operation. The solid line indicates the sensor data acquired in a diagnosis period (one-time operation process) after the learning period is completed. In FIG. 12 , the sensor data (dashed line) acquired in the learning period and the sensor data (solid line) acquired in the diagnosis period are illustrated with the start times of operation processes matched.
- five feature points including the start point, the two local maximum points, the local minimum points, and the end point are extracted in the sensor data (dashed line) of learning target, and clusters J1 to J5 are learned in a two-dimensional vector space for these respective feature points. It is to be noted that feature points and clusters do not necessarily correspond to each other on a one-to-one basis, and multiple clusters may be learned for one feature point.
- a diagnosis means 142A illustrated in FIG. 11 includes a diagnosis target data acquisition unit 142a, a detection value identification unit 142f, an abnormality measure calculation unit 142Ac, and a diagnosis unit 142Ad.
- the sensor data (that is, the diagnosis target data) acquired by the diagnosis target data acquisition unit 142a includes detection values of a sensor, and an elapsed time from the start time t11 (see FIG. 12 ) of an operation process of the mechanical facility 2. Similarly to the first embodiment, the diagnosis target data is acquired for each operation process repeated.
- the detection value identification unit 142f identifies the detection values when the elapsed times ⁇ t1 to ⁇ t5 have passed since the start of an operation process based on the elapsed times ⁇ t1 to ⁇ t5 that provide respective cluster centers of the clusters J1 to J5 (see FIG. 12 ). For instance, the detection value identification unit 142f reads the cluster information on the cluster J2 illustrated in FIG. 12 , and acquires the elapsed time ⁇ t2 which provides the cluster center. The detection value identification unit 142f then identifies the detection value p11 when the elapsed time ⁇ t2 has passed since the start of the operation process in the waveform (solid line) of the diagnosis target data that changes in time series. For other clusters J1, J3 to J5, the detection value identification unit 142f similarly identifies detection values when the predetermined elapsed times ⁇ t1, ⁇ t3 to ⁇ t5 have passed since the start of the operation process.
- the abnormality measure calculation unit 142Ac illustrated in FIG. 11 calculates an abnormality measure u of the diagnosis target data based on the detection values identified by the detection value identification unit 142f. For instance, the abnormality measure calculation unit 142Ac normalizes the elapsed time ⁇ t2 (see FIG. 12 ) from the start of the operation process, and the detection value p11 (see FIG. 12 ) at the elapsed time ⁇ t2 to convert into a two-dimensional feature vector. The abnormality measure calculation unit 142Ac then calculates the abnormality measure u of the diagnosis target data using (Expression 1) described in the first embodiment, based on the cluster information on the cluster J2 corresponding to the elapsed time ⁇ t2, and the feature vector mentioned above.
- the detection value p11 of the diagnosis target data (solid line) at the elapsed time ⁇ t2 is significantly smaller than the cluster center of the cluster J2. Therefore, in this case, it is highly probable that the abnormality measure u of the detection value at the elapsed time ⁇ t2 exceeds a predetermined threshold value.
- the abnormality measure calculation unit 142Ac similarly calculates the abnormality measure u of the diagnosis target data.
- the diagnosis unit 142Ad illustrated in FIG. 11 diagnoses the mechanical facility 2 for the presence of an abnormality predictor based on the abnormality measure u calculated by the abnormality measure calculation unit 142Ac. For instance, when the magnitude of one of multiple abnormality measures u calculated by the abnormality measure calculation unit 142Ac exceeds a predetermined threshold value, the diagnosis unit 142Ad diagnoses the mechanical facility 2 as "abnormality predictor is present". Also, when none of the multiple abnormality measures u exceeds the predetermined threshold value, the diagnosis unit 142Ad diagnoses the mechanical facility 2 as "abnormality predictor is not present".
- the diagnosis unit 142Ad may diagnose the mechanical facility 2 as "abnormality predictor is present".
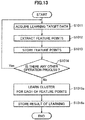
- FIG. 13 is a flowchart of learning processing executed by the learning means 141A. Since steps S1011 to S1014 of FIG. 13 are the same as in the first embodiment (see FIG. 8 ), a description is omitted.
- step S1015a the learning means 141A learns a cluster individually for each feature point by the cluster learning unit 141Ad. Specifically, the learning means 141A performs normalization processing on the detection values and the elapsed times at the feature points of the learning target data to convert into two-dimensional feature vectors, and generates a cluster for each feature point.
- step S1016a the learning means 141A stores cluster information (the cluster center c, the cluster radius r) as a learning result into the learning result storage unit 141Ae.
- FIG. 14 is a flowchart of the diagnostic processing executed by the diagnosis means 142A.
- step S201 the diagnosis means 142A acquires diagnosis target data from the sensor data storage means 13 by the diagnosis target data acquisition unit 142a. That is, the diagnosis means 142A acquires the sensor data in the 1st time operation process as the diagnosis target data out of the sensor data acquired in the diagnosis period after the learning period is completed.
- the diagnosis means 142A refers to the cluster information stored in the learning result storage unit 141Ae, and selects one of multiple clusters. For instance, from the five clusters J1 to J5 illustrated in FIG. 12 , the diagnosis means 142A selects the cluster J1 corresponding to the start point of the waveform.
- step S203 the diagnosis means 142A reads an elapsed time ⁇ t from the learning result storage unit 141Ae, the elapsed time ⁇ t providing the cluster center of the cluster selected in step S202. For instance, the diagnosis means 142A reads the elapsed time ⁇ t1 which provides the cluster center of the cluster J1 illustrated in FIG. 12 .
- step S204 the diagnosis means 142A identifies the detection value of the diagnosis target data at the elapsed time ⁇ t read in step S203, by the detection value identification unit 142f. For instance, the diagnosis means 142A identifies the detection value when the elapsed time ⁇ t1 (see FIG. 12 ) has passed since the start of the operation process.
- the diagnosis means 142A calculates the abnormality measure u of the diagnosis target data by the abnormality measure calculation unit 142Ac. Specifically, the diagnosis means 142A normalizes the elapsed time ⁇ t read in step S203, and the detection value identified in step S204 to generate a two-dimensional feature vector, and calculates the abnormality measure u of the diagnosis target data based on the cluster information stored in the learning result storage unit 141Ae.
- step S206 the diagnosis means 142A stores the abnormality measure u calculated in step S205 in association with the cluster selected at step S202.
- step S207 the diagnosis means 142A determines whether or not there is any other cluster which is not used for diagnosis. When there is a cluster which is not used for diagnosis (Yes in S207), the processing of the diagnosis means 142A returns to step S202. On the other hand, in step 207, when there is no cluster which is not used for diagnosis (No in S207), the processing of the diagnosis means 142A proceeds to step S208.
- step S208 the diagnosis means 142A diagnoses the mechanical facility 2 for the presence of an abnormality predictor by the diagnosis unit 142Ad. That is, the diagnosis means 142A diagnoses the mechanical facility 2 for the presence of an abnormality predictor based on the abnormality measure u calculated in step S205.
- step S209 the diagnosis means 142A stores a diagnostic result in the diagnostic result storage means 15, and completes a series of diagnostic processing (END).
- the feature points including a start point, a local maximum point, a local minimum point, and an end point are extracted for a operation process repeated, and a cluster is generated individually for each feature point, and thus a normal waveform of detection values of a sensor can be learned. Also, whether or not the waveform is abnormal (in other words, whether or not an abnormality predictor has occurred in the mechanical facility 2) can be diagnosed with high accuracy in the diagnosis target data based on the detection values at the elapsed times which provide the cluster centers.
- the timing of occurrence of an abnormality predictor can be identified, and a time of phase shift relative to the normal time can be identified by identifying the cluster used for the diagnosis.
- a filter which attenuates the harmonics included in the time-series waveform of the sensor data, may be added to the configuration described in the second embodiment, and learning processing may be performed based on the waveform with the harmonics attenuated by the filter.
- an extremum point may be extracted as a feature point, for which the absolute value of the difference between the detection value of the sensor at the extremum point, and the detection value of the sensor a predetermined time before (or a predetermined time after) the time which provides the extremum point is greater than or equal to a predetermined threshold value. This can reduces unnecessary extraction of many feature points by the feature point extraction unis 141b.
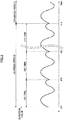
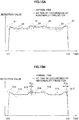
- FIG. 15A is experimental data indicating a time-series change of detection values of a sensor at a normal time and at the time of occurrence of abnormality predictor of the mechanical facility 2. It is to be noted that the horizontal axis of FIG. 15A indicates time, and the vertical axis indicates detection value of a coolant water temperature sensor (not illustrated) installed in the mechanical facility 2 (a gas engine, not illustrated). Also, a dashed line of FIG. 15A indicates the sensor data at a normal time of the mechanical facility 2, and a solid line indicates the sensor data at the time of occurrence of abnormality predictor of the mechanical facility 2.
- the dashed-line circle symbols X1 to X7 in FIG. 15A indicate the feature points included in the waveform of the detection values of a sensor.
- the harmonics included in the waveform are attenuated by a filter (not illustrated), and from many extremum points included in the waveform after being attenuated, an extremum point is extracted as a feature point, for which the absolute value of the difference between the sensor data at a predetermined time before the time which provides the extremum point and the sensor data at the extremum point is greater than or equal to a predetermined threshold value (the same goes for FIG. 15B described later).
- the detection value of the sensor indicated by a solid line is greater than a normal time value indicated by the dashed line.
- a diagnostic result of "abnormality predictor is present" is outputted for the sensor data indicated by the solid line (that is, a gas engine which is the mechanical facility 2).
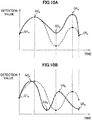
- FIG. 15B is another experimental data indicating a time-series change of detection values of a sensor at a normal time and at the time of occurrence of abnormality predictor of the mechanical facility 2.
- a dashed line of FIG. 15B indicates the sensor data at a normal time of the mechanical facility 2
- a solid line indicates the sensor data at the time of occurrence of abnormality predictor of the mechanical facility 2.
- the dashed-line circle symbols X11 to X17 in FIG. 15B indicate the feature points included in the waveform of the detection values of a sensor.
- the time which provides the feature point of the circle symbol X13 is earlier by time ⁇ t A than a normal time indicated by the dashed line (in other words, the elapsed time from the start time t11 of an operation process is shorter).
- the time which provides the feature point of the circle symbol X17 is delayed by time ⁇ t B than a normal time indicated by the dashed line (in other words, the elapsed time from the start time t11 is longer).
- a diagnostic result of "abnormality predictor is present" is outputted based on the method described in the second embodiment.
- the mechanical facility 2 may be diagnosed for the presence of an abnormality predictor based on the sensor data acquired from multiple sensors (not illustrated) installed in the mechanical facility 2.
- one sensor by which feature points are easily extracted, is selected by a user based on prior experiments.
- the learning means 141A extracts feature points based on the sensor data acquired from the above-mentioned sensor, and identifies the elapsed time ⁇ t (the elapsed time from the start time of an operation process) at each feature point.
- the learning means 141A generates a multi-dimensional feature vector based on the detection value of each sensor at the elapsed time ⁇ t, and clusters each feature vector. In other words, the learning means 141A learns a cluster indicating a normal waveform of detection values of each sensor corresponding to the elapsed times ⁇ t which provides feature points. The learning means 141A then stores cluster information as a learning result into the learning result storage unit 141Ae in association with the elapsed times ⁇ t.
- the diagnosis means 142A After the above-mentioned learning of a cluster, the diagnosis means 142A reads one of the multiple elapsed times ⁇ t from the learning result storage unit 141Ae. For the diagnosis target data, the diagnosis means 142A identifies the detection value at the elapsed time ⁇ t for each sensor, and normalizes the detection value to convert into a feature vector. The diagnosis means 142A then calculates an abnormality measure u based on the feature vector after being converted and a cluster corresponding to the above-mentioned elapsed time ⁇ t, and diagnoses the mechanical facility 2 for the presence of an abnormality predictor.
- the learning means 141A may identify a sensor providing the greatest number of feature points in one-time operation process in the learning period, and may learn a cluster based on the feature points of the sensor data acquired from the sensor. Thus, it is possible to determine at many points on the waveform of the diagnosis target data whether or not a detection value of the diagnosis target data is out of a normal range. Therefore, the mechanical facility 2 can be diagnosed for the presence of an abnormality predictor with high accuracy.
- An abnormality predictor diagnosis system 1B (see FIG. 16 ) according to a third embodiment differs from the first embodiment in that a feature vector is generated based on a linear function that monotonously increases as time passes, and detection values of a sensor.
- the abnormality predictor diagnosis system 1B according to the third embodiment has a configuration in which a function storage means 18 (see FIG. 16 ) is added to the configuration (see FIG. 1 ) described in the first embodiment.
- the other overall configuration is the same as in the first embodiment (see FIG. 1 ), and is the same as the first embodiment in that a predetermined operation process is repeated in the mechanical facility 2. Thus, a portion different from the first embodiment will be described, and a description of a redundant portion is omitted.
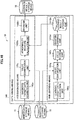
- FIG. 16 is a configuration diagram of a data mining means 14B included in the abnormality predictor diagnosis system 1B according to the third embodiment.
- linear functions (see lines L illustrated in FIG. 17 ), which monotonously increase as time passes in an operation process of the mechanical facility 2, are stored.
- the linear function is used for the later-described learning of a cluster and calculation of an abnormality measure.
- a learning means 141B includes a learning target data acquisition unit 141a, a value identification unit 141g, a value storage unit 141h, a cluster learning unit 141Bd, and a learning result storage unit 141Be.
- the value identification unit 141g identifies the detection value of a sensor and the value of the linear function when predetermined times ⁇ t 1 , ⁇ t 2 , ⁇ t 3 (see FIG. 17 ) have passed since the start of an operation process, based on the learning target data acquired by the learning target data acquisition unit 141a.
- the predetermined times ⁇ t 1 , ⁇ t 2 , ⁇ t 3 are set beforehand so that an occurrence of an abnormality predictor of the mechanical facility 2 is sensitively reflected in the detection values of the sensor at the predetermined times ⁇ t 1 , ⁇ t 2 , ⁇ t 3 .
- FIG. 17 is an explanatory diagram related to detection values of a sensor, and a line L represented by a linear function.
- the value identification unit 141g (see FIG. 16 ) identifies detection value p 1 of the sensor, and value q 1 of the line L expressed by the linear function when the predetermined time ⁇ t 1 has passed since the start of an operation process. Similarly, for other predetermined times ⁇ t 2 , ⁇ t 3 , the value identification unit 141g identifies each of the detection value of the sensor and the value of the linear function.
- the detection values and values of the linear function identified by the value identification unit 141g are stored in association with the predetermined times ⁇ t 1 , ⁇ t 2 , ⁇ t 3 . It is to be noted that when an operation process is repeated n times in the learning period, (3 ⁇ n) sets of a detection value and a value of the linear function are stored in the value storage unit 141h.
- the cluster learning unit 141Bd learns a cluster (normal model) indicating a normal waveform of detection values of the sensor, based on the detection values and the values of the linear function stored in the value storage unit 141h. Specifically, the cluster learning unit 141Bd normalizes the detection values and the values of the linear function stored in the value storage unit 141h, and generates two-dimensional feature vectors having the normalized values as the components. The cluster learning unit 141Bd then learns a cluster by clustering each feature vector. Since the method of learning a cluster is the same as in the first embodiment, a description is omitted.
- the cluster information (the cluster center c, the cluster radius r), which is the result of learning by the cluster learning unit 141Bd, is stored.
- a diagnosis means 142B includes a diagnosis target data acquisition unit 142a, a value identification unit 142g, an abnormality measure calculation unit 142Bc, and a diagnosis unit 142Bd.
- the value identification unit 142g identifies the detection values of the sensor and the values of the linear function when the predetermined times ⁇ t 1 , ⁇ t 2 , ⁇ t 3 have passed since the start of an operation process.
- the above-mentioned predetermined times ⁇ t 1 , ⁇ t 2 , ⁇ t 3 are approximately the same as the predetermined times ⁇ t 1 , ⁇ t 2 , ⁇ t 3 used by the learning means 141B.
- the abnormality measure calculation unit 142Bc calculates an abnormality measure u of the diagnosis target data based on the detection values of the sensor and the values of the linear function identified by the value identification unit 142g, and the cluster information stored in the learning result storage unit 141Be.
- the abnormality measure calculation unit 142Bc normalizes the detection values of the sensor and the values of the linear function identified by the value identification unit 142g, and generates two-dimensional feature vectors having the normalized values as the components.
- the abnormality measure calculation unit 142Bc refers to the learning result storage unit 141Be, and identifies a cluster with a cluster center having the shortest distance from the feature vector, then calculates an abnormality measure u based on the (Expression 1).
- the diagnosis unit 142Bd diagnoses the mechanical facility 2 for the presence of an abnormality predictor based on the abnormality measure u calculated by the abnormality measure calculation unit 142Bc. For instance, when there is diagnosis target data with an abnormality measure u exceeding a predetermined threshold value, the diagnosis unit 142Bd diagnoses the mechanical facility 2 as "abnormality predictor is present". Also, when there is no diagnosis target data with an abnormality measure u exceeding a predetermined threshold value, the diagnosis unit 142Bd diagnoses the mechanical facility 2 as "abnormality predictor is not present".
- the diagnosis unit 142Bd may diagnose the mechanical facility 2 as "abnormality predictor is present".
- FIG. 18 is a flowchart of the learning processing executed by the learning means 141B.
- the learning means 141B sets value n to 1.
- the value n is a natural number that, when multiple predetermined times are present (see 3 predetermined times ⁇ t 1 , ⁇ t 2 , ⁇ t 3 illustrated in FIG. 17 ), is incremented (S307) for selecting a predetermined time used for identifying the detection value and the value of the linear function.
- step S302 the learning means 141B acquires learning target data from the sensor data storage means 13 by the learning target data acquisition unit 141a.
- step S303 the learning means 141B identifies the detection value p 1 of the sensor when the predetermined time ⁇ t 1 has passed since the start time of an operation process, by the value identification unit 141g (see FIG. 17 ).
- the learning target data includes a signal indicating the start and end of an operation process. Therefore, based on the signal, it is possible to identify the detection value p 1 of the sensor when the predetermined time ⁇ t 1 has passed since the start of an operation process.
- step S305 the learning means 141B stores the detection value p 1 identified in step S303, and the value y of the linear function identified in step S304 in the value storage unit 141h in association with the predetermined time ⁇ t 1 .
- the learning means 141B determines whether or not the value n has reached a predetermined value N.
- the predetermined value N is the number of predetermined times ⁇ t n (in this embodiment, 3 predetermined times ⁇ t 1 , ⁇ t 2 , ⁇ t 3 ) used for identifying the detection value of the sensor and the value of the linear function.
- step S307 the learning means 141B increments the value of n, and returns to the processing in step S302.
- the learning means 141B then identifies the detection values of the sensor and the values of the linear function for other predetermined times ⁇ t 2 , ⁇ t 3 .
- step S306 when the value n has reached the predetermined value N in step S306 (Yes in S306), the processing of the learning means 141B proceeds to step S308.
- step S308 the learning means 141B determines whether or not there is another operation process, for which a detection value and a value of the linear function have not been acquired, in a predetermined learning period.
- the processing of the learning means 141B returns to step S301.
- the learning means 141B identifies the detection values and the values of the linear function when the predetermined times ⁇ t 1 , ⁇ t 2 , ⁇ t 3 have passed since the start of the operation process.
- the start time of each operation process serving as the reference of the predetermined times ⁇ t 1 , ⁇ t 2 , ⁇ t 3 is identified based on the start signal of the operation process included in the sensor data.
- step S308 where there is no other operation process, for which a detection value and a value of the linear function have not been acquired in step S308 (No in S308), the processing of the learning means 141B proceeds to step S309.
- step S309 the learning means 141B learns a cluster based on the information stored in the value storage unit 141h.
- the learning means 141B performs normalization processing on the detection value identified in step S303 and the value of the function identified in step S304, and generates a feature vector.
- the learning means 141B learns a cluster that indicates a normal waveform of the detection values of the sensor by clustering each feature vector.
- step S310 the learning means 141B stores the result learned in step S309 in the learning result storage unit 141Be, and completes a series of learning processing (END).
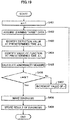
- FIG. 19 is a flowchart of the diagnostic processing executed by the diagnosis means 142B.
- step S401 the diagnosis means 142B sets the value n to 1.
- the value n is the same as the value n described in step S301 of FIG. 18 .
- step S402 the diagnosis means 142B acquires the diagnosis target data from the sensor data storage means 13 by the diagnosis target data acquisition unit 142a. That is, the diagnosis means 142B acquires the sensor data of the 1st time operation process as a diagnosis target out of the sensor data acquired in the diagnosis period after the learning period.
- step S403 the diagnosis means 142B identifies the detection value of the sensor when the predetermined time ⁇ t 1 has passed since the start time of an operation process by the value identification unit 142g.
- step S404 the diagnosis means 142B substitutes the predetermined time ⁇ t 1 into the linear function by the value identification unit 142g to identify the value of the linear function.
- step S405 the diagnosis means 142B calculates the abnormality measure u of the diagnosis target data by the abnormality measure calculation unit 142Bc. That is, in step S405, the diagnosis means 142B performs normalization processing on the detection value identified in step S403 and the value of the linear function identified in step S404 to generate a two-dimensional feature vector with normalized component values. The diagnosis means 142B then calculates the abnormality measure u of the diagnosis target data based on the feature vector and the cluster information stored in the learning result storage unit 141Be.
- step S406 the diagnosis means 142B determines whether or not the value n has reached the predetermined value N.
- the predetermined value N is the number of predetermined times ⁇ t n used for identifying the detection value and the value of the linear function, and is the same as the predetermined value N (see FIG. 18 ) used by the learning processing.
- the diagnosis means 142B increments the value of n, and returns to the processing in step S402.
- step S406 when the value n has reached the predetermined value N in step S406 (Yes in S406), the processing of the diagnosis means 142B proceeds to step S408.
- step S408 the diagnosis means 142B diagnoses the mechanical facility 2 for the presence of an abnormality predictor by the diagnosis unit 142Bd. Specifically, the diagnosis means 142B diagnoses the mechanical facility 2 for the presence of an abnormality predictor based on the abnormality measure u calculated in step S405.
- step S409 the diagnosis means 142B stores a diagnostic result in the diagnostic result storage means 15, and completes a series of diagnostic processing (END).
- the diagnosis means 142B repeats such diagnostic processing for each operation process included in the diagnosis period.
- FIG. 20A is an explanatory diagram illustrating the waveform of learning target data, and line L of a linear function.
- the waveform of the detection value illustrated in FIG. 20A is the learning target data (detection value) acquired in one-time operation process in the learning period in which the mechanical facility 2 is in normal operation.
- a two-dimensional feature vector is generated, which has component values obtained by normalizing the detection value p 1 of the sensor and the value q 1 of the linear function (the line L) when the predetermined time ⁇ t 1 has passed since the start time of an operation process.
- feature vectors are generated for other predetermined times ⁇ t 2 , ⁇ t 3 , and feature vectors are also generated for other operation processes included in the learning period.
- the clusters J 1 , J 2 , J 3 (see FIG. 21 ) are learned based on those feature vectors.
- FIG. 21 is an explanatory diagram of cluster J 1 , J 2 , J 3 which are results of learning, and feature vectors v 1A , v 2A , v 3a of the diagnosis target data.
- the horizontal axis ⁇ of FIG. 21 indicates a numerical value after normalization of the value of the linear function
- the vertical axis ⁇ indicates a numerical value after normalization of the detection value of the sensor.
- the cluster J 1 illustrated in FIG. 21 is the cluster based on the detection value of the sensor and the value of the linear function when the predetermined time ⁇ t 1 (see FIG. 20A ) has passed since the start time of an operation process, and the cluster is represented by the cluster center c 1 and the cluster radius r 1 .
- the cluster J 2 is the cluster corresponding to the predetermined time ⁇ t 2 (see FIG. 20A )
- the cluster J 3 is the cluster corresponding to the predetermined time ⁇ t 3 (see FIG. 20A ).
- multiple clusters may be learned at a predetermined time ⁇ t n .
- FIG. 20B is an explanatory diagram illustrating the waveform of diagnosis target data, and line L of a linear function at the time of occurrence of abnormality predictor of the mechanical facility 2.
- the maximum value and the minimum value of the detection value in one-time operation process are the same as in the learning target data (see FIG. 20A ) when the mechanical facility 2 is in normal operation, however, the waveform is different from that in a normal time.
- diagnosis is made for the presence of an abnormality predictor based on only the detection values of a sensor, and thus erroneous diagnosis may be made as "abnormality predictor is not present" based on the diagnosis target data illustrated in FIG. 20B .
- the mechanical facility 2 is diagnosed for the presence of an abnormality predictor based on whether or not a feature vector is present in a cluster, the feature vector being identified by the detection values of the sensor and the values of the linear function when the predetermined times ⁇ t 1 , ⁇ t 2 , ⁇ t 3 have passed since the start time of an operation process.
- a feature vector v 1a indicated by • symbol of FIG. 21 is generated based on the detection value p 1A and the value q 1 (value ⁇ 1 after normalization, see FIG. 21 ) of the linear function at the predetermined time ⁇ t 1 illustrated in FIG. 20B .
- the feature vector v 1a is not included in the cluster J 1 closest to the feature vector v 1A , and thus diagnosed as "abnormality predictor is present" by the diagnosis unit 142Bd.
- the same goes for a feature vector v 2A corresponding to the detection value and the like of the predetermined time ⁇ t 2 (see FIG. 20B ), and a feature vector v 3A corresponding to the detection value and the like of the predetermined time ⁇ t 3 (see FIG. 20B ).
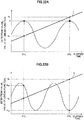
- FIG. 22A is an explanatory diagram illustrating another example of the waveform of learning target data, and line L of a linear function.
- the detection value of a sensor varies in a sine wave form in the learning period in which the mechanical facility 2 is in normal operation.
- two predetermined times ⁇ t 4 , ⁇ t 5 which provide local maximum points of the waveform of detection values, are set.
- the detection values p at the predetermined times ⁇ t 4 , ⁇ t 5 are the same, however, the values q 4 , q 5 of the linear function are significantly different.
- different clusters J 4 , J 5 (see FIG. 23 ) corresponding to the predetermined times ⁇ t 4 , ⁇ t 5 are learned.
- the same detection value p is usually included in the same cluster.
- the detection value p at the predetermined time ⁇ t 4 and the detection value p at the predetermined time ⁇ t 5 have not been distinguished in the learning processing.
- the predetermined times ⁇ t 4 , ⁇ t 5 are different, the values of the linear function are different, and thus clusters can be learned in a distinguished manner.
- the learning result contributes to higher accuracy of abnormality predictor diagnosis as described later.
- FIG. 22B is an explanatory diagram illustrating the waveform of diagnosis target data, and line L of a linear function at the time of occurrence of abnormality predictor.
- the period of the waveform is shorter than in a normal time.
- the detection value p 5A at the predetermined time ⁇ t 5 is significantly smaller than the detection value p in a normal time.
- FIG. 23 is an explanatory diagram of clusters J 4 , J 5 which are results of learning, and feature vectors v 4A , v 5A of diagnosis target data. It is to be noted that the horizontal axis ⁇ and the vertical axis ⁇ are the same as in FIG. 21 .
- the cluster J 4 illustrated in FIG. 23 is the cluster that is learned by using the detection value of the sensor, and the value of the linear function when the predetermined time ⁇ t 4 (see FIG. 22A ) has passed since the start time of an operation process.
- the cluster Js is the cluster that is learned by using the detection value of the sensor, and the value of the linear function when the predetermined time ⁇ t 5 (see FIG. 22A ) has passed since the start time of an operation process.
- the detection value p 5A (see FIG. 22B , value ⁇ 5A after normalization illustrated in FIG. 23 ) at the predetermined time ⁇ t 5 is significantly smaller than the detection value p in a normal time.
- the feature vector v 5A identified by the detection value and the value of the linear function at the predetermined time ⁇ t 5 is located outside the cluster J 5 in the nearest neighbor, and is diagnosed as "abnormality predictor is present" by the diagnosis unit 142Bd.
- the cluster with a cluster center closest to the feature vector v 5A is the cluster J 5 and not the cluster J 4 . Therefore, the abnormality measure u of the detection value p 5A at the predetermined time ⁇ t 5 can be calculated based on the cluster J 5 corresponding to the predetermined time ⁇ t 5 . Consequently, it is possible to diagnose whether or not the waveform of the detection values of the diagnosis target data is abnormal with high accuracy (in other words, the presence of an abnormality predictor of the mechanical facility 2).
- a cluster is learned by clustering two-dimensional feature vectors that are generated based on the detection values of the sensor and the values of the monotonously increasing linear function when the predetermined times ⁇ t 1 , ⁇ t 2 , ⁇ t 3 have passed since the start time of an operation process.
- a normal waveform for the detection values of a sensor can be learned as a cluster.
- a feature vector is similarly generated, and it is possible to diagnose whether or not the waveform of the detection value is abnormal with high accuracy based on the cluster which is a result of the learning (in other words, whether or not an abnormality predictor has occurred in the mechanical facility 2).
- the invention is not limited to this. Specifically, the number of predetermined times ⁇ t n may be one, or may be four or greater.
- a linear function that monotonously increases as time passes is used, the invention is not limited to this.
- a linear function that monotonously decreases as time passes may be used, or a curved function that monotonously increases or monotonously decreases as time passes may be used.
- the mechanical facility 2 is diagnosed for the presence of an abnormality predictor based on the sensor data acquired from one sensor
- the invention is not limited to this.
- the mechanical facility 2 may be diagnosed for the presence of an abnormality predictor based on the sensor data acquired from multiple sensors.
- a predetermined linear function is pre-set, and a multi-dimensional feature vector may be generated based on the detection values of the sensors and the values of the linear function when the predetermined times ⁇ t 1 , ⁇ t 2 , ⁇ t 3 have passed since the start time of an operation process.
- the dimension number of the feature vector is (the number of sensors) + 1. A user can recognize what type of abnormality has occurred at which position of the mechanical facility 2 by using multiple sensors in this manner.
- abnormality predictor diagnosis systems 1, 1A, 1B have been described based on the embodiments above, the present invention is not limited to these embodiments, and various modifications may be made.
- the cluster learning unit 141d performs clustering using k-means method which is one of non-hierarchical clustering methods
- the invention is not limited to this.
- fuzzy clustering and mixed density distribution method which are non-hierarchical clustering may be used as the learning processing performed by the cluster learning unit 141d.
- a feature point may be at least one of these points (for instance, a local maximum point, a local minimum point).
- the contribution level calculation unit 142e may be excluded from the configuration (see FIG. 3 ) of the first embodiment. Even in this configuration, the mechanical facility 2 may be appropriately diagnosed for the presence of an abnormality predictor based on the size of the abnormality measure u.
- the invention is not limited to this. Specifically, sensor data which is diagnosed as "abnormality predictor is not present" by the diagnosis unit 142d may be added to the learning target data, and the cluster center c and the cluster radius r may be recalculated (in other words, a cluster is re-learned) based on the learning target data with the addition. A cluster is re-learned in this manner, and thus information on the normal state of the mechanical facility 2 is gradually increased, and the cluster center c and the cluster radius r can be updated to more appropriate values. As described above, each time learning target data is added, the oldest data in the existing learning target data may be excluded from the learning target. Thus, even when the mechanical facility 2 changes over time according to seasonal change, the cluster can be updated to follow the change, and eventually, the diagnostic accuracy for an abnormality predictor can be increased.
- the present invention is not limited to the embodiments including all the components described in each embodiment. Also, part of the components of an embodiment may be replaced by a component of another embodiment, and a component of another embodiment may be added to the components of an embodiment. Also, another component may be added to, deleted from, or may replace part of the components of each embodiment.
- part or all of the components illustrated in FIG. 1 , FIG. 3 , FIG. 11 , and FIG. 16 may be implemented by hardware, for instance, by designing an integrated circuit.
- Each component described above may be implemented by software in which a processor interprets and executes a program that implements each function.
- Information such as a program, a tape, a file, which implements each function may be stored in a recording device, such as a memory, a hard disk, an SSD (Solid State Drive) or a recording medium, such as an IC card, an SD card, a DVD.
- a control line or an information line which is considered to be necessary for description is illustrated, and all the control lines or information lines are not necessarily illustrated for a product. It may be interpreted that almost all components are practically connected to each other.
Landscapes
- Physics & Mathematics (AREA)
- Engineering & Computer Science (AREA)
- General Physics & Mathematics (AREA)
- Automation & Control Theory (AREA)
- Artificial Intelligence (AREA)
- Evolutionary Computation (AREA)
- Mathematical Physics (AREA)
- Testing And Monitoring For Control Systems (AREA)
Applications Claiming Priority (2)
| Application Number | Priority Date | Filing Date | Title |
|---|---|---|---|
| JP2015155488A JP5946573B1 (ja) | 2015-08-05 | 2015-08-05 | 異常予兆診断システム及び異常予兆診断方法 |
| PCT/JP2016/072715 WO2017022783A1 (ja) | 2015-08-05 | 2016-08-03 | 異常予兆診断システム及び異常予兆診断方法 |
Publications (3)
| Publication Number | Publication Date |
|---|---|
| EP3333660A1 true EP3333660A1 (de) | 2018-06-13 |
| EP3333660A4 EP3333660A4 (de) | 2019-04-03 |
| EP3333660B1 EP3333660B1 (de) | 2021-10-06 |
Family
ID=56329491
Family Applications (1)
| Application Number | Title | Priority Date | Filing Date |
|---|---|---|---|
| EP16833062.9A Active EP3333660B1 (de) | 2015-08-05 | 2016-08-03 | Anomalieprädiktordiagnosesystem und anomalieprädiktordiagnoseverfahren |
Country Status (4)
| Country | Link |
|---|---|
| US (1) | US20180231969A1 (de) |
| EP (1) | EP3333660B1 (de) |
| JP (1) | JP5946573B1 (de) |
| WO (1) | WO2017022783A1 (de) |
Cited By (1)
| Publication number | Priority date | Publication date | Assignee | Title |
|---|---|---|---|---|
| EP4282616A4 (de) * | 2021-01-25 | 2025-01-01 | The Japan Steel Works, Ltd. | Anomalieerkennungssystem, formmaschinensystem, anomalieerkennungsvorrichtung, anomalieerkennungsverfahren und computerprogramm |
Families Citing this family (38)
| Publication number | Priority date | Publication date | Assignee | Title |
|---|---|---|---|---|
| CN109074052B (zh) * | 2016-04-19 | 2020-01-03 | 三菱电机株式会社 | 非稳定检测装置、非稳定检测系统以及非稳定检测方法 |
| US11455203B2 (en) * | 2016-09-14 | 2022-09-27 | Nec Corporation | Abnormality detection support device, abnormality detection support method, and program |
| JP6424874B2 (ja) | 2016-10-12 | 2018-11-21 | オムロン株式会社 | 動作状態監視装置、学習データ生成装置、方法およびプログラム |
| US10304263B2 (en) * | 2016-12-13 | 2019-05-28 | The Boeing Company | Vehicle system prognosis device and method |
| JP6845703B2 (ja) * | 2017-02-13 | 2021-03-24 | 株式会社神戸製鋼所 | プラント状況情報提示システム及びプラント状況情報提示方法 |
| JP6778132B2 (ja) * | 2017-03-13 | 2020-10-28 | 株式会社日立製作所 | 設備機器の異常診断システム |
| KR101818394B1 (ko) | 2017-05-11 | 2018-01-12 | 울산대학교 산학협력단 | 설비 상태 진단 방법 및 장치 |
| KR102168736B1 (ko) * | 2017-06-30 | 2020-10-22 | 미쓰비시덴키 가부시키가이샤 | 비정상 검출 장치, 비정상 검출 시스템, 및 비정상 검출 방법 |
| JP6710232B2 (ja) * | 2018-02-27 | 2020-06-17 | 三菱重工業株式会社 | 管理装置、管理方法およびプログラム。 |
| JP7005419B2 (ja) * | 2018-04-20 | 2022-01-21 | 株式会社日立製作所 | 状態識別装置、状態識別方法、及び機械装置 |
| CN109861953B (zh) * | 2018-05-14 | 2020-08-21 | 新华三信息安全技术有限公司 | 一种异常用户识别方法及装置 |
| JP6832890B2 (ja) * | 2018-06-01 | 2021-02-24 | 西日本電信電話株式会社 | 監視装置、監視方法、及びコンピュータプログラム |
| JP7343748B2 (ja) * | 2018-07-24 | 2023-09-13 | 日本製鉄株式会社 | 画像判定学習装置、画像判定学習プログラム、及び画像判定学習方法、並びに高炉監視装置 |
| WO2020049615A1 (ja) | 2018-09-03 | 2020-03-12 | 三菱電機株式会社 | 信号表示制御装置および信号表示制御プログラム |
| KR102132077B1 (ko) * | 2018-09-06 | 2020-07-08 | 울산대학교 산학협력단 | 설비 데이터의 이상 정도 평가 방법 |
| DE102018122411A1 (de) * | 2018-09-13 | 2020-03-19 | Endress+Hauser SE+Co. KG | Verfahren zur Verbesserung der Messperformance von Feldgeräten der Automatisierungstechnik |
| WO2020115827A1 (ja) * | 2018-12-05 | 2020-06-11 | 三菱電機株式会社 | 異常検知装置及び異常検知方法 |
| JP7029647B2 (ja) * | 2019-03-20 | 2022-03-04 | オムロン株式会社 | コントローラ、システム、方法及びプログラム |
| DE102019107363B4 (de) * | 2019-03-22 | 2023-02-09 | Schaeffler Technologies AG & Co. KG | Verfahren und System zum Bestimmen einer Eigenschaft einer Maschine, insbesondere einer Werkzeugmaschine, ohne messtechnisches Erfassen der Eigenschaft sowie Verfahren zum Bestimmen eines voraussichtlichen Qualitätszustands eines mit einer Maschine gefertigten Bauteils |
| WO2020195626A1 (ja) * | 2019-03-26 | 2020-10-01 | 日本電気株式会社 | 異常検知方法、異常検知装置、プログラム |
| US11550686B2 (en) * | 2019-05-02 | 2023-01-10 | EMC IP Holding Company LLC | Adaptable online breakpoint detection over I/O trace time series via deep neural network autoencoders re-parameterization |
| JP6738943B1 (ja) * | 2019-06-25 | 2020-08-12 | 株式会社日立パワーソリューションズ | 異常検知装置および異常検知方法 |
| JP2021009441A (ja) * | 2019-06-28 | 2021-01-28 | ルネサスエレクトロニクス株式会社 | 異常検知システム及び異常検知プログラム |
| KR102545672B1 (ko) * | 2019-07-09 | 2023-06-21 | 한국전자통신연구원 | 기계고장 진단 방법 및 장치 |
| JP2021015573A (ja) * | 2019-07-16 | 2021-02-12 | ファナック株式会社 | 異常判定装置及び異常判定システム |
| JP2021022311A (ja) * | 2019-07-30 | 2021-02-18 | 株式会社リコー | 異常検知装置、異常検知システムおよびプログラム |
| DE102019217055A1 (de) * | 2019-11-06 | 2021-05-06 | Robert Bosch Gmbh | Verfahren zum Ermitteln einer unzulässigen Abweichung des Systemverhaltens einer technischen Einrichtung von einem Normwertebereich |
| CN114761582A (zh) | 2019-11-13 | 2022-07-15 | 杰富意钢铁株式会社 | 生产设备的监视方法、生产设备的监视装置以及生产设备的运行方法 |
| KR102741775B1 (ko) * | 2019-11-13 | 2024-12-11 | 제이에프이 스틸 가부시키가이샤 | 생산 설비의 조업 방법 및 조업 시스템 |
| JP7313292B2 (ja) * | 2020-01-27 | 2023-07-24 | 三菱電機株式会社 | プラント設備の異常兆候検知システムおよびプラント設備の異常兆候検知方法 |
| WO2021245898A1 (ja) * | 2020-06-05 | 2021-12-09 | 三菱電機株式会社 | 故障予兆検知装置、故障予兆検知方法、故障予兆検知プログラム、学習装置、学習済みの学習モデルの生成方法、学習済みの学習モデル生成プログラム |
| JP7414678B2 (ja) * | 2020-09-15 | 2024-01-16 | 株式会社東芝 | 情報処理装置、情報処理方法、およびプログラム |
| JP7710886B2 (ja) * | 2021-05-06 | 2025-07-22 | キヤノン株式会社 | 情報処理方法、情報処理装置、制御プログラム、記録媒体、物品の製造方法、学習用データの取得方法 |
| JP7506960B2 (ja) * | 2021-06-02 | 2024-06-27 | 株式会社Tmeic | データ管理装置 |
| US12346100B2 (en) * | 2021-12-08 | 2025-07-01 | Ford Global Technologies, Llc | Systems and methods for detecting manufacturing anomalies |
| CN115436991B (zh) * | 2022-09-14 | 2024-09-20 | 成都理工大学 | 一种基于最优波形的核脉冲梯形成形方法 |
| US12399770B2 (en) | 2022-12-08 | 2025-08-26 | Florida Power & Light Company | Asset information center for power generating assets of a utility provider |
| CN120762286B (zh) * | 2025-09-03 | 2025-12-16 | 益海嘉里(武汉)粮油工业有限公司 | 一种用于锅炉废水处理的智能控制方法及系统 |
Family Cites Families (9)
| Publication number | Priority date | Publication date | Assignee | Title |
|---|---|---|---|---|
| JPS5530019B2 (de) * | 1972-02-07 | 1980-08-07 | ||
| JPH08263134A (ja) * | 1995-03-27 | 1996-10-11 | Oki Electric Ind Co Ltd | プロセス制御装置の異常検出方法およびプロセス制御装置 |
| JP2006073602A (ja) * | 2004-08-31 | 2006-03-16 | Omron Corp | 熱処理の異常検出方法、異常検出装置、温度調節器およびプログラム |
| JP5099066B2 (ja) * | 2009-04-10 | 2012-12-12 | オムロン株式会社 | エネルギー監視装置およびその制御方法、ならびにエネルギー監視プログラム |
| JP5301717B1 (ja) * | 2012-08-01 | 2013-09-25 | 株式会社日立パワーソリューションズ | 設備状態監視方法およびその装置 |
| DE102013011730B3 (de) * | 2013-07-12 | 2014-08-14 | Netzsch-Gerätebau GmbH | Verfahren zur Auswertung eines Messergebnisses einer thermischen Analyse, sowie Verwendung des Verfahrens, Rechnereinrichtung, Computerprogrammprodukt und System zur Ausführung des Verfahrens |
| JP5530020B1 (ja) * | 2013-11-01 | 2014-06-25 | 株式会社日立パワーソリューションズ | 異常診断システム及び異常診断方法 |
| JP5684941B1 (ja) * | 2014-07-31 | 2015-03-18 | 株式会社日立パワーソリューションズ | 異常予兆診断装置及び異常予兆診断方法 |
| JP5715288B1 (ja) * | 2014-08-26 | 2015-05-07 | 株式会社日立パワーソリューションズ | 動態監視装置及び動態監視方法 |
-
2015
- 2015-08-05 JP JP2015155488A patent/JP5946573B1/ja active Active
-
2016
- 2016-08-03 US US15/750,102 patent/US20180231969A1/en not_active Abandoned
- 2016-08-03 EP EP16833062.9A patent/EP3333660B1/de active Active
- 2016-08-03 WO PCT/JP2016/072715 patent/WO2017022783A1/ja not_active Ceased
Cited By (1)
| Publication number | Priority date | Publication date | Assignee | Title |
|---|---|---|---|---|
| EP4282616A4 (de) * | 2021-01-25 | 2025-01-01 | The Japan Steel Works, Ltd. | Anomalieerkennungssystem, formmaschinensystem, anomalieerkennungsvorrichtung, anomalieerkennungsverfahren und computerprogramm |
Also Published As
| Publication number | Publication date |
|---|---|
| EP3333660B1 (de) | 2021-10-06 |
| JP2017033471A (ja) | 2017-02-09 |
| EP3333660A4 (de) | 2019-04-03 |
| US20180231969A1 (en) | 2018-08-16 |
| JP5946573B1 (ja) | 2016-07-06 |
| WO2017022783A1 (ja) | 2017-02-09 |
Similar Documents
| Publication | Publication Date | Title |
|---|---|---|
| EP3333660B1 (de) | Anomalieprädiktordiagnosesystem und anomalieprädiktordiagnoseverfahren | |
| EP3333661B1 (de) | Anomalieprädiktordiagnosesystem und anomalieprädiktordiagnoseverfahren | |
| JP5946572B1 (ja) | 異常予兆診断システム及び異常予兆診断方法 | |
| JP5480440B1 (ja) | 異常予兆診断装置及び異常予兆診断方法 | |
| EP2905665B1 (de) | Informationsverarbeitungsvorrichtung, Diagnoseverfahren und Programm | |
| EP3552067B1 (de) | Verfahren und systeme zur entdeckung von prognostischen untersequenzen in zeitreihen | |
| US11657121B2 (en) | Abnormality detection device, abnormality detection method and computer readable medium | |
| EP3847586A1 (de) | Computerimplementiertes verfahren, computerprogrammprodukt und system für die erkennung von anomalien und/oder prädiktive wartung | |
| JP6200833B2 (ja) | プラントと制御装置の診断装置 | |
| CN102282516A (zh) | 异常检测方法及异常检测系统 | |
| WO2016079972A1 (ja) | 要因分析装置、要因分析方法と記録媒体、及び、要因分析システム | |
| JP2016033778A (ja) | 異常予兆診断装置及び異常予兆診断方法 | |
| JP2018139085A (ja) | 異常予測方法、異常予測装置、異常予測システムおよび異常予測プログラム | |
| JP7052914B1 (ja) | 異常診断システム、異常診断装置、異常診断方法、及びプログラム | |
| JP2023106472A (ja) | 異常検知装置及び異常検知方法 | |
| CN116244654A (zh) | 基于多类型信号干式真空泵工作状态智能诊断方法及系统 | |
| CN113518983A (zh) | 用于处理大宽数据的过程控制工具 | |
| JP6710913B2 (ja) | 情報提供装置、情報提供方法、及びプログラム | |
| CN117172139B (zh) | 通信用铜包铝合金电缆的性能测试方法及系统 | |
| dos Santos et al. | Simulation-based digital twins: An accreditation method | |
| JP6785715B2 (ja) | 正常異常判別装置、正常異常判別方法、及び正常異常判別システム | |
| EP3712777A1 (de) | Vorrichtung zur datenklassifizierung | |
| Tian et al. | Bearing Fault Diagnosis and Interpretation Based on 2D Images and Convolutional Neural Network | |
| Maleki et al. | A one-class clustering technique for novelty detection and isolation in sensor networks | |
| US20250014310A1 (en) | Time-series data processing method |
Legal Events
| Date | Code | Title | Description |
|---|---|---|---|
| STAA | Information on the status of an ep patent application or granted ep patent |
Free format text: STATUS: THE INTERNATIONAL PUBLICATION HAS BEEN MADE |
|
| PUAI | Public reference made under article 153(3) epc to a published international application that has entered the european phase |
Free format text: ORIGINAL CODE: 0009012 |
|
| STAA | Information on the status of an ep patent application or granted ep patent |
Free format text: STATUS: REQUEST FOR EXAMINATION WAS MADE |
|
| 17P | Request for examination filed |
Effective date: 20180205 |
|
| AK | Designated contracting states |
Kind code of ref document: A1 Designated state(s): AL AT BE BG CH CY CZ DE DK EE ES FI FR GB GR HR HU IE IS IT LI LT LU LV MC MK MT NL NO PL PT RO RS SE SI SK SM TR |
|
| AX | Request for extension of the european patent |
Extension state: BA ME |
|
| DAV | Request for validation of the european patent (deleted) | ||
| DAX | Request for extension of the european patent (deleted) | ||
| A4 | Supplementary search report drawn up and despatched |
Effective date: 20190301 |
|
| RIC1 | Information provided on ipc code assigned before grant |
Ipc: G05B 23/02 20060101AFI20190225BHEP |
|
| STAA | Information on the status of an ep patent application or granted ep patent |
Free format text: STATUS: EXAMINATION IS IN PROGRESS |
|
| 17Q | First examination report despatched |
Effective date: 20201110 |
|
| GRAP | Despatch of communication of intention to grant a patent |
Free format text: ORIGINAL CODE: EPIDOSNIGR1 |
|
| STAA | Information on the status of an ep patent application or granted ep patent |
Free format text: STATUS: GRANT OF PATENT IS INTENDED |
|
| INTG | Intention to grant announced |
Effective date: 20210412 |
|
| GRAS | Grant fee paid |
Free format text: ORIGINAL CODE: EPIDOSNIGR3 |
|
| GRAA | (expected) grant |
Free format text: ORIGINAL CODE: 0009210 |
|
| STAA | Information on the status of an ep patent application or granted ep patent |
Free format text: STATUS: THE PATENT HAS BEEN GRANTED |
|
| AK | Designated contracting states |
Kind code of ref document: B1 Designated state(s): AL AT BE BG CH CY CZ DE DK EE ES FI FR GB GR HR HU IE IS IT LI LT LU LV MC MK MT NL NO PL PT RO RS SE SI SK SM TR |
|
| REG | Reference to a national code |
Ref country code: GB Ref legal event code: FG4D |
|
| REG | Reference to a national code |
Ref country code: CH Ref legal event code: EP Ref country code: AT Ref legal event code: REF Ref document number: 1436764 Country of ref document: AT Kind code of ref document: T Effective date: 20211015 |
|
| REG | Reference to a national code |
Ref country code: DE Ref legal event code: R096 Ref document number: 602016064709 Country of ref document: DE |
|
| REG | Reference to a national code |
Ref country code: IE Ref legal event code: FG4D |
|
| REG | Reference to a national code |
Ref country code: LT Ref legal event code: MG9D |
|
| REG | Reference to a national code |
Ref country code: NL Ref legal event code: MP Effective date: 20211006 |
|
| REG | Reference to a national code |
Ref country code: AT Ref legal event code: MK05 Ref document number: 1436764 Country of ref document: AT Kind code of ref document: T Effective date: 20211006 |
|
| PG25 | Lapsed in a contracting state [announced via postgrant information from national office to epo] |
Ref country code: RS Free format text: LAPSE BECAUSE OF FAILURE TO SUBMIT A TRANSLATION OF THE DESCRIPTION OR TO PAY THE FEE WITHIN THE PRESCRIBED TIME-LIMIT Effective date: 20211006 Ref country code: LT Free format text: LAPSE BECAUSE OF FAILURE TO SUBMIT A TRANSLATION OF THE DESCRIPTION OR TO PAY THE FEE WITHIN THE PRESCRIBED TIME-LIMIT Effective date: 20211006 Ref country code: FI Free format text: LAPSE BECAUSE OF FAILURE TO SUBMIT A TRANSLATION OF THE DESCRIPTION OR TO PAY THE FEE WITHIN THE PRESCRIBED TIME-LIMIT Effective date: 20211006 Ref country code: BG Free format text: LAPSE BECAUSE OF FAILURE TO SUBMIT A TRANSLATION OF THE DESCRIPTION OR TO PAY THE FEE WITHIN THE PRESCRIBED TIME-LIMIT Effective date: 20220106 Ref country code: AT Free format text: LAPSE BECAUSE OF FAILURE TO SUBMIT A TRANSLATION OF THE DESCRIPTION OR TO PAY THE FEE WITHIN THE PRESCRIBED TIME-LIMIT Effective date: 20211006 |
|
| PG25 | Lapsed in a contracting state [announced via postgrant information from national office to epo] |
Ref country code: IS Free format text: LAPSE BECAUSE OF FAILURE TO SUBMIT A TRANSLATION OF THE DESCRIPTION OR TO PAY THE FEE WITHIN THE PRESCRIBED TIME-LIMIT Effective date: 20220206 Ref country code: SE Free format text: LAPSE BECAUSE OF FAILURE TO SUBMIT A TRANSLATION OF THE DESCRIPTION OR TO PAY THE FEE WITHIN THE PRESCRIBED TIME-LIMIT Effective date: 20211006 Ref country code: PT Free format text: LAPSE BECAUSE OF FAILURE TO SUBMIT A TRANSLATION OF THE DESCRIPTION OR TO PAY THE FEE WITHIN THE PRESCRIBED TIME-LIMIT Effective date: 20220207 Ref country code: PL Free format text: LAPSE BECAUSE OF FAILURE TO SUBMIT A TRANSLATION OF THE DESCRIPTION OR TO PAY THE FEE WITHIN THE PRESCRIBED TIME-LIMIT Effective date: 20211006 Ref country code: NO Free format text: LAPSE BECAUSE OF FAILURE TO SUBMIT A TRANSLATION OF THE DESCRIPTION OR TO PAY THE FEE WITHIN THE PRESCRIBED TIME-LIMIT Effective date: 20220106 Ref country code: NL Free format text: LAPSE BECAUSE OF FAILURE TO SUBMIT A TRANSLATION OF THE DESCRIPTION OR TO PAY THE FEE WITHIN THE PRESCRIBED TIME-LIMIT Effective date: 20211006 Ref country code: LV Free format text: LAPSE BECAUSE OF FAILURE TO SUBMIT A TRANSLATION OF THE DESCRIPTION OR TO PAY THE FEE WITHIN THE PRESCRIBED TIME-LIMIT Effective date: 20211006 Ref country code: HR Free format text: LAPSE BECAUSE OF FAILURE TO SUBMIT A TRANSLATION OF THE DESCRIPTION OR TO PAY THE FEE WITHIN THE PRESCRIBED TIME-LIMIT Effective date: 20211006 Ref country code: GR Free format text: LAPSE BECAUSE OF FAILURE TO SUBMIT A TRANSLATION OF THE DESCRIPTION OR TO PAY THE FEE WITHIN THE PRESCRIBED TIME-LIMIT Effective date: 20220107 Ref country code: ES Free format text: LAPSE BECAUSE OF FAILURE TO SUBMIT A TRANSLATION OF THE DESCRIPTION OR TO PAY THE FEE WITHIN THE PRESCRIBED TIME-LIMIT Effective date: 20211006 |
|
| REG | Reference to a national code |
Ref country code: DE Ref legal event code: R097 Ref document number: 602016064709 Country of ref document: DE |
|
| PG25 | Lapsed in a contracting state [announced via postgrant information from national office to epo] |
Ref country code: SM Free format text: LAPSE BECAUSE OF FAILURE TO SUBMIT A TRANSLATION OF THE DESCRIPTION OR TO PAY THE FEE WITHIN THE PRESCRIBED TIME-LIMIT Effective date: 20211006 Ref country code: SK Free format text: LAPSE BECAUSE OF FAILURE TO SUBMIT A TRANSLATION OF THE DESCRIPTION OR TO PAY THE FEE WITHIN THE PRESCRIBED TIME-LIMIT Effective date: 20211006 Ref country code: RO Free format text: LAPSE BECAUSE OF FAILURE TO SUBMIT A TRANSLATION OF THE DESCRIPTION OR TO PAY THE FEE WITHIN THE PRESCRIBED TIME-LIMIT Effective date: 20211006 Ref country code: EE Free format text: LAPSE BECAUSE OF FAILURE TO SUBMIT A TRANSLATION OF THE DESCRIPTION OR TO PAY THE FEE WITHIN THE PRESCRIBED TIME-LIMIT Effective date: 20211006 Ref country code: DK Free format text: LAPSE BECAUSE OF FAILURE TO SUBMIT A TRANSLATION OF THE DESCRIPTION OR TO PAY THE FEE WITHIN THE PRESCRIBED TIME-LIMIT Effective date: 20211006 Ref country code: CZ Free format text: LAPSE BECAUSE OF FAILURE TO SUBMIT A TRANSLATION OF THE DESCRIPTION OR TO PAY THE FEE WITHIN THE PRESCRIBED TIME-LIMIT Effective date: 20211006 |
|
| PLBE | No opposition filed within time limit |
Free format text: ORIGINAL CODE: 0009261 |
|
| STAA | Information on the status of an ep patent application or granted ep patent |
Free format text: STATUS: NO OPPOSITION FILED WITHIN TIME LIMIT |
|
| 26N | No opposition filed |
Effective date: 20220707 |
|
| PG25 | Lapsed in a contracting state [announced via postgrant information from national office to epo] |
Ref country code: AL Free format text: LAPSE BECAUSE OF FAILURE TO SUBMIT A TRANSLATION OF THE DESCRIPTION OR TO PAY THE FEE WITHIN THE PRESCRIBED TIME-LIMIT Effective date: 20211006 |
|
| PG25 | Lapsed in a contracting state [announced via postgrant information from national office to epo] |
Ref country code: SI Free format text: LAPSE BECAUSE OF FAILURE TO SUBMIT A TRANSLATION OF THE DESCRIPTION OR TO PAY THE FEE WITHIN THE PRESCRIBED TIME-LIMIT Effective date: 20211006 |
|
| PG25 | Lapsed in a contracting state [announced via postgrant information from national office to epo] |
Ref country code: MC Free format text: LAPSE BECAUSE OF FAILURE TO SUBMIT A TRANSLATION OF THE DESCRIPTION OR TO PAY THE FEE WITHIN THE PRESCRIBED TIME-LIMIT Effective date: 20211006 |
|
| GBPC | Gb: european patent ceased through non-payment of renewal fee |
Effective date: 20220803 |
|
| PG25 | Lapsed in a contracting state [announced via postgrant information from national office to epo] |
Ref country code: LU Free format text: LAPSE BECAUSE OF NON-PAYMENT OF DUE FEES Effective date: 20220803 |
|
| REG | Reference to a national code |
Ref country code: BE Ref legal event code: MM Effective date: 20220831 |
|
| PG25 | Lapsed in a contracting state [announced via postgrant information from national office to epo] |
Ref country code: IT Free format text: LAPSE BECAUSE OF FAILURE TO SUBMIT A TRANSLATION OF THE DESCRIPTION OR TO PAY THE FEE WITHIN THE PRESCRIBED TIME-LIMIT Effective date: 20211006 |
|
| PG25 | Lapsed in a contracting state [announced via postgrant information from national office to epo] |
Ref country code: IE Free format text: LAPSE BECAUSE OF NON-PAYMENT OF DUE FEES Effective date: 20220803 Ref country code: FR Free format text: LAPSE BECAUSE OF NON-PAYMENT OF DUE FEES Effective date: 20220831 |
|
| PG25 | Lapsed in a contracting state [announced via postgrant information from national office to epo] |
Ref country code: BE Free format text: LAPSE BECAUSE OF NON-PAYMENT OF DUE FEES Effective date: 20220831 |
|
| PG25 | Lapsed in a contracting state [announced via postgrant information from national office to epo] |
Ref country code: GB Free format text: LAPSE BECAUSE OF NON-PAYMENT OF DUE FEES Effective date: 20220803 |
|
| PG25 | Lapsed in a contracting state [announced via postgrant information from national office to epo] |
Ref country code: HU Free format text: LAPSE BECAUSE OF FAILURE TO SUBMIT A TRANSLATION OF THE DESCRIPTION OR TO PAY THE FEE WITHIN THE PRESCRIBED TIME-LIMIT; INVALID AB INITIO Effective date: 20160803 |
|
| PG25 | Lapsed in a contracting state [announced via postgrant information from national office to epo] |
Ref country code: MK Free format text: LAPSE BECAUSE OF FAILURE TO SUBMIT A TRANSLATION OF THE DESCRIPTION OR TO PAY THE FEE WITHIN THE PRESCRIBED TIME-LIMIT Effective date: 20211006 Ref country code: CY Free format text: LAPSE BECAUSE OF FAILURE TO SUBMIT A TRANSLATION OF THE DESCRIPTION OR TO PAY THE FEE WITHIN THE PRESCRIBED TIME-LIMIT Effective date: 20211006 |
|
| PG25 | Lapsed in a contracting state [announced via postgrant information from national office to epo] |
Ref country code: TR Free format text: LAPSE BECAUSE OF FAILURE TO SUBMIT A TRANSLATION OF THE DESCRIPTION OR TO PAY THE FEE WITHIN THE PRESCRIBED TIME-LIMIT Effective date: 20211006 |
|
| PG25 | Lapsed in a contracting state [announced via postgrant information from national office to epo] |
Ref country code: MT Free format text: LAPSE BECAUSE OF FAILURE TO SUBMIT A TRANSLATION OF THE DESCRIPTION OR TO PAY THE FEE WITHIN THE PRESCRIBED TIME-LIMIT Effective date: 20211006 |
|
| PGFP | Annual fee paid to national office [announced via postgrant information from national office to epo] |
Ref country code: DE Payment date: 20250702 Year of fee payment: 10 |
|
| PGFP | Annual fee paid to national office [announced via postgrant information from national office to epo] |
Ref country code: CH Payment date: 20250901 Year of fee payment: 10 |