EP3290908A1 - Verfahren zur bestimmung einer unbekannten probe, instrument zur bestimmung unbekannten proben und programm zur bestimmung einer unbekannten probe - Google Patents
Verfahren zur bestimmung einer unbekannten probe, instrument zur bestimmung unbekannten proben und programm zur bestimmung einer unbekannten probe Download PDFInfo
- Publication number
- EP3290908A1 EP3290908A1 EP17189696.2A EP17189696A EP3290908A1 EP 3290908 A1 EP3290908 A1 EP 3290908A1 EP 17189696 A EP17189696 A EP 17189696A EP 3290908 A1 EP3290908 A1 EP 3290908A1
- Authority
- EP
- European Patent Office
- Prior art keywords
- fluorescence
- spectrum
- sample
- candidate
- peaks
- Prior art date
- Legal status (The legal status is an assumption and is not a legal conclusion. Google has not performed a legal analysis and makes no representation as to the accuracy of the status listed.)
- Granted
Links
- 238000000034 method Methods 0.000 title claims abstract description 158
- 239000000126 substance Substances 0.000 claims abstract description 282
- 238000001228 spectrum Methods 0.000 claims abstract description 175
- 238000002189 fluorescence spectrum Methods 0.000 claims description 191
- 238000005259 measurement Methods 0.000 claims description 171
- 230000005284 excitation Effects 0.000 claims description 121
- 238000012545 processing Methods 0.000 claims description 91
- 238000000491 multivariate analysis Methods 0.000 claims description 47
- 238000010606 normalization Methods 0.000 claims description 11
- 238000000605 extraction Methods 0.000 claims description 6
- 238000010586 diagram Methods 0.000 claims description 5
- 239000000284 extract Substances 0.000 claims description 5
- 238000004458 analytical method Methods 0.000 description 32
- 238000010238 partial least squares regression Methods 0.000 description 9
- 230000003287 optical effect Effects 0.000 description 8
- 235000013305 food Nutrition 0.000 description 7
- 238000004364 calculation method Methods 0.000 description 5
- 150000001875 compounds Chemical class 0.000 description 5
- 238000004519 manufacturing process Methods 0.000 description 5
- 239000000463 material Substances 0.000 description 5
- 239000003256 environmental substance Substances 0.000 description 4
- 238000000695 excitation spectrum Methods 0.000 description 4
- 238000001506 fluorescence spectroscopy Methods 0.000 description 4
- 230000035945 sensitivity Effects 0.000 description 4
- 229910010272 inorganic material Inorganic materials 0.000 description 3
- GVJHHUAWPYXKBD-UHFFFAOYSA-N (±)-α-Tocopherol Chemical compound OC1=C(C)C(C)=C2OC(CCCC(C)CCCC(C)CCCC(C)C)(C)CCC2=C1C GVJHHUAWPYXKBD-UHFFFAOYSA-N 0.000 description 2
- 229930195730 Aflatoxin Natural products 0.000 description 2
- XWIYFDMXXLINPU-UHFFFAOYSA-N Aflatoxin G Chemical compound O=C1OCCC2=C1C(=O)OC1=C2C(OC)=CC2=C1C1C=COC1O2 XWIYFDMXXLINPU-UHFFFAOYSA-N 0.000 description 2
- OUYCCCASQSFEME-QMMMGPOBSA-N L-tyrosine Chemical compound OC(=O)[C@@H](N)CC1=CC=C(O)C=C1 OUYCCCASQSFEME-QMMMGPOBSA-N 0.000 description 2
- 239000005409 aflatoxin Substances 0.000 description 2
- 239000003814 drug Substances 0.000 description 2
- 239000011147 inorganic material Substances 0.000 description 2
- 239000011159 matrix material Substances 0.000 description 2
- 238000012544 monitoring process Methods 0.000 description 2
- 150000002894 organic compounds Chemical class 0.000 description 2
- 239000011368 organic material Substances 0.000 description 2
- 238000007781 pre-processing Methods 0.000 description 2
- 238000000513 principal component analysis Methods 0.000 description 2
- 238000000611 regression analysis Methods 0.000 description 2
- 238000004904 shortening Methods 0.000 description 2
- PUKLDDOGISCFCP-JSQCKWNTSA-N 21-Deoxycortisone Chemical compound C1CC2=CC(=O)CC[C@]2(C)[C@@H]2[C@@H]1[C@@H]1CC[C@@](C(=O)C)(O)[C@@]1(C)CC2=O PUKLDDOGISCFCP-JSQCKWNTSA-N 0.000 description 1
- QJZYHAIUNVAGQP-UHFFFAOYSA-N 3-nitrobicyclo[2.2.1]hept-5-ene-2,3-dicarboxylic acid Chemical compound C1C2C=CC1C(C(=O)O)C2(C(O)=O)[N+]([O-])=O QJZYHAIUNVAGQP-UHFFFAOYSA-N 0.000 description 1
- 229910052693 Europium Inorganic materials 0.000 description 1
- FCYKAQOGGFGCMD-UHFFFAOYSA-N Fulvic acid Natural products O1C2=CC(O)=C(O)C(C(O)=O)=C2C(=O)C2=C1CC(C)(O)OC2 FCYKAQOGGFGCMD-UHFFFAOYSA-N 0.000 description 1
- 229910052771 Terbium Inorganic materials 0.000 description 1
- 229930003427 Vitamin E Natural products 0.000 description 1
- 229940024606 amino acid Drugs 0.000 description 1
- 150000001413 amino acids Chemical class 0.000 description 1
- 229930002875 chlorophyll Natural products 0.000 description 1
- 235000019804 chlorophyll Nutrition 0.000 description 1
- 229940106705 chlorophyll Drugs 0.000 description 1
- ATNHDLDRLWWWCB-AENOIHSZSA-M chlorophyll a Chemical compound C1([C@@H](C(=O)OC)C(=O)C2=C3C)=C2N2C3=CC(C(CC)=C3C)=[N+]4C3=CC3=C(C=C)C(C)=C5N3[Mg-2]42[N+]2=C1[C@@H](CCC(=O)OC\C=C(/C)CCC[C@H](C)CCC[C@H](C)CCCC(C)C)[C@H](C)C2=C5 ATNHDLDRLWWWCB-AENOIHSZSA-M 0.000 description 1
- -1 europium and terbium Chemical class 0.000 description 1
- OGPBJKLSAFTDLK-UHFFFAOYSA-N europium atom Chemical compound [Eu] OGPBJKLSAFTDLK-UHFFFAOYSA-N 0.000 description 1
- 238000011156 evaluation Methods 0.000 description 1
- 235000021588 free fatty acids Nutrition 0.000 description 1
- 239000002509 fulvic acid Substances 0.000 description 1
- 229940095100 fulvic acid Drugs 0.000 description 1
- WIGCFUFOHFEKBI-UHFFFAOYSA-N gamma-tocopherol Natural products CC(C)CCCC(C)CCCC(C)CCCC1CCC2C(C)C(O)C(C)C(C)C2O1 WIGCFUFOHFEKBI-UHFFFAOYSA-N 0.000 description 1
- 239000004021 humic acid Substances 0.000 description 1
- 150000002484 inorganic compounds Chemical class 0.000 description 1
- 230000003993 interaction Effects 0.000 description 1
- 238000011068 loading method Methods 0.000 description 1
- 238000004445 quantitative analysis Methods 0.000 description 1
- IFGCUJZIWBUILZ-UHFFFAOYSA-N sodium 2-[[2-[[hydroxy-(3,4,5-trihydroxy-6-methyloxan-2-yl)oxyphosphoryl]amino]-4-methylpentanoyl]amino]-3-(1H-indol-3-yl)propanoic acid Chemical compound [Na+].C=1NC2=CC=CC=C2C=1CC(C(O)=O)NC(=O)C(CC(C)C)NP(O)(=O)OC1OC(C)C(O)C(O)C1O IFGCUJZIWBUILZ-UHFFFAOYSA-N 0.000 description 1
- 238000003860 storage Methods 0.000 description 1
- 239000013076 target substance Substances 0.000 description 1
- GZCRRIHWUXGPOV-UHFFFAOYSA-N terbium atom Chemical compound [Tb] GZCRRIHWUXGPOV-UHFFFAOYSA-N 0.000 description 1
- 229960004441 tyrosine Drugs 0.000 description 1
- 229940046009 vitamin E Drugs 0.000 description 1
- 235000019165 vitamin E Nutrition 0.000 description 1
- 239000011709 vitamin E Substances 0.000 description 1
Images


Classifications
-
- G—PHYSICS
- G01—MEASURING; TESTING
- G01N—INVESTIGATING OR ANALYSING MATERIALS BY DETERMINING THEIR CHEMICAL OR PHYSICAL PROPERTIES
- G01N21/00—Investigating or analysing materials by the use of optical means, i.e. using sub-millimetre waves, infrared, visible or ultraviolet light
- G01N21/62—Systems in which the material investigated is excited whereby it emits light or causes a change in wavelength of the incident light
- G01N21/63—Systems in which the material investigated is excited whereby it emits light or causes a change in wavelength of the incident light optically excited
- G01N21/64—Fluorescence; Phosphorescence
- G01N21/645—Specially adapted constructive features of fluorimeters
-
- G—PHYSICS
- G01—MEASURING; TESTING
- G01J—MEASUREMENT OF INTENSITY, VELOCITY, SPECTRAL CONTENT, POLARISATION, PHASE OR PULSE CHARACTERISTICS OF INFRARED, VISIBLE OR ULTRAVIOLET LIGHT; COLORIMETRY; RADIATION PYROMETRY
- G01J1/00—Photometry, e.g. photographic exposure meter
- G01J1/02—Details
- G01J1/0219—Electrical interface; User interface
-
- G—PHYSICS
- G01—MEASURING; TESTING
- G01J—MEASUREMENT OF INTENSITY, VELOCITY, SPECTRAL CONTENT, POLARISATION, PHASE OR PULSE CHARACTERISTICS OF INFRARED, VISIBLE OR ULTRAVIOLET LIGHT; COLORIMETRY; RADIATION PYROMETRY
- G01J3/00—Spectrometry; Spectrophotometry; Monochromators; Measuring colours
-
- G—PHYSICS
- G01—MEASURING; TESTING
- G01J—MEASUREMENT OF INTENSITY, VELOCITY, SPECTRAL CONTENT, POLARISATION, PHASE OR PULSE CHARACTERISTICS OF INFRARED, VISIBLE OR ULTRAVIOLET LIGHT; COLORIMETRY; RADIATION PYROMETRY
- G01J3/00—Spectrometry; Spectrophotometry; Monochromators; Measuring colours
- G01J3/02—Details
- G01J3/0264—Electrical interface; User interface
-
- G—PHYSICS
- G01—MEASURING; TESTING
- G01J—MEASUREMENT OF INTENSITY, VELOCITY, SPECTRAL CONTENT, POLARISATION, PHASE OR PULSE CHARACTERISTICS OF INFRARED, VISIBLE OR ULTRAVIOLET LIGHT; COLORIMETRY; RADIATION PYROMETRY
- G01J3/00—Spectrometry; Spectrophotometry; Monochromators; Measuring colours
- G01J3/28—Investigating the spectrum
- G01J3/2823—Imaging spectrometer
-
- G—PHYSICS
- G01—MEASURING; TESTING
- G01J—MEASUREMENT OF INTENSITY, VELOCITY, SPECTRAL CONTENT, POLARISATION, PHASE OR PULSE CHARACTERISTICS OF INFRARED, VISIBLE OR ULTRAVIOLET LIGHT; COLORIMETRY; RADIATION PYROMETRY
- G01J3/00—Spectrometry; Spectrophotometry; Monochromators; Measuring colours
- G01J3/28—Investigating the spectrum
- G01J3/44—Raman spectrometry; Scattering spectrometry ; Fluorescence spectrometry
- G01J3/4406—Fluorescence spectrometry
-
- G—PHYSICS
- G01—MEASURING; TESTING
- G01N—INVESTIGATING OR ANALYSING MATERIALS BY DETERMINING THEIR CHEMICAL OR PHYSICAL PROPERTIES
- G01N21/00—Investigating or analysing materials by the use of optical means, i.e. using sub-millimetre waves, infrared, visible or ultraviolet light
- G01N21/17—Systems in which incident light is modified in accordance with the properties of the material investigated
- G01N21/25—Colour; Spectral properties, i.e. comparison of effect of material on the light at two or more different wavelengths or wavelength bands
- G01N21/27—Colour; Spectral properties, i.e. comparison of effect of material on the light at two or more different wavelengths or wavelength bands using photo-electric detection ; circuits for computing concentration
- G01N21/274—Calibration, base line adjustment, drift correction
-
- G—PHYSICS
- G01—MEASURING; TESTING
- G01N—INVESTIGATING OR ANALYSING MATERIALS BY DETERMINING THEIR CHEMICAL OR PHYSICAL PROPERTIES
- G01N21/00—Investigating or analysing materials by the use of optical means, i.e. using sub-millimetre waves, infrared, visible or ultraviolet light
- G01N21/62—Systems in which the material investigated is excited whereby it emits light or causes a change in wavelength of the incident light
- G01N21/63—Systems in which the material investigated is excited whereby it emits light or causes a change in wavelength of the incident light optically excited
- G01N21/64—Fluorescence; Phosphorescence
-
- G—PHYSICS
- G01—MEASURING; TESTING
- G01J—MEASUREMENT OF INTENSITY, VELOCITY, SPECTRAL CONTENT, POLARISATION, PHASE OR PULSE CHARACTERISTICS OF INFRARED, VISIBLE OR ULTRAVIOLET LIGHT; COLORIMETRY; RADIATION PYROMETRY
- G01J3/00—Spectrometry; Spectrophotometry; Monochromators; Measuring colours
- G01J3/28—Investigating the spectrum
- G01J2003/283—Investigating the spectrum computer-interfaced
- G01J2003/284—Spectral construction
-
- G—PHYSICS
- G01—MEASURING; TESTING
- G01N—INVESTIGATING OR ANALYSING MATERIALS BY DETERMINING THEIR CHEMICAL OR PHYSICAL PROPERTIES
- G01N21/00—Investigating or analysing materials by the use of optical means, i.e. using sub-millimetre waves, infrared, visible or ultraviolet light
- G01N21/62—Systems in which the material investigated is excited whereby it emits light or causes a change in wavelength of the incident light
- G01N21/63—Systems in which the material investigated is excited whereby it emits light or causes a change in wavelength of the incident light optically excited
- G01N21/64—Fluorescence; Phosphorescence
- G01N2021/6417—Spectrofluorimetric devices
- G01N2021/6419—Excitation at two or more wavelengths
-
- G—PHYSICS
- G01—MEASURING; TESTING
- G01N—INVESTIGATING OR ANALYSING MATERIALS BY DETERMINING THEIR CHEMICAL OR PHYSICAL PROPERTIES
- G01N21/00—Investigating or analysing materials by the use of optical means, i.e. using sub-millimetre waves, infrared, visible or ultraviolet light
- G01N21/62—Systems in which the material investigated is excited whereby it emits light or causes a change in wavelength of the incident light
- G01N21/63—Systems in which the material investigated is excited whereby it emits light or causes a change in wavelength of the incident light optically excited
- G01N21/64—Fluorescence; Phosphorescence
- G01N2021/6417—Spectrofluorimetric devices
- G01N2021/6421—Measuring at two or more wavelengths
-
- G—PHYSICS
- G01—MEASURING; TESTING
- G01N—INVESTIGATING OR ANALYSING MATERIALS BY DETERMINING THEIR CHEMICAL OR PHYSICAL PROPERTIES
- G01N21/00—Investigating or analysing materials by the use of optical means, i.e. using sub-millimetre waves, infrared, visible or ultraviolet light
- G01N21/17—Systems in which incident light is modified in accordance with the properties of the material investigated
- G01N21/25—Colour; Spectral properties, i.e. comparison of effect of material on the light at two or more different wavelengths or wavelength bands
- G01N21/27—Colour; Spectral properties, i.e. comparison of effect of material on the light at two or more different wavelengths or wavelength bands using photo-electric detection ; circuits for computing concentration
- G01N21/274—Calibration, base line adjustment, drift correction
- G01N21/276—Calibration, base line adjustment, drift correction with alternation of sample and standard in optical path
-
- G—PHYSICS
- G01—MEASURING; TESTING
- G01N—INVESTIGATING OR ANALYSING MATERIALS BY DETERMINING THEIR CHEMICAL OR PHYSICAL PROPERTIES
- G01N21/00—Investigating or analysing materials by the use of optical means, i.e. using sub-millimetre waves, infrared, visible or ultraviolet light
- G01N21/62—Systems in which the material investigated is excited whereby it emits light or causes a change in wavelength of the incident light
- G01N21/63—Systems in which the material investigated is excited whereby it emits light or causes a change in wavelength of the incident light optically excited
- G01N21/64—Fluorescence; Phosphorescence
- G01N21/6486—Measuring fluorescence of biological material, e.g. DNA, RNA, cells
-
- G—PHYSICS
- G01—MEASURING; TESTING
- G01N—INVESTIGATING OR ANALYSING MATERIALS BY DETERMINING THEIR CHEMICAL OR PHYSICAL PROPERTIES
- G01N2201/00—Features of devices classified in G01N21/00
- G01N2201/12—Circuits of general importance; Signal processing
Definitions
- the present disclosure relates to a method, an instrument, and a program for acquiring a three-dimensional (3D) spectrum of the excitation wavelength, the fluorescence wavelength, and the fluorescence intensity and determining an unknown sample based on the acquired fluorescence characteristic.
- 3D three-dimensional
- the mainstream of fluorescence measurements is to measure a two-dimensional excitation-fluorescence spectrum in which fluorescence intensity values are plotted with respect to the excitation wavelength or the fluorescence wavelength. And a quantitative analysis is performed using a standard curve with respect to the fluorescence intensity that is obtained at a single pair of an excitation wavelength and a fluorescence wavelength using a standard having a known density.
- Non-Patent Document-1 " Foods and Tableware," 2013, Vol. 54, No. 5
- a PLS regression formula is determined using, as known teacher data, measurement values of a chemical analysis on free amino acid, free fatty acid, or the like (target variable) and 3D fluorescence spectrum data (explanatory variable) and a target value of an unknown sample is obtained using the determined PLS regression formula.
- the PLS regression analysis is an analyzing method for obtaining a quantitative value of a target substance.
- a peak in a 3D fluorescence spectrum can be identified as long as a fluorescence wavelength of a compound that emits measurement target fluorescence.
- a measurement target such as a food, a chemical material, or an environmental substance in many cases contains plural fluorescent substances, in which case compounds other than a target compound for which a quantitative value is to be obtained emit fluorescence.
- a final target value is obtained by extracting characteristics of plural fluorescent substances at pairs of an excitation wavelength and a fluorescence wavelength. There may occur a case that an unknown fluorescence wavelength contributes to a model, in which case it cannot be determined to what fluorescent substances 3D fluorescence spectrum data of the model are attributed.
- the model is a combination of the wavelengths and the coefficients.
- the analysis accuracy is increased by eliminating noise such as scattered light, second-order light, and third-order light.
- a sample whose fluorescence characteristic is known such as aflatoxin which is referred to in JP-B-5856741
- data in an excitation wavelength range and a fluorescence wavelength range of a 3D fluorescence spectrum that represents the features of aflatoxin contained in a measurement target are mainly extracted.
- a sample without such property information can be determined by sequentially identifying fluorescent substances to which respective fluorescence characteristic-indicative fluorescence spectrum peaks are attributed. It is necessary to determine a spectrum range and sub peaks that indicate a fluorescence characteristic based on a peak of attention of a measured 3D fluorescence spectrum and to determine a fluorescent substance by comparing an excitation wavelength and a fluorescence wavelength of the peak of attention and the determined spectrum range and sub peaks with a known fluorescent substance library. It is further necessary to set an effective spectrum range and perform a multivariate analysis.
- an unknown sample determining method of determining an unknown sample by calculating model coefficients by extracting a fluorescence characteristic from results of measurements of 3D fluorescence spectra of standards including:
- the candidate fluorescent substance determining step of each of the standard process and the sample process may include:
- the spectrum range selection step may include a proximate peaks determination processing which is performed when first peaks attributed to plural respective fluorescent substances are so close to each other that spectrum ranges corresponding to the contour line determination value overlap with each other, the proximate peaks determination processing including:
- the candidate sample extracting step may include: identifying plural combination of fluorescent substances, when plural combination of fluorescent substances are determined in the candidate fluorescent substance determining step of the sample process, by repeatedly extracting, a number of times that is equal to the number of combinations of fluorescent substances, a combination of candidate fluorescent substances in the peak selection step, the spectrum range selection step, and the sub peak selection step; and extracting a candidate sample by collating the identified plural combinations of fluorescent substances with the candidate sample library.
- the candidate fluorescent substance display step may include displaying a list of the names of the extracted candidate fluorescent substances and at least pairs of wavelengths of the first peaks, the spectrum ranges, and the sets of pieces of sub peak information based on which the fluorescence characteristic was determined and the model coefficients.
- the candidate sample display step may include: selectively displaying, together with the names of the extracted candidate fluorescent substances:
- the invention further provides an unknown sample determining program of causing a photometer unit to measure a 3D fluorescence spectrum by shining excitation light on a measurement sample according to an instruction from a controller, causing a data processing unit to store the measured 3D fluorescence spectrum in three dimensions of the excitation wavelength, the fluorescence wavelength, and the fluorescence intensity, and causing the data processing unit to execute a candidate fluorescence substance determining process based on stored data to determine candidate fluorescent substances and a candidate sample, wherien the unknown sample determining program performs a series of process including:
- the above unknown sample determining program may be configured in that, wherein, in the standard process, the unknown sample determining program performs a series of process including:
- the above unknown sample determining program may be configured in that wherein, in the candidate fluorescence substance determining process, the unknown sample determining program performs a series of process including:
- the above unknown sample determining program may be configured in that wherein, in identifying the unknown sample in the sample process, the unknown sample determining program executes the candidate fluorescent substance determining process by causing the data processing unit to determine candidate fluorescent substances; extract a candidate sample containing the determined fluorescent substances from a candidate fluorescent sample library; and if plural combinations of fluorescent substances are found, extract a candidate sample containing a second-determined combination of fluorescent substances from the candidate fluorescent sample library; execute the extraction step repeatedly a number of times that is equal to the number of combinations of fluorescent substances to narrow down the candidate samples; and display a name of a finally extracted candidate sample and its fluorescence characteristic information together with a measured 3D fluorescence spectrum.
- the fluorescence spectrophotometer includes a photometer unit 100, a computer unit 200, and an interface unit 300.
- An analyst inputs measurement conditions through an operating panel 32 of the interface unit 300.
- continuous wave light emitted from a light source 1 is split by an excitation-side spectroscope 2 to produce excitation light, part of which is shone, via a beam splitter 3, on a measurement sample 6 that is mounted on a sample mounting stage 5.
- An excitation-side slit is included in the excitation-side spectroscope 2, and resolution of monochrome light that is extracted from continuous wave light is determined by setting a width of the slit.
- a light quantity of the part, separated by the beam splitter 3, of the excitation light is measured by a monitoring detector 4, whereby a variation in the light source 1 is corrected.
- Fluorescent light emitted from the sample 6 is split by a fluorescence-side spectroscope 7 to produce monochrome light, which is detected by a detector 8.
- a fluorescence-side slit is included in the fluorescence-side spectroscope 7, and resolution of monochrome light that is separated from fluorescent light is determined by setting a width of the slit.
- a signal detected by the detector 8 is received by a data processing unit 23 as a signal intensity via an A/D converter 21, and a measurement result is displayed on a monitor 31.
- An excitation-side pulse motor 12 is driven according to an instruction from a controller 22 and the excitation-side spectroscope 2 is thereby set at an intended wavelength.
- a fluorescence-side pulse motor 11 is driven according to an instruction from the controller 22 and the fluorescence-side spectroscope 7 is thereby set at an intended wavelength.
- Each of the excitation-side spectroscope 2 and the fluorescence-side spectroscope 7 employs such an optical element as a diffraction grating or a prism, and a spectrum scan is performed by rotating the optical element via gears and a cam using motive power produced by the excitation-side pulse motor 12 or the fluorescence-side pulse motor 11.
- An excitation-side filter 15 is disposed between the excitation-side spectroscope 2 and the measurement sample 6.
- One of plural cut filters is inserted into the optical path as the excitation-side filter 15 by an excitation-side filter pulse motor 13.
- a fluorescence-side filter 16 is disposed between the measurement sample 6 and the fluorescence-side spectroscope 7.
- One of plural cut filters is inserted into the optical path as the fluorescence-side filter 16 by a fluorescence-side filter pulse motor 14.
- a three-dimensional (3D) fluorescence spectrum is measured in the following manner.
- excitation light emitted from the excitation-side spectroscope 2 that is set at a fixed wavelength is shone on the measurement sample 6, a fluorescence spectrum is measured as a wavelength scan is performed by the fluorescence-side spectroscope 7.
- the fluorescence wavelength is returned to a start wavelength, the excitation wavelength is changed by a prescribed wavelength interval, and a fluorescence spectrum is measured at the resulting excitation wavelength.
- Resulting fluorescence spectra are stored in three dimensions, that is, the excitation wavelength, the fluorescence wavelength, and the fluorescence intensity.
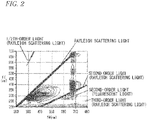
- the above operation is performed repeatedly until a fluorescence spectrum corresponding to a final wavelength of a prescribed excitation wavelength range, whereby a 3D fluorescence spectrum is obtained and displayed in the form of a contour diagram as shown in Fig. 2 .
- the fluorescence spectrophotometer shown in Fig. 1 is a monochrometer in which a wavelength scan of the fluorescence-side spectroscope 7 is performed by the fluorescence-side pulse motor 11 and monochromatic light is detected by the detector 8 such as a photomultiplier, it can be implemented as a polychrometer that does not include the fluorescence-side pulse motor 11 and employs, as the detector 8, an area detector such as a CCD.
- Fluorescence intensity values of a 3D fluorescence spectrum are shown with the vertical axis and the horizontal axis representing the excitation wavelength EX and the fluorescence wavelength EM, respectively.
- the vertical axis and the horizontal axis may represent the fluorescence wavelength and the excitation wavelength, respectively.
- fluorescent substance as used herein is a generic term of compounds that emit fluorescent light.
- Example fluorescent compounds are organic compounds such as L-tyrosine, L-tryptophan, vitamin E, and chlorophyll and inorganic compounds such as europium and terbium, as well as amorphous organic compounds such as humic acid and fulvic acid. Scattered light of excitation light appears at the same wavelength as the excitation light, and high-order light such as second-order light appears at a wavelength that is N times the wavelength of scattered light (N: integer).
- a peak selection step S11 an excitation wavelength and a fluorescence wavelength of a peak of attention as a first peak are selected in a measured 3D fluorescence spectrum.
- Fig. 4 shows an example first peak selected in a 3D fluorescence spectrum.
- Fluorescent substance identification is made using the first peak and sub peaks appearing at the same fluorescence wavelength as of the first peak.
- the peak selection step S11 may be either such that a single peak is selected simply or such that an excitation wavelength range and a fluorescence wavelength range are set and an excitation wavelength and a fluorescence wavelength that provide a maximum intensity in these wavelength ranges are selected as peak wavelengths.
- An excitation wavelength range and a fluorescence wavelength range (e.g., ⁇ 5 nm) with respect to the peak wavelengths are also input as search allowable ranges to be used in referring to a candidate fluorescent substance library.
- the peak intensity of the selected first peak is normalized to a prescribed value to facilitate data comparison.
- a spectrum range selection step S12 spectrum ranges corresponding to a region enclosed by a broken line in area (a) of Fig. 5 are acquired.
- a spectrum range is defined by an excitation wavelength range and a fluorescence wavelength range and is set for each contour line determination value.
- the contour line determination value is a parameter that is specified by a measurer and indicates a threshold value for extraction of intensity data from a 3D fluorescence spectrum.
- a spectrum range corresponding to an intensity "10” with respect to the normalized intensity "100" of the first peak that was set at the peak selection step S11 is searched for.
- a target area is set that is defined by an excitation wavelength range and a fluorescence wavelength range. Widest wavelength ranges of a closed contour line that connects the same fluorescence intensity values are set. Then it is determined whether the thus-set spectrum range is included in measurement wavelength ranges. If the spectrum range is out of the measurement wavelength ranges, another spectrum range is set.
- peaks of two fluorescent substances are located close to each other as shown in area (a) of Fig. 6 , sets of contour lines of the two fluorescent substances overlap with each other, that is, contour lines of one fluorescent substance extend to wavelength ranges of the other fluorescent substance.
- an excitation wavelength that is located on the shorter wavelength side or the longer wavelength side is set instead of an excitation wavelength corresponding to a maximum fluorescence intensity (proximate peaks determination processing), whereby a single fluorescence spectrum range that does not overlap with a fluorescence spectrum range of another fluorescent substance.
- a fluorescence spectrum that is not influenced by a fluorescent substance whose fluorescence spectrum exists around a fluorescence wavelength 400 nm.
- a shorter-wavelength-side fluorescence wavelength range is determined based on the shape of this fluorescence spectrum.
- a resulting spectrum range is given by an excitation wavelength range 255 to 390 nm and a fluorescence wavelength range 290 to 600 nm.
- a resulting spectrum range is given by an excitation wavelength range 280 to 390 nm and a fluorescence wavelength range 410 to 600 nm; a spectrum range that is specialized for a target peak can be selected.
- a spectrum range is searched for in such a manner that the excitation wavelength of a target peak is shifted to the longer wavelength side if it overlaps with a shorter-wavelength-side peak and to the shorter wavelength side if it overlaps with a longer-wavelength-side peak.
- wavelength ranges of kinds of light other than fluorescent light that is, a wavelength range of scattered light, wavelength ranges of high-order light beams that are generated in the case of an instrument not using a filter, and a wavelength range that is shorter than the excitation wavelength, are excluded from a search target.
- a spectrum range is given by an excitation wavelength range 300 to 680 nm and a fluorescence wavelength range 650 to 780 nm (indicated by a broken line in area (a) of Fig. 5 ).
- a spectrum range is given by an excitation wavelength range 340 to 670 nm and a fluorescence wavelength range 680 to 730 nm (indicated by a chain line in area (a) of Fig. 5 ).
- An allowable search error (wavelength error) for a contour line determination value is input as a determination wavelength range (e.g., ⁇ 10 nm).
- peaks other than the first peak that was selected at the peak selection step S11 are determined in the spectrum range that was set at the spectrum range selection step S12.
- the first peak is indicated by a thick arrow and sub peaks are indicated by thin arrows in areas (b) and (c) of Fig. 7 .
- Sub peaks may be set either automatically by setting an intensity threshold value and extracting peaks that exceed the threshold value or manually by a measurer.
- wavelength ranges of kinds of light other than fluorescent light that is, a wavelength range of scattered light, wavelength ranges of high-order light beams that are generated in the case of an instrument not using a filter, and a wavelength range that is shorter than the excitation wavelength, are excluded from a setting target.
- Allowable ranges, to be used in a search of sub peaks, for the number of sub peaks, sub peak ratios, sub peak excitation wavelengths EX, and sub peak fluorescence wavelengths EM are input.
- values ⁇ 1, ⁇ 5, ⁇ 10 nm, and ⁇ 10 nm are input for the number of sub peaks, sub peak ratios, sub peak excitation wavelengths, and sub peak fluorescence wavelengths, respectively.
- Sub peaks thus set are characterized based on the number of sub peaks, sub peak wavelengths, and sub peak intensity ratios. Whether each input sub peak wavelength is included in the measurement wavelength range is determined. If the input sub peak wavelength is out of the measurement wavelength range, the instrument causes the measurer to input a sub peak wavelength again.
- sub peak ratio means the ratio of a fluorescence intensity of a sub peak to the normalized fluorescence intensity of the first peak.
- a candidate fluorescent substance is extracted through collation with a candidate fluorescent substance library that is prepared in advance.
- the candidate fluorescent substance library is a library of fluorescent substances produced by performing, in advance, measurements on fluorescent substances to become candidates, and contains, for each fluorescent substance, a peak excitation wavelength range and a peak fluorescence wavelength range that were obtained at the peak selection step S11, spectrum ranges that were set for respective contour line determination values at the spectrum range selection step S12, and the number of sub peaks, sub peak ratios, sub peak excitation wavelengths, and sub peak fluorescence wavelengths that were obtained at the sub peak selection step S13.
- Measurement data are compared with the candidate fluorescent substance library in each process, whereby a candidate fluorescent substance is determined from the fluorescent substances contained in the candidate fluorescent substance library.
- results obtained at the peak selection step S11, the spectrum range selection step S12, and the sub peak selection step S13 of each process is displayed in the form of a list. More specifically, the list contains peak wavelengths of a first peak that was specified at the peak selection step S11, a spectrum range (SPECTRUM RANGE -50) corresponding to a contour line determination value "50" and a spectrum range (SPECTRUM RANGE -10) corresponding to a contour line determination value "10" that were obtained at the spectrum range selection step S12, and sub peak information that was obtained at the sub peak selection step S13, that is, the number of sub peaks, sub peak ratios, sub peak excitation wavelengths EX, and sub peak fluorescence wavelengths EM.
- SPECTRUM RANGE -50 corresponding to a contour line determination value "50”
- SPECTRUM RANGE -10 spectrum range
- a result of determination, from the candidate fluorescent substance library, of a candidate fluorescent substance that satisfies the above conditions is displayed in the form of a candidate fluorescent substance list.
- a measurement target such as a food, a chemical material, or an environmental substance in many cases contains plural fluorescent substances.
- a candidate fluorescent substance for one peak first peak
- the next first peak is selected at the peak selection step S11 and the spectrum range selection step S12 and the sub peak selection step S 13 are then executed to determine another candidate fluorescent substance.
- Fig. 14 shows an example display of results of determination of candidate fluorescent substances corresponding to respective peaks. It is appropriate to display results of determination of candidate fluorescent substances together with their names. It is also appropriate to also show, for each candidate fluorescent substance, pieces of information that were used for the determination, that is, peak wavelengths, a spectrum range corresponding to a contour line determination value "50," a spectrum range corresponding to a contour line determination value "10", the number of sub peaks, sub peak ratios, sub peak excitation wavelengths EX, and sub peak fluorescence wavelengths EM.
- a procedure for performing a multivariate analysis on 3D fluorescence spectra consists of a standard process of performing measurements on known samples as standards whose information determination information to become a target variable (production area information when a production area determination is intended and success/failure information when a success/failure determination is intended) and a fluorescence characteristic such as density information (for a regression analysis such as PLS) are known in advance and obtaining model coefficients for each pair of an excitation wavelength and a fluorescence wavelength, and a sample process of obtaining a target value of an unknown sample based on the model coefficients obtained by the standard process.
- a target variable production area information when a production area determination is intended and success/failure information when a success/failure determination is intended
- a fluorescence characteristic such as density information (for a regression analysis such as PLS)
- Wavelength range conditions are set that include an excitation start wavelength, an excitation end wavelength, an excitation data interval, a fluorescence start wavelength, a fluorescence end wavelength, and a fluorescence data interval.
- a condition that dictates a measurement speed is a wavelength scanning rate.
- Conditions that dictate resolution are an excitation-side slit width and a fluorescence-side slit width.
- a condition relating to a data response speed is a response setting value that relates to noise and resolution.
- a condition that determines sensitivity is a detector voltage.
- a measurement time of one sample is determined by conditions of wavelength ranges and a measurement speed. If a wide excitation wavelength range and fluorescence wavelength range are set, the number of data and the measurement time are increased. In usual sample measurements, an excitation wavelength and a fluorescence wavelength at which fluorescence occurs are unknown. Thus, in general, a measurement is performed in a wide excitation wavelength range and fluorescence wavelength range and preprocessing is performed to obtain data to be used for an analysis by removing unnecessary data corresponding to scattered light, second-order light, etc. In this manner, data in an effective fluorescence wavelength range is used for the analysis.
- step S22 To perform a multivariate analysis, measurement data of plural standards are necessary.
- standards that are supposed to be subjected to measurement are registered in a standard table in advance.
- information to become a target variable that is, determination information (production area information when a production area determination is intended and success/failure information when a success/failure determination is intended) and density information (for a regression analysis such as PLS), is input for each standard.
- step S23 3D fluorescence spectra of the standards are measured based on the standard table.
- step S24 the candidate fluorescent substance determining process shown in Figs. 3A-3D is executed on each measured 3D fluorescence spectrum, whereby candidate fluorescent substances are determined.
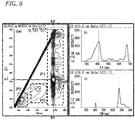
- Fig. 10 shows examples of a 3D fluorescence spectrum and a result of determination of candidate fluorescent substances.
- a 3D fluorescence spectrum and a result of determination of candidate fluorescent substances extracted based on peak wavelengths are displayed together.
- the peak wavelengths of the candidate fluorescent substances are plotted in the 3D fluorescence spectrum so as to be recognizable.
- Sub peak wavelengths may also be plotted so as to be recognizable.
- Spectrum ranges corresponding to a contour line determination value "50" or "10” are also displayed using a broken line or the like. Since the 3D fluorescence spectrum and the list of candidate fluorescent substances are displayed together, the candidate fluorescent substances for the respective peaks can be recognized visually. When one candidate fluorescent substance is selected, its peak wavelengths and spectrum range may be highlighted for determination.
- a contour line determination value to be used for setting spectrum ranges may be set in a desired manner.
- a multivariate analysis is performed in such a manner as to involve unnecessary data, the accuracy of analysis lowers. Furthermore, if a multivariate analysis involves too large a number of data, too long an analysis time may be needed depending on the performance of the data processing unit 23 and the analysis algorithm. Thus, reducing the number of data to be used for a multivariate analysis, that is, the number of spectrum ranges corresponding to a contour line determination value, is useful for increase of analysis accuracy and shortening of an analysis time. For these reasons, at step S25, data other than data in spectrum ranges corresponding to a contour line determination value are eliminated from data to be subjected to a multivariate analysis, that is, only the data in the spectrum ranges are subjected to the multivariate analysis.
- a model is obtained by performing a multivariate analysis such as a PLS regression analysis or a discriminant analysis using the data that have been set as a subject of the multivariate analysis. Since model coefficients obtained here are basically ones obtained based on the data in the spectrum ranges, correlation is made between sets of model coefficients corresponding to respective pairs of wavelengths and candidate fluorescent substances involved.
- An average of model coefficients corresponding to each candidate fluorescent substance serves as an index to be used for determining whether the candidate fluorescent substance contributes to obtaining a target value.
- model coefficients corresponding to each pair of wavelengths are important finally, an average of model coefficients is useful for evaluation of influence of interaction between components that occurs in a case that plural fluorescent substances are included. For example, in the case of a PLS regression analysis, a component an average of whose model coefficients is negative has no correlation with a target value. On the other hand, a component an average of whose model coefficients is positive has correlation with a target value.
- step S31 to perform a calculation on a measurement result of a sample, the model coefficients obtained at the multivariate analysis step S26 are read.
- sample measurement conditions are set. Basically, the sample measurement conditions are set the same as the standard measurement conditions. However, to shorten the measurement time, the excitation start wavelength, the excitation end wavelength, the excitation data interval, the fluorescence start wavelength, the fluorescence end wavelength, the fluorescence data interval, etc. that relate to the measurement wavelength ranges may be changed according to the measurement wavelength ranges that were selected at step S25 of the standard process.
- step S33 it is determined whether the pairs of an excitation wavelength and a fluorescence wavelength corresponding to the sets of model coefficients that were read at step S31 are included in the respective pairs of measurement wavelength ranges, and whether the wavelength scanning rate, the excitation-side slit width, the fluorescence-side slit width, the response setting value, and the detector voltage are the same as those of the standard measurement conditions. Since the measurement conditions influence the resolution and sensitivity and hence fluorescence intensity values, the measurement conditions other than the measurement wavelength ranges should not be changed. The determination step S33 is executed to equalize these sample measurement conditions to the corresponding standard measurement conditions, to avoid measurement errors.
- a sample table is set in advance for a sample to be subjected to measurement.
- a success/failure determination condition and determination value names may be determined.
- An example of the success/failure determination condition is a threshold value for a determination on a target value obtained by a multivariate analysis. Examples of the determination value names are "larger” indicating that a target value obtained is larger than the threshold value, "smaller” indicating that a target value obtained is smaller than the threshold value, "larger or smaller” indicating a destination item of a case that a target value obtained is the same as the threshold value.
- a 3D fluorescence spectrum of the sample is measured according to the sample table set at step S34.
- candidate fluorescent substances are determined according to the candidate fluorescent substance determining process shown in Figs. 3A-3D .
- a success/failure determination is made and a result is output.
- the 3D fluorescence spectrum and a result of determination of candidate fluorescent substances are displayed as shown in Fig. 10 .
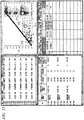
- a final measurement result of the entire process including the standard process and the sample process is displayed as shown in Fig. 11 .
- Information of the standard table that was set in the standard process is displayed in a top-left part of the screen.
- Values of the calculation that was performed using the model coefficients that were read at step S31 and results of success/failure determinations made according to the success/failure determination condition that was set in the sample table at step S34 are added to the sample table that was set in the sample process, and resulting information is displayed in a bottom-left part of the screen.
- a 3D fluorescence spectrum of an item selected from the standard information displayed in the top-left part or the sample information displayed in the bottom-left part is displayed in a top-right part of the screen.
- Displayed in a bottom-right part of the screen is a list of candidate fluorescent substances, obtained at step S24, of the item selected from the standard information displayed in the top-left part or a list of candidate fluorescent substances, obtained at step S36, of the item selected from the sample information displayed in the bottom-left part. Also displayed is an average of the model coefficients, calculated at step S26 in the standard process, of each candidate fluorescent substance. If a fluorescent substance other than the candidate fluorescent substances that were obtained in the standard process is obtained in the sample process, no average of model coefficients of that fluorescent substance is displayed.
- the peak wavelengths of the candidate fluorescent substances may be plotted so as to be recognizable, in the same manner as in the 3D fluorescence spectrum shown in Fig. 10 .
- the sub peak wavelengths may also be plotted so as to be recognizable. Spectrum ranges corresponding to contour line determination values "50" and "10" may further be displayed.
- the candidate fluorescent substance for a peak of attention can be recognized visually.
- its peak wavelengths and spectrum range may be highlighted for determination.
- Embodiment 2 fluorescent substances are identified using fluorescence characteristics of 3D fluorescence spectra of standards measured in the standard process.
- the sample is identified by executing the candidate fluorescent substance determining process shown in Figs. 3A-3D .
- sample process is executed without executing the standard process (see Fig. 9 ).
- Sample measurement conditions are set at step S32, a sample table is set at step S34 by inputting pieces of sample information, and a 3D fluorescence spectrum of the sample is measured at step S35 according to the conditions that were set at step S32.
- the candidate fluorescent substance determining process shown in Figs. 3A-3D which includes the peak selection step S11, the spectrum range selection step S12, and the sub peak selection step S13, is performed on a 3D fluorescence spectrum obtained, whereby pieces of fluorescence characteristic information are obtained.
- Candidate fluorescent substances are determined by collating obtained peak wavelengths, spectrum ranges, and pieces of sub peak information with a candidate fluorescent substance library. A sample containing the thus-determined candidate fluorescent substances is extracted from a candidate fluorescent sample library.
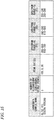
- a measurement target sample such as a food, a chemical material, or an environmental substance in many cases contains plural fluorescent substances and plural kinds of fluorescence characteristics may be obtained from a 3D fluorescence spectrum. Where plural kinds of fluorescence characteristics are obtained from a 3D fluorescence spectrum, as shown in Fig. 12 , determination of candidate fluorescent substances of an unknown sample and extraction of a candidate sample that were described above are performed repeatedly and candidate samples are thereby narrowed down. A candidate sample that exhibits an effective fluorescence characteristic is extracted finally from the candidate fluorescent sample library.
- an unknown sample determining instrument according to Embodiment 3 of the present disclosure will be described below with reference to Fig. 1 .
- the unknown sample determining instrument according to Embodiment 3 can be used suitably for the above-described unknown sample determining method, the measuring device used therein is not limited to the one described below.
- Fig. 1 shows a fluorescence spectrophotometer which includes a photometer unit 100, a computer unit 200, and an interface unit 300.
- An analyst inputs measurement conditions through an operating panel 32 of the interface unit 300.
- Continuous wave light emitted from a light source 1 is split by an excitation-side spectroscope 2 to produce excitation light, part of which is shone, via a beam splitter 3, on a measurement sample 6 that is mounted on a sample mounting stage 5.
- An excitation-side slit is included in the excitation-side spectroscope 2, and resolution of monochrome light that is extracted from white light is determined by setting a width of the slit.
- a light quantity of the part, separated by the beam splitter 3, of the excitation light is measured by a monitoring detector 4, whereby a variation in the light source 1 is corrected.
- Fluorescent light emitted from the sample 6 is split by a fluorescence-side spectroscope 7 to produce monochrome light, which is detected by a detector 8.
- a fluorescence-side slit is included in the fluorescence-side spectroscope 7, and resolution of monochrome light that is separated from fluorescent light is determined by setting a width of the slit.
- a signal detected by the detector 8 is received by a data processing unit 23 as a signal intensity via an A/D converter 21, and a measurement result is displayed on a monitor 31.
- An excitation-side pulse motor 12 is driven according to an instruction from a controller 22 and the excitation-side spectroscope 2 is thereby set at an intended wavelength.
- a fluorescence-side pulse motor 11 is driven according to an instruction from the controller 22 and the fluorescence-side spectroscope 7 is thereby set at an intended wavelength.
- Each of the excitation-side spectroscope 2 and the fluorescence-side spectroscope 7 employs such an optical element as a diffraction grating or a prism, and a spectrum scan is performed by rotating the optical element via gears and a cam using motive power produced by the excitation-side pulse motor 12 or the fluorescence-side pulse motor 11.
- An excitation-side filter 15 is disposed between the excitation-side spectroscope 2 and the measurement sample 6.
- One of plural cut filters is inserted into the optical path as the excitation-side filter 15 by an excitation-side filter pulse motor 13.
- a fluorescence-side filter 16 is disposed between the measurement sample 6 and the fluorescence-side spectroscope 7.
- One of plural cut filters is inserted into the optical path as the fluorescence-side filter 16 by a fluorescence-side filter pulse motor 14.
- a 3D fluorescence spectrum is measured in the following manner.
- excitation light emitted from the excitation-side spectroscope 2 that is set at a fixed wavelength is shone on the measurement sample 6, a fluorescence spectrum is measured as a wavelength scan is performed by the fluorescence-side spectroscope 7.
- the fluorescence wavelength is returned to a start wavelength, the excitation wavelength is changed by a prescribed wavelength interval, and a fluorescence spectrum is measured at the resulting excitation wavelength.
- Resulting fluorescence spectra are stored in three dimensions, that is, the excitation wavelength, the fluorescence wavelength, and the fluorescence intensity.
- the above operation is performed repeatedly until a fluorescence spectrum corresponding to a final wavelength of a prescribed excitation wavelength range, whereby a 3D fluorescence spectrum is obtained and displayed in the form of a contour diagram as shown in Fig. 2 .
- the fluorescence spectrophotometer shown in Fig. 1 is a monochrometer in which a wavelength scan of the fluorescence-side spectroscope 7 is performed by the fluorescence-side pulse motor 11 and monochromatic light is detected by the detector 8 such as a photomultiplier, it can be implemented as a polychrometer that does not include the fluorescence-side pulse motor 11 and employs, as the detector 8, an area detector such as a CCD.
- Fluorescence intensity values of a 3D fluorescence spectrum are shown with the vertical axis and the horizontal axis representing the excitation wavelength EX and the fluorescence wavelength EM, respectively.
- the vertical axis and the horizontal axis may represent the fluorescence wavelength and the excitation wavelength, respectively.
- the data processing unit 23 performs a 3D fluorescence spectrum measurement on a standard process shown in Fig. 9 that is registered in a standard table under measurement conditions that have been input through the operating panel 32, and determines candidate fluorescent substances using a measurement result.
- the data processing unit 23 causes the monitor 31 to display, as a 3D fluorescence spectrum measurement result, a contour diagram as shown in area (a) of Fig. 4 .
- a first peak that was selected at the peak selection step S11 shown in Figs. 3A-3D may be plotted in the form of a mark "o," for example, to facilitate its recognition.
- Trace lines b1-b2 and c1-c2 shown in area (a) of Fig. 4 may be drawn for the selected first peak.
- the trace line b1-b2 corresponds to an excitation spectrum to be obtained when the excitation wavelength is varied while the fluorescence wavelength is fixed. This excitation spectrum is displayed as shown in area (b) of Fig. 4 .
- the trace line c1-c2 of area (a) of Fig. 4 corresponds to a fluorescence spectrum to be obtained when the fluorescence wavelength is varied while the excitation wavelength is fixed. This excitation spectrum is displayed as shown in area (c) of Fig. 4 .
- the selected spectrum range is indicated by a broken line as shown in area (a) of Fig. 5 .
- Sub peaks that were selected at the sub peak selection step S 13 shown in Figs. 3A-3D may be plotted in the form of marks "o," for example, as shown in area (a) of Fig. 7 to facilitate its recognition.
- excitation wavelengths of part of the sub peaks indicated by marks "o" in area (a) of Fig. 7 are indicated by arrows, for example.
- a fluorescence wavelength of one of the sub peaks indicated by marks "o" in area (a) of Fig. 7 may be indicated by an arrow, for example.
- a first peak and sub peaks are plotted and a spectrum range is displayed for each of them.
- the data processing unit 23 searches for a candidate fluorescent substance according to the candidate fluorescent substance determining process shown in Figs. 3A-3D , and displays, on the monitor 31, results of the peak selection step S11, the spectrum range selection step S12, and the sub peak selection step S13 shown in Figs. 3A-3D and a list of candidate fluorescent substances.
- a table shown in Fig. 14 is displayed finally on the monitor 31 as analysis results of plural candidate fluorescent substances.
- the data processing unit 23 eliminates data other than data in spectrum ranges being set based on the contour line determination value from data to be subjected to a multivariate analysis, and selects only the data in the effective 3D fluorescence spectrum ranges are subjected to the multivariate analysis.
- the multivariate analysis including PLS regression analysis and discriminant analysis is performed using this data, and the model coefficients are obtained and stored in the data processing unit 23.
- the input measurement conditions of sample measurement includes excitation wavelength and fluorescence wavelength at the time of calculating model coefficients are within the measurement wavelength range and whether the input measurement conditions of sample measurement includes wavelength scanning rate, an excitation-side slit width, a fluorescence-side slit width, a response setting value, and a detector voltage that matches the measurement conditions being set in the condition setting step in the standard process.
- the measurement of the 3D fluorescence spectrum of the sample registered in the sample table is performed.
- the data processing unit 23 performs determination process of the candidate fluorescence substance using the 3D fluorescent spectrum measurement result of the sample and in accordance with the determination flow of the candidate fluorescence substance shown in Figs. 3A-3D .
- the information of the candidate fluorescent substance that is determined to have 3D fluorescent spectrum are displayed on the same screen of the monitor 31 as shown in Fig. 11 .
- the data processing unit 23 extracts a candidate fluorescent substance by collating, with the candidate fluorescent substance library, results obtained for a measured 3D fluorescence spectrum of an unknown measurement target sample whose determination information is not available, that is, an excitation wavelength and a fluorescence wavelength of a first peak selected at the peak selection step S11 of the fluorescent substance determining process shown in Figs. 3A-3D , spectrum ranges that were set for respective contour determination values at the spectrum range selection step S12, and the number of sub peaks, sub peak ratios, sub peak excitation wavelengths, and sub peak fluorescence wavelengths that were obtained at the sub peak selection step S13.
- sets of a peak wavelength, spectrum ranges, and pieces of sub peak information are sequentially collated with the candidate fluorescent sample library, whereby candidate fluorescent substances that satisfy the above sets of pieces of peak information are extracted.
- a sample containing the extracted candidate fluorescent substances is extracted from the candidate fluorescent sample library, and the 3D fluorescence spectrum and the sample table of the measurement target sample and the extracted candidate sample are displayed on the monitor 31.
- the unknown sample determining program according to the present disclosure is stored in the computer unit 200 of the unknown sample determining instrument (fluorescence spectrophotometer) according to the present disclosure, and is a program capable of executing the series of steps of Embodiment 2.
- This program determines a fluorescent substance(s) and a sample by causing the photometer unit 100 to irradiate excitation light on a measurement target sample and measure a fluorescence spectrum according to an instruction from the controller 22, causing the data processing unit 23 to store a measurement result in three dimensions, that is, the excitation wavelength, the fluorescence wavelength, and the fluorescence intensity, and determining a fluorescence characteristic based on the stored data.
- the program executes a standard process of causing the photometer unit 100 to perform measurements on standards whose determination information to become a target variable and a fluorescence characteristic such as density information are known in advance according to an instruction from the controller 22 and causing the data processing unit 23 to obtaining model coefficients for each pair of an excitation wavelength and a fluorescence wavelength by performing a multivariate analysis to determine an unknown sample, and a sample process of obtaining a target value of the unknown sample based on the model coefficients obtained by the standard process.
- the program causes setting, through the operating panel 32, of conditions under which to measure a 3D fluorescence spectrum of each standard by means of the photometer unit 100 by sending an instruction from the controller 22 to it.
- Wavelength range conditions are set that include an excitation start wavelength, an excitation end wavelength, an excitation data interval, a fluorescence start wavelength, a fluorescence end wavelength, and a fluorescence data interval.
- a condition that dictates a measurement speed is a wavelength scanning rate.
- Conditions that dictate resolution are an excitation-side slit width and a fluorescence-side slit width.
- a condition relating to a data response speed is a response setting value that relates to noise and resolution.
- a condition that determines sensitivity is a detector voltage.
- the program causes input, through the operating panel 32, of a sample name, information to become a target variable, and density information, and storage of them in the data processing unit 23.
- the program causes the photometer unit 100 measure a 3D fluorescence spectrum of each standard according to an instruction from the controller 22.
- the program stores a resulting 3D fluorescence spectrum of the standard in the data processing unit 23 in the form of 3D data, that is, excitation wavelengths, fluorescence wavelengths, and fluorescence intensity values, and causes the data processing unit 23 to determine candidate fluorescent substances according to the candidate substance determining process using the stored 3D fluorescence spectrum.
- Candidate fluorescent substances are determined by collating the fluorescence characteristic of the stored 3D fluorescence spectrum with a candidate fluorescent substance library.
- the program causes the monitor 31 to display together the 3D fluorescence spectrum and a result of determination of the candidate fluorescent substances extracted based on set peak wavelengths.
- the peak wavelengths of the candidate fluorescent substances are plotted in the 3D fluorescence spectrum so as to be recognizable.
- Sub peak wavelengths may also be plotted so as to be recognizable.
- Spectrum ranges corresponding to a contour line determination value "50" or "10” may also be displayed using a broken line or the like. Since the 3D fluorescence spectrum and the list of candidate fluorescent substances are displayed together, the candidate fluorescent substances for the respective peaks can be recognized visually. When one candidate fluorescent substance is selected, its peak wavelengths and spectrum range may be highlighted for determination.
- the program sets spectrum ranges corresponding to a set contour line determination value and sets wavelengths to be used for a multivariate analysis using only data attributed to respective components and stores them in the data processing unit 23, whereby unnecessary data other than data of effective fluorescence regions can be eliminated.
- the program causes the data processing unit 23 to calculate model coefficients by performing a multivariate analysis such as a PLS regression analysis or a discriminant analysis using the data that have been set as a subject of the multivariate analysis. Since the model coefficients obtained here are basically ones obtained based on the data in the spectrum ranges, correlation is made between sets of model coefficients corresponding to respective pairs of wavelengths and candidate fluorescent substances involved.
- a multivariate analysis such as a PLS regression analysis or a discriminant analysis
- the program causes the data processing unit 23 to read the model coefficients obtained at the multivariate analysis step S26.
- the program sets sample measurement conditions by receiving them through the operating panel 32 or select sample measurement conditions stored in the data processing unit 23. Basically, the sample measurement conditions are set the same as the standard measurement conditions. However, to shorten the measurement time, the excitation start wavelength, the excitation end wavelength, the excitation data interval, the fluorescence start wavelength, the fluorescence end wavelength, the fluorescence data interval, etc. that relate to the measurement wavelength ranges may be changed according to the measurement wavelength ranges that were selected at step S25 of the standard process.
- step S33 it is determined whether the pairs of an excitation wavelength and a fluorescence wavelength corresponding to the sets of model coefficients that were read at step S31 are included in the respective pairs of measurement wavelength ranges, and whether the wavelength scanning rate, the excitation-side slit width, the fluorescence-side slit width, the response setting value, and the detector voltage are the same as those of the standard measurement conditions. Since the thus-set measurement conditions influence the resolution and sensitivity and hence fluorescence intensity values, the measurement conditions other than the excitation wavelength range and the fluorescence wavelength range should not be changed.
- the determination step S33 is executed to determine whether these sample measurement conditions are equivalent to the corresponding standard measurement conditions, to avoid measurement errors.
- a sample table is set by the operating panel 32 in advance for a sample to be subjected to measurement.
- a success/failure determination condition and determination value names may be determined.
- the program causes the photometer unit 100 to measure a 3D fluorescence spectrum of the sample according to the sample table that was set at step S34 and according to an instruction from the controller 31 that are based on the thus-set measurement conditions.
- the program stores the measured 3D fluorescence spectrum in the data processing unit 23 in the form of 3D data, that is, excitation wavelengths, fluorescence wavelengths, and fluorescence intensity values, and determine candidate fluorescent substances according to the candidate fluorescent substance determining process shown in Figs. 3A-3D .
- the program causes the monitor 31 to display candidate fluorescent substance search results, that is, a 3D fluorescence spectrum and a result of determination of candidate fluorescent substances (see Fig. 10 ).
- the program causes the monitor 31 to display a final measurement result of the entire process including the standard process and the sample process in the form of a picture shown in Fig. 11 .
- Information of the standard table that was set in the standard process is displayed in a top-left part of the screen.
- Values of the calculation that was performed using the model coefficients that were read at step S31 and results of success/failure determinations made according to the success/failure determination condition that was set in the sample table at step S34 are displayed in a bottom-left part of the screen.
- a 3D fluorescence spectrum of an item selected from the standard information displayed in the top-left part or the sample information displayed in the bottom-left part is displayed in a top-right part of the screen.
- Displayed in a bottom-right part of the screen is a list of candidate fluorescent substances, obtained at step S24, of the item selected from the standard information displayed in the top-left part or a list of candidate fluorescent substances, obtained at step S36, of the item selected from the sample information displayed in the bottom-left part. Also displayed is an average of the model coefficients, calculated by the multivariate analysis at step S26 in the standard process, of each candidate fluorescent substance. If a fluorescent substance other than the candidate fluorescent substances that were obtained in the standard process is obtained in the sample process, no average of model coefficients of that fluorescent substance is displayed.
- the peak wavelengths and the sub peak wavelengths of the candidate fluorescent substances may be plotted so as to be recognizable, in the same manner as in the 3D fluorescence spectrum shown in Fig. 10 .
- Spectrum ranges corresponding to contour line determination values "50" and "10" may further be displayed using a broken line or the like. Since the list of candidate fluorescent substances and the 3D fluorescence spectrum are displayed on the same screen, the candidate fluorescent substance for a peak of attention can be recognized visually. When one candidate fluorescent substance is selected, its peak wavelengths and spectrum range may be highlighted for determination.
- the unknown sample determining program causes selection of an excitation wavelength and a fluorescence wavelength of a first peak of attention in a measured 3D fluorescence spectrum in, for example, the manner shown in Fig. 4 .
- the program causes the data processing unit 23 to identify fluorescent substances using the first peak and sub peaks appearing at the same fluorescence wavelength as the first peak does.
- the peak selection step S11 may be either such that a single peak is selected simply or such that an excitation wavelength range and a fluorescence wavelength range are set and an excitation wavelength and a fluorescence wavelength that provide a maximum intensity in these wavelength ranges are selected as peak wavelengths.
- An excitation wavelength range and a fluorescence wavelength range (e.g., ⁇ 5 nm) with respect to the peak wavelengths are also input through the operating panel 31 as search allowable ranges to be used in referring to a candidate fluorescent substance library.
- the program causes a determination as to whether the wavelength ranges of the first peak are within the input wavelength ranges. If the former are out of the latter, the program causes input of first peak wavelengths again.
- the program causes the data processing unit 23 to normalize the peak intensity of the selected first peak selected by itself to a prescribed value to facilitate data comparison.
- the program causes the data processing unit 23 to select a spectrum range corresponding to a region enclosed by a broken line in area (a) of Fig. 5 .
- a spectrum range is defined by an excitation wavelength range and a fluorescence wavelength range and is set for each contour line determination value, and information indicating it is stored in the data processing unit 23.
- the contour line determination value is a parameter that is specified by a measurer and indicates a threshold value for extraction of intensity data from a 3D fluorescence spectrum. For example, where the contour line determination value is set at "10,” a spectrum range corresponding to an intensity "10" with respect to the normalized intensity "100" of the first peak that was set at the peak selection step S11 is searched for.
- a target area is set that is defined by an excitation wavelength range and a fluorescence wavelength range. Widest wavelength ranges of a closed contour line that connects the same fluorescence intensity values are set. Then it is determined whether the thus-set spectrum range is included in measurement wavelength ranges. If the spectrum range is out of the measurement wavelength ranges, another spectrum range is set.
- the program causes the data processing unit 23 to perform proximate peaks determination processing.
- the program causes the data processing unit 23 to set sub peak wavelengths as shown in area (a) of Fig. 7 (a range enclosed by a broken line) and areas (b) and (c) of Fig. 7 .
- Sub peaks may be set either automatically by setting an intensity threshold value and extracting peaks that exceed the threshold value or manually by an operator.
- the program causes the data processing unit 23 to extract a candidate fluorescent substance through collation with the candidate fluorescent substance library that is prepared in advance.
- the candidate fluorescent substance library is a library of fluorescent substances produced by performing, in advance, measurements on fluorescent substances to become candidates, and contains, for each fluorescent substance, a peak excitation wavelength range and a peak fluorescence wavelength range that were obtained at the peak selection step S11, spectrum ranges that were set for respective contour line determination values at the spectrum range selection step S12, and the number of sub peaks, sub peak ratios, sub peak excitation wavelengths EX, and sub peak fluorescence wavelengths EM that were obtained at the sub peak selection step S13.
- Measurement data are compared with the candidate fluorescent substance library in each process, whereby a candidate fluorescent substance is determined from the fluorescent substances contained in the candidate fluorescent substance library.
- the program causes the monitor 31 to display results obtained at the peak selection step S11, the spectrum range selection step S12, and the sub peak selection step S 13 of each process in the form of a list. More specifically, the list contains peak wavelengths of a first peak that was specified at the peak selection step S11, a spectrum range (spectrum range-50) corresponding to a contour line determination value "50" and a spectrum range (spectrum range-10) corresponding to a contour line determination value "10" that were obtained at the spectrum range selection step S12, and sub peak information that was obtained at the sub peak selection step S13, that is, the number of sub peaks, sub peak ratios, sub peak excitation wavelengths EX, and sub peak fluorescence wavelengths EM.
- the program causes the monitor 31 to display a result of determination, from the candidate fluorescent substance library, of a candidate fluorescent substance that satisfies the above conditions in the form of a candidate fluorescent substance list.
- the program causes the data processing unit 23 to select another first peak at the peak selection step S11 and determine a candidate fluorescent substance corresponding to peaks selected at the spectrum range selection step S12 and the sub peak selection step S13. Fluorescent substances are thus identified sequentially.
- fluorescent substances are identified using fluorescence characteristics of 3D fluorescence spectra of standards measured in the standard process.
- the sample is identified by executing the candidate fluorescent substance determining process shown in Figs. 3A-3D .
- sample process is executed without executing the standard process (see Fig. 9 ).
- Sample measurement conditions are set at step S32, a sample table is set at step S34 by inputting pieces of sample information, and a 3D fluorescence spectrum of the sample is measured at step S35 according to the conditions that were set at step S32.
- the candidate fluorescent substance determining process shown in Figs. 3A-3D which includes the peak selection step S11, the spectrum range selection step S12, and the sub peak selection step S13, is performed on the 3D fluorescence spectrum obtained, whereby pieces of fluorescence characteristic information are obtained.
- Candidate fluorescent substances are determined by collating obtained peak wavelengths, spectrum ranges, and pieces of sub peak information with the candidate fluorescent substance library. A sample containing the thus-determined candidate fluorescent substances is extracted from the candidate fluorescent sample library.
- a measurement target sample such as a food, a chemical material, or an environmental substance in many cases contains plural fluorescent substances and plural kinds of fluorescence characteristics may be obtained from a 3D fluorescence spectrum. Where plural kinds of fluorescence characteristics are obtained from a 3D fluorescence spectrum, as shown in Fig. 12 , determination of candidate fluorescent substances of an unknown sample and extraction of a candidate sample that were described above are performed repeatedly and candidate samples are thereby narrowed down. A candidate sample that exhibits an effective fluorescence characteristic is extracted finally from the candidate fluorescent substance library.
- the unknown sample determining method, the unknown sample determining instrument, and the unknown sample determining program that, in analysis techniques of performing a multivariate analysis on 3D fluorescence spectrum data, are capable to identify fluorescent substances corresponding to peaks of a 3D fluorescence spectrum of a sample and display their list and can also be applied to identification and same/different determination of the sample itself that are made based on identification results of fluorescent substances corresponding to plural respective peaks.
- the use of these method, instrument, and program can also provide advantages of increase of the accuracy of a multivariate analysis and shortening of its execution time.
Landscapes
- Physics & Mathematics (AREA)
- Spectroscopy & Molecular Physics (AREA)
- General Physics & Mathematics (AREA)
- Health & Medical Sciences (AREA)
- Engineering & Computer Science (AREA)
- Chemical & Material Sciences (AREA)
- Biochemistry (AREA)
- General Health & Medical Sciences (AREA)
- Analytical Chemistry (AREA)
- Immunology (AREA)
- Pathology (AREA)
- Life Sciences & Earth Sciences (AREA)
- Human Computer Interaction (AREA)
- Nuclear Medicine, Radiotherapy & Molecular Imaging (AREA)
- Mathematical Physics (AREA)
- Theoretical Computer Science (AREA)
- Investigating, Analyzing Materials By Fluorescence Or Luminescence (AREA)
Applications Claiming Priority (1)
| Application Number | Priority Date | Filing Date | Title |
|---|---|---|---|
| JP2016186207A JP6831094B2 (ja) | 2016-09-06 | 2016-09-06 | 未知試料判定方法、未知試料判定装置及び未知試料判定プログラム |
Publications (3)
| Publication Number | Publication Date |
|---|---|
| EP3290908A1 true EP3290908A1 (de) | 2018-03-07 |
| EP3290908B1 EP3290908B1 (de) | 2023-12-20 |
| EP3290908B8 EP3290908B8 (de) | 2024-01-24 |
Family
ID=59811127
Family Applications (1)
| Application Number | Title | Priority Date | Filing Date |
|---|---|---|---|
| EP17189696.2A Active EP3290908B8 (de) | 2016-09-06 | 2017-09-06 | Verfahren zur bestimmung einer unbekannten probe |
Country Status (3)
| Country | Link |
|---|---|
| US (1) | US10718713B2 (de) |
| EP (1) | EP3290908B8 (de) |
| JP (1) | JP6831094B2 (de) |
Cited By (1)
| Publication number | Priority date | Publication date | Assignee | Title |
|---|---|---|---|---|
| CN109444071A (zh) * | 2018-12-14 | 2019-03-08 | 江苏东交工程检测股份有限公司 | 基于分波段的沥青红外光谱质量检测方法和装置 |
Families Citing this family (4)
| Publication number | Priority date | Publication date | Assignee | Title |
|---|---|---|---|---|
| WO2020053919A1 (ja) * | 2018-09-10 | 2020-03-19 | 日本たばこ産業株式会社 | 蛍光指紋分析を利用した処理原料中のTSNAs定量方法、プログラム及び装置 |
| JP2022061391A (ja) * | 2020-10-06 | 2022-04-18 | オリンパス株式会社 | 実験支援装置、実験支援システム、実験支援方法、プログラム |
| CN113418896B (zh) * | 2021-05-18 | 2023-01-10 | 中国农业大学 | 一种用于在线高通量检测玉米籽粒中黄曲霉毒素的方法 |
| JP2024009542A (ja) * | 2022-07-11 | 2024-01-23 | 株式会社日立ハイテクサイエンス | 分光分析システム及び分光分析方法 |
Citations (3)
| Publication number | Priority date | Publication date | Assignee | Title |
|---|---|---|---|---|
| JPS5856741B2 (ja) | 1979-11-27 | 1983-12-16 | 学校法人 岐阜歯科大学 | 歯科充填材料としての水銀アマルガム用金属混合粉末 |
| WO2012074413A1 (en) * | 2010-11-29 | 2012-06-07 | Comvita New Zealand Limited | A method and apparatus that utilises fluorescence to determine plant or botanical origin characteristics of honey |
| JP2016045179A (ja) | 2014-08-26 | 2016-04-04 | 国立研究開発法人農業・食品産業技術総合研究機構 | チーズの熟成度指標推定方法、チーズの熟成度指標推定装置、コンピュータが実行可能なプログラム、ナチュラルチーズ、プロセスチーズ、及びプロセスチーズの製造方法 |
Family Cites Families (8)
| Publication number | Priority date | Publication date | Assignee | Title |
|---|---|---|---|---|
| US7015484B2 (en) * | 2001-04-16 | 2006-03-21 | Dakota Technologies, Inc. | Multi-dimensional fluorescence apparatus and method for rapid and highly sensitive quantitative analysis of mixtures |
| US20030215791A1 (en) * | 2002-05-20 | 2003-11-20 | Applied Spectral Imaging Ltd. | Method of and system for multiplexed analysis by spectral imaging |
| GB0719373D0 (en) * | 2007-10-04 | 2007-11-14 | Univ Cranfield | Optical multisensor |
| JP5856741B2 (ja) | 2011-02-25 | 2016-02-10 | 国立研究開発法人農業・食品産業技術総合研究機構 | アフラトキシン定量方法、アフラトキシン定量装置、および、プログラム |
| US8901513B2 (en) * | 2011-03-08 | 2014-12-02 | Horiba Instruments, Incorporated | System and method for fluorescence and absorbance analysis |
| US8913240B2 (en) * | 2011-09-30 | 2014-12-16 | Shimadzu Corporation | Fluorescence spectrophotometer |
| JP5974559B2 (ja) * | 2012-03-14 | 2016-08-23 | 株式会社リコー | 感光体及びその製造方法 |
| WO2013190618A1 (ja) * | 2012-06-18 | 2013-12-27 | 株式会社島津製作所 | 分光蛍光光度計 |
-
2016
- 2016-09-06 JP JP2016186207A patent/JP6831094B2/ja active Active
-
2017
- 2017-09-06 US US15/696,392 patent/US10718713B2/en active Active
- 2017-09-06 EP EP17189696.2A patent/EP3290908B8/de active Active
Patent Citations (3)
| Publication number | Priority date | Publication date | Assignee | Title |
|---|---|---|---|---|
| JPS5856741B2 (ja) | 1979-11-27 | 1983-12-16 | 学校法人 岐阜歯科大学 | 歯科充填材料としての水銀アマルガム用金属混合粉末 |
| WO2012074413A1 (en) * | 2010-11-29 | 2012-06-07 | Comvita New Zealand Limited | A method and apparatus that utilises fluorescence to determine plant or botanical origin characteristics of honey |
| JP2016045179A (ja) | 2014-08-26 | 2016-04-04 | 国立研究開発法人農業・食品産業技術総合研究機構 | チーズの熟成度指標推定方法、チーズの熟成度指標推定装置、コンピュータが実行可能なプログラム、ナチュラルチーズ、プロセスチーズ、及びプロセスチーズの製造方法 |
Non-Patent Citations (3)
| Title |
|---|
| FOODS AND TABLEWARE, vol. 54, no. 5, 2013 |
| GAMAL ELMASRY ET AL: "Non-invasive sensing of freshness indices of frozen fish and fillets using pretreated excitation-emission matrices", SENSORS AND ACTUATORS B: CHEMICAL: INTERNATIONAL JOURNAL DEVOTED TO RESEARCH AND DEVELOPMENT OF PHYSICAL AND CHEMICAL TRANSDUCERS, vol. 228, 12 January 2016 (2016-01-12), NL, pages 237 - 250, XP055438914, ISSN: 0925-4005, DOI: 10.1016/j.snb.2016.01.032 * |
| LU F ET AL: "Dissolved organic matter with multi-peak fluorophores in landfill leachate", CHEMOSPHERE, PERGAMON PRESS, OXFORD, GB, vol. 74, no. 4, 4 November 2009 (2009-11-04), pages 575 - 582, XP025846496, ISSN: 0045-6535, [retrieved on 20081104], DOI: 10.1016/J.CHEMOSPHERE.2008.09.060 * |
Cited By (1)
| Publication number | Priority date | Publication date | Assignee | Title |
|---|---|---|---|---|
| CN109444071A (zh) * | 2018-12-14 | 2019-03-08 | 江苏东交工程检测股份有限公司 | 基于分波段的沥青红外光谱质量检测方法和装置 |
Also Published As
| Publication number | Publication date |
|---|---|
| US10718713B2 (en) | 2020-07-21 |
| EP3290908B1 (de) | 2023-12-20 |
| JP6831094B2 (ja) | 2021-02-17 |
| US20180067048A1 (en) | 2018-03-08 |
| EP3290908B8 (de) | 2024-01-24 |
| JP2018040779A (ja) | 2018-03-15 |
Similar Documents
| Publication | Publication Date | Title |
|---|---|---|
| US10718713B2 (en) | Unknown sample determining method, unknown sample determining instrument, and unknown sample determining program | |
| EP2710353B1 (de) | Spektroskopievorrichtung und verfahren zur bestimmung der in einer probe vorkommenden komponenten | |
| US9383308B2 (en) | Multi-component regression/multi-component analysis of time series files | |
| EP2976620B1 (de) | System und verfahren zur durchführung von untersuchungen mittels einer kombination von libs und infrarot-absorptionsspektroskopie | |
| EP2245443B1 (de) | Schnelle spektrenzuordnung, insbesondere für spektren von substanzen, die aus mehreren komponenten bestehen | |
| JP5131211B2 (ja) | 発光分光分析装置 | |
| CN101995395A (zh) | 一种激光诱导多种光谱联合指纹网络在线检测材料的方法 | |
| CN110702663A (zh) | 一种冷冻肉品贮藏时间的无损快速检测方法 | |
| EP2366991A1 (de) | Probabilistische Bewertung für Komponenten einer Mischung | |
| CN109001182A (zh) | 封闭容器中酒精含量的拉曼光谱无损测定方法 | |
| CN116026808A (zh) | 一种拉曼光谱判别方法和系统 | |
| KR101951758B1 (ko) | 라만 분광을 이용한 지방 혼합물 내의 돼지 지방 정량 분석 방법 및 장치 | |
| US20220252516A1 (en) | Spectroscopic apparatus and methods for determining components present in a sample | |
| CN112673250B (zh) | 利用荧光指纹分析的处理原料中的TSNAs定量方法、程序以及装置 | |
| AU2019100481A4 (en) | Quick and nondestructive cubilose authenticity discrimination method | |
| CN113791062A (zh) | 一种基于拉曼光谱判断固定物质类别的方法 | |
| CN112666094A (zh) | 一种常见毒素识别系统及方法 | |
| CN110582692B (zh) | 荧光分光光度计、分光测定方法以及荧光分光光度计用控制软件 | |
| WO2018158801A1 (ja) | スペクトルデータの特徴抽出装置および方法 | |
| JP6244492B1 (ja) | スペクトルの判定装置および判定方法 | |
| Stefas | Laser induced breakdown spectroscopy assisted by machine learning for the classification/authentication of food products: the case of olive oil | |
| CN115753638A (zh) | 一种土地成分分析系统 | |
| Lyons et al. | Structural Interpretation of Fluorescence Spectra by Automated File Searching: Implementation and Applications in Liquid Chromatography | |
| Downes | CRC |
Legal Events
| Date | Code | Title | Description |
|---|---|---|---|
| PUAI | Public reference made under article 153(3) epc to a published international application that has entered the european phase |
Free format text: ORIGINAL CODE: 0009012 |
|
| STAA | Information on the status of an ep patent application or granted ep patent |
Free format text: STATUS: THE APPLICATION HAS BEEN PUBLISHED |
|
| AK | Designated contracting states |
Kind code of ref document: A1 Designated state(s): AL AT BE BG CH CY CZ DE DK EE ES FI FR GB GR HR HU IE IS IT LI LT LU LV MC MK MT NL NO PL PT RO RS SE SI SK SM TR |
|
| AX | Request for extension of the european patent |
Extension state: BA ME |
|
| STAA | Information on the status of an ep patent application or granted ep patent |
Free format text: STATUS: REQUEST FOR EXAMINATION WAS MADE |
|
| 17P | Request for examination filed |
Effective date: 20180907 |
|
| RBV | Designated contracting states (corrected) |
Designated state(s): AL AT BE BG CH CY CZ DE DK EE ES FI FR GB GR HR HU IE IS IT LI LT LU LV MC MK MT NL NO PL PT RO RS SE SI SK SM TR |
|
| STAA | Information on the status of an ep patent application or granted ep patent |
Free format text: STATUS: EXAMINATION IS IN PROGRESS |
|
| 17Q | First examination report despatched |
Effective date: 20210429 |
|
| STAA | Information on the status of an ep patent application or granted ep patent |
Free format text: STATUS: EXAMINATION IS IN PROGRESS |
|
| GRAP | Despatch of communication of intention to grant a patent |
Free format text: ORIGINAL CODE: EPIDOSNIGR1 |
|
| STAA | Information on the status of an ep patent application or granted ep patent |
Free format text: STATUS: GRANT OF PATENT IS INTENDED |
|
| RIC1 | Information provided on ipc code assigned before grant |
Ipc: G01J 3/28 20060101ALN20230628BHEP Ipc: G01J 3/02 20060101ALI20230628BHEP Ipc: G01J 3/44 20060101ALI20230628BHEP Ipc: G01J 1/02 20060101ALI20230628BHEP Ipc: G01N 21/27 20060101ALI20230628BHEP Ipc: G01N 21/64 20060101AFI20230628BHEP |
|
| INTG | Intention to grant announced |
Effective date: 20230713 |
|
| GRAS | Grant fee paid |
Free format text: ORIGINAL CODE: EPIDOSNIGR3 |
|
| GRAA | (expected) grant |
Free format text: ORIGINAL CODE: 0009210 |
|
| STAA | Information on the status of an ep patent application or granted ep patent |
Free format text: STATUS: THE PATENT HAS BEEN GRANTED |
|
| AK | Designated contracting states |
Kind code of ref document: B1 Designated state(s): AL AT BE BG CH CY CZ DE DK EE ES FI FR GB GR HR HU IE IS IT LI LT LU LV MC MK MT NL NO PL PT RO RS SE SI SK SM TR |
|
| REG | Reference to a national code |
Ref country code: GB Ref legal event code: FG4D |
|
| RAP4 | Party data changed (patent owner data changed or rights of a patent transferred) |
Owner name: HITACHI HIGH-TECH SCIENCE CORPORATION |
|
| RIN2 | Information on inventor provided after grant (corrected) |
Inventor name: KOZUMA, MICHINARI Inventor name: HOSEN, YUSUKE Inventor name: SATO, YOICHI Inventor name: NAKAMURA, KOICHI Inventor name: HORIGOME, JUN |
|
| REG | Reference to a national code |
Ref country code: DE Ref legal event code: R096 Ref document number: 602017077649 Country of ref document: DE |
|
| REG | Reference to a national code |
Ref country code: CH Ref legal event code: PK Free format text: BERICHTIGUNG B8 Ref country code: CH Ref legal event code: EP |
|
| REG | Reference to a national code |
Ref country code: IE Ref legal event code: FG4D |
|
| PG25 | Lapsed in a contracting state [announced via postgrant information from national office to epo] |
Ref country code: GR Free format text: LAPSE BECAUSE OF FAILURE TO SUBMIT A TRANSLATION OF THE DESCRIPTION OR TO PAY THE FEE WITHIN THE PRESCRIBED TIME-LIMIT Effective date: 20240321 |
|
| REG | Reference to a national code |
Ref country code: LT Ref legal event code: MG9D |
|
| PG25 | Lapsed in a contracting state [announced via postgrant information from national office to epo] |
Ref country code: LT Free format text: LAPSE BECAUSE OF FAILURE TO SUBMIT A TRANSLATION OF THE DESCRIPTION OR TO PAY THE FEE WITHIN THE PRESCRIBED TIME-LIMIT Effective date: 20231220 |
|
| REG | Reference to a national code |
Ref country code: NL Ref legal event code: MP Effective date: 20231220 |
|
| PG25 | Lapsed in a contracting state [announced via postgrant information from national office to epo] |
Ref country code: ES Free format text: LAPSE BECAUSE OF FAILURE TO SUBMIT A TRANSLATION OF THE DESCRIPTION OR TO PAY THE FEE WITHIN THE PRESCRIBED TIME-LIMIT Effective date: 20231220 |
|
| PG25 | Lapsed in a contracting state [announced via postgrant information from national office to epo] |
Ref country code: LT Free format text: LAPSE BECAUSE OF FAILURE TO SUBMIT A TRANSLATION OF THE DESCRIPTION OR TO PAY THE FEE WITHIN THE PRESCRIBED TIME-LIMIT Effective date: 20231220 Ref country code: GR Free format text: LAPSE BECAUSE OF FAILURE TO SUBMIT A TRANSLATION OF THE DESCRIPTION OR TO PAY THE FEE WITHIN THE PRESCRIBED TIME-LIMIT Effective date: 20240321 Ref country code: FI Free format text: LAPSE BECAUSE OF FAILURE TO SUBMIT A TRANSLATION OF THE DESCRIPTION OR TO PAY THE FEE WITHIN THE PRESCRIBED TIME-LIMIT Effective date: 20231220 Ref country code: ES Free format text: LAPSE BECAUSE OF FAILURE TO SUBMIT A TRANSLATION OF THE DESCRIPTION OR TO PAY THE FEE WITHIN THE PRESCRIBED TIME-LIMIT Effective date: 20231220 Ref country code: BG Free format text: LAPSE BECAUSE OF FAILURE TO SUBMIT A TRANSLATION OF THE DESCRIPTION OR TO PAY THE FEE WITHIN THE PRESCRIBED TIME-LIMIT Effective date: 20240320 |
|
| REG | Reference to a national code |
Ref country code: AT Ref legal event code: MK05 Ref document number: 1642867 Country of ref document: AT Kind code of ref document: T Effective date: 20231220 |
|
| PG25 | Lapsed in a contracting state [announced via postgrant information from national office to epo] |
Ref country code: NL Free format text: LAPSE BECAUSE OF FAILURE TO SUBMIT A TRANSLATION OF THE DESCRIPTION OR TO PAY THE FEE WITHIN THE PRESCRIBED TIME-LIMIT Effective date: 20231220 |