EP3114458B1 - Methods for diagnosing a fluidics system - Google Patents
Methods for diagnosing a fluidics system Download PDFInfo
- Publication number
- EP3114458B1 EP3114458B1 EP15703722.7A EP15703722A EP3114458B1 EP 3114458 B1 EP3114458 B1 EP 3114458B1 EP 15703722 A EP15703722 A EP 15703722A EP 3114458 B1 EP3114458 B1 EP 3114458B1
- Authority
- EP
- European Patent Office
- Prior art keywords
- data
- channel
- data collection
- collection time
- time window
- Prior art date
- Legal status (The legal status is an assumption and is not a legal conclusion. Google has not performed a legal analysis and makes no representation as to the accuracy of the status listed.)
- Active
Links
Images


Classifications
-
- G—PHYSICS
- G01—MEASURING; TESTING
- G01N—INVESTIGATING OR ANALYSING MATERIALS BY DETERMINING THEIR CHEMICAL OR PHYSICAL PROPERTIES
- G01N15/00—Investigating characteristics of particles; Investigating permeability, pore-volume or surface-area of porous materials
- G01N15/10—Investigating individual particles
- G01N15/1012—Calibrating particle analysers; References therefor
-
- G—PHYSICS
- G01—MEASURING; TESTING
- G01N—INVESTIGATING OR ANALYSING MATERIALS BY DETERMINING THEIR CHEMICAL OR PHYSICAL PROPERTIES
- G01N15/00—Investigating characteristics of particles; Investigating permeability, pore-volume or surface-area of porous materials
- G01N15/10—Investigating individual particles
- G01N15/14—Optical investigation techniques, e.g. flow cytometry
- G01N15/1404—Handling flow, e.g. hydrodynamic focusing
-
- G—PHYSICS
- G01—MEASURING; TESTING
- G01N—INVESTIGATING OR ANALYSING MATERIALS BY DETERMINING THEIR CHEMICAL OR PHYSICAL PROPERTIES
- G01N15/00—Investigating characteristics of particles; Investigating permeability, pore-volume or surface-area of porous materials
- G01N15/10—Investigating individual particles
- G01N15/14—Optical investigation techniques, e.g. flow cytometry
- G01N15/1429—Signal processing
-
- G—PHYSICS
- G01—MEASURING; TESTING
- G01N—INVESTIGATING OR ANALYSING MATERIALS BY DETERMINING THEIR CHEMICAL OR PHYSICAL PROPERTIES
- G01N15/00—Investigating characteristics of particles; Investigating permeability, pore-volume or surface-area of porous materials
- G01N15/10—Investigating individual particles
- G01N15/14—Optical investigation techniques, e.g. flow cytometry
- G01N15/1434—Optical arrangements
-
- G—PHYSICS
- G01—MEASURING; TESTING
- G01N—INVESTIGATING OR ANALYSING MATERIALS BY DETERMINING THEIR CHEMICAL OR PHYSICAL PROPERTIES
- G01N15/00—Investigating characteristics of particles; Investigating permeability, pore-volume or surface-area of porous materials
- G01N15/10—Investigating individual particles
- G01N15/14—Optical investigation techniques, e.g. flow cytometry
- G01N15/1456—Optical investigation techniques, e.g. flow cytometry without spatial resolution of the texture or inner structure of the particle, e.g. processing of pulse signals
- G01N15/1459—Optical investigation techniques, e.g. flow cytometry without spatial resolution of the texture or inner structure of the particle, e.g. processing of pulse signals the analysis being performed on a sample stream
-
- G—PHYSICS
- G01—MEASURING; TESTING
- G01N—INVESTIGATING OR ANALYSING MATERIALS BY DETERMINING THEIR CHEMICAL OR PHYSICAL PROPERTIES
- G01N15/00—Investigating characteristics of particles; Investigating permeability, pore-volume or surface-area of porous materials
- G01N15/10—Investigating individual particles
- G01N15/1012—Calibrating particle analysers; References therefor
- G01N2015/1014—Constitution of reference particles
-
- G—PHYSICS
- G01—MEASURING; TESTING
- G01N—INVESTIGATING OR ANALYSING MATERIALS BY DETERMINING THEIR CHEMICAL OR PHYSICAL PROPERTIES
- G01N15/00—Investigating characteristics of particles; Investigating permeability, pore-volume or surface-area of porous materials
- G01N15/10—Investigating individual particles
- G01N2015/1026—Recognising analyser failures, e.g. bubbles; Quality control for particle analysers
-
- G—PHYSICS
- G01—MEASURING; TESTING
- G01N—INVESTIGATING OR ANALYSING MATERIALS BY DETERMINING THEIR CHEMICAL OR PHYSICAL PROPERTIES
- G01N15/00—Investigating characteristics of particles; Investigating permeability, pore-volume or surface-area of porous materials
- G01N15/10—Investigating individual particles
- G01N2015/1027—Determining speed or velocity of a particle
-
- G—PHYSICS
- G01—MEASURING; TESTING
- G01N—INVESTIGATING OR ANALYSING MATERIALS BY DETERMINING THEIR CHEMICAL OR PHYSICAL PROPERTIES
- G01N15/00—Investigating characteristics of particles; Investigating permeability, pore-volume or surface-area of porous materials
- G01N15/10—Investigating individual particles
- G01N15/14—Optical investigation techniques, e.g. flow cytometry
- G01N15/1434—Optical arrangements
- G01N2015/1438—Using two lasers in succession
Definitions
- the present disclosure generally relates to fluidic systems in the field of flow cytometry and more specifically to systems and methods for diagnosing fluidics failures and setting data acquisition and analysis settings.
- Flow cytometry is a powerful tool used for analysis of particles and cells in a myriad of applications primarily in bioscience research and medicine.
- the analytical strength of the technique is in its ability to parade single particles (including bioparticles such as cells, bacteria and viruses) through the focused spot of light sources, typically a laser or lasers, in rapid succession, at rates up to tens of thousands of particles per second.
- the high photon flux at this focal spot produces scatter of light by a particle and or emission of light from the particle or labels attached to the particle that can be collected and analyzed. This gives the user a wealth of information about individual particles that can be quicklybogyed into statistical information about populations of particles or cells.
- WO 2013/028947 A1 discloses an apparatus and methods for detecting and characterizing motion-related error of moving micro-entities.
- a data acquisition system may be configured such that a passing of a single micro-entity through a selected "trigger" interrogation point (e.g., a first interrogation point having a beam) triggers a timing sequence that "opens" or selects narrow data acquisition windows (e.g., selects segments of data streams from each of the interrogation points) precisely as the micro-entity is expected to arrive at each of the other interrogation points.
- a micro-entity or calibration bead travels along a stream, it crosses interrogation beams that are present in the stream.
- the system may comprise detectors and each of the detectors in the system may output a stream of data comprising samples of signals produced by micro-entities crossing a respective interrogation beam. Scattered or fluorescent radiation may be detected with the detectors, which may generate an electrical signal representative of the detected radiation. Time-varying signals from the detectors may be collected, e.g., digitally sampled with data acquisition hardware that may be clocked by an analog-to- digital converter clock, and stored in memory for subsequent analysis by processor. In some implementations of WO 2013/028947 A1 , the data is stored temporarily in memory, e.g., in a buffer or a suitable random access device, and then read out by the processor for analysis.
- all data received from the interrogation point detectors may be temporarily stored to a memory, e.g., a FIFO or ring buffer memory.
- Processor may be configured to select data segments from each detector data stream based upon the timing of a trigger event with respect to the drop clock, e.g., based upon a measured value for time offset or drop clock phase.
- observation windows are sized so that the majority of pulses generated by micro-entities at the corresponding interrogation point are captured and are discernible within the observation window.
- the observation windows are sized so that a desired fraction of pulses generated by micro- entities at the corresponding interrogation point are captured within the observation window.
- the observation window may be sized to be a first value that is proportional to an average width of the pulses, plus a second value that is proportional to the standard deviation.
- particles are flowed through the focused interrogation point where a laser directs a laser beam to a focused point that includes the core diameter within the channel.
- the sample fluid containing particles is focused to a very small core diameter of around 5-50 microns by flowing sheath fluid around the sample stream at a very high volumetric rate on the order of 100-1000 times the volumetric rate of the sample. This results in very fast linear velocities for the focused particles on the order of meters per second. This in turn means that each particle spends a very limited time in the excitation spot, often only 1-10 microseconds.
- Subsystems that can fail in a flow cytometer can include optics, electronics, and fluidics either independently or collectively.
- flow cytometry data acquisition and/or diagnostics software comes with a mode for measuring the immediate system performance and comparing it with a previous day(s) performance.
- These performance tests often use a cocktail of beads with known fluorescent characteristics.
- the performance test will use these beads to make a series of measurements including coefficient of variation of a population of 'bright' fluorescent beads, optical background, and quantum efficiency of the detection channel. By monitoring these values and how they change, it can be determined when an instrument is no longer functioning within specification and should be serviced.
- the person servicing the instrument may run tests on the optics, electronics, and fluidics; the failure mode is then determined through process of elimination or isolation of variables.
- Flow cytometers with multiple laser beams are especially sensitive to pressure fluctuations within the fluid delivery system with fluctuations well below 1% of the total operating pressure causing coefficient of variation broadening in the optical data. In this situation a person would be called to fix the coefficient of variation broadening in the optical data and the testing begins at the optical and electronic interfaces.
- a method for determining data processing settings for a flow cytometer can include passing a set of calibration particles through a flow cell.
- the method can include illuminating each of the set of calibration particles passing through the flow cell with at least two light beams wherein each light beam is associated with a channel.
- the method can include collecting light emitted from each of the set of calibration particles using a detector associated with each channel.
- the method can include recording data from each detector.
- the method can include setting a trigger channel to initiate a transfer of data from a first data collection time window associated with the trigger channel when a data signal threshold for the trigger channel is exceeded.
- the method can include setting a second channel to transfer data from a second data collection time window associated with the second channel when the data signal threshold for the trigger channel is exceeded, and wherein the start of the second data collection time window is based on a spatial path between the trigger channel and the second channel.
- the method can include recording data from the first data collection time window to a data store each time the data signal threshold is exceeded.
- the method can include recording data from the second data collection time window to the data store each time the data signal threshold for the trigger channel is exceeded.
- the method can include analyzing a distribution of data intensity peak times within the second data collection time window.
- the method can include calculating a time delay based on the distribution of data intensity peak times in the second data collection time window to position a data signal in the second channel in the second data collection time window.
- the method can include the light emitted being fluorescent.
- the method can include the light emitted being scattered.
- the method can include the start of the second data collection time window is based on a flow rate.
- the method can include the start of the second data collection time window is based on a sheath fluid flow rate.
- the method can include the spatial path being between about 80 to 250 micrometers.
- the method can include the spatial path being about 150 micrometers.
- the method can include the data collection time windows being between about 80 to about 120 ADC points wide.
- the method can include the data collection time windows being between about 320 to about 360 ADC points wide.
- a system to determine data processing settings for a flow cytometer can include a flow cell configured to flow calibration particles.
- the system can include at least two light sources each configured to emit a light beam, wherein each light beam is associated with a channel and, wherein the light beams pass through the flow cell.
- the system can include a detector associated with each channel wherein each detector can be configured to collect light emitted from each of the set of calibration beads.
- the system can include a memory buffer configured to record data from each of the detectors.
- the system can include a trigger channel configured to initiate a transfer of data from a first data collection time window associated with the trigger channel when a data signal threshold for the trigger channel is exceeded.
- the system can include a second channel configured to transfer data from a second data collection time window associated with the second channel when the data signal threshold for the trigger channel is exceeded wherein the start of the second data collection time window is based on a spatial path between the trigger channel and second channel.
- the system can include a trigger processor configured to transfer the data from the first data collection time window to a data storage each time the data signal intensity threshold is exceeded and transfer the data from the second data collection time window to the data storage each time the data signal intensity threshold is exceeded.
- the system can include a computer processor configured analyze a distribution of data intensity peak times within the second data collection time window and calculate a time delay based on the distribution of data intensity peak times in the second data collection time window to position a data signal in the second channel in the second data collection time window.
- the system can include a field programmable gate array wherein the memory buffer and the trigger processor are subcomponents of a field programmable gate array.
- the system can include the light emitted being fluorescent.
- the system can include the light emitted being scattered.
- the system can include the start of the second data collection time window being based on a flow rate.
- the system can include the start of the second data collection time window being based on a sheath fluid flow rate.
- the system can include the spatial path being between about 80 to 250 micrometers.
- the system can include the spatial path being about 150 micrometers.
- the system can include the data collection time windows being between about 80 to about 120 ADC points wide.
- the system can include the data collection time windows being between about 320 to about 360 ADC points wide.
- the invention relates to a fluidic diagnostic method for a flow cytometer.
- the method includes passing a set of calibration particles through a flow cell.
- the method includes illuminating each calibration particle of the set of calibration particles passing through the flow cell with at least two light beams wherein each light beam is associated with a channel, wherein there is a spatial separation between channels.
- the method includes collecting light emitted from each calibration particle of the set of calibration particles using a detector associated with each channel.
- the method includes recording data from each of the detectors.
- the method includes setting a trigger channel to initiate a transfer of data from a first data collection time window associated with the trigger channel when a data signal threshold for the trigger channel is exceeded.
- the method includes setting a second channel to transfer data from a second data collection time window associated with the second channel when the data signal threshold for the trigger channel is exceeded.
- the method includes recording data from the first data collection time window to a data store each time the data signal threshold is exceeded.
- the method includes recording data from the second data collection time window to the data store each time the data signal threshold for the trigger channel is exceeded.
- the method includes analyzing a distribution of data intensity peak times within the second data collection time window and comparing the distribution to a system specification to determine a diagnostic parameter.
- the diagnostic parameter relates to a fluid pressure, a mechanical perturbation in a pump, a particle arrival time, and/or a laminar flowstability. The health of a fluidics system may be determined.
- the method can include the system specification being a Gaussian distribution.
- the method can include the system specification being a Poisson distribution.
- the system specification is any statistical distribution.
- the method can include the light emitted being fluorescent.
- the method can include the light emitted being scattered.
- the method can include the data collection time windows being between about 80 to about 120 ADC points wide.
- the method can include the data collection time windows being between about 320 to about 360 ADC points wide.
- a fluidic diagnostic system for a flow cytometer can include a flow cell configured to flow calibration particles.
- the system can include at least two light sources each configured to emit a light beam, wherein each light beam is associated with a channel and, wherein the light beams pass through the flow cell.
- the system can include a detector associated with each channel wherein each detector is configured to collect light emitted from each of the set of calibration beads.
- the system can include a memory buffer configured to record data from each of the detectors.
- the system can include a trigger channel configured to initiate a transfer of data from a first data collection time window associated with the trigger channel when a data signal threshold for the trigger channel is exceeded.
- the system can include a second channel configured to transfer data from a second data collection time window associated with the second channel when the data signal threshold for the trigger channel is exceeded.
- the system can include a trigger processor configured to transfer the data from the first data collection time window to a data storage each time the data signal intensity threshold is exceeded and transfer the data from the second data collection time window to the data storage each time the data signal intensity threshold is exceeded.
- the system can include a computer processor configured to compare a distribution of data intensity peak times within the second data collection time window to a system specification to determine the health of a fluidics system.
- the system can include a field programmable gate array wherein the memory buffer and the trigger processor can be subcomponents of the field programmable gate array.
- the system can include wherein the system specification being 1 standard deviation.
- the system can include the system specification being 2 standard deviations.
- the system can include the system specification being 3 standard deviations.
- the system can include the system specification being 4 standard deviations.
- the system can include the system specification being a Gaussian distribution.
- the system can include the system specification being a Poisson distribution.
- the system can include the system specification being any statistical distribution.
- the system can include the light emitted being fluorescent.
- the system can include the light emitted being scattered.
- the system can include the data collection time windows being between about 80 to about 120 ADC points wide.
- the system can include the data collection time windows being between about 320 to about 360 ADC points wide.
- the specification may have presented a method and/or process as a particular sequence of steps.
- the method or process should not be limited to the particular sequence of steps described.
- other sequences of steps may be possible. Therefore, the particular order of the steps set forth in the specification should not be construed as limitations on the claims.
- the claims directed to the method and/or process should not be limited to the performance of their steps in the order written, and one skilled in the art can readily appreciate that the sequences may be varied and still remain within the scope of the various embodiments.
- ADC point is the time interval between sampling points of the analog to digital converter.
- 1 ADC point can either be 500 nanoseconds or 1 microsecond.
- analyte means a substance or material to be analyzed.
- channel means a path through a flow cell where data collection occurs.
- diagnostic parameter means qualities or measurements relating to laminar flow stability, mechanical perturbation arising in a pump or a gear pump, time between particles arriving (particle arrival time), fluid pressure, high fluid pressure, low fluid pressure, fluid pressure fluctuations, leaking, and/or anything known in the art that relates to fluidic systems qualities.
- flow cell means a flow channel, a chamber or a capillary having an interior shape selected from rectangular, square, elliptical, oblate circular, round, octagonal, heptagonal, hexagonal, pentagonal, and trigonal.
- label means an identifiable substance, such as a dye or a radioactive isotope that is introduced in a system, such as a biological system, and can be followed through the course of a flow cell or channel, providing information on the particles or targets in the flow cell or channel.
- microsphere or “bead” means a particle that can be symmetric as in a sphere, asymmetric as in a dumbbell shape or a macromolecule having no symmetry.
- microspheres or beads include, but are not limited to, silica, glass and hollow glass, latex, silicone rubbers, polymers such as polystyrene, polymethylmethacrylate, polymethylenemelamine, polyacrylonitrile, polymethylacrylonitrile, poly(vinilidene chlorideco-acrylonitrile), and polylactide.
- particle means a small unit of matter, to include but not limited to: biological cells, such as, eukaryotic and prokaryotic cells, archaea, bacteria, mold, plant cells, yeast, protozoa, ameba, protists, animal cells; cell organelles; organic/inorganic elements or molecules; microspheres; and droplets of immiscible fluid such as oil in water.
- biological cells such as, eukaryotic and prokaryotic cells, archaea, bacteria, mold, plant cells, yeast, protozoa, ameba, protists, animal cells
- cell organelles such as, cell organelles, organic/inorganic elements or molecules; microspheres; and droplets of immiscible fluid such as oil in water.
- peak is relating to a high point in signal amplitude.
- the signal can originate from fluorescence.
- peak time is the measurement of time elapsed from the beginning of the data collection time window to the highest peak in the window.
- probe means a substance that is labeled or otherwise marked and used to detect or identify another substance in a fluid or sample.
- reaction is a substance known to react in a specific way.
- signaling molecule means an identifiable substance, such as a dye or a radioactive isotope that is introduced in a system, such as a biological system, and can be used as a signal for particles.
- spatial separation or “spatial separation between channels” means the distance from the center of one light beam to the center of the adjacent light beam.
- target means a binding portion of a probe.
- transients are temporary system instabilities that eventually stabilize. For example, an air bubble in a fluidics system that expands and contracts can cause a transient.
- trigger threshold means the point where an intensity value from a signal is high enough to activate processing electronics in order to process a detected event.
- trigger or “triggering” is the activation of processing electronics when an intensity value from a signal goes above the trigger threshold.
- trigger laser or “trigger channel” is the set of hardware that is responsible for sensing a trigger threshold and indicating that all the acquired data coming from all the lasers or channels in the system needs to be stored and analyzed.
- window is the data that is initially analyzed by the digital sampling electronics for height, width, and area then is later transferred from a digital sampling electronics to a permanent storage location for further analysis.
- the systems, methods, and apparatuses disclosed in the present application can be used in conjunction with various apparatuses, systems, and methods relating to flow cytometry. See U.S. Patent Application Numbers 12/239,390 and 12/209,084 . Also see Practical Flow Cytometry, 4th Edition, Howard M. Shapiro .
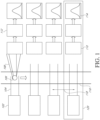
- Fig. 1 is a basic illustration of a flow cytometer, not claimed, and the way in which data can be collected.
- Various embodiments can include at least one light source 102.
- Each of the light sources 102 can produce a light beam 104 which can then illuminate a particle 106 as the particle passes through a flow cell 116.
- the illumination can result in light 108 coming off of the particle.
- the form of light 108 can include fluorescent or scattered light.
- the light 108 can then be detected by a detector 110 and data 114 can be transferred to the digital sampling electronics 112.
- the digital sampling electronics 112 can include memory of some kind which can be in an analog or digital form. Memory can be random access memory or a circular buffer that makes use of random access memory.
- data 114 can be produced from the signal which can include height, width, and peak time information.
- the data 114 can be in the form of voltages and can be used in fluidic diagnostics and in calibrating time delay settings.
- an analog to digital converter can be used to convert voltages into digital data.
- images can be used instead of voltages and intensities can be extrapolated.
- the spatial separation 118 (or spatial path) can be measured by the distance between adjacent light beams 104.
- There can be a spatial separation 118 between channels 120 which in various embodiments can be about 150 micrometers or in other various embodiments can be about 80 micrometers to about 250 micrometers.
- a channel 120 can be a data collection path. In Fig. 1 , there are four such data collection paths or channels 120 shown, however, various embodiments can use any number of channels 120.
- the digital sampling electronics 112 can be analog sampling electronics or simple sampling electronics.
- the digital sampling electronics 112 can include a field programmable gate array wherein the field programmable gate array can include a memory buffer, a trigger processor, and a calculation block.
- the memory buffer can store all data 114 and when a data signal intensity threshold (trigger threshold) is exceeded the data 114 can then be processed by the calculation block and sent to a computer.
- the computer can include memory, a processor, and any other components known in the art.
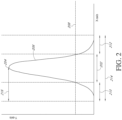
- Fig. 2 depicts an example illustration of resulting data 114 when it has been plotted to an x and y coordinate system and is displayed as a signal plot 206.
- the x-axis can represent time and the y-axis can represent signal intensity.
- the signal intensity can originate from fluorescence intensity.
- the intensity can be amplified in a photomultiplier tube or similar device and later measured in voltage.
- the digital sampling electronics 112 can register that a particle (or event) has been detected and can perform some digital processing or transfer the data to permanent data storage, or do both.
- the permanent data storage can be located on a computer.
- a pulse width can be seen to include the width of the signal plot 206 at the trigger threshold 208.
- the highest peak 204 also called data intensity peak or pulse height
- the data collection time window 214 can include the pulse width 202 as well as a front extension 210 and a rear extension 212.
- the data collection time windows 214 can be set prior to an experiment and with the consideration that the location of signal plots 206 are likely to have some variance.
- the data collection time windows 214 can be dynamic and set during an experiment on a particle-by-particle basis. When deciding a final data time collection window 214 size several considerations become relevant. The data time collection window 214 cannot be too large or there is a risk of coincidence and the data time collection window 214 cannot be too small or data from a particle 106 will fall outside the boundaries of the data time collection window 214.
- a histogram can be observed that includes several signal plots 206 compiled into a single plot.
- Each signal plot 206 counts as a single event or can represent a particle 106 passing through the flow cell 116 and producing a signal from one of the channels 120.
- the y-axis represents the count or number of events and the x-axis represents peak time 216 or data intensity peak time. The apex of the peak is the point in time where the most events occur.
- events are normally distributed.
- peak times 216 added together can be called compiled peak times 302. In flow cytometry, there is always some variance or jitter in particle arrival time which results in events occurring with different peak times 216.
- the ability to detect accurate peak times 216 is very important. In order to reach statistical significance sometimes 500 events or more need to be averaged. In some situations, 1000 or more events are desired to reach statistical significance and properly assess the compiled peak time 302. Any statistical means can be used that relates to average, median, integration, or slope derivative. Those skilled in the art will appreciate many other ways to analyze variance.
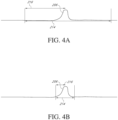
- Fig. 4A depicts a wide data collection time window plot 206
- Fig. 4B depicts a narrow data collection time window plot 206.
- the data collection time window 214 can be narrowed as seen in Fig. 4B in order to decrease the likelihood of coincidence and increase the signal to noise ratio. Such a data collection time window 214 size reduction can occur in each channel 120. Data time collection time windows 214 can also be shifted in time.
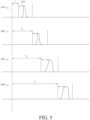
- Each signal plot 206 in Fig. 5 represents a typical signal plot 206 with a typical peak time 216 for the system.
- the y-axis can be intensity (voltage, fluorescence, brightness, etc.) and the x-axis can be time (This is sometimes referred to in the art as ADC points, relating to an analog to digital converter.).
- the signal plots 216 represent the same particle passing through four spatially separated channels 518, 520, 522, and 524.
- the first channel 518 represents a trigger channel 518.
- the digital sampling electronics 112 begin signal processing for all of the channels 518, 520, 522, and 524.
- Channels further away from the trigger channel 518 in space will have the longest time delays.
- the time delays can be adjusted for each of the channels 518, 520, 522, and 524 and the time collection data windows 214 can be narrowed to optimize the signal to noise ratio and reduce coincidence.
- the highest peak 204 average will be centered within the time collection data windows 214 for each channel 518, 520, 522, and 524.
- centering is not required and in some circumstances may not be optimal. It should be noted that such a procedure can be used for two or more channels and that Fig. 5 is only one example of several embodiments.
- the initial wide time collection data windows 214 can range from about 320 to 360 ADC points. and the narrowed time collection data windows 214 can range from about 80 to about 120 ADC points.
- the extensions can be about 27 ADC points for the narrowed windows. In various embodiments, the extensions can range from about 17 to about 37 ADC points.
- Fig. 6 illustrates one non-claimed example of various embodiments of a method to determine data processing settings for a flow cytometer comprising passing a set of calibration particles through a flow cell 602.
- Various embodiments can include illuminating each of the set of calibration particles passing through the flow cell with at least two light beams wherein each light beam is associated with a channel 604.
- Various embodiments can include collecting light emitted from each of the set of calibration particles using a detector associated with each channel 606.
- Various embodiments can include recording data from each detector 608.
- Various embodiments can include setting a trigger channel to initiate a transfer of data from a first data collection time window associated with the trigger channel when a data signal threshold for the trigger channel is exceeded 610.
- Various embodiments can include setting a second channel to transfer data from a second data collection time window associated with the second channel when the data signal threshold for the trigger channel is exceeded, and wherein the start of the second data collection time window is based on a spatial path between the trigger channel and the second channel 612.
- Various embodiments can include recording data from the first data collection time window to a data store each time the data signal threshold is exceeded 614.
- Various embodiments can include recording data from the second data collection time window to the data store each time the data signal threshold for the trigger channel is exceeded 616.
- Various embodiments can include analyzing a distribution of data intensity peak times within the second data collection time window 618.
- Various embodiments can include calculating a time delay based on the distribution of data intensity peak times in the second data collection time window to position a data signal in the second channel in the second data collection time window 620.
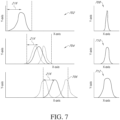
- FIG. 7 three data collection plots 702, 704, and 706 are illustrated with each having an accompanying compiled data plot (or histogram) 708, 710, and 712.
- the first data collection plot 702 represents the trigger channel 702 where there is little to no peak time 216 fluctuation.
- the adjacent data collection plot 704 depicts three curves. The dotted curves symbolize fluctuation in particle arrival time.
- the furthest channel 120 or data collection plot 706 from the trigger channel 702 has the most peak time 216 fluctuation because fluctuations can compound over longer distances.
- the data collection plot 706 for the furthest channel from the trigger channel has curves that fall outside of the optimized data collection time window 214.
- Such data 114 can be processed sub-optimally or simply never be processed and can lead to missing data and to inferior results.
- the data collection time windows 214 can be opened to collect more data 114, but coincidence will increase as well as noise.
- the compiled data plots 708, 710, and 712 show a histogram comprising events or count on the y-axis and peak time 216 on the x-axis taken from many particle measurements of peak time 216 on the system.
- the compiled data 708 for the trigger channel illustrates a tight data distribution where most of the events or particles passing through the channel occur within a small time range. It is expected that the spread will become wider as the particle travels a longer distance which can be seen in the other compiled data plots 710 and 712.
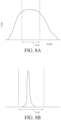
- FIG. 8A an example of a histogram of peak time values 216 showing low quality compiled data where most of the data 114 does not fall within the data collection time window 214 as a result of fluidic fluctuations in system.
- the data falls outside a predetermined system specification shown by the dashed lines.
- Fig. 8B is an example of a histogram of peak time values 216 showing high quality compiled data plot where all of the data 114 falls within the data collection time window 214 as a result of a fluidic system within operating specification.
- Data 114 such as that found in Fig. 8A can indicate a fluidics instability problem. Note that these drawings are not to scale and the intent for this example is that the data collection time windows 214 are the same width which means that the events in Fig. 8A are spread much further apart than the events in Fig. 8B .
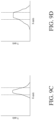
- Fig. 9A-E are all examples of the types of data 114b generated from the embodiments disclosed herein that would indicate a failure in a fluidics system.
- the y-axis represents number of events and the x-axis represents a histogram of peak time 216 (where a highest peak 204 occurs in relation to the data collection time window 214).
- the area in between the dashed lines represents what is acceptable for the system specification for a given experiment.
- the distribution of peak times 216 have a high point and a tail to the right. The tail indicates that a lot of fluidic fluctuation and/or pulsation occurred during this run.
- Fig. 9B is the same run as 9A and shows fluorescence on the y-axis and time on the x-axis. As time progresses, fluorescence or signal intensity increases.
- Fig. 9C depicts event count on the y-axis and the fluorescence intensity on the x-axis with a distribution that is too broad to meet specification.
- Such data 114 can be the result of light source 102 misalignment, collection optics issues, excessive noise on the collection electronics, or a variety of compounding issues. See the referenced literature above for a more detailed discussion.
- peak time 216 information is gathered, such as in Fig. 9D (event count on the y-axis, peak time on the x-axis), and analyzed in conjunction with Fig. 9C then a determination can be made that there is likely a fluidics failure.
- monitoring the amount of the data 114 that falls outside of the data collection time window 214 can be important. In various embodiments, that can be ten percent or more. In Figs. 9C and 9D the area in between the dashed lines represents what is acceptable for the system specification for a given experiment.
- Fig. 9E depicts peak time 216 of subsequent particles in a run on the y-axis and time and the x-axis. From this example, it can be inferred that particle 106 arrival is not constant over time and can indicate a serious fluidic failure if the variation in peak time 216 is too large and not with the system specification. The cause of such a failure is often from pulsation from the sheath delivery system. Before the set of current embodiments, a diagnosis for such a problem would have involved a circuitous process involving a lot of time wasted. Using peak time 216 data where the location of the highest peaks 204 are known within a data collection time window 214 such a diagnosis becomes far simpler.
- Fig. 10 illustrates one example of various embodiments of a fluidic diagnostic method for a flow cytometer comprising passing a set of calibration particles through a flow cell 1002.
- the claimed invention includes illuminating each calibration particle of the set of calibration particles passing through the flow cell with at least two light beams wherein each light beam is associated with a channel 1004, wherein there is a spatial separation between channels
- the claimed invention includes collecting light emitted from each calibration particle of the set of calibration particles using a detector associated with each channel 1006.
- the claimed invention includes recording data from each of the detectors 1008.
- the claimed invention includes setting a trigger channel to initiate a transfer of data from a first data collection time window associated with the trigger channel when a data signal threshold for the trigger channel is exceeded 1010.
- the claimed invention includes setting a second channel to transfer data from a second data collection time window associated with the second channel when the data signal threshold for the trigger channel is exceeded 1012.
- the claimed invention includes recording data from the first data collection time window to a data store each time the data signal threshold is exceeded 1014.
- the claimed invention includes recording data from the second data collection time window to the data store each time the data signal threshold for the trigger channel is exceeded.
- the claimed invention includes analyzing a distribution of data intensity peak times within the second data collection time window and comparing the distribution to a system specification to determine a diagnostic parameter, e.g..
- Various non-claimed examples can include the system specification being 1 standard deviation. Various non-claimed examples can include the system specification being 2 standard deviation. Various non-claimed examples can include the system specification being 3 standard deviation. Various non-claimed examples can include the system specification being 4 standard deviation. Various embodiments can include the system specification being a Gaussian distribution. Various embodiments can include the system specification being a Poisson distribution. The claimed invention includes the system specification being any statistical distribution. Various embodiments can include the light emitted being fluorescent. Various embodiments can include the light emitted being scattered. Various embodiments can include the data collection time windows being between about 80 to about 120 ADC points wide. Various embodiments can include the data collection time windows being between about 320 to about 360 ADC points wide.
- the method can include the step of impacting the particles 106 with the light beams 104 to produce data from each of the spatially separated channels 120.
- the method can include the step of detecting a signal from the particles 106 using a detector 110.
- the data 114 can include peak time 216. In various embodiments, the data 114 can include height, width, and area data.
- the peak time 216 data can be used in the step of evaluating the data.
- evaluating the data 114 can include determining if greater than ten percent of the peak time 216 data falls outside of the data collection time window 214.
- evaluating the data 114 can occur using a digital sampling electronics 112.
- the data collection time windows 214 can be about three point five microseconds.
- the light beam 104 can have a larger diameter than each of the particles 106.
- Such a configuration allows for signal intensities to be calculated without the need for integration.
- height and area which are described elsewhere in the literature, can be proportionate.
- alternatively integration can be used which becomes especially useful when particle 106 diameter exceeds light beam 104 diameter.
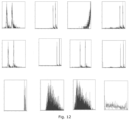
- Fluorescence and peak time 216 data 114 were gathered for four channels 120 in a flow cytometer.
- the columns moving from left to right represent red, blue, violet, and yellow light sources 102.
- the top two rows show count or events on the y-axis and fluorescence intensity on the x-axis.
- the last row depicts count or events on the y-axis and peak time on the x-axis (measured in ADC points).
- histograms of peak time 216 are shown from the particle data that generated the previous two rows of data.
- the left most plot shows the tightest peak because it is the trigger channel.
- Each channel 120 moving right is further away from the trigger channel which is why the plots widen.
- the spread is still within specification and fits into a data collection time window 214 that is 120 ADC points wide.
- Fluorescence and peak time 216 data 114 were gathered for four channels in a flow cytometer.
- the columns moving from left to right represent red, blue, violet, and yellow light sources 102.
- the top two rows show count or events on the y-axis and fluorescence intensity on the x-axis. In this example, two fluorophores were used which is why there are two peaks.
- the last row depicts count or events on the y-axis and peak time on the x-axis (measured in ADC points).
- the left most plot shows a tight peak, but the other plots degrade rapidly until the right most plot is entirely noise along the x-axis despite the data collection time window 214 being widened to 350 ADC points.
- This data indicates that there is extreme fluidics fluctuation within the system because particles are arriving at the last channel almost randomly (a flat distribution) when they should be arriving fairly close in time. There is a fluidics failure of some kind and possibly a sheath fluid pump failure.
- the current system and method for diagnosing a fluidics system for a flow cytometer can accommodate particles 106 flowing at a rate of up to 35,000 particles 106 per second and can be ten times faster than the conventional means of diagnosing. This rate can be higher with the use of faster ADC's, faster digital processors, and higher fluid velocities.
Landscapes
- Chemical & Material Sciences (AREA)
- Dispersion Chemistry (AREA)
- Physics & Mathematics (AREA)
- Health & Medical Sciences (AREA)
- Life Sciences & Earth Sciences (AREA)
- Analytical Chemistry (AREA)
- Biochemistry (AREA)
- General Health & Medical Sciences (AREA)
- General Physics & Mathematics (AREA)
- Immunology (AREA)
- Pathology (AREA)
- Engineering & Computer Science (AREA)
- Signal Processing (AREA)
- Investigating, Analyzing Materials By Fluorescence Or Luminescence (AREA)
- Investigating Or Analysing Biological Materials (AREA)
Applications Claiming Priority (3)
| Application Number | Priority Date | Filing Date | Title |
|---|---|---|---|
| US201461948547P | 2014-03-06 | 2014-03-06 | |
| US201462056646P | 2014-09-29 | 2014-09-29 | |
| PCT/US2015/014210 WO2015134139A1 (en) | 2014-03-06 | 2015-02-03 | Systems and methods for diagnosing a fluidics system and determining data processing settings for a flow cytometer |
Publications (2)
| Publication Number | Publication Date |
|---|---|
| EP3114458A1 EP3114458A1 (en) | 2017-01-11 |
| EP3114458B1 true EP3114458B1 (en) | 2024-08-21 |
Family
ID=52464627
Family Applications (1)
| Application Number | Title | Priority Date | Filing Date |
|---|---|---|---|
| EP15703722.7A Active EP3114458B1 (en) | 2014-03-06 | 2015-02-03 | Methods for diagnosing a fluidics system |
Country Status (10)
| Country | Link |
|---|---|
| US (2) | US10001434B2 (enExample) |
| EP (1) | EP3114458B1 (enExample) |
| JP (1) | JP2017511884A (enExample) |
| KR (1) | KR20160130754A (enExample) |
| CN (1) | CN106164645B (enExample) |
| AU (1) | AU2015225730A1 (enExample) |
| MX (1) | MX2016011482A (enExample) |
| RU (1) | RU2016132999A (enExample) |
| SG (1) | SG11201606189UA (enExample) |
| WO (1) | WO2015134139A1 (enExample) |
Families Citing this family (12)
| Publication number | Priority date | Publication date | Assignee | Title |
|---|---|---|---|---|
| US9857284B1 (en) * | 2013-07-15 | 2018-01-02 | Stratedigm, Inc. | Method and apparatus for detection and measurement of particles with a wide dynamic range of measurement |
| JP2017511884A (ja) | 2014-03-06 | 2017-04-27 | ライフ テクノロジーズ コーポレーション | 流体装置システムを診断するため及びフローサイトメータ用のデータ処理設定を決定するためのシステム及び方法 |
| US9863864B2 (en) | 2015-09-15 | 2018-01-09 | Bio-Rad Technologies, Inc. | Threshold selector for flow cytometer |
| WO2018183939A1 (en) | 2017-03-31 | 2018-10-04 | Life Technologies Corporation | Apparatuses, systems and methods for imaging flow cytometry |
| DE102018119081A1 (de) * | 2018-08-06 | 2020-02-06 | Foshan Sensicfusion Technology Co., Ltd. | Ein Verfahren und eine Vorrichtung zum Zählen von Luftpartikeln |
| KR102103080B1 (ko) * | 2018-10-17 | 2020-04-22 | 빌리브마이크론(주) | 입자 측정 시스템 및 그 측정 방법 |
| SE543406C2 (en) * | 2019-05-15 | 2021-01-05 | Nanosized Sweden Ab | Water impurity measurements with dynamic light scattering |
| CN110715892A (zh) * | 2019-09-19 | 2020-01-21 | 中国科学院苏州生物医学工程技术研究所 | 基于多激光流式细胞仪的数据处理方法及系统、流式细胞仪控制系统 |
| US20250180461A1 (en) * | 2022-01-31 | 2025-06-05 | Sony Group Corporation | Biological sample analysis system, method for setting light data acquisition section in biological sample analysis system, and information processing device |
| CN119072620A (zh) * | 2022-02-24 | 2024-12-03 | 贝克顿·迪金森公司 | 用于针对重合事件的存在评估流式细胞仪数据的方法和系统 |
| WO2023163162A1 (ja) * | 2022-02-25 | 2023-08-31 | 株式会社オンチップ・バイオテクノロジーズ | 液滴内の粒子の検出方法と、その粒子を含む液滴の分取と分注方法と分注後に液滴から粒子を外部に取り出す方法と、その装置 |
| CN120577172B (zh) * | 2025-08-05 | 2025-11-14 | 西安电子科技大学 | 一种通道可配置的液体颗粒脉冲幅度检测方法及相关装置 |
Family Cites Families (10)
| Publication number | Priority date | Publication date | Assignee | Title |
|---|---|---|---|---|
| US5199576A (en) * | 1991-04-05 | 1993-04-06 | University Of Rochester | System for flexibly sorting particles |
| US5682038A (en) * | 1995-04-06 | 1997-10-28 | Becton Dickinson And Company | Fluorescent-particle analyzer with timing alignment for analog pulse subtraction of fluorescent pulses arising from different excitation locations |
| AU2003902319A0 (en) * | 2003-05-14 | 2003-05-29 | Garrett Thermal Systems Limited | Laser video detector |
| KR101135138B1 (ko) * | 2003-08-13 | 2012-04-16 | 루미넥스 코포레이션 | 유세포 분석기식 측정 시스템의 하나 이상의 파라미터의제어 방법 |
| US8817244B2 (en) * | 2010-01-15 | 2014-08-26 | Mitsui Engineering & Shipbuilding Co., Ltd. | Fluorescence measurement device and fluorescence measurement method |
| AU2011224429B2 (en) | 2010-03-10 | 2014-09-04 | Beckman Coulter, Inc. | Generating pulse parameters in a particle analyzer |
| US8726720B2 (en) * | 2010-05-10 | 2014-05-20 | Thermo Fisher Scientific Inc. | Particulate matter monitor |
| CA2826544C (en) * | 2011-02-04 | 2020-06-30 | Cytonome/St, Llc | Particle sorting apparatus and method |
| US9897530B2 (en) * | 2011-08-25 | 2018-02-20 | Sony Corporation | Compensation of motion-related error in a stream of moving micro-entities |
| JP2017511884A (ja) | 2014-03-06 | 2017-04-27 | ライフ テクノロジーズ コーポレーション | 流体装置システムを診断するため及びフローサイトメータ用のデータ処理設定を決定するためのシステム及び方法 |
-
2015
- 2015-02-03 JP JP2016553525A patent/JP2017511884A/ja active Pending
- 2015-02-03 AU AU2015225730A patent/AU2015225730A1/en not_active Abandoned
- 2015-02-03 CN CN201580011249.5A patent/CN106164645B/zh active Active
- 2015-02-03 WO PCT/US2015/014210 patent/WO2015134139A1/en not_active Ceased
- 2015-02-03 RU RU2016132999A patent/RU2016132999A/ru not_active Application Discontinuation
- 2015-02-03 SG SG11201606189UA patent/SG11201606189UA/en unknown
- 2015-02-03 US US14/612,820 patent/US10001434B2/en active Active
- 2015-02-03 MX MX2016011482A patent/MX2016011482A/es unknown
- 2015-02-03 KR KR1020167022906A patent/KR20160130754A/ko not_active Abandoned
- 2015-02-03 EP EP15703722.7A patent/EP3114458B1/en active Active
-
2018
- 2018-05-21 US US15/984,695 patent/US10520418B2/en active Active
Also Published As
| Publication number | Publication date |
|---|---|
| WO2015134139A1 (en) | 2015-09-11 |
| CN106164645B (zh) | 2019-10-18 |
| JP2017511884A (ja) | 2017-04-27 |
| US20150253235A1 (en) | 2015-09-10 |
| MX2016011482A (es) | 2016-12-20 |
| US10001434B2 (en) | 2018-06-19 |
| RU2016132999A3 (enExample) | 2018-09-19 |
| AU2015225730A1 (en) | 2016-10-27 |
| US10520418B2 (en) | 2019-12-31 |
| KR20160130754A (ko) | 2016-11-14 |
| RU2016132999A (ru) | 2018-04-09 |
| CN106164645A (zh) | 2016-11-23 |
| SG11201606189UA (en) | 2016-09-29 |
| EP3114458A1 (en) | 2017-01-11 |
| US20180335375A1 (en) | 2018-11-22 |
Similar Documents
| Publication | Publication Date | Title |
|---|---|---|
| EP3114458B1 (en) | Methods for diagnosing a fluidics system | |
| ES2885374T3 (es) | Funcionamiento del citómetro de flujo de alto rendimiento con evaluación y control de calidad de datos | |
| EP2201349B1 (en) | Systems, storage mediums, and methods for identifying particles in flow | |
| EP2545357B1 (en) | Generating pulse parameters in a particle analyzer | |
| JP5557842B2 (ja) | 粒子分析における同時発生の検出および処理 | |
| US7130046B2 (en) | Data frame selection for cytometer analysis | |
| CN101923039B (zh) | 控制流式细胞计型测量系统的一个或多个参数的方法 | |
| JP5058171B2 (ja) | 血小板の測定を実施するための方法および装置 | |
| US9658215B2 (en) | Identifying and enumerating early granulated cells (EGCs) | |
| US20100020308A1 (en) | Transducer Module | |
| US20170350804A1 (en) | Cell analyser and particle sorting method and device | |
| JP2012505406A5 (enExample) | ||
| JP2020079772A5 (enExample) | ||
| US20240264066A1 (en) | Polydispersed particle challenge sample volume calibration of optical particle counters | |
| Kuruma et al. | Mass-measurement-type optical particle counting method for determination of number concentration of liquid-borne particles | |
| CN106644902A (zh) | 一种流式细胞仪层流稳定性评估方法 | |
| JP2001091466A (ja) | 化学発光分析装置 |
Legal Events
| Date | Code | Title | Description |
|---|---|---|---|
| STAA | Information on the status of an ep patent application or granted ep patent |
Free format text: STATUS: THE INTERNATIONAL PUBLICATION HAS BEEN MADE |
|
| PUAI | Public reference made under article 153(3) epc to a published international application that has entered the european phase |
Free format text: ORIGINAL CODE: 0009012 |
|
| STAA | Information on the status of an ep patent application or granted ep patent |
Free format text: STATUS: REQUEST FOR EXAMINATION WAS MADE |
|
| 17P | Request for examination filed |
Effective date: 20161006 |
|
| AK | Designated contracting states |
Kind code of ref document: A1 Designated state(s): AL AT BE BG CH CY CZ DE DK EE ES FI FR GB GR HR HU IE IS IT LI LT LU LV MC MK MT NL NO PL PT RO RS SE SI SK SM TR |
|
| AX | Request for extension of the european patent |
Extension state: BA ME |
|
| DAX | Request for extension of the european patent (deleted) | ||
| STAA | Information on the status of an ep patent application or granted ep patent |
Free format text: STATUS: EXAMINATION IS IN PROGRESS |
|
| 17Q | First examination report despatched |
Effective date: 20190722 |
|
| GRAP | Despatch of communication of intention to grant a patent |
Free format text: ORIGINAL CODE: EPIDOSNIGR1 |
|
| STAA | Information on the status of an ep patent application or granted ep patent |
Free format text: STATUS: GRANT OF PATENT IS INTENDED |
|
| INTG | Intention to grant announced |
Effective date: 20230929 |
|
| GRAJ | Information related to disapproval of communication of intention to grant by the applicant or resumption of examination proceedings by the epo deleted |
Free format text: ORIGINAL CODE: EPIDOSDIGR1 |
|
| STAA | Information on the status of an ep patent application or granted ep patent |
Free format text: STATUS: EXAMINATION IS IN PROGRESS |
|
| INTC | Intention to grant announced (deleted) | ||
| GRAP | Despatch of communication of intention to grant a patent |
Free format text: ORIGINAL CODE: EPIDOSNIGR1 |
|
| STAA | Information on the status of an ep patent application or granted ep patent |
Free format text: STATUS: GRANT OF PATENT IS INTENDED |
|
| INTG | Intention to grant announced |
Effective date: 20240322 |
|
| GRAS | Grant fee paid |
Free format text: ORIGINAL CODE: EPIDOSNIGR3 |
|
| GRAA | (expected) grant |
Free format text: ORIGINAL CODE: 0009210 |
|
| STAA | Information on the status of an ep patent application or granted ep patent |
Free format text: STATUS: THE PATENT HAS BEEN GRANTED |
|
| AK | Designated contracting states |
Kind code of ref document: B1 Designated state(s): AL AT BE BG CH CY CZ DE DK EE ES FI FR GB GR HR HU IE IS IT LI LT LU LV MC MK MT NL NO PL PT RO RS SE SI SK SM TR |
|
| REG | Reference to a national code |
Ref country code: GB Ref legal event code: FG4D |
|
| REG | Reference to a national code |
Ref country code: CH Ref legal event code: EP |
|
| REG | Reference to a national code |
Ref country code: DE Ref legal event code: R096 Ref document number: 602015089591 Country of ref document: DE |
|
| REG | Reference to a national code |
Ref country code: IE Ref legal event code: FG4D |
|
| P01 | Opt-out of the competence of the unified patent court (upc) registered |
Free format text: CASE NUMBER: APP_48800/2024 Effective date: 20240827 |
|
| REG | Reference to a national code |
Ref country code: LT Ref legal event code: MG9D |
|
| REG | Reference to a national code |
Ref country code: NL Ref legal event code: MP Effective date: 20240821 |
|
| PG25 | Lapsed in a contracting state [announced via postgrant information from national office to epo] |
Ref country code: NO Free format text: LAPSE BECAUSE OF FAILURE TO SUBMIT A TRANSLATION OF THE DESCRIPTION OR TO PAY THE FEE WITHIN THE PRESCRIBED TIME-LIMIT Effective date: 20241121 |
|
| REG | Reference to a national code |
Ref country code: AT Ref legal event code: MK05 Ref document number: 1715930 Country of ref document: AT Kind code of ref document: T Effective date: 20240821 |
|
| PG25 | Lapsed in a contracting state [announced via postgrant information from national office to epo] |
Ref country code: FI Free format text: LAPSE BECAUSE OF FAILURE TO SUBMIT A TRANSLATION OF THE DESCRIPTION OR TO PAY THE FEE WITHIN THE PRESCRIBED TIME-LIMIT Effective date: 20240821 Ref country code: NL Free format text: LAPSE BECAUSE OF FAILURE TO SUBMIT A TRANSLATION OF THE DESCRIPTION OR TO PAY THE FEE WITHIN THE PRESCRIBED TIME-LIMIT Effective date: 20240821 Ref country code: PT Free format text: LAPSE BECAUSE OF FAILURE TO SUBMIT A TRANSLATION OF THE DESCRIPTION OR TO PAY THE FEE WITHIN THE PRESCRIBED TIME-LIMIT Effective date: 20241223 Ref country code: GR Free format text: LAPSE BECAUSE OF FAILURE TO SUBMIT A TRANSLATION OF THE DESCRIPTION OR TO PAY THE FEE WITHIN THE PRESCRIBED TIME-LIMIT Effective date: 20241122 Ref country code: PL Free format text: LAPSE BECAUSE OF FAILURE TO SUBMIT A TRANSLATION OF THE DESCRIPTION OR TO PAY THE FEE WITHIN THE PRESCRIBED TIME-LIMIT Effective date: 20240821 |
|
| PG25 | Lapsed in a contracting state [announced via postgrant information from national office to epo] |
Ref country code: BG Free format text: LAPSE BECAUSE OF FAILURE TO SUBMIT A TRANSLATION OF THE DESCRIPTION OR TO PAY THE FEE WITHIN THE PRESCRIBED TIME-LIMIT Effective date: 20240821 |
|
| PG25 | Lapsed in a contracting state [announced via postgrant information from national office to epo] |
Ref country code: LV Free format text: LAPSE BECAUSE OF FAILURE TO SUBMIT A TRANSLATION OF THE DESCRIPTION OR TO PAY THE FEE WITHIN THE PRESCRIBED TIME-LIMIT Effective date: 20240821 |
|
| PG25 | Lapsed in a contracting state [announced via postgrant information from national office to epo] |
Ref country code: AT Free format text: LAPSE BECAUSE OF FAILURE TO SUBMIT A TRANSLATION OF THE DESCRIPTION OR TO PAY THE FEE WITHIN THE PRESCRIBED TIME-LIMIT Effective date: 20240821 Ref country code: IS Free format text: LAPSE BECAUSE OF FAILURE TO SUBMIT A TRANSLATION OF THE DESCRIPTION OR TO PAY THE FEE WITHIN THE PRESCRIBED TIME-LIMIT Effective date: 20241221 |
|
| PG25 | Lapsed in a contracting state [announced via postgrant information from national office to epo] |
Ref country code: HR Free format text: LAPSE BECAUSE OF FAILURE TO SUBMIT A TRANSLATION OF THE DESCRIPTION OR TO PAY THE FEE WITHIN THE PRESCRIBED TIME-LIMIT Effective date: 20240821 |
|
| PG25 | Lapsed in a contracting state [announced via postgrant information from national office to epo] |
Ref country code: ES Free format text: LAPSE BECAUSE OF FAILURE TO SUBMIT A TRANSLATION OF THE DESCRIPTION OR TO PAY THE FEE WITHIN THE PRESCRIBED TIME-LIMIT Effective date: 20240821 Ref country code: RS Free format text: LAPSE BECAUSE OF FAILURE TO SUBMIT A TRANSLATION OF THE DESCRIPTION OR TO PAY THE FEE WITHIN THE PRESCRIBED TIME-LIMIT Effective date: 20241121 |
|
| PG25 | Lapsed in a contracting state [announced via postgrant information from national office to epo] |
Ref country code: RS Free format text: LAPSE BECAUSE OF FAILURE TO SUBMIT A TRANSLATION OF THE DESCRIPTION OR TO PAY THE FEE WITHIN THE PRESCRIBED TIME-LIMIT Effective date: 20241121 Ref country code: PT Free format text: LAPSE BECAUSE OF FAILURE TO SUBMIT A TRANSLATION OF THE DESCRIPTION OR TO PAY THE FEE WITHIN THE PRESCRIBED TIME-LIMIT Effective date: 20241223 Ref country code: PL Free format text: LAPSE BECAUSE OF FAILURE TO SUBMIT A TRANSLATION OF THE DESCRIPTION OR TO PAY THE FEE WITHIN THE PRESCRIBED TIME-LIMIT Effective date: 20240821 Ref country code: NO Free format text: LAPSE BECAUSE OF FAILURE TO SUBMIT A TRANSLATION OF THE DESCRIPTION OR TO PAY THE FEE WITHIN THE PRESCRIBED TIME-LIMIT Effective date: 20241121 Ref country code: NL Free format text: LAPSE BECAUSE OF FAILURE TO SUBMIT A TRANSLATION OF THE DESCRIPTION OR TO PAY THE FEE WITHIN THE PRESCRIBED TIME-LIMIT Effective date: 20240821 Ref country code: LV Free format text: LAPSE BECAUSE OF FAILURE TO SUBMIT A TRANSLATION OF THE DESCRIPTION OR TO PAY THE FEE WITHIN THE PRESCRIBED TIME-LIMIT Effective date: 20240821 Ref country code: IS Free format text: LAPSE BECAUSE OF FAILURE TO SUBMIT A TRANSLATION OF THE DESCRIPTION OR TO PAY THE FEE WITHIN THE PRESCRIBED TIME-LIMIT Effective date: 20241221 Ref country code: HR Free format text: LAPSE BECAUSE OF FAILURE TO SUBMIT A TRANSLATION OF THE DESCRIPTION OR TO PAY THE FEE WITHIN THE PRESCRIBED TIME-LIMIT Effective date: 20240821 Ref country code: GR Free format text: LAPSE BECAUSE OF FAILURE TO SUBMIT A TRANSLATION OF THE DESCRIPTION OR TO PAY THE FEE WITHIN THE PRESCRIBED TIME-LIMIT Effective date: 20241122 Ref country code: FI Free format text: LAPSE BECAUSE OF FAILURE TO SUBMIT A TRANSLATION OF THE DESCRIPTION OR TO PAY THE FEE WITHIN THE PRESCRIBED TIME-LIMIT Effective date: 20240821 Ref country code: ES Free format text: LAPSE BECAUSE OF FAILURE TO SUBMIT A TRANSLATION OF THE DESCRIPTION OR TO PAY THE FEE WITHIN THE PRESCRIBED TIME-LIMIT Effective date: 20240821 Ref country code: BG Free format text: LAPSE BECAUSE OF FAILURE TO SUBMIT A TRANSLATION OF THE DESCRIPTION OR TO PAY THE FEE WITHIN THE PRESCRIBED TIME-LIMIT Effective date: 20240821 Ref country code: AT Free format text: LAPSE BECAUSE OF FAILURE TO SUBMIT A TRANSLATION OF THE DESCRIPTION OR TO PAY THE FEE WITHIN THE PRESCRIBED TIME-LIMIT Effective date: 20240821 |
|
| PGFP | Annual fee paid to national office [announced via postgrant information from national office to epo] |
Ref country code: DE Payment date: 20250121 Year of fee payment: 11 |
|
| PG25 | Lapsed in a contracting state [announced via postgrant information from national office to epo] |
Ref country code: SM Free format text: LAPSE BECAUSE OF FAILURE TO SUBMIT A TRANSLATION OF THE DESCRIPTION OR TO PAY THE FEE WITHIN THE PRESCRIBED TIME-LIMIT Effective date: 20240821 Ref country code: RO Free format text: LAPSE BECAUSE OF FAILURE TO SUBMIT A TRANSLATION OF THE DESCRIPTION OR TO PAY THE FEE WITHIN THE PRESCRIBED TIME-LIMIT Effective date: 20240821 Ref country code: DK Free format text: LAPSE BECAUSE OF FAILURE TO SUBMIT A TRANSLATION OF THE DESCRIPTION OR TO PAY THE FEE WITHIN THE PRESCRIBED TIME-LIMIT Effective date: 20240821 |
|
| PG25 | Lapsed in a contracting state [announced via postgrant information from national office to epo] |
Ref country code: EE Free format text: LAPSE BECAUSE OF FAILURE TO SUBMIT A TRANSLATION OF THE DESCRIPTION OR TO PAY THE FEE WITHIN THE PRESCRIBED TIME-LIMIT Effective date: 20240821 |
|
| PG25 | Lapsed in a contracting state [announced via postgrant information from national office to epo] |
Ref country code: CZ Free format text: LAPSE BECAUSE OF FAILURE TO SUBMIT A TRANSLATION OF THE DESCRIPTION OR TO PAY THE FEE WITHIN THE PRESCRIBED TIME-LIMIT Effective date: 20240821 |
|
| PGFP | Annual fee paid to national office [announced via postgrant information from national office to epo] |
Ref country code: FR Payment date: 20250218 Year of fee payment: 11 |
|
| PG25 | Lapsed in a contracting state [announced via postgrant information from national office to epo] |
Ref country code: IT Free format text: LAPSE BECAUSE OF FAILURE TO SUBMIT A TRANSLATION OF THE DESCRIPTION OR TO PAY THE FEE WITHIN THE PRESCRIBED TIME-LIMIT Effective date: 20240821 Ref country code: SK Free format text: LAPSE BECAUSE OF FAILURE TO SUBMIT A TRANSLATION OF THE DESCRIPTION OR TO PAY THE FEE WITHIN THE PRESCRIBED TIME-LIMIT Effective date: 20240821 |
|
| PGFP | Annual fee paid to national office [announced via postgrant information from national office to epo] |
Ref country code: GB Payment date: 20250211 Year of fee payment: 11 |
|
| REG | Reference to a national code |
Ref country code: DE Ref legal event code: R097 Ref document number: 602015089591 Country of ref document: DE |
|
| PLBE | No opposition filed within time limit |
Free format text: ORIGINAL CODE: 0009261 |
|
| STAA | Information on the status of an ep patent application or granted ep patent |
Free format text: STATUS: NO OPPOSITION FILED WITHIN TIME LIMIT |
|
| 26N | No opposition filed |
Effective date: 20250522 |
|
| PG25 | Lapsed in a contracting state [announced via postgrant information from national office to epo] |
Ref country code: SE Free format text: LAPSE BECAUSE OF FAILURE TO SUBMIT A TRANSLATION OF THE DESCRIPTION OR TO PAY THE FEE WITHIN THE PRESCRIBED TIME-LIMIT Effective date: 20240821 |
|
| PG25 | Lapsed in a contracting state [announced via postgrant information from national office to epo] |
Ref country code: MC Free format text: LAPSE BECAUSE OF FAILURE TO SUBMIT A TRANSLATION OF THE DESCRIPTION OR TO PAY THE FEE WITHIN THE PRESCRIBED TIME-LIMIT Effective date: 20240821 |
|
| REG | Reference to a national code |
Ref country code: CH Ref legal event code: PL |
|
| PG25 | Lapsed in a contracting state [announced via postgrant information from national office to epo] |
Ref country code: LU Free format text: LAPSE BECAUSE OF NON-PAYMENT OF DUE FEES Effective date: 20250203 |
|
| PG25 | Lapsed in a contracting state [announced via postgrant information from national office to epo] |
Ref country code: CH Free format text: LAPSE BECAUSE OF NON-PAYMENT OF DUE FEES Effective date: 20250228 |