EP2972625B1 - Graphical process variable trend monitoring for a process control system - Google Patents
Graphical process variable trend monitoring for a process control system Download PDFInfo
- Publication number
- EP2972625B1 EP2972625B1 EP14723169.0A EP14723169A EP2972625B1 EP 2972625 B1 EP2972625 B1 EP 2972625B1 EP 14723169 A EP14723169 A EP 14723169A EP 2972625 B1 EP2972625 B1 EP 2972625B1
- Authority
- EP
- European Patent Office
- Prior art keywords
- process variable
- graphic
- value
- trend
- icons
- Prior art date
- Legal status (The legal status is an assumption and is not a legal conclusion. Google has not performed a legal analysis and makes no representation as to the accuracy of the status listed.)
- Active
Links
Images


Classifications
-
- G—PHYSICS
- G06—COMPUTING OR CALCULATING; COUNTING
- G06F—ELECTRIC DIGITAL DATA PROCESSING
- G06F3/00—Input arrangements for transferring data to be processed into a form capable of being handled by the computer; Output arrangements for transferring data from processing unit to output unit, e.g. interface arrangements
- G06F3/01—Input arrangements or combined input and output arrangements for interaction between user and computer
- G06F3/048—Interaction techniques based on graphical user interfaces [GUI]
- G06F3/0484—Interaction techniques based on graphical user interfaces [GUI] for the control of specific functions or operations, e.g. selecting or manipulating an object, an image or a displayed text element, setting a parameter value or selecting a range
-
- G—PHYSICS
- G05—CONTROLLING; REGULATING
- G05B—CONTROL OR REGULATING SYSTEMS IN GENERAL; FUNCTIONAL ELEMENTS OF SUCH SYSTEMS; MONITORING OR TESTING ARRANGEMENTS FOR SUCH SYSTEMS OR ELEMENTS
- G05B23/00—Testing or monitoring of control systems or parts thereof
- G05B23/02—Electric testing or monitoring
- G05B23/0205—Electric testing or monitoring by means of a monitoring system capable of detecting and responding to faults
- G05B23/0208—Electric testing or monitoring by means of a monitoring system capable of detecting and responding to faults characterized by the configuration of the monitoring system
- G05B23/0216—Human interface functionality, e.g. monitoring system providing help to the user in the selection of tests or in its configuration
-
- G—PHYSICS
- G06—COMPUTING OR CALCULATING; COUNTING
- G06F—ELECTRIC DIGITAL DATA PROCESSING
- G06F3/00—Input arrangements for transferring data to be processed into a form capable of being handled by the computer; Output arrangements for transferring data from processing unit to output unit, e.g. interface arrangements
- G06F3/01—Input arrangements or combined input and output arrangements for interaction between user and computer
- G06F3/048—Interaction techniques based on graphical user interfaces [GUI]
- G06F3/0481—Interaction techniques based on graphical user interfaces [GUI] based on specific properties of the displayed interaction object or a metaphor-based environment, e.g. interaction with desktop elements like windows or icons, or assisted by a cursor's changing behaviour or appearance
- G06F3/04817—Interaction techniques based on graphical user interfaces [GUI] based on specific properties of the displayed interaction object or a metaphor-based environment, e.g. interaction with desktop elements like windows or icons, or assisted by a cursor's changing behaviour or appearance using icons
-
- G—PHYSICS
- G05—CONTROLLING; REGULATING
- G05B—CONTROL OR REGULATING SYSTEMS IN GENERAL; FUNCTIONAL ELEMENTS OF SUCH SYSTEMS; MONITORING OR TESTING ARRANGEMENTS FOR SUCH SYSTEMS OR ELEMENTS
- G05B19/00—Program-control systems
- G05B19/02—Program-control systems electric
- G05B19/418—Total factory control, i.e. centrally controlling a plurality of machines, e.g. direct or distributed numerical control [DNC], flexible manufacturing systems [FMS], integrated manufacturing systems [IMS] or computer integrated manufacturing [CIM]
Definitions
- the present disclosure relates to a method of generating and displaying, via a computing device having a user interface, a graphic trend symbol that identifies trends of a process variable in a process control system of a process control plant.
- the viewing applications which may be run on one or more operator workstations, receive data from the controller application via the buses and display this data to process control system designers, operators, or users using the user interfaces, and may provide any of a number of different views, such as an operator's view, an engineer's view, a technician's view, etc.
- a database application is typically stored in and executed by a database device that collects and stores some or all of the data provided across the buses while a configuration database application may run in a still further computer attached to the buses to store the current process control routine configuration and data associated therewith.
- the configuration database may be located in the same workstation as the configuration application.
- US6577323 discloses a system to provide real-time process information to a user for a multivariable process operable under control of a plurality of process variables includes a controller operable to control one or more process variables and provide data representative of such process variables.
- the system further includes a graphical user interface which receives data representative of the process variables from the controller to display on a single display screen a plurality of display regions.
- the display regions include at least an overview trend display region to display one or more trend shape elements representative of historical data for corresponding process variables and a process variable detail display region to display a graphical representation of details associated with a selected process variable. Further, the display regions may include a matrix display region to display an array of information describing at least one characteristic associated with the one or more process variables listed in association with the array.
- Figs. 7A-D and 8-17 illustrate example icons to indicate conditions, characteristics, trends, and/or other information associated with process variables corresponding to components within the example process control system of Fig. 1 ;
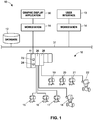
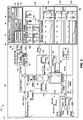
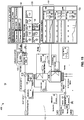
- the controller 11 includes a processor 23 that implements or oversees one or more process control routines (or any module, block, or sub-routine thereof) stored in a memory 24.
- the controller 11 communicates with the devices 15-22, the host computers 14 and the database 12 to control a process in any desired manner.
- the controller 11 may implement a control strategy or scheme using what are commonly referred to as function blocks, wherein each function block is an object or other part (e.g., a subroutine) of an overall control routine that operates in conjunction with other function blocks (via communications called links) to implement process control loops within the process control monitoring system 10.
- Function blocks typically perform one of an input function, such as that associated with a transmitter, a sensor or other process parameter measurement device, a control function, such as that associated with a control routine that performs PID, fuzzy logic, etc. control, or an output function which controls the operation of some device, such as a valve, to perform some physical function within the process control monitoring system 10.
- an input function such as that associated with a transmitter, a sensor or other process parameter measurement device
- a control function such as that associated with a control routine that performs PID, fuzzy logic, etc. control
- an output function which controls the operation of some device, such as a valve, to perform some physical function within the process control monitoring system 10.
- the function blocks may be stored in and executed by the controller 11 or other devices as described below.
- the process control monitoring system 10 of Fig. 1 may be used to monitor the process of one or more process control plants in which, for example, one of the workstations 14 executes a graphic display application that allows an operator, via the user interface 13, to monitor the process via a spatially realistic graphical representation of the plant and to navigate to different areas of the representation of the process plant within the context of the hierarchical structure of the process plant.
- a graphic display application 30 resides in the workstation 14.
- the graphic display application 30 could be stored and executed in other workstations 14, or in other computers communicatively connected to the bus 31 in any desired manner, including in any wireless manner.
- the graphic display application may display the crude unit graphical representation 53 to include a spatially realistic layout (e.g., a P&ID) of the crude unit in the plant that includes graphically realistic depictions of equipment, such as a heater 56, a distillation tower 58, a desalter 60, etc, that compose the crude unit.
- the graphic display application may display each piece of displayed equipment to include a realistic depiction of the piece of equipment, identifier labels, and any pipes, connections, etc. that may couple the piece of equipment to other pieces of equipment or other inflow/outflow sources, such as fuel oil, fuel gas, water sources, etc.
- the graphic display application 30 may populate one or more equipment selector icons 72-82 in the equipment selection area 64 that correspond to the one or more pieces of equipment associated or included within the selected unit. For example, as shown in Fig. 2 , the graphic display application 30 displays all equipment associated with the selected "Crude Unit 1" unit selector icon 66, which includes a "Desalter” equipment selector icon 72, a “Storage Tanks” equipment selector icon 74, a "Tower” equipment selector icon 76, an "Overhead Rcvr” equipment selector icon 80, and a "Heater” equipment selector icon 82.
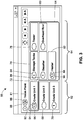
- Fig. 2A illustrates an example navigation pane 2600 associated with at least a portion of a process control system (e.g., the example process control system 10 of Fig. 1 ).
- the example navigation pane 2600 includes multiple navigation buttons 2602, 2604, 2606, 2608, 2610, 2612, 2614, 2616, 2618 grouped or arranged in separate columns 2620, 2622, 2624.
- Each navigation button 2602, 2604, 2606, 2608, 2610, 2612, 2614, 2616, 2618 corresponds to a particular component (e.g., a plant, an area, a unit, an equipment module, a control module, etc.) in the process control system.
- a particular component e.g., a plant, an area, a unit, an equipment module, a control module, etc.
- the graphic display application 30 may indicate the selection of a unit selector icon 66-70 of Fig. 2 by shading the selected unit selector icon (e.g., "Crude Unit 1" unit selector icon 66), for instance, and the background of the equipment selection area 64, as shown in Fig. 2 , to indicate that the equipment selector icons 72-82 are associated with the selected unit selector icon 66.
- Fig. 2B illustrates another example navigation pane 2700 associated with the same portion of the example process control system represented in the example navigation pane 2600 of Fig. 2A .
- a right-hand column 2810 of the example navigation pane 2800 includes navigation buttons 2812, 2814, 2816 corresponding to components in the next level down the hierarchy (e.g., equipment and/or control modules).
- each column 2806, 2808, 2810 may have an adjustable width to account for more or less components associated with the corresponding level of the hierarchy. Additionally or alternatively, the columns 2806, 2808, 2810 may contain more navigation buttons than are shown at any one time but may be viewed by using a corresponding scroll bar 2818.
- the example navigation pane 2800 is similar or identical to the example navigation pane 54 of Fig. 2 except that the navigation pane 2800 shows additional detail and corresponds to the heater module displayed via the viewport 52 rather than the graphical representation of the crude process unit 53 being displayed via the viewport 52 as shown in Fig. 2 .
- the lower level components contained within a particular higher level component represented in the example navigation pane 2800 are identified by a marker 2820 (e.g., a triangle or arrow) located next to each higher level navigation button corresponding to the direct line of components in the hierarchy pointing down to the navigation button associated with the currently viewed component.
- the marker 2820 next to the navigation button 2604 indicates that all the navigation buttons displayed in the lower levels (e.g., the navigation buttons 2610, 2612, 2614, 2616, 2618 in the column 2808 and the navigation buttons 2812, 2814, 2816 in the column 2810) correspond to subcomponents within the first crude process unit of the process control system (i.e., the upper component associated with the navigation button 2604).
- the marker 2820 next to the navigation button 2614 indicates that the navigation buttons 2812, 2814, 2816 correspond to components within the heater module (i.e., the upper component associated with the navigation button 2614).
- the direct path of components from the top level of the hierarchy down to the currently viewed component may also be indicated by altering the appearance of the corresponding navigation button(s) along the direct path (e.g., by changing the shading, color, pattern, brightness, outline, etc. of the corresponding navigation button(s) similar to what was described above in connection with Fig. 2A ).
- selecting (e.g., via a mouse click) anyone of the navigation buttons may change the current view (e.g., the graphical representation 53 in the viewport 52) of the process control system to correspond to the component selected.
- the example navigation pane 2800 enables an operator to quickly navigate to any component in the process control system and bring up the corresponding P&ID and/or other information for further analysis.
- selecting (e.g., via a mouse click) one of the navigation buttons may not immediately change the process diagram 304 to the selected component but merely give a preview of the selected component within the navigation pane.
- the markers 2820 next to the navigation buttons 2608, 2904 of Fig. 2D and/or the distinctive appearance (e.g., based on shading, color, pattern, border, notation, etc.) of the navigation buttons 2608, 2904 of Fig. 2D indicate the relationship of the navigation buttons in each column 2806, 2808, 2810 (e.g., the branches and/or paths of the hierarchy) that are currently being displayed.
- a preview navigation pane is shown (e.g., the navigation pane 2800 of Fig. 2D )
- the navigation button corresponding to the particular component actually being displayed in the graphical representation 53 may be hidden (e.g., the navigation button 2614 of Fig. 2C ).
- the top banner 2802 may also include a back button 2828 and a forward button 2830 to browse back and forth between different views that an operator has navigated through while using the navigation pane 2800. Additionally or alternatively, the top banner 2802 also includes a previous alarm button 2832 and a next alarm button 2834 to skip back and forth between pages (e.g., graphical representations 53 of the process plant within the viewport 52) that are associated with at least one process variable currently in an alarm state. Furthermore, the top banner 2802 may include an alarm filter button 2836 to reconfigure the navigation pane 2800 to only show navigation buttons associated with components that include at least one process variable under an alarm state and/or to filter the navigation pane 2800 to only show navigation buttons associated with high-criticality alarms. Additionally or alternatively, a separate sort button may be provided to sort and/or filter the navigation buttons in other manners (e.g., sort by alphabetical order, engineered order, order of severity, etc.).
- the graphic display application 30 associates each process variable alarm with a corresponding graphic trend symbol located within the graphical representation of the process plant and may aggregate each process variable alarm by alarm level priority and by hierarchical level or portion within the process plant corresponding to the location of the graphic trend symbol. For example, as shown in Fig.
- the graphic display application 30 allows the operator to quickly navigate to a particular graphic trend symbol within a portion or area of the graphical representation of the process plant by using the selector icons of the navigation pane and visually associating the portion or area of the graphical representation. Referring now to a screen shot 100 of Fig. 4 , for instance, the graphic display application 30 additionally may allow the operator to visually identify, within the P&ID, a particular unit, piece of equipment, etc. that is associated with an indicated selector icon within the navigation pane 54.
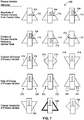
- the graphic display application 30 may implement these graphic elements 162-170 associated with the process variable attributes in retrieving or receiving the current and historical process variable values from the database 12 for a particular process variable to generate process variable data and process variable trend data.
- the graphic display application 30 generates process variable data to indicate the current values or positions of the process variable, including a magnitude of the process variable from a desired value, a position of the process variable relative to the desired value, etc.
- the graphic display application 30 generates process variable trend data to indicate the current trend of the process variable, including a rate of change of the process variable, a direction of change of the process variable, a change desirability of the process variable, etc.
- the graphic display application 30 utilizes process variable current and/or historical updates to generate and to display each graphic element that together form the graphic trend symbol.
- the position graphic value element 164 is depicted as the position of the magnitude bar, namely whether the magnitude bar of the magnitude graphic value element 164 is above, below, or at the desired value 172.
- the graphic display application 30 retrieves a current value of the process variable and desired value 172 associated with the graphic trend symbol from the database 12 and generates the position graphic value element 162 based on the current raw value in relation to the desired value 172.
- the graphical display application 30 may determine or generate the position graphic trend element 164 in any suitable manner.
- the value of the position graphic value element 164 is displayed above the desired value 172 indicating that the current process variable value is above the desired value 172.
- the direction of change graphic trend element 166 is depicted, for example, as two flanking triangles that point toward the direction of change of the process variable.
- the graphic display application 30 may create the direction of change graphic trend element 166 using any other shapes, arrows, repetitive animations, graphical indications, or any other suitable manner of indicating the rate of change of a process variable.
- the graphic display application 30 may retrieve a current and one or more historical values of the process variable associated with the graphic trend symbol from the database 12 and generate the direction of change graphic value element 166 based on the difference between the current raw value and at least one historical raw value.
- the graphical display application 30 may determine or generate the direction of change graphic trend element 166 in any suitable manner.
- the direction of change graphic trend element 166 may indicate one of a plurality of direction of change categories, in which each direction of change category is associated with a direction of change value that may include a direction toward the desired value 172, a direction away from the desired value 172, or no movement relative to the desired value 172.
- the direction of change graphic trend element 166 of Fig. 6 indicates that the process variable is moving away from the desired value 172 because process variable magnitude is increasing while the process variable position is above the desired value 172.
- Fig. 7 in the third row of the chart 200 includes several examples of this direction of change attribute via the different direction of change graph trend elements 214-218.
- the rate of change graphic trend element 168 is depicted, for example, as two marks protruding from the graph trend symbol 160.
- the graphic display application 30 may create the rate of change graphic trend element 168 using any other shapes, arrows, repetitive or flashing animations, graphical indications, or any other suitable manner of indicating the rate of change of a process variable value.
- the graphic display application 30 may retrieve a current and one or more historical values of the process variable associated with the graphic trend symbol from the database 12 and generate the rate of change graphic value element 168 based on the difference between the current raw value and at least one historical raw value and a time lapse.
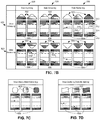
- the icons 402, 406 each contain two sections: (1) a current state section 412 that is opposite the peaks 408, 410 to visually indicate the current state of the process variable and (2) a projected state section 414 that is adjacent the peaks 408, 410 to visually indicate the projected state of the process variable.
- the icon 404 of Fig. 7A is in a generally diamond or rhombus shape (or any other suitable shape) to be distinguishable from the triangular shapes of the icons 402, 406 to visually indicate that the process variable is maintaining its present state (e.g., there is no trend upwards or downwards).
- the icons 402, 406 of Fig. 7A include exclamation points to indicate the current and projected state of the corresponding process variables
- the current and projected states in the icons 502, 504 are represented by the shading (e.g., flood fill) of the corresponding current and projected state sections.
- Other methods of indicating the operating states of the process variables may alternatively be used including different patterns, colors, shading, shapes, sizes, outlines, textual or symbolic notations, flashing, highlighting, etc.
- a normal operating state may be indicated by a gray color
- a low or high alarm state (relatively low criticality) may be indicated by a yellow color
- a low-low or a high-high alarm state (relatively high criticality) may be indicated by a red color.
- the icons 502, 504 are grouped in separate columns 526, 528, 530 based on whether the state of the process variable is improving in that it is moving towards the desired value (e.g., the set point) (column 526), worsening in that it is moving away from the set point (column 528), or maintaining in that it is in a substantially constant or steady state condition (column 530).
- the desired value e.g., the set point
- FIG. 7D While certain shapes have been described in connection with Figs. 7A-7D to indicate various characteristics (e.g., current state, projected state, trend) other suitable shapes and their corresponding orientation may alternatively be used. For examples, an arrow or other shape that indicates direction may be used in place of the icons 402, 406 of Fig. 7A and the icons 502, 504 of Fig. 7B .
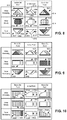
- Figs. 8-10 illustrate other example icons to indicate conditions, characteristics, trends, and/or other information associated with the process variable of the example process control system 10 of Fig. 1 .
- the illustrated examples of Figs. 8-10 show icons that emphasize current and projected states of a process variable, the direction of the process variable, and the relationship of the process variable to a set point associated with the process variable.
- Fig. 8 illustrates example triangular icons 802, 804 similar to the triangular icons 402, 406 of Fig. 7A except that the icons 802, 804 are divided into a current state section 806 and a projected state section 808 where the projected state section 808 extends along an edge adjacent a peak 810 of the triangular icons 802, 804.
- the steady state icons 812 also include two sections to provide consistency with the increasing and decreasing trend icons 802, 802 but each section 806, 808 has the same visual indicia of the operating state (e.g., shading, pattern, color, outline, textual or symbolic notation, bordering, flashing, highlighting, etc.) because a steady state implies that the projected state of an associated process variable is the same as the current state of the process variable. Accordingly, the example icons 802, 804, 812 of Fig. 8 provide the same information regarding the current and projected states of a process variable as well as the trend of the process variable as was described above in connection with Figs. 7A-7D .
- the set point indicator 814 is placed below the rest of the icons 802, 804, 812 to indicate the value of the process variable is above the set point, and the set point is positioned at the same level as the rest of the icons 802, 804, 812 to indicate when the value of the process variable is approximately at the set point. While Fig. 8 shows the set point indicator 814 behind the rest of the icons 802, 804, 810, in some examples, the set point indicator 814 is placed in front of (i.e., overlays) the rest of the icons 802, 804, 810.
- Fig. 9 illustrates icons 902, 904, 906 that function in the same way as the icons 802, 804, 810 of Fig. 8 , except that the icons 902, 904, 906 have a different shape.
- the trend identifying shape e.g., triangular shape
- the trend identifying shape of the icons 902, 904, 906 to indicate the trend or direction of the process variable is exclusively associated with the current state of the process variable, while a separate section running along a side of the triangle serves to indicate the projected state of the process variable.
- While the example icons 802, 804, 810, 902, 904, 906, 1002, 1004, 1006 of Figs. 8-10 provide some indication of the relative position of the process variable with respect to the set point (e.g., via the set point indicator 814 of Fig. 8 ), in some examples, in addition to the relative position of the process variable (i.e., above, below, or at the set point), it is desirable to indicate the relative deviation of the process variable from the set point with respect to an entire range of potential values for the process variable (e.g., how far above or below the set point). An indication of such a relative deviation of the process variable from the set point is provided in the illustrated examples of Figs. 11-17 along with other indications of conditions, characteristics, trends, and/or other information associated with process variables described more fully below.
- the dashed horizontal line in each icon 1102, 1104, 1106, 1108 is a set point indicator 1114 (e.g., a dashed line) representative of the set point relative to the range of potential values indicated by the range indicator 1110.
- the set point indicator 1114 is shown in Fig. 11 as approximately in the middle of the range indicator 1110, the set point indicator 1114 may be located at any location along the range indicator 1110 depending upon the value of the set point and the corresponding values associated with the range defined by the range indicator 1110. In this manner, an operator may immediately determine the relative position (e.g., above/below) of the process variable with respect to the set point as in Figs. 8-9 but also visually assess the relative deviation of the process variable from the set point with respect to the extreme values of the process variable within an expected range of values for the process variable represented by the line 1110 to obtain a more accurate picture of the condition of the process variable.
- an inner alarm section 1408 corresponding to a high alarm state or a low alarm state while the remaining portion of the range indicator bar 1404 corresponds to a normal operating state.
- the relative position, deviation, and distance of the process variable with respect to the set point, alarm limits, and entire operational range (as well as the current state of the process variable) is indicated in the example icon 1400 by a process variable indicator line 1410 that may move along the range bar 1404.
- the trend or direction of the process variable and, therefore, the projected state of the process variable is indicated by the direction in which an arrow marker 1412 is pointing along the range 1406.
- the mid-level graphics 1902, 1904, 1906 of Fig. 18B include the same summary information provided in the basic graphics 1808, 1810, 1812 but also add additional details.
- the mid-level graphics 1902, 1904, 1906 of the illustrated example include a parameter code or tag 1910 associated with the process variable, a set point or target value indicator 1912 for the corresponding process variable, a measured value indicator 1914 of the corresponding process variable, an output indicator 1916 associated with the corresponding process variable if appropriate (e.g., output of a control valve), and a mode indicator 1918 to indicate whether the process is under automatic or manual control.
- the graphic display application 30 generates icons representative of the condition(s), characteristic(s), and/or other information associated with the process variables.
- the generated icons may correspond to any of the icons described above in connection with Figs. 6-17 .
- the graphic display application 30 also calculates alarm summary data associated with each component within a hierarchy of components in the process control system.
- the alarm summary data corresponds to one or more of the presence of an active alarm associated with a process variable corresponding to each of the components, the number of the active alarms associated with each of the components, the current state of each of the corresponding process variables, or a projected state of each of the corresponding process variables.
- the operator interface renders a navigation pane via the display corresponding to the rendered diagram.
- the navigation pane includes navigation buttons representative of components within the hierarchy similar to any of the navigation panes described above in connection with Figs. 2A-2D .
- each navigation button may be associated with a corresponding alarm summary icon that is representative of the calculated alarm summary data (block 3406).
- the designated display area is not limited to a particular size but can vary depending upon the information requests of an operator at any particular moment. As such, in some examples, the designated display area may be greater in size than the corresponding display screen through which the designated display area is rendered such that only a portion of the designated display area is available at any given moment (e.g., by scrolling up or down). For example, rather than displaying the requested information in a detailed view 300 on a display screen, in some examples, the requested information is displayed via an interface of a portable handheld device (e.g., a smart phone, tablet, etc.) where the screen size and/or resolution is limited.
- a portable handheld device e.g., a smart phone, tablet, etc.
- the graphic display application 30 determines there is not enough space within the designated display area (block 3424)
- the graphic display application 30 adjusts the zoom of existing process variable summary pane(s) (block 3426). For example, the graphic display application 30 may reduce the existing process variable summary pane(s) to a lower level of detail and/or collapse the summary pane to only display the top banner.
- the operator interface renders the process variable summary pane with the requested information via the display (block 3428).
Landscapes
- Engineering & Computer Science (AREA)
- General Engineering & Computer Science (AREA)
- Theoretical Computer Science (AREA)
- Human Computer Interaction (AREA)
- Physics & Mathematics (AREA)
- General Physics & Mathematics (AREA)
- Automation & Control Theory (AREA)
- Testing And Monitoring For Control Systems (AREA)
- User Interface Of Digital Computer (AREA)
Priority Applications (1)
| Application Number | Priority Date | Filing Date | Title |
|---|---|---|---|
| EP21167732.3A EP3869287B1 (en) | 2013-03-15 | 2014-03-13 | Graphical process variable trend monitoring for a process control system |
Applications Claiming Priority (4)
| Application Number | Priority Date | Filing Date | Title |
|---|---|---|---|
| US201361793282P | 2013-03-15 | 2013-03-15 | |
| US13/859,714 US9983575B2 (en) | 2013-04-09 | 2013-04-09 | Systems and methods to graphically display process control system information |
| US14/207,227 US10013149B2 (en) | 2013-03-15 | 2014-03-12 | Graphical process variable trend monitoring for a process control system |
| PCT/US2014/025998 WO2014151559A2 (en) | 2013-03-15 | 2014-03-13 | Graphical process variable trend monitoring for a process control system |
Related Child Applications (2)
| Application Number | Title | Priority Date | Filing Date |
|---|---|---|---|
| EP21167732.3A Division EP3869287B1 (en) | 2013-03-15 | 2014-03-13 | Graphical process variable trend monitoring for a process control system |
| EP21167732.3A Division-Into EP3869287B1 (en) | 2013-03-15 | 2014-03-13 | Graphical process variable trend monitoring for a process control system |
Publications (2)
| Publication Number | Publication Date |
|---|---|
| EP2972625A2 EP2972625A2 (en) | 2016-01-20 |
| EP2972625B1 true EP2972625B1 (en) | 2021-05-26 |
Family
ID=50694014
Family Applications (2)
| Application Number | Title | Priority Date | Filing Date |
|---|---|---|---|
| EP14723169.0A Active EP2972625B1 (en) | 2013-03-15 | 2014-03-13 | Graphical process variable trend monitoring for a process control system |
| EP21167732.3A Active EP3869287B1 (en) | 2013-03-15 | 2014-03-13 | Graphical process variable trend monitoring for a process control system |
Family Applications After (1)
| Application Number | Title | Priority Date | Filing Date |
|---|---|---|---|
| EP21167732.3A Active EP3869287B1 (en) | 2013-03-15 | 2014-03-13 | Graphical process variable trend monitoring for a process control system |
Country Status (6)
| Country | Link |
|---|---|
| EP (2) | EP2972625B1 (enExample) |
| JP (4) | JP7071052B2 (enExample) |
| CN (2) | CN105144011B (enExample) |
| DE (2) | DE112014001472T5 (enExample) |
| GB (2) | GB2533029B (enExample) |
| WO (1) | WO2014145495A2 (enExample) |
Cited By (3)
| Publication number | Priority date | Publication date | Assignee | Title |
|---|---|---|---|---|
| EP4141590A1 (en) * | 2021-08-17 | 2023-03-01 | OMRON Corporation | Support device, support program, and control system |
| US12236086B2 (en) | 2017-12-20 | 2025-02-25 | Samsung Electronics Co., Ltd. | Local management console for storage devices |
| EP4524669A1 (de) * | 2023-09-14 | 2025-03-19 | Siemens Aktiengesellschaft | Verfahren zum bedienen und beobachten einer zu steuernden technischen anlage, bedien- und beobachtungssystem und prozessleitsystem |
Families Citing this family (23)
| Publication number | Priority date | Publication date | Assignee | Title |
|---|---|---|---|---|
| US10514668B2 (en) | 2013-03-15 | 2019-12-24 | Fisher-Rosemount Systems, Inc. | Graphical process variable trend monitoring in a process control system using a navigation pane |
| CN105144011B (zh) * | 2013-03-15 | 2019-05-28 | 费希尔-罗斯蒙特系统公司 | 用于过程控制系统的图形过程变量趋势监控 |
| US9983575B2 (en) | 2013-04-09 | 2018-05-29 | Fisher-Rosemount Systems, Inc. | Systems and methods to graphically display process control system information |
| US10013149B2 (en) | 2013-03-15 | 2018-07-03 | Fisher-Rosemount Systems, Inc. | Graphical process variable trend monitoring for a process control system |
| US10803636B2 (en) | 2013-03-15 | 2020-10-13 | Fisher-Rosemount Systems, Inc. | Graphical process variable trend monitoring, predictive analytics and fault detection in a process control system |
| US10180681B2 (en) | 2013-03-15 | 2019-01-15 | Fisher-Rosemount Systems, Inc. | Graphical process variable trend monitoring with zoom features for use in a process control system |
| JP2016038762A (ja) * | 2014-08-08 | 2016-03-22 | アズビル株式会社 | 表示装置 |
| JP7227002B2 (ja) * | 2015-10-09 | 2023-02-21 | フィッシャー-ローズマウント システムズ,インコーポレイテッド | プロセス制御システムの安全イベントの視覚化を経時的に提供するためのシステム及び方法 |
| US10579217B2 (en) * | 2016-09-13 | 2020-03-03 | Honeywell International Inc. | System and method for presenting a customizable graphical view of a system status to identify system failures |
| US10222787B2 (en) | 2016-09-16 | 2019-03-05 | Uop Llc | Interactive petrochemical plant diagnostic system and method for chemical process model analysis |
| US11543805B2 (en) | 2016-10-17 | 2023-01-03 | Fisher-Rosemount Systems, Inc. | Systems and apparatus for distribution of process control data to remote devices |
| DE102017102992A1 (de) | 2017-02-15 | 2018-08-16 | Sig Technology Ag | Ein mit einer Verpackungsanlage assoziierter Graph |
| DE102017204980B3 (de) * | 2017-03-24 | 2018-06-21 | Ifm Electronic Gmbh | Anzeigeeinheit für ein Messgerät der Prozess- und Automatisierungstechnik und Messgerät mit einer solchen Anzeigeeinheit |
| DE102017108546A1 (de) * | 2017-04-21 | 2018-10-25 | Sig Technology Ag | Produktionsparameterverlaufsansicht als Teil einer Benutzeroberfläche zum Überwachen und/oder Steuern einer Verpackungsanlage |
| US10169979B2 (en) * | 2017-05-04 | 2019-01-01 | General Electric Company | Communicating alarm trigger status |
| US10788972B2 (en) * | 2017-10-02 | 2020-09-29 | Fisher-Rosemount Systems, Inc. | Systems and methods for automatically populating a display area with historized process parameters |
| EP3480672B1 (de) * | 2017-11-06 | 2020-02-19 | Siemens Aktiengesellschaft | Verfahren zum erkennen und anzeigen von operator-zugriffen auf prozessobjekte sowie operator-system |
| CN109542720B (zh) * | 2018-10-29 | 2022-03-04 | 北京控制工程研究所 | 一种基于注册机制的星上环境变量统一监管方法 |
| JP7309548B2 (ja) * | 2019-09-17 | 2023-07-18 | 株式会社東芝 | 異常予兆検知装置、方法及びプログラム |
| US11249628B2 (en) * | 2019-09-17 | 2022-02-15 | Fisher-Rosemount Systems, Inc. | Graphical user interface (GUI) systems and methods for refactoring full-size process plant displays at various zoom and detail levels for visualization on mobile user interface devices |
| EP4280003A1 (de) * | 2022-05-17 | 2023-11-22 | Siemens Aktiengesellschaft | Leitsystem für eine technische anlage |
| KR20250055866A (ko) | 2023-10-18 | 2025-04-25 | 삼성중공업 주식회사 | 도면 생성 장치 및 컴포넌트 연결선 최적화 방법 |
| CN121213716A (zh) * | 2025-09-24 | 2025-12-26 | 北京和利时控制技术有限公司 | 生成小趋势画面的方法、装置、计算机存储介质及终端 |
Family Cites Families (25)
| Publication number | Priority date | Publication date | Assignee | Title |
|---|---|---|---|---|
| JPS61101812A (ja) * | 1984-10-24 | 1986-05-20 | Toshiba Corp | プラント状態表示装置 |
| JPH021516A (ja) * | 1989-02-13 | 1990-01-05 | Hitachi Ltd | 状態量表示装置 |
| JPH04268413A (ja) * | 1991-02-22 | 1992-09-24 | Hitachi Ltd | プラント診断結果表示方法 |
| JPH06231380A (ja) * | 1993-02-03 | 1994-08-19 | Toshiba Corp | プロセス表示装置 |
| US5631825A (en) * | 1993-09-29 | 1997-05-20 | Dow Benelux N.V. | Operator station for manufacturing process control system |
| JP3763859B2 (ja) * | 1995-02-17 | 2006-04-05 | 株式会社東芝 | プラント監視装置 |
| JPH10232140A (ja) * | 1997-02-20 | 1998-09-02 | Nissan Motor Co Ltd | 表示可変メータ |
| JP3378801B2 (ja) * | 1998-05-22 | 2003-02-17 | シャープ株式会社 | 情報処理装置 |
| JPH11338541A (ja) * | 1998-05-29 | 1999-12-10 | Toshiba Corp | プラント情報収集表示装置 |
| US6577323B1 (en) * | 1999-07-01 | 2003-06-10 | Honeywell Inc. | Multivariable process trend display and methods regarding same |
| US6421571B1 (en) * | 2000-02-29 | 2002-07-16 | Bently Nevada Corporation | Industrial plant asset management system: apparatus and method |
| JP2002082717A (ja) * | 2000-09-05 | 2002-03-22 | Ishikawajima Harima Heavy Ind Co Ltd | プラント運転監視支援装置及び運転監視支援情報の提供方法 |
| US7634384B2 (en) * | 2003-03-18 | 2009-12-15 | Fisher-Rosemount Systems, Inc. | Asset optimization reporting in a process plant |
| JP2007536634A (ja) * | 2004-05-04 | 2007-12-13 | フィッシャー−ローズマウント・システムズ・インコーポレーテッド | プロセス制御システムのためのサービス指向型アーキテクチャ |
| US20070135944A1 (en) * | 2005-12-12 | 2007-06-14 | Schmid James J | Method, apparatus and computer program product for providing status of a process |
| US20070239291A1 (en) * | 2006-04-11 | 2007-10-11 | Invensys Systems, Inc. | Runtime human-machine interface for process control having enhanced view hierarchy navigation controls |
| US8886553B2 (en) * | 2006-05-02 | 2014-11-11 | Microsoft Corporation | Visual workflow process notation and layout |
| US8108790B2 (en) * | 2007-03-26 | 2012-01-31 | Honeywell International Inc. | Apparatus and method for visualization of control techniques in a process control system |
| US8555206B2 (en) * | 2007-12-21 | 2013-10-08 | Fisher-Rosemount Systems, Inc. | Methods and apparatus to present recipe progress status information |
| US20100017743A1 (en) * | 2008-06-19 | 2010-01-21 | Emerson Network Power - Embedded Computing, Inc. | Graphical User Interface |
| JP5174956B2 (ja) * | 2009-04-20 | 2013-04-03 | 三菱電機株式会社 | プラント運転支援装置 |
| US9557735B2 (en) * | 2009-12-10 | 2017-01-31 | Fisher-Rosemount Systems, Inc. | Methods and apparatus to manage process control status rollups |
| US8589814B2 (en) * | 2010-04-16 | 2013-11-19 | Honeywell International Inc. | System and method for visual presentation of information in a process control system |
| US8717374B2 (en) * | 2010-09-13 | 2014-05-06 | Fisher-Rosemount Systems, Inc. | Methods and apparatus to display process control information |
| CN105144011B (zh) * | 2013-03-15 | 2019-05-28 | 费希尔-罗斯蒙特系统公司 | 用于过程控制系统的图形过程变量趋势监控 |
-
2014
- 2014-03-13 CN CN201480014886.3A patent/CN105144011B/zh active Active
- 2014-03-13 JP JP2016502019A patent/JP7071052B2/ja active Active
- 2014-03-13 EP EP14723169.0A patent/EP2972625B1/en active Active
- 2014-03-13 EP EP21167732.3A patent/EP3869287B1/en active Active
- 2014-03-13 DE DE112014001472.9T patent/DE112014001472T5/de active Pending
- 2014-03-17 GB GB1517667.0A patent/GB2533029B/en active Active
- 2014-03-17 GB GB2012759.3A patent/GB2585147B/en active Active
- 2014-03-17 WO PCT/US2014/030278 patent/WO2014145495A2/en not_active Ceased
- 2014-03-17 CN CN201480013991.5A patent/CN105190460B/zh active Active
- 2014-03-17 DE DE112014001390.0T patent/DE112014001390T5/de active Pending
- 2014-03-17 JP JP2016503366A patent/JP2016520893A/ja active Pending
-
2020
- 2020-05-14 JP JP2020085124A patent/JP7189174B2/ja active Active
-
2022
- 2022-01-31 JP JP2022013308A patent/JP2022051805A/ja active Pending
Non-Patent Citations (1)
| Title |
|---|
| None * |
Cited By (4)
| Publication number | Priority date | Publication date | Assignee | Title |
|---|---|---|---|---|
| US12236086B2 (en) | 2017-12-20 | 2025-02-25 | Samsung Electronics Co., Ltd. | Local management console for storage devices |
| EP4141590A1 (en) * | 2021-08-17 | 2023-03-01 | OMRON Corporation | Support device, support program, and control system |
| US12443159B2 (en) | 2021-08-17 | 2025-10-14 | Omron Corporation | Support device monitoring function blocks of user program, non-transitory storage medium storing support program thereon, and control system |
| EP4524669A1 (de) * | 2023-09-14 | 2025-03-19 | Siemens Aktiengesellschaft | Verfahren zum bedienen und beobachten einer zu steuernden technischen anlage, bedien- und beobachtungssystem und prozessleitsystem |
Also Published As
| Publication number | Publication date |
|---|---|
| JP7189174B2 (ja) | 2022-12-13 |
| WO2014145495A3 (en) | 2014-11-06 |
| CN105144011B (zh) | 2019-05-28 |
| JP2016520893A (ja) | 2016-07-14 |
| CN105190460A (zh) | 2015-12-23 |
| CN105190460B (zh) | 2019-03-08 |
| CN105144011A (zh) | 2015-12-09 |
| JP2016517582A (ja) | 2016-06-16 |
| JP7071052B2 (ja) | 2022-05-18 |
| DE112014001472T5 (de) | 2015-12-17 |
| GB2533029B (en) | 2021-03-10 |
| EP3869287B1 (en) | 2025-04-30 |
| DE112014001390T5 (de) | 2015-12-03 |
| GB2585147A (en) | 2020-12-30 |
| JP2022051805A (ja) | 2022-04-01 |
| GB202012759D0 (en) | 2020-09-30 |
| JP2020129403A (ja) | 2020-08-27 |
| EP2972625A2 (en) | 2016-01-20 |
| GB2585147B (en) | 2021-06-30 |
| GB2533029A (en) | 2016-06-08 |
| GB201517667D0 (en) | 2015-11-18 |
| EP3869287A1 (en) | 2021-08-25 |
| WO2014145495A2 (en) | 2014-09-18 |
Similar Documents
| Publication | Publication Date | Title |
|---|---|---|
| EP2972622B1 (en) | Graphical process variable trend monitoring for use in a process control system | |
| EP2972625B1 (en) | Graphical process variable trend monitoring for a process control system | |
| US10013149B2 (en) | Graphical process variable trend monitoring for a process control system | |
| US10514668B2 (en) | Graphical process variable trend monitoring in a process control system using a navigation pane | |
| EP3156871B1 (en) | Graphical process variable trend monitoring, predictive analytics and fault detection in a process control system | |
| US10803636B2 (en) | Graphical process variable trend monitoring, predictive analytics and fault detection in a process control system | |
| JP6397476B2 (ja) | ナビゲーションペインを提供する方法及びコンピュータ可読記憶媒体 | |
| US9983575B2 (en) | Systems and methods to graphically display process control system information | |
| US8756035B2 (en) | Visualization employing heat maps to convey quality, prognostics, or diagnostics information | |
| JP6538024B2 (ja) | プロセス変数ペインを提供する方法及びコンピュータ可読記憶媒体 |
Legal Events
| Date | Code | Title | Description |
|---|---|---|---|
| PUAI | Public reference made under article 153(3) epc to a published international application that has entered the european phase |
Free format text: ORIGINAL CODE: 0009012 |
|
| 17P | Request for examination filed |
Effective date: 20151007 |
|
| AK | Designated contracting states |
Kind code of ref document: A2 Designated state(s): AL AT BE BG CH CY CZ DE DK EE ES FI FR GB GR HR HU IE IS IT LI LT LU LV MC MK MT NL NO PL PT RO RS SE SI SK SM TR |
|
| AX | Request for extension of the european patent |
Extension state: BA ME |
|
| DAX | Request for extension of the european patent (deleted) | ||
| STAA | Information on the status of an ep patent application or granted ep patent |
Free format text: STATUS: EXAMINATION IS IN PROGRESS |
|
| 17Q | First examination report despatched |
Effective date: 20171220 |
|
| GRAP | Despatch of communication of intention to grant a patent |
Free format text: ORIGINAL CODE: EPIDOSNIGR1 |
|
| STAA | Information on the status of an ep patent application or granted ep patent |
Free format text: STATUS: GRANT OF PATENT IS INTENDED |
|
| INTG | Intention to grant announced |
Effective date: 20201209 |
|
| GRAS | Grant fee paid |
Free format text: ORIGINAL CODE: EPIDOSNIGR3 |
|
| GRAA | (expected) grant |
Free format text: ORIGINAL CODE: 0009210 |
|
| STAA | Information on the status of an ep patent application or granted ep patent |
Free format text: STATUS: THE PATENT HAS BEEN GRANTED |
|
| AK | Designated contracting states |
Kind code of ref document: B1 Designated state(s): AL AT BE BG CH CY CZ DE DK EE ES FI FR GB GR HR HU IE IS IT LI LT LU LV MC MK MT NL NO PL PT RO RS SE SI SK SM TR |
|
| REG | Reference to a national code |
Ref country code: GB Ref legal event code: FG4D |
|
| REG | Reference to a national code |
Ref country code: CH Ref legal event code: EP |
|
| REG | Reference to a national code |
Ref country code: AT Ref legal event code: REF Ref document number: 1396847 Country of ref document: AT Kind code of ref document: T Effective date: 20210615 |
|
| REG | Reference to a national code |
Ref country code: DE Ref legal event code: R096 Ref document number: 602014077702 Country of ref document: DE |
|
| REG | Reference to a national code |
Ref country code: IE Ref legal event code: FG4D |
|
| REG | Reference to a national code |
Ref country code: LT Ref legal event code: MG9D |
|
| REG | Reference to a national code |
Ref country code: AT Ref legal event code: MK05 Ref document number: 1396847 Country of ref document: AT Kind code of ref document: T Effective date: 20210526 |
|
| PG25 | Lapsed in a contracting state [announced via postgrant information from national office to epo] |
Ref country code: AT Free format text: LAPSE BECAUSE OF FAILURE TO SUBMIT A TRANSLATION OF THE DESCRIPTION OR TO PAY THE FEE WITHIN THE PRESCRIBED TIME-LIMIT Effective date: 20210526 Ref country code: BG Free format text: LAPSE BECAUSE OF FAILURE TO SUBMIT A TRANSLATION OF THE DESCRIPTION OR TO PAY THE FEE WITHIN THE PRESCRIBED TIME-LIMIT Effective date: 20210826 Ref country code: FI Free format text: LAPSE BECAUSE OF FAILURE TO SUBMIT A TRANSLATION OF THE DESCRIPTION OR TO PAY THE FEE WITHIN THE PRESCRIBED TIME-LIMIT Effective date: 20210526 Ref country code: LT Free format text: LAPSE BECAUSE OF FAILURE TO SUBMIT A TRANSLATION OF THE DESCRIPTION OR TO PAY THE FEE WITHIN THE PRESCRIBED TIME-LIMIT Effective date: 20210526 Ref country code: HR Free format text: LAPSE BECAUSE OF FAILURE TO SUBMIT A TRANSLATION OF THE DESCRIPTION OR TO PAY THE FEE WITHIN THE PRESCRIBED TIME-LIMIT Effective date: 20210526 |
|
| REG | Reference to a national code |
Ref country code: NL Ref legal event code: MP Effective date: 20210526 |
|
| PG25 | Lapsed in a contracting state [announced via postgrant information from national office to epo] |
Ref country code: LV Free format text: LAPSE BECAUSE OF FAILURE TO SUBMIT A TRANSLATION OF THE DESCRIPTION OR TO PAY THE FEE WITHIN THE PRESCRIBED TIME-LIMIT Effective date: 20210526 Ref country code: GR Free format text: LAPSE BECAUSE OF FAILURE TO SUBMIT A TRANSLATION OF THE DESCRIPTION OR TO PAY THE FEE WITHIN THE PRESCRIBED TIME-LIMIT Effective date: 20210827 Ref country code: IS Free format text: LAPSE BECAUSE OF FAILURE TO SUBMIT A TRANSLATION OF THE DESCRIPTION OR TO PAY THE FEE WITHIN THE PRESCRIBED TIME-LIMIT Effective date: 20210926 Ref country code: PT Free format text: LAPSE BECAUSE OF FAILURE TO SUBMIT A TRANSLATION OF THE DESCRIPTION OR TO PAY THE FEE WITHIN THE PRESCRIBED TIME-LIMIT Effective date: 20210927 Ref country code: NO Free format text: LAPSE BECAUSE OF FAILURE TO SUBMIT A TRANSLATION OF THE DESCRIPTION OR TO PAY THE FEE WITHIN THE PRESCRIBED TIME-LIMIT Effective date: 20210826 Ref country code: PL Free format text: LAPSE BECAUSE OF FAILURE TO SUBMIT A TRANSLATION OF THE DESCRIPTION OR TO PAY THE FEE WITHIN THE PRESCRIBED TIME-LIMIT Effective date: 20210526 Ref country code: RS Free format text: LAPSE BECAUSE OF FAILURE TO SUBMIT A TRANSLATION OF THE DESCRIPTION OR TO PAY THE FEE WITHIN THE PRESCRIBED TIME-LIMIT Effective date: 20210526 Ref country code: SE Free format text: LAPSE BECAUSE OF FAILURE TO SUBMIT A TRANSLATION OF THE DESCRIPTION OR TO PAY THE FEE WITHIN THE PRESCRIBED TIME-LIMIT Effective date: 20210526 |
|
| PG25 | Lapsed in a contracting state [announced via postgrant information from national office to epo] |
Ref country code: NL Free format text: LAPSE BECAUSE OF FAILURE TO SUBMIT A TRANSLATION OF THE DESCRIPTION OR TO PAY THE FEE WITHIN THE PRESCRIBED TIME-LIMIT Effective date: 20210526 |
|
| PG25 | Lapsed in a contracting state [announced via postgrant information from national office to epo] |
Ref country code: EE Free format text: LAPSE BECAUSE OF FAILURE TO SUBMIT A TRANSLATION OF THE DESCRIPTION OR TO PAY THE FEE WITHIN THE PRESCRIBED TIME-LIMIT Effective date: 20210526 Ref country code: CZ Free format text: LAPSE BECAUSE OF FAILURE TO SUBMIT A TRANSLATION OF THE DESCRIPTION OR TO PAY THE FEE WITHIN THE PRESCRIBED TIME-LIMIT Effective date: 20210526 Ref country code: DK Free format text: LAPSE BECAUSE OF FAILURE TO SUBMIT A TRANSLATION OF THE DESCRIPTION OR TO PAY THE FEE WITHIN THE PRESCRIBED TIME-LIMIT Effective date: 20210526 Ref country code: SK Free format text: LAPSE BECAUSE OF FAILURE TO SUBMIT A TRANSLATION OF THE DESCRIPTION OR TO PAY THE FEE WITHIN THE PRESCRIBED TIME-LIMIT Effective date: 20210526 Ref country code: SM Free format text: LAPSE BECAUSE OF FAILURE TO SUBMIT A TRANSLATION OF THE DESCRIPTION OR TO PAY THE FEE WITHIN THE PRESCRIBED TIME-LIMIT Effective date: 20210526 Ref country code: ES Free format text: LAPSE BECAUSE OF FAILURE TO SUBMIT A TRANSLATION OF THE DESCRIPTION OR TO PAY THE FEE WITHIN THE PRESCRIBED TIME-LIMIT Effective date: 20210526 Ref country code: RO Free format text: LAPSE BECAUSE OF FAILURE TO SUBMIT A TRANSLATION OF THE DESCRIPTION OR TO PAY THE FEE WITHIN THE PRESCRIBED TIME-LIMIT Effective date: 20210526 |
|
| REG | Reference to a national code |
Ref country code: DE Ref legal event code: R097 Ref document number: 602014077702 Country of ref document: DE |
|
| PLBE | No opposition filed within time limit |
Free format text: ORIGINAL CODE: 0009261 |
|
| STAA | Information on the status of an ep patent application or granted ep patent |
Free format text: STATUS: NO OPPOSITION FILED WITHIN TIME LIMIT |
|
| 26N | No opposition filed |
Effective date: 20220301 |
|
| PG25 | Lapsed in a contracting state [announced via postgrant information from national office to epo] |
Ref country code: IS Free format text: LAPSE BECAUSE OF FAILURE TO SUBMIT A TRANSLATION OF THE DESCRIPTION OR TO PAY THE FEE WITHIN THE PRESCRIBED TIME-LIMIT Effective date: 20210926 Ref country code: AL Free format text: LAPSE BECAUSE OF FAILURE TO SUBMIT A TRANSLATION OF THE DESCRIPTION OR TO PAY THE FEE WITHIN THE PRESCRIBED TIME-LIMIT Effective date: 20210526 |
|
| PG25 | Lapsed in a contracting state [announced via postgrant information from national office to epo] |
Ref country code: IT Free format text: LAPSE BECAUSE OF FAILURE TO SUBMIT A TRANSLATION OF THE DESCRIPTION OR TO PAY THE FEE WITHIN THE PRESCRIBED TIME-LIMIT Effective date: 20210526 |
|
| PG25 | Lapsed in a contracting state [announced via postgrant information from national office to epo] |
Ref country code: MC Free format text: LAPSE BECAUSE OF FAILURE TO SUBMIT A TRANSLATION OF THE DESCRIPTION OR TO PAY THE FEE WITHIN THE PRESCRIBED TIME-LIMIT Effective date: 20210526 |
|
| REG | Reference to a national code |
Ref country code: CH Ref legal event code: PL |
|
| REG | Reference to a national code |
Ref country code: BE Ref legal event code: MM Effective date: 20220331 |
|
| REG | Reference to a national code |
Ref country code: DE Ref legal event code: R082 Ref document number: 602014077702 Country of ref document: DE Representative=s name: FORRESTERS IP LLP, DE Ref country code: DE Ref legal event code: R082 Ref document number: 602014077702 Country of ref document: DE Representative=s name: KUEHR, VERA, DIPL.-BIOL., DE |
|
| PG25 | Lapsed in a contracting state [announced via postgrant information from national office to epo] |
Ref country code: LU Free format text: LAPSE BECAUSE OF NON-PAYMENT OF DUE FEES Effective date: 20220313 Ref country code: LI Free format text: LAPSE BECAUSE OF NON-PAYMENT OF DUE FEES Effective date: 20220331 Ref country code: IE Free format text: LAPSE BECAUSE OF NON-PAYMENT OF DUE FEES Effective date: 20220313 Ref country code: FR Free format text: LAPSE BECAUSE OF NON-PAYMENT OF DUE FEES Effective date: 20220331 Ref country code: CH Free format text: LAPSE BECAUSE OF NON-PAYMENT OF DUE FEES Effective date: 20220331 |
|
| PG25 | Lapsed in a contracting state [announced via postgrant information from national office to epo] |
Ref country code: BE Free format text: LAPSE BECAUSE OF NON-PAYMENT OF DUE FEES Effective date: 20220331 |
|
| P01 | Opt-out of the competence of the unified patent court (upc) registered |
Effective date: 20230526 |
|
| REG | Reference to a national code |
Ref country code: DE Ref legal event code: R082 Ref document number: 602014077702 Country of ref document: DE Representative=s name: FORRESTERS IP LLP, DE |
|
| PG25 | Lapsed in a contracting state [announced via postgrant information from national office to epo] |
Ref country code: HU Free format text: LAPSE BECAUSE OF FAILURE TO SUBMIT A TRANSLATION OF THE DESCRIPTION OR TO PAY THE FEE WITHIN THE PRESCRIBED TIME-LIMIT; INVALID AB INITIO Effective date: 20140313 |
|
| PG25 | Lapsed in a contracting state [announced via postgrant information from national office to epo] |
Ref country code: MK Free format text: LAPSE BECAUSE OF FAILURE TO SUBMIT A TRANSLATION OF THE DESCRIPTION OR TO PAY THE FEE WITHIN THE PRESCRIBED TIME-LIMIT Effective date: 20210526 Ref country code: CY Free format text: LAPSE BECAUSE OF FAILURE TO SUBMIT A TRANSLATION OF THE DESCRIPTION OR TO PAY THE FEE WITHIN THE PRESCRIBED TIME-LIMIT Effective date: 20210526 |
|
| PG25 | Lapsed in a contracting state [announced via postgrant information from national office to epo] |
Ref country code: MT Free format text: LAPSE BECAUSE OF FAILURE TO SUBMIT A TRANSLATION OF THE DESCRIPTION OR TO PAY THE FEE WITHIN THE PRESCRIBED TIME-LIMIT Effective date: 20210526 |
|
| PG25 | Lapsed in a contracting state [announced via postgrant information from national office to epo] |
Ref country code: TR Free format text: LAPSE BECAUSE OF FAILURE TO SUBMIT A TRANSLATION OF THE DESCRIPTION OR TO PAY THE FEE WITHIN THE PRESCRIBED TIME-LIMIT Effective date: 20210526 |
|
| PGFP | Annual fee paid to national office [announced via postgrant information from national office to epo] |
Ref country code: GB Payment date: 20260220 Year of fee payment: 13 |
|
| PGFP | Annual fee paid to national office [announced via postgrant information from national office to epo] |
Ref country code: DE Payment date: 20260219 Year of fee payment: 13 |