EP2833123A1 - Medizinischer bildprozessor und programm - Google Patents
Medizinischer bildprozessor und programm Download PDFInfo
- Publication number
- EP2833123A1 EP2833123A1 EP13767991.6A EP13767991A EP2833123A1 EP 2833123 A1 EP2833123 A1 EP 2833123A1 EP 13767991 A EP13767991 A EP 13767991A EP 2833123 A1 EP2833123 A1 EP 2833123A1
- Authority
- EP
- European Patent Office
- Prior art keywords
- image
- fluorescent
- cell
- feature amount
- bright point
- Prior art date
- Legal status (The legal status is an assumption and is not a legal conclusion. Google has not performed a legal analysis and makes no representation as to the accuracy of the status listed.)
- Ceased
Links
Images


Classifications
-
- G—PHYSICS
- G01—MEASURING; TESTING
- G01N—INVESTIGATING OR ANALYSING MATERIALS BY DETERMINING THEIR CHEMICAL OR PHYSICAL PROPERTIES
- G01N21/00—Investigating or analysing materials by the use of optical means, i.e. using sub-millimetre waves, infrared, visible or ultraviolet light
- G01N21/62—Systems in which the material investigated is excited whereby it emits light or causes a change in wavelength of the incident light
- G01N21/63—Systems in which the material investigated is excited whereby it emits light or causes a change in wavelength of the incident light optically excited
- G01N21/64—Fluorescence; Phosphorescence
- G01N21/645—Specially adapted constructive features of fluorimeters
- G01N21/6456—Spatial resolved fluorescence measurements; Imaging
-
- G—PHYSICS
- G06—COMPUTING; CALCULATING OR COUNTING
- G06T—IMAGE DATA PROCESSING OR GENERATION, IN GENERAL
- G06T7/00—Image analysis
- G06T7/0002—Inspection of images, e.g. flaw detection
- G06T7/0012—Biomedical image inspection
-
- G—PHYSICS
- G06—COMPUTING; CALCULATING OR COUNTING
- G06V—IMAGE OR VIDEO RECOGNITION OR UNDERSTANDING
- G06V20/00—Scenes; Scene-specific elements
- G06V20/60—Type of objects
- G06V20/69—Microscopic objects, e.g. biological cells or cellular parts
- G06V20/695—Preprocessing, e.g. image segmentation
-
- G—PHYSICS
- G01—MEASURING; TESTING
- G01N—INVESTIGATING OR ANALYSING MATERIALS BY DETERMINING THEIR CHEMICAL OR PHYSICAL PROPERTIES
- G01N21/00—Investigating or analysing materials by the use of optical means, i.e. using sub-millimetre waves, infrared, visible or ultraviolet light
- G01N21/62—Systems in which the material investigated is excited whereby it emits light or causes a change in wavelength of the incident light
- G01N21/63—Systems in which the material investigated is excited whereby it emits light or causes a change in wavelength of the incident light optically excited
- G01N21/64—Fluorescence; Phosphorescence
- G01N21/645—Specially adapted constructive features of fluorimeters
- G01N21/6456—Spatial resolved fluorescence measurements; Imaging
- G01N21/6458—Fluorescence microscopy
-
- G—PHYSICS
- G06—COMPUTING; CALCULATING OR COUNTING
- G06T—IMAGE DATA PROCESSING OR GENERATION, IN GENERAL
- G06T2207/00—Indexing scheme for image analysis or image enhancement
- G06T2207/10—Image acquisition modality
- G06T2207/10064—Fluorescence image
-
- G—PHYSICS
- G06—COMPUTING; CALCULATING OR COUNTING
- G06T—IMAGE DATA PROCESSING OR GENERATION, IN GENERAL
- G06T2207/00—Indexing scheme for image analysis or image enhancement
- G06T2207/20—Special algorithmic details
- G06T2207/20021—Dividing image into blocks, subimages or windows
-
- G—PHYSICS
- G06—COMPUTING; CALCULATING OR COUNTING
- G06T—IMAGE DATA PROCESSING OR GENERATION, IN GENERAL
- G06T2207/00—Indexing scheme for image analysis or image enhancement
- G06T2207/20—Special algorithmic details
- G06T2207/20092—Interactive image processing based on input by user
- G06T2207/20104—Interactive definition of region of interest [ROI]
-
- G—PHYSICS
- G06—COMPUTING; CALCULATING OR COUNTING
- G06T—IMAGE DATA PROCESSING OR GENERATION, IN GENERAL
- G06T2207/00—Indexing scheme for image analysis or image enhancement
- G06T2207/20—Special algorithmic details
- G06T2207/20212—Image combination
- G06T2207/20221—Image fusion; Image merging
-
- G—PHYSICS
- G06—COMPUTING; CALCULATING OR COUNTING
- G06T—IMAGE DATA PROCESSING OR GENERATION, IN GENERAL
- G06T2207/00—Indexing scheme for image analysis or image enhancement
- G06T2207/30—Subject of image; Context of image processing
- G06T2207/30004—Biomedical image processing
- G06T2207/30024—Cell structures in vitro; Tissue sections in vitro
-
- G—PHYSICS
- G06—COMPUTING; CALCULATING OR COUNTING
- G06T—IMAGE DATA PROCESSING OR GENERATION, IN GENERAL
- G06T2207/00—Indexing scheme for image analysis or image enhancement
- G06T2207/30—Subject of image; Context of image processing
- G06T2207/30004—Biomedical image processing
- G06T2207/30096—Tumor; Lesion
Definitions
- the cell shape image and the fluorescent image compose one image which show the shape of the cell in the tissue slice and the expression of the specific protein in the tissue slice as the fluorescent bright point.
- the shape of the cell in the tissue slice appears.
- the cell nucleus is shown with a darker color than the surrounding cytoplasm (blue purple color) to be distinguished from the surrounding portion, and in the bright field image, it is possible to clearly see the shape of the cell nucleus.
- the fluorescent substance used in the staining reagent to obtain the fluorescent image examples include, fluorescent organic dye and quantum dot (semiconductor particle).
- the substance shows an emission of visible rays to near infrared rays with a wavelength within the range of 400 to 1100 nm when excited by ultraviolet rays to near infrared rays with a wavelength within the range of 200 to 700 nm.
- the material composing the nanoparticle is not limited and examples include polystyrene, polyactate, silica, and the like.
- the silica nanoparticle including the quantum dot can be synthesized by referring to synthesizing of the CdTe included silica nanoparticle as described in New Journal of Chemistry, Volume 33, page 561 (2009 ).
- the average particle diameter of the fluorescent substance included nanoparticle used in the present embodiment is not limited, and the fluorescent substance included nanoparticle with an average particle diameter with about 30 to 800 nm can be used.
- the electronic microscopic picture is captured using the scanning electron microscope (SEM), and the cross sectional area of a sufficient number of particles is measured.
- the diameter of the circle when each measurement value is to be the area of the circle is obtained as the particle diameter.
- the calculated average of the particle diameter of 1000 particles is to be the average particle diameter.
- the variation coefficient is to be a value calculated from the particle diameter distribution of 1000 particles.
- anti HER2 antibody which specifically bonds with the HER2 which is a protein on the surface of the cell
- anti ER antibody which specifically bonds with the estrogen receptor (ER) on the cell nucleus
- anti actin antibody which specifically bonds with the actin forming the cytoskeleton, and the like.
- anti HER2 antibody and anti ER antibody bonded to the fluorescent substance included nanoparticle are preferable because the above can be used in selecting medication for breast cancer.
- an organic molecule which connects the biological substance recognition site with the fluorescent substance included nanoparticle.
- a polyethyleneglycol chain can be used and SM (PEG)12 by Thermo Scientific can be used.
- the reaction method between the fluorescent organic dye including silica nanoparticle and the silane coupling agent can be used as the reaction method between the fluorescent organic dye including silica nanoparticle and the silane coupling agent.
- the obtained fluorescent organic dye included silica nanoparticle can be dispersed in pure water, the aminopropyl triethoxysilane can be added and the above can be reacted in room temperature for 12 hours. After the reaction ends, by centrifugal separation or filtration, it is possible to obtain a fluorescent organic dye included silica nanoparticle modified with the aminopropyl group. Next, the amino group is reacted with the carboxy group in the antibody so that the antibody can bond with the fluorescent organic dye included silica nanoparticle through amide bonding.
- condensing agent such as EDC (1-Ethyl-3-[3-Dimethylaminopropyl]carbodiimide Hydrochloride: Pierce (Registered Trademark) can also be used.
- a linker compound including a portion which can directly bond with the fluorescent organic dye included silica nanoparticle modified with the organic molecule and a portion which can bond with the molecule target substance can be used.
- sulfo-SMCC Sulfosuccinimidyl 4[N-maleimidomethyl]-cyclohexane-1-carboxylate:Pierce
- the amino group of the fluorescent organic dye included silica nanoparticle modified with aminopropyl triethoxysilane and the mercapto group in the antibody are bonded, and with this, the fluorescent organic dye included silica nanoparticle bonded with the antibody is made.
- Examples of the antibody which recognizes the specific antigen include the following, M. actin, M.S. actin, S.M. actin, ACTH, Alk-1, ⁇ 1-antichymotrypsin, ⁇ 1-antitrypsin, AFP, bcl-2, bcl-6, ⁇ -catenin, BCA 225, CA19-9, CA125, calcitonin, calretinin, CD1a, CD3, CD4, CD5, CD8, CD10, CD15, CD20, CD21, CD23, CD30, CD31, CD34, CD43, CD45, CD45R, CD56, CD57, CD61, CD68, CD79a, "CD99, MIC2", CD138, chromogranin, c-KIT, C-MET, collagen type IV, Cox-2, cyclin D1, keratin, cytokeratin (high molecular mass), pankeratin, pankeratin, cytokeratin 5/6, cytokeratin 7, cyto
- the staining method described below is not limited to a pathological slice of tissue, and can be applied to staining cells.
- the method of creating the slice to which the staining method described below can be applied is not limited, and the slice which is made by well-known methods can be used.
- the pathological slice is immersed in a container with water, and the ethanol is removed.
- the temperature is not limited, and the processing can be performed at room temperature.
- the immersing time is 3 minutes or more to 30 minutes or less.
- the water can be changed during the immersion as necessary.
- Activating processing of the target biological substance is performed according to well-known methods.
- the activating conditions are not specifically set, examples of activating liquid that can be used include, 0.01M citric acid buffered solution (pH 6.0), 1m MEDTA solution (pH 8.0), 5% urea, 0.1M tris-hydrochloric acid buffered solution.
- Examples of the heating device that can be used include autoclave, microwave, pressure pan, water bath, etc.
- the temperature is not limited, and the processing can be performed at room temperature.
- the processing can be performed at a temperature of 50 to 130°C and the amount of time that the processing is performed can be 5 to 30 minutes.
- the slice after activating processing is immersed in the container with PBS (Phosphate Buffered Saline), and cleaning is performed.
- PBS Phosphate Buffered Saline
- the temperature is not limited, and the processing can be performed at room temperature.
- the immersing time is 3 minutes or more to 30 minutes or less.
- the PBS can be changed during the immersion as necessary.
- the PBS dispersion liquid of the fluorescent substance included nanoparticle bonded with the biological substance recognition site is placed on the pathological slice and reacted with the target biological substance.
- staining can be applied to various biological substances.
- the fluorescent substance included nanoparticle bonded with plural types of biological substance recognition sites is used, the fluorescent substance included nanoparticle PBS dispersion liquid of each of the above can be mixed in advance, or the liquid can be sequentially placed on the pathological slice separately.
- the HE staining is performed before sealing with the cover glass.
- nanoparticle 1 a Cy5 included silica nanoparticle (hereinafter referred to as nanoparticle 1) as one embodiment, and an indicator material A bonded with an anti HER2 antibody against the nanoparticle 1.
- nanoparticle 2 a CdSe/ZnS included silica nanoparticle (hereinafter referred to as nanoparticle 2) is made and an indicator material B bonded with an anti HER2 antibody is made with a nanoparticle 2.
- an adjacent slice of the human breast tissue in which the FISH score is measured in advance is used to perform immunostaining, a plurality of fluorescent images with different fields are obtained, and the fluorescent bright spot appearing in each fluorescent image is measured to perform an experiment of finding the relation with the FISH score.
- the Cy5 included silica nanoparticle (nanoparticle 1) is made by the method including the following steps of (1) to (5).
- the obtained nanoparticle 2 observed with the scanning electron microscope has an average particle diameter of 130 nm, and a variation coefficient of 13%.
- the antibody is bonded to the fluorescent substance included silica nanoparticle according to the method including the following steps (1) to (12).
- the nanoparticle 1 is shown, however, the same applies to the nanoparticle 2.
- the fluorescent substance included silica nanoparticle bonded with the anti HER2 antibody obtained with the nanoparticle 1 as the starting material is to be the indicator material A
- the fluorescent substance included silica nanoparticle bonded with the anti HER2 antibody obtained with the nanoparticle 2 as the starting material is to be the indicator material B.
- the correlation coefficient R between the measured bright point number and the FISH score is calculated for each field.
- the FISH score corresponds to the overexpression level of the HER2 gene, and the higher the value of the FISH score is, this shows that the overexpression level of the HER 2 gene is high.
- FIG. 5 is a diagram showing a relation between the bright point number measured from the fluorescent images with a plurality of different fields (0.3 mm 2 , 3 mm 2 , 32 mm 2 , 324 mm 2 ) and the FISH score when the indicator material A (Cy5 included indicator material) is used.
- the value of R 2 shown in the diagram is a square value of the correlation coefficient between the bright point number and the FISH score.
- FIG. 6 is a diagram showing a relation between the bright point number measured from the fluorescent images with a plurality of different fields (0.3 mm 2 , 3 mm 2 , 32 mm 2 , 324 mm 2 ) and the FISH score when the indicator material B (CdSe included indicator material) is used.
- indicator material B CdSe included indicator material
- FIG. 7 is a diagram showing a relation between the bright point number measured from the fluorescent images with a plurality of different fields (0.3 mm 2 , 3 mm 2 , 32 mm 2 , 324 mm 2 ) and the FISH score when the indicator material C (CdSe) is used.
- FIG. 8 is a diagram showing a relation between the bright point number measured from the fluorescent images with a plurality of different fields (0.3 mm 2 , 3 mm 2 , 32 mm 2 , 324 mm 2 ) and the FISH score when the indicator material D (Cy5) is used.
- Table 1 and FIG. 9 show a square value (R 2 ) of the correlation coefficient between the bright point number measured from the fluorescent image of each field (observation area) and the FISH score for each indicator material A to D.
- INDICATOR MATERIAL FIELD OSERVATION AREA
- CORRELATION COEFFICIENT R 2 BETWEEN BRIGHT POINT NUMBER AND FISH SCORE
- INDICATOR MATERIAL A 0.3mm 2 0.1241 3mm 2 0.5387 32mm 2 0.9011 324mm 2 0.9887
- INDICATOR MATERIAL B 0.3mm 2 0.2134 3mm 2 0.5040 32mm 2 0.8770 324mm 2 0.9900
- INDICATOR MATERIAL C 0.3mm 2 0.0118 3mm 2 0.3023 32mm 2 0.1646 324mm 2 0.1662
- INDICATOR MATERIAL D 0.3mm 2 0.0793 3mm 2 0.0919 32mm 2 01869 324mm 2 0.0007
- the square value (R 2 ) of the correlation coefficient between the bright point number and the FISH score is 0.1241 and no correlation can be seen between the bright point number and the FISH score. It is assumed this is because the field of 0.3 mm 2 is too small and the variation is large.
- the square value (R 2 ) of the correlation coefficient between the bright point number and the FISH score is 0.5387.
- this value is about 0.734, and it can be said that there is a strong correlation between the bright point number and the FISH score.
- the square value (R 2 ) of the correlation coefficient between the bright point number and the FISH score is 0.9011. It can be said that the correlation is stronger when the field is 32 mm 2 compared to when the field is 3 mm 2 .
- the tissue slice using the indicator materials A and B is observed with a large field, it is found that the correlation between the bright point number and the FISH score is good, and the expression level of the HER2 can be evaluated based on the bright point number.
- a troublesome method such as the FISH method
- the above is effective as a method to replace the FISH method.
- the indicator materials A and B use particles including a fluorescent substance, and has a larger brightness compared to the indicator materials C and D which use the fluorescent substance as a simple substance. Therefore, each one of the bright points can be identified easily from the image, and the bright point number can be calculated accurately.
- the observation target is the tissue slice stained using the stain reagent including the fluorescent substance included nanoparticle bonded with the biological substance recognition site which recognizes a specific protein (For example, HER 2 protein in breast cancer tissue. Hereinafter referred to as specific protein).
- specific protein HER 2 protein in breast cancer tissue.
- the observation target is not limited to the above.
- the bright field image and the fluorescent image are obtained with the microscopic image obtaining apparatus 1A by steps (a1) to (a5).
- the bright field image and the fluorescent image are obtained from the slide with the same tissue slice with the same capturing magnification within the same range (same field). Therefore, the same coordinate position in the bright field image and the fluorescent image show the same position in the tissue slice, and positions do not need to be matched between the two images.
- the automatic processing of detecting the fluorescent bright point from the microscopic image is possible under any of the processing systems of 8 bits (0 to 255 tones) and 12 bits (0 to 4095 tones).
- the excitation light wavelength in the fluorescent unit is selected from within the range of 560 to 630 nm, and the fluorescent substance used emits fluorescence including a peak within the range of 580 to 690 nm, more preferably within the range of 600 to 630 nm by the excitation light.
- the fluorescent substance includes a peak within the above range, when the excitation light within the above range is selected, it is possible to secure the luminescence difference between the autofluorescence of the tissue including light emission of eosin and fluorescence from the fluorescent substance included nanoparticle, and with this, it is possible to surely distinguish and recognize the difference between the above (luminescence difference of the above being 10% (1.1 times) or more).
- the autofluorescence of the tissue is very weak, and therefore, even if the range of the wavelength of the excitation light is not limited within the typical range of 200 nm to 700 nm, it is possible to secure the luminescence difference between the autofluorescence and fluorescence from the fluorescent substance included nanoparticle, and with this, it is possible to surely distinguish and recognize the difference between the above (luminescence difference of the above being 10% (1.1 times) or more).
- image analysis processing A is performed based on the bright field image and the fluorescent image.
- FIG. 10 shows a flowchart of the image analysis processing A in the image processor 2A.
- the image analysis processing shown in FIG. 10 is performed by the control section 21 in coordination with the program stored in the storage section 25.
- step S1 When the bright field image is input from the microscopic image obtaining apparatus 1A through the communication I/F 24 (step S1), the ROI of the analysis target is specified from the bright field image (step S2).
- step S2 first, when the bright field image capturing the tissue slice is displayed on the display section 23, and a region is specified with the operation section 22 from the displayed bright field image, the specified region is set as the ROI (region of interest) which is the analysis target.
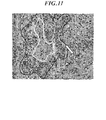
- FIG. 11 shows an example of specifying the ROI in step S2.
- the bright field image, especially the HE stained image is the image conventionally used by the physician in pathological diagnosis.
- the region determined as the region with a doubt of cancer such as a region where many cell nuclei are gathered, a region where size of the cell nuclei are varied, a region where the cell nuclei is larger than normal, etc. in the bright field image can be specified as the ROI of the analysis target.
- the entire image can be specified or an arbitrary region can be specified.
- the region where the physician as the user would like to know the expression amount of the specific protein quantitatively can be specified as the arbitrary region, for example, a cancer region, invasion portion where the cancer is enlarged to the surroundings, and the like.
- the arbitrary region can be specified by specifying a geometric region such as a rectangle, a circle, etc., or the user can draw curves freely with a mouse, etc.
- step S3 the region of the cell nucleus is extracted from the bright field image.
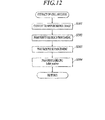
- FIG. 12 shows a detailed flow of the processing in step S3.
- the processing in step S3 is performed by the control section 21 in coordination with the program stored in the storage section 25.
- step S3 first, the conversion of the bright field image to the monochrome image is performed (step S301).
- threshold processing is performed on the monochrome image using a threshold determined in advance, and each pixel is binarized (step S302).
- FIG. 13 shows an example of a binary image after threshold processing.
- noise removal is performed (step S303).
- the noise removal can be performed by performing closing processing on the binary image.
- the closing processing is processing of performing dilation processing and then erosion processing the same number of times.
- the dilation processing is processing of replacing the target pixel with a white pixel when any of the pixels within the range of n x n pixels (n is an integer of 2 or more) from the target pixel is white.
- the erosion processing is processing of replacing the target pixel with a black pixel when any of the pixels within the range of n x n pixels from the target pixel is black. Small regions such as noise can be removed with the closing processing.
- FIG. 14 shows an example of an image after noise removal. As shown in FIG. 14 , after the noise removal, an image (cell nucleus image) with the cell nucleus extracted can be obtained.
- labeling processing is performed on the image after noise removal, and a label Label_nucleus is attached to each extracted cell nucleus (step S304).
- the labeling processing is processing of attaching the same label (number) to the connecting pixels to identify the object in the image. According to the labeling processing, each cell nucleus can be identified from the image after noise removal and a label can be attached.
- Top hat conversion is performed on an image from which the R component is extracted (step S402).
- Top hat conversion is processing where a value of a pixel corresponding to the image of multiplying the minimum value filter and the maximum value filter to the input image in this order is subtracted from the value of each pixel of the input image.
- the minimum value filter replaces the value of the target pixel with the minimum value among the neighboring pixels (for example, 3 x 3 pixels) of the target pixel.
- the maximum value filter replaces the value of the target pixel with the maximum value among the neighboring pixels (for example, 3 x 3 pixels) of the target pixel.
- a small projection region where brightness is high compared to neighboring pixels
- FIG. 16 shows an example of a fluorescent bright point candidate image.
- FIG. 17 shows the fluorescent bright point image with the fluorescent bright point extracted obtained after noise removal from the fluorescent bright point candidate image shown in FIG. 16 .
- the label Label_point is attached to each of the extracted fluorescent bright point (step S404). Label_point is attached in order from 1. After the labeling processing ends, the processing advances to step S6 of FIG. 10 .
- step S6 of FIG. 10 the feature amount showing the expression amount of the specific protein in the ROI is calculated based on the region of the extracted cell nucleus and the fluorescent bright point (step S6).
- FIG. 18 shows a detailed flow of the processing in step S6.
- the processing of step S6 is performed by the control section 21 in coordination with the program stored in the storage section 25.
- step S601 the value of each pixel of the cell nucleus image and the value of the corresponding pixel in the fluorescent bright point image are added to create a synthetic image (step S601).
- step S602 number H of the Label_point attached in the ROI specified in step S2 is counted (step S602).
- step S603 number C of the Label_nucleus attached in the ROI specified in step S2 is counted (step S603), and H/C is calculated (step S604).
- H/C is a fluorescent bright point number for each cell nucleus in the ROI.
- step S605 When the area in the ROI Area_ROI is calculated (step S605), and H/Area_ROI is calculated (step S606), The processing advances to step S7 of FIG. 10 .
- the area Area_ROI is calculated based on the pixel number in the ROI.
- step S7 of FIG. 10 the calculated feature amount is output as display on the display section 23 (step S7).
- FIG. 19 is a diagram showing an example of an analysis result screen 231 displayed on the display section 23 in step S7.
- the following are displayed in the analysis result screen 231, a bright field image 231a used in calculating the feature amount, a fluorescent image 231b, a synthesis image 231c made by adding the cell nucleus image and the fluorescent bright point image extracted from the above images, a feature amount 231d obtained by analysis, a print button 231e, and a transmit button 231f.
- an annotation (a frame border) A showing the region of the ROI specified in step S2 is displayed overlapped in the synthesis image 231c.
- the feature amount 231d As the feature amount 231d, the following are displayed, the number of fluorescent bright points in the ROI (number H of Label_Point), the number of cell nuclei in the ROI (number C of Label_nucleus), the fluorescent bright number for each cell nucleus in the ROI (H/C), and the fluorescent bright point density in the ROI (H/Area_ROI).
- the fluorescent bright point shows the expression of the specific protein corresponding to the biological substance recognition site used in the staining reagent of the tissue slice. Therefore, by referring to the feature amount 231d of the above, the physician is able to understand the expression amount of the specific protein in the ROI quantitatively.
- the HER2 protein is said to exist in the periphery of the cell membrane and is said to be related to the proliferation and malignant alteration of the cell through the signaling pathway.
- overexpression of HER2 protein can be seen in the periphery of the cell membrane.
- overexpression of the HER2 protein can be seen in the cell membrane of the cancer cell. Therefore, the number of fluorescent bright points showing the expression of the HER2 protein in the ROI, specifically, the number of fluorescent bright points for each cell nucleus shows the amount of HER2 protein expressed in the periphery of the cell membrane for each cell in the ROI, and can be said to be a feature amount which quantitatively shows the degree of malignity of the cancer of the cell in the ROI.
- the fluorescent bright point density in the ROI shows expression amount of the HER2 protein which does not depend on the largeness of the region specified as the ROI, and can be said to be a feature amount which quantitatively shows the degree of malignity of the cancer in the ROI. Therefore, since the feature amount of the above is displayed, quantitative information for prognostic expectation and determining the future treatment plan can be provided to the physician.
- the ROI and the synthesis image adding the cell nucleus image and the fluorescent bright point image are displayed in the analysis result screen 231. Therefore, the physician is able to confirm the size and the distribution of the cell nucleus in the ROI and confirm the expression of the specific protein in the image. Further, by also displaying the bright field image conventionally used in diagnosis by the physician and the fluorescent image extracting only the fluorescent bright point of the specific protein, it is possible to assist understanding the state of the cell in the ROI and the expression status of the specific protein.
- any one or all of the bright field image 231a, the fluorescent image 231b, and the synthesis image 231C displayed on the analysis result screen 231 can be displayed enlarged or reduced.
- the analysis result can be printed by pressing the print button 231e or output to external devices by pressing the transmit button 231f.
- the control section 21 transmits the data of the analysis result to a printer which is not shown through the communication I/F 24 or a communication network such as a LAN, etc., and the analysis result is printed.
- the control section 21 transmits the data of the analysis result to the external device (for example, PACS (Picture Archiving and Communication System for medical application)) through the communication I/F 24 or the communication network such as a LAN, etc.
- the external device for example, PACS (Picture Archiving and Communication System for medical application)
- the analysis result which is output can be only the feature amount or can include any or all of the bright field image, the fluorescent image, and the synthesis image as in the display of the analysis result screen 231.
- the analysis processing is performed using a bright field image and a fluorescent image.
- the analysis processing is performed by using only the fluorescent image of the tissue slice on which HE staining and staining with a staining reagent including a fluorescent substance included nanoparticle bonded with a biological substance recognition site which recognizes a specific protein.
- the configuration of the pathological diagnosis assistance system 100 of the second embodiment is similar to the configuration described in the first embodiment. Therefore, the description is to be referred and the different portions are described below.
- the fluorescent image is obtained with the microscopic image obtaining apparatus 1A by the following steps (b1) to (b3).
- the tissue slice is stained by HE staining together with staining by the predetermined fluorescent indicator material as described above
- the specific protein appears as the fluorescent bright point and the eosin which stains the cell cytoplasm emits light together with the autofluorescence of the tissue, etc.
- the cell cytoplasm emits light due to the staining by the eosin, however, the cell nucleus does not emit light because it is not stained by the eosin, and the cell nucleus is shown blacker than the surrounding cell cytoplasm in the fluorescent image (see FIG. 21 ).
- image analysis processing B is performed by extracting the region of the cell nucleus and the fluorescent bright point using only the fluorescent image obtained by the above steps (b1) to (b3) and calculating the feature amount showing the expression amount of the specific protein based on the above information.
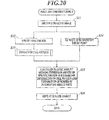
- FIG. 20 shows a flowchart of the image analysis processing B performed in the image processor 2A.
- the image analysis processing B shown in FIG. 20 is performed by the control section 21 in coordination with the program stored in the storage section 25.
- step S11 When the fluorescent image is input from the microscopic image obtaining apparatus 1A (step S11), first, the processing of step S12 to step S13 to extract the cell nucleus and the processing of step S14 to extract the fluorescent bright point are performed.
- step S12 the ROI of the analysis target is specified from the fluorescent image (step S12).
- the minimum value filter processing is performed on the fluorescent image, and the fluorescent image after minimum value filter processing is displayed on the display section 23.
- the specified region is set as the ROI (region of interest).
- FIG. 21 shows an example of a fluorescent image before and after minimum value filter processing. As shown in FIG. 21 , by performing the minimum value filter processing, the fluorescent bright point can be removed from the fluorescent image. Therefore, the physician is able to easily observe the shape of the cell nucleus and the setting of the ROI becomes easy.
- step S13 the region of the cell nucleus is extracted from the fluorescent image.
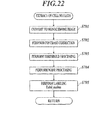
- FIG. 22 shows a detailed flow of the processing in step S13.
- the processing in step S13 is performed by the control section 21 in coordination with a program stored in the storage section 25.
- step S13 first, the conversion of the fluorescent image to the monochrome image is performed (step S701).
- step S702 in order to emphasize the contrast in especially the high density region, processing is performed to enhance the contrast in the high density region by gamma conversion.
- Gamma conversion converts the value of each pixel by the formula of [formula 1].
- the asterisk in the [formula 1] is a multiplication symbol.
- ⁇ is a parameter showing a degree of a ⁇ curve. As shown in FIG. 23 , when ⁇ > 1, the ⁇ curve is convex upward and when ⁇ ⁇ 1, the ⁇ curve is convex downward. For example, when the density becomes higher as the pixel value shifts from small to large, gamma conversion is performed as ⁇ ⁇ 1, and in a case opposite of the above, gamma conversion is performed as ⁇ > 1.
- FIG. 24B shows a monochrome image after gamma conversion. Compared to the portion shown with an arrow in FIG. 24A , it is possible to understand that the contrast is enhanced and the shape of the cell nucleus becomes clear.
- I _ after x y M * I _ before x y / M 1 / y
- step S703 the threshold processing is performed on the monochrome image after contrast correction using the threshold determined in advance and each pixel is binarized (step S703). Further, noise processing (step S704), and labeling processing (step S705) are performed, and the image with the cell nucleus extracted (cell nucleus image) as shown in FIG. 14 is obtained.
- the processing in steps S703, S704, and S705 are the same as the steps S302, S303, and S304 of FIG. 12 , respectively, and the description is to be referred.
- step S15 of FIG. 20 After the labeling processing, the processing advances to step S15 of FIG. 20 .
- step S14 the fluorescent bright point is extracted from the fluorescent image (step S14).
- the processing of step S14 is the same as the processing described using FIG. 15 in the first embodiment, and therefore the description is to be referred.
- the processing advances to step S15 of FIG. 20 .
- step S15 of FIG. 20 analysis processing is performed based on information of the region of the extracted cell nucleus and the information of the fluorescent bright point, and the feature amount showing the expression amount of the specific protein in the ROI is calculated (step S15).
- the processing of step S15 is similar to the processing described using FIG. 18 in the first embodiment, and therefore the description is to be referred.
- step S16 the calculated feature amount is displayed on the display section 23 (step S16).
- step S16 similar to the analysis result screen 231 shown in FIG. 19 , an analysis result screen is displayed displaying the fluorescent image which is the source of the analysis and the feature amount obtained by analyzing the fluorescent image.
- a frame border showing the region of the specified ROI is displayed in the fluorescent image which is the source of the analysis.
- a print button and a transmit button are provided in the analysis result screen and the analysis result can be printed or output to the external device.
- the feature amount showing the expression amount of the specific protein in the ROI can be calculated.
- the shape of the cell including the cell nucleus and the fluorescent bright point showing the expression of a specific biological substance are both included in one image. Therefore, by displaying the fluorescent image with the feature amount, the physician is able to understand the shape of the cell of the tissue, the expression status of the specific protein and the feature amount at once without comparing the two images of the bright field image and the fluorescent image or matching the positions of the two images as in conventional methods.
- the control section 21 extracts the region of the cell nucleus from the bright field image or the fluorescent image and also extracts the fluorescent bright point showing the expression of the specific protein from the fluorescent image. Then, the feature amount showing the expression amount of the specific protein in the specified ROI is calculated based on the region of the cell nucleus and the fluorescent bright point in the ROI specified on the operation section 22, and the feature amount is output.
- the feature amount showing the expression of the specific protein calculated based on the cell nucleus and the fluorescent bright point in the ROI can be provided to the physician, and the physician is able to quantitatively understand the expression amount of the specific protein in a desired region. Therefore, the prognostic expectation and determining the future treatment plan becomes easier.
- the number of fluorescent bright points for each one of the cell in the ROI showing the expression amount of the specific protein for each one of the cell nucleus in the ROI can be said to be a feature amount quantitatively showing the degree of malignity of the cancer of the cell in the ROI. Therefore, quantitative information for prognostic expectation and determining the future treatment plan can be provided to the physician by output of the number of fluorescent bright points for each one of the cell in the ROI as the feature amount.
- the synthesis image of the cell shape image and the fluorescent image with the annotation showing the position of the ROI overlapped on the image is output. Therefore, it is possible to easily understand the state such as the distribution and the size of the cell in the ROI and the expression status of the specific protein.
- the feature amount showing the expression amount of the specific protein in the ROI is calculated and output using one fluorescent image showing the shape of the cell of the tissue slice as well as the expression of the specific protein in the tissue slice as the fluorescent bright point. Therefore, accurate feature amount can be calculated without synthesizing a plurality of images or performing processing of matching the position. Since the fluorescent image is displayed on the display section 23, the physician is easily able to understand both the cell nucleus and the expression of the protein from one image.
- HER2 protein in breast cancer is described as the example of the specific protein, however, the protein is not limited to the above.
- the biological substance recognition site when the fluorescent image is obtained according to the type of lesion (cancer) which is to be the target of diagnosis, it is possible to provide the physician with the feature amount quantitatively showing the expression amount of the specific protein according to the type of lesion.
- a portable recording medium such as a CD-ROM, etc. can be applied as other computer readable media.
- a carrier wave can be applied as the medium which provides the data of the program of the present invention through a communication line.
- each device composing the pathological diagnosis assistance system 100 can be suitably changed within the scope of the present invention.
- the present invention can be used in the field of medicine as a medical image processor which processes a microscopic image of a tissue slice.
Landscapes
- Engineering & Computer Science (AREA)
- Health & Medical Sciences (AREA)
- General Physics & Mathematics (AREA)
- Physics & Mathematics (AREA)
- General Health & Medical Sciences (AREA)
- Nuclear Medicine, Radiotherapy & Molecular Imaging (AREA)
- Life Sciences & Earth Sciences (AREA)
- Theoretical Computer Science (AREA)
- Analytical Chemistry (AREA)
- Chemical & Material Sciences (AREA)
- Pathology (AREA)
- Biochemistry (AREA)
- Immunology (AREA)
- Quality & Reliability (AREA)
- Medical Informatics (AREA)
- Radiology & Medical Imaging (AREA)
- Computer Vision & Pattern Recognition (AREA)
- Multimedia (AREA)
- Molecular Biology (AREA)
- Biomedical Technology (AREA)
- Investigating, Analyzing Materials By Fluorescence Or Luminescence (AREA)
- Investigating Or Analysing Biological Materials (AREA)
- Image Processing (AREA)
Applications Claiming Priority (2)
| Application Number | Priority Date | Filing Date | Title |
|---|---|---|---|
| JP2012078717 | 2012-03-30 | ||
| PCT/JP2013/058917 WO2013146841A1 (ja) | 2012-03-30 | 2013-03-27 | 医用画像処理装置及びプログラム |
Publications (2)
| Publication Number | Publication Date |
|---|---|
| EP2833123A1 true EP2833123A1 (de) | 2015-02-04 |
| EP2833123A4 EP2833123A4 (de) | 2015-12-09 |
Family
ID=49260090
Family Applications (1)
| Application Number | Title | Priority Date | Filing Date |
|---|---|---|---|
| EP13767991.6A Ceased EP2833123A4 (de) | 2012-03-30 | 2013-03-27 | Medizinischer bildprozessor und programm |
Country Status (4)
| Country | Link |
|---|---|
| US (1) | US9483684B2 (de) |
| EP (1) | EP2833123A4 (de) |
| JP (1) | JP5892238B2 (de) |
| WO (1) | WO2013146841A1 (de) |
Cited By (5)
| Publication number | Priority date | Publication date | Assignee | Title |
|---|---|---|---|---|
| EP3040724A1 (de) * | 2013-09-26 | 2016-07-06 | Konica Minolta, Inc. | Verfahren zum bestimmen der menge von biologischem material in gewebeschnitt |
| EP3264362A4 (de) * | 2015-02-23 | 2018-01-03 | Konica Minolta, Inc. | Bildverarbeitungsvorrichtung, bildverarbeitungsverfahren und bildverarbeitungsprogramm |
| EP3258264A4 (de) * | 2015-02-10 | 2018-01-10 | Konica Minolta, Inc. | Verfahren zur quantifizierung von biologischem material, system zur unterstützung von pathologischer diagnose und programm |
| EP3312605A4 (de) * | 2015-06-16 | 2018-05-30 | Konica Minolta, Inc. | Bildverarbeitungsvorrichtung, bildverarbeitungsverfahren und bildverarbeitungsprogramm |
| EP3407063A4 (de) * | 2016-01-19 | 2018-11-28 | Konica Minolta, Inc. | Bildverarbeitungsvorrichtung und -programm |
Families Citing this family (28)
| Publication number | Priority date | Publication date | Assignee | Title |
|---|---|---|---|---|
| WO2015093518A1 (ja) * | 2013-12-18 | 2015-06-25 | コニカミノルタ株式会社 | 画像処理装置、病理診断支援システム、画像処理プログラム及び画像処理方法 |
| JP6604960B2 (ja) * | 2014-02-21 | 2019-11-13 | ベンタナ メディカル システムズ, インコーポレイテッド | バイオマーカー陽性の腫瘍細胞を識別するための医用画像解析 |
| EP3124969B1 (de) * | 2014-03-24 | 2019-05-01 | Konica Minolta, Inc. | Quantifizierungsverfahren von biologischem material auf der basis von multi-antigen-immunfärbung |
| JP5768948B1 (ja) * | 2014-03-27 | 2015-08-26 | コニカミノルタ株式会社 | 画像処理装置および画像処理プログラム |
| JP6337629B2 (ja) * | 2014-06-12 | 2018-06-06 | コニカミノルタ株式会社 | 診断支援情報生成方法、画像処理装置、診断支援情報生成システム及び画像処理プログラム |
| JP6349202B2 (ja) * | 2014-08-29 | 2018-06-27 | シスメックス株式会社 | 蛍光検出装置、被検物質検出装置、及び蛍光検出方法 |
| US10094767B2 (en) * | 2014-09-19 | 2018-10-09 | Konica Minolta, Inc. | Image processor, image processing method, and program |
| WO2016080187A1 (ja) * | 2014-11-18 | 2016-05-26 | コニカミノルタ株式会社 | 画像処理方法、画像処理装置及びプログラム |
| JP6405985B2 (ja) * | 2014-12-19 | 2018-10-17 | コニカミノルタ株式会社 | 画像処理装置、画像処理システム、画像処理プログラム及び画像処理方法 |
| EP3249401B1 (de) * | 2015-01-22 | 2019-12-25 | Konica Minolta, Inc. | Quantifizierungsverfahren für biologische substanz, pathologisches diagnoseunterstützungssystem und programm |
| WO2016123705A1 (en) | 2015-02-02 | 2016-08-11 | Novadaq Technologies Inc. | Methods and systems for characterizing tissue of a subject |
| JP6547424B2 (ja) * | 2015-06-01 | 2019-07-24 | コニカミノルタ株式会社 | 蛍光画像の合焦システム、合焦方法および合焦プログラム |
| CA2998698A1 (en) * | 2015-09-23 | 2017-03-30 | Novadaq Technologies ULC | Methods and systems for management of data derived from medical imaging |
| US9990713B2 (en) * | 2016-06-09 | 2018-06-05 | Definiens Ag | Detecting and visualizing correlations between measured correlation values and correlation reference values of a pathway |
| DE102016111730B3 (de) * | 2016-06-27 | 2017-12-28 | Leica Microsystems Cms Gmbh | Beleuchtungseinrichtung sowie Mikroskop mit einer derartigen Beleuchtungseinrichtung |
| WO2018008309A1 (ja) | 2016-07-05 | 2018-01-11 | コニカミノルタ株式会社 | 生体物質定量方法、画像処理装置、病理診断支援システム及びプログラム |
| WO2018018160A1 (en) | 2016-07-29 | 2018-02-01 | Novadaq Technologies ULC | Methods and systems for characterizing tissue of a subject utilizing machine learning |
| JP6915349B2 (ja) * | 2017-04-04 | 2021-08-04 | コニカミノルタ株式会社 | 画像処理装置、画像処理方法、及び画像処理プログラム |
| JP6959755B2 (ja) | 2017-04-14 | 2021-11-05 | シスメックス株式会社 | 蛍光画像分析装置、蛍光画像の分析方法及びコンピュータプログラム |
| JP6948354B2 (ja) * | 2017-04-14 | 2021-10-13 | シスメックス株式会社 | 蛍光画像分析装置及び蛍光画像の分析方法 |
| WO2019087853A1 (ja) * | 2017-11-06 | 2019-05-09 | コニカミノルタ株式会社 | 生体物質定量方法、画像処理装置及びプログラム |
| CN109003248B (zh) * | 2018-07-23 | 2020-12-08 | 中国石油大学(华东) | 一种细粒沉积岩纹层结构的表征方法 |
| CN112714886B (zh) | 2018-09-28 | 2023-03-21 | 仪景通株式会社 | 显微镜系统、投影单元以及图像投影方法 |
| WO2020066043A1 (ja) * | 2018-09-28 | 2020-04-02 | オリンパス株式会社 | 顕微鏡システム、投影ユニット、及び、画像投影方法 |
| WO2020066042A1 (ja) | 2018-09-28 | 2020-04-02 | オリンパス株式会社 | 顕微鏡システム、投影ユニット、及び、画像投影方法 |
| JP7376245B2 (ja) | 2019-03-29 | 2023-11-08 | シスメックス株式会社 | 蛍光画像分析装置及び蛍光画像分析方法 |
| JP2021124861A (ja) * | 2020-02-04 | 2021-08-30 | ソニーグループ株式会社 | 解析装置、解析方法、解析プログラム及び診断支援システム |
| CN113693739B (zh) * | 2021-08-27 | 2022-10-28 | 南京诺源医疗器械有限公司 | 肿瘤导航修正方法、装置及便携式荧光影像导航设备 |
Family Cites Families (28)
| Publication number | Priority date | Publication date | Assignee | Title |
|---|---|---|---|---|
| US4326008A (en) | 1976-08-27 | 1982-04-20 | California Institute Of Technology | Protein specific fluorescent microspheres for labelling a protein |
| US5326692B1 (en) | 1992-05-13 | 1996-04-30 | Molecular Probes Inc | Fluorescent microparticles with controllable enhanced stokes shift |
| US6272235B1 (en) | 1997-03-03 | 2001-08-07 | Bacus Research Laboratories, Inc. | Method and apparatus for creating a virtual microscope slide |
| US6259807B1 (en) * | 1997-05-14 | 2001-07-10 | Applied Imaging Corp. | Identification of objects of interest using multiple illumination schemes and finding overlap of features in corresponding multiple images |
| US7272252B2 (en) * | 2002-06-12 | 2007-09-18 | Clarient, Inc. | Automated system for combining bright field and fluorescent microscopy |
| JP2004077389A (ja) * | 2002-08-21 | 2004-03-11 | Hitachi Software Eng Co Ltd | 半導体ナノ粒子を含む機能性蛍光試薬 |
| US7050613B2 (en) * | 2002-11-07 | 2006-05-23 | Fujitsu Limited | Method for supporting cell image analysis |
| JP4745059B2 (ja) * | 2003-11-20 | 2011-08-10 | 浜松ホトニクス株式会社 | リンパ節検出装置 |
| US20050265588A1 (en) * | 2004-02-03 | 2005-12-01 | Bioimagene, Inc. | Method and system for digital image based flourescent in situ hybridization (FISH) analysis |
| WO2005090945A1 (en) * | 2004-03-16 | 2005-09-29 | Amnis Corporation | Method for imaging and differential analysis of cells |
| DE102004028372A1 (de) * | 2004-06-11 | 2006-01-05 | Universität Bremen | Verfahren und Vorrichtung zur Segmentierung einer digitalen Abbildung von Zellen |
| US20060041385A1 (en) * | 2004-08-18 | 2006-02-23 | Bauer Kenneth D | Method of quantitating proteins and genes in cells using a combination of immunohistochemistry and in situ hybridization |
| US7387453B2 (en) | 2005-09-02 | 2008-06-17 | Pelco, Inc. | Camera support and mounting assembly |
| WO2007074722A1 (ja) * | 2005-12-27 | 2007-07-05 | The Furukawa Electric Co., Ltd. | 蛍光ナノシリカ粒子、ナノ蛍光材料、それを用いたバイオチップ及びそのアッセイ法 |
| US8428331B2 (en) * | 2006-08-07 | 2013-04-23 | Northeastern University | Phase subtraction cell counting method |
| US8244021B2 (en) * | 2006-12-20 | 2012-08-14 | Ventana Medical Systems, Inc. | Quantitative, multispectral image analysis of tissue specimens stained with quantum dots |
| CA2704796A1 (en) * | 2007-10-11 | 2009-04-16 | British Columbia Cancer Agency Branch | Systems and methods for automated characterization of genetic heterogeneity in tissue samples |
| US8263358B2 (en) * | 2007-10-15 | 2012-09-11 | The Charles Stark Draper Laboratory, Inc. | Intracellular nanosensors and methods for their introduction into cells |
| JP5040597B2 (ja) * | 2007-11-06 | 2012-10-03 | 日本電気株式会社 | 評価システム、評価方法および評価プログラム |
| JP5259207B2 (ja) * | 2008-02-05 | 2013-08-07 | オリンパス株式会社 | 細胞画像解析装置及びその方法並びにそのソフトウェア |
| WO2009110614A1 (ja) | 2008-03-07 | 2009-09-11 | Kobayashi Yasunobu | エフェクター細胞の機能測定法及び測定用キット並びに測定システム |
| JP2009265067A (ja) | 2008-04-21 | 2009-11-12 | Tokachi Telephone Network Kk | 分子認識蛍光標識シリカナノ粒子 |
| JP5407015B2 (ja) * | 2008-07-10 | 2014-02-05 | 国立大学法人徳島大学 | 画像処理装置、画像処理方法、コンピュータ実行可能な画像処理プログラム、及び顕微鏡システム |
| US8300938B2 (en) * | 2010-04-09 | 2012-10-30 | General Electric Company | Methods for segmenting objects in images |
| WO2012029342A1 (ja) | 2010-08-30 | 2012-03-08 | コニカミノルタエムジー株式会社 | 組織染色方法、組織評価方法および生体物質検出方法 |
| CN103154741B (zh) * | 2010-09-17 | 2016-02-03 | 国立大学法人东北大学 | 含有抗体作为成分的医药品的有效性的判定方法 |
| JP5698483B2 (ja) | 2010-09-22 | 2015-04-08 | オリンパス株式会社 | 蛍光観察装置 |
| JP2012078717A (ja) | 2010-10-05 | 2012-04-19 | Olympus Imaging Corp | レンズ鏡筒 |
-
2013
- 2013-03-27 US US14/387,405 patent/US9483684B2/en active Active
- 2013-03-27 JP JP2014507942A patent/JP5892238B2/ja active Active
- 2013-03-27 EP EP13767991.6A patent/EP2833123A4/de not_active Ceased
- 2013-03-27 WO PCT/JP2013/058917 patent/WO2013146841A1/ja active Application Filing
Cited By (12)
| Publication number | Priority date | Publication date | Assignee | Title |
|---|---|---|---|---|
| EP3040724A1 (de) * | 2013-09-26 | 2016-07-06 | Konica Minolta, Inc. | Verfahren zum bestimmen der menge von biologischem material in gewebeschnitt |
| EP3040724A4 (de) * | 2013-09-26 | 2017-05-03 | Konica Minolta, Inc. | Verfahren zum bestimmen der menge von biologischem material in gewebeschnitt |
| US10352859B2 (en) | 2013-09-26 | 2019-07-16 | Konica Minolta, Inc. | Method for determining quantity of biological material in tissue section |
| EP3258264A4 (de) * | 2015-02-10 | 2018-01-10 | Konica Minolta, Inc. | Verfahren zur quantifizierung von biologischem material, system zur unterstützung von pathologischer diagnose und programm |
| US10234391B2 (en) | 2015-02-10 | 2019-03-19 | Konica Minolta, Inc. | Biological substance quantitation method, pathological diagnosis support system and recording medium storing computer readable program |
| US10309900B1 (en) | 2015-02-10 | 2019-06-04 | Konica Minolta, Inc. | Biological substance quantitation method, pathological diagnosis support system and recording medium storing computer readable program |
| EP3264362A4 (de) * | 2015-02-23 | 2018-01-03 | Konica Minolta, Inc. | Bildverarbeitungsvorrichtung, bildverarbeitungsverfahren und bildverarbeitungsprogramm |
| US10451554B2 (en) | 2015-02-23 | 2019-10-22 | Konica Minolta, Inc. | Image processing device, image processing method, and recording medium storing computer readable image processing program |
| EP3312605A4 (de) * | 2015-06-16 | 2018-05-30 | Konica Minolta, Inc. | Bildverarbeitungsvorrichtung, bildverarbeitungsverfahren und bildverarbeitungsprogramm |
| US10641706B2 (en) | 2015-06-16 | 2020-05-05 | Konica Minolta, Inc. | Cell morphology image processing and corrections |
| EP3407063A4 (de) * | 2016-01-19 | 2018-11-28 | Konica Minolta, Inc. | Bildverarbeitungsvorrichtung und -programm |
| US10761027B2 (en) | 2016-01-19 | 2020-09-01 | Konica Minolta, Inc. | Image processing apparatus and computer-readable recording medium storing program |
Also Published As
| Publication number | Publication date |
|---|---|
| JPWO2013146841A1 (ja) | 2015-12-14 |
| JP5892238B2 (ja) | 2016-03-23 |
| US20150049936A1 (en) | 2015-02-19 |
| EP2833123A4 (de) | 2015-12-09 |
| WO2013146841A1 (ja) | 2013-10-03 |
| US9483684B2 (en) | 2016-11-01 |
Similar Documents
| Publication | Publication Date | Title |
|---|---|---|
| US9483684B2 (en) | Medical image processor and storage medium | |
| EP2833138B1 (de) | Medizinischer bildprozessor und programm | |
| US9779500B2 (en) | Image processing device, pathological diagnosis support system, image processing program, and pathological diagnosis support method | |
| WO2016042963A1 (ja) | 画像処理装置、画像処理方法、及びプログラム | |
| EP3086110A1 (de) | Bildverarbeitungsvorrichtung, system zur unterstützung einer pathologischen diagnose, bildverarbeitungsprogramm und bildverarbeitungsverfahren | |
| EP3124956B1 (de) | Bildverarbeitungsvorrichtung und bildverarbeitungsprogramm | |
| US10451554B2 (en) | Image processing device, image processing method, and recording medium storing computer readable image processing program | |
| JP6597316B2 (ja) | 画像処理装置及びプログラム | |
| US10761027B2 (en) | Image processing apparatus and computer-readable recording medium storing program | |
| EP3702779A1 (de) | Bildverarbeitungsvorrichtung, verfahren zur bestimmung der scharfeinstellposition und programm zur bestimmung der scharfeinstellposition | |
| JP5887823B2 (ja) | 組織評価方法 | |
| WO2018143406A1 (ja) | 画像処理装置及びプログラム | |
| JP6375925B2 (ja) | 画像処理装置、画像処理システム、画像処理プログラム及び画像処理方法 | |
| EP3764096A1 (de) | Bildverarbeitungsverfahren, bildverarbeitungsvorrichtung und programm | |
| JP6702339B2 (ja) | 画像処理装置及びプログラム | |
| JP6405985B2 (ja) | 画像処理装置、画像処理システム、画像処理プログラム及び画像処理方法 |
Legal Events
| Date | Code | Title | Description |
|---|---|---|---|
| PUAI | Public reference made under article 153(3) epc to a published international application that has entered the european phase |
Free format text: ORIGINAL CODE: 0009012 |
|
| 17P | Request for examination filed |
Effective date: 20140923 |
|
| AK | Designated contracting states |
Kind code of ref document: A1 Designated state(s): AL AT BE BG CH CY CZ DE DK EE ES FI FR GB GR HR HU IE IS IT LI LT LU LV MC MK MT NL NO PL PT RO RS SE SI SK SM TR |
|
| AX | Request for extension of the european patent |
Extension state: BA ME |
|
| DAX | Request for extension of the european patent (deleted) | ||
| RAP1 | Party data changed (applicant data changed or rights of an application transferred) |
Owner name: KONICA MINOLTA, INC. |
|
| RA4 | Supplementary search report drawn up and despatched (corrected) |
Effective date: 20151110 |
|
| RIC1 | Information provided on ipc code assigned before grant |
Ipc: G06T 7/00 20060101ALI20151104BHEP Ipc: G01N 33/53 20060101ALI20151104BHEP Ipc: G06K 9/46 20060101ALI20151104BHEP Ipc: G06K 9/00 20060101ALI20151104BHEP Ipc: G01N 33/543 20060101ALI20151104BHEP Ipc: G01N 21/64 20060101AFI20151104BHEP |
|
| STAA | Information on the status of an ep patent application or granted ep patent |
Free format text: STATUS: EXAMINATION IS IN PROGRESS |
|
| 17Q | First examination report despatched |
Effective date: 20180816 |
|
| STAA | Information on the status of an ep patent application or granted ep patent |
Free format text: STATUS: EXAMINATION IS IN PROGRESS |
|
| STAA | Information on the status of an ep patent application or granted ep patent |
Free format text: STATUS: EXAMINATION IS IN PROGRESS |
|
| REG | Reference to a national code |
Ref country code: DE Ref legal event code: R003 |
|
| STAA | Information on the status of an ep patent application or granted ep patent |
Free format text: STATUS: THE APPLICATION HAS BEEN REFUSED |
|
| 18R | Application refused |
Effective date: 20220922 |