EP2804121A2 - Analysesystem und Gesundheitswirtschaftsunterstützungsverfahren - Google Patents
Analysesystem und Gesundheitswirtschaftsunterstützungsverfahren Download PDFInfo
- Publication number
- EP2804121A2 EP2804121A2 EP20140168542 EP14168542A EP2804121A2 EP 2804121 A2 EP2804121 A2 EP 2804121A2 EP 20140168542 EP20140168542 EP 20140168542 EP 14168542 A EP14168542 A EP 14168542A EP 2804121 A2 EP2804121 A2 EP 2804121A2
- Authority
- EP
- European Patent Office
- Prior art keywords
- insured
- information
- medical
- data
- insured person
- Prior art date
- Legal status (The legal status is an assumption and is not a legal conclusion. Google has not performed a legal analysis and makes no representation as to the accuracy of the status listed.)
- Withdrawn
Links
Images






Classifications
-
- G—PHYSICS
- G06—COMPUTING OR CALCULATING; COUNTING
- G06Q—INFORMATION AND COMMUNICATION TECHNOLOGY [ICT] SPECIALLY ADAPTED FOR ADMINISTRATIVE, COMMERCIAL, FINANCIAL, MANAGERIAL OR SUPERVISORY PURPOSES; SYSTEMS OR METHODS SPECIALLY ADAPTED FOR ADMINISTRATIVE, COMMERCIAL, FINANCIAL, MANAGERIAL OR SUPERVISORY PURPOSES, NOT OTHERWISE PROVIDED FOR
- G06Q40/00—Finance; Insurance; Tax strategies; Processing of corporate or income taxes
- G06Q40/08—Insurance
-
- G—PHYSICS
- G16—INFORMATION AND COMMUNICATION TECHNOLOGY [ICT] SPECIALLY ADAPTED FOR SPECIFIC APPLICATION FIELDS
- G16H—HEALTHCARE INFORMATICS, i.e. INFORMATION AND COMMUNICATION TECHNOLOGY [ICT] SPECIALLY ADAPTED FOR THE HANDLING OR PROCESSING OF MEDICAL OR HEALTHCARE DATA
- G16H50/00—ICT specially adapted for medical diagnosis, medical simulation or medical data mining; ICT specially adapted for detecting, monitoring or modelling epidemics or pandemics
- G16H50/20—ICT specially adapted for medical diagnosis, medical simulation or medical data mining; ICT specially adapted for detecting, monitoring or modelling epidemics or pandemics for computer-aided diagnosis, e.g. based on medical expert systems
-
- G—PHYSICS
- G16—INFORMATION AND COMMUNICATION TECHNOLOGY [ICT] SPECIALLY ADAPTED FOR SPECIFIC APPLICATION FIELDS
- G16H—HEALTHCARE INFORMATICS, i.e. INFORMATION AND COMMUNICATION TECHNOLOGY [ICT] SPECIALLY ADAPTED FOR THE HANDLING OR PROCESSING OF MEDICAL OR HEALTHCARE DATA
- G16H70/00—ICT specially adapted for the handling or processing of medical references
- G16H70/60—ICT specially adapted for the handling or processing of medical references relating to pathologies
-
- G—PHYSICS
- G16—INFORMATION AND COMMUNICATION TECHNOLOGY [ICT] SPECIALLY ADAPTED FOR SPECIFIC APPLICATION FIELDS
- G16Z—INFORMATION AND COMMUNICATION TECHNOLOGY [ICT] SPECIALLY ADAPTED FOR SPECIFIC APPLICATION FIELDS, NOT OTHERWISE PROVIDED FOR
- G16Z99/00—Subject matter not provided for in other main groups of this subclass
Definitions
- This invention relates to a data analysis technology, and more particularly, to a system for analyzing medical data, to thereby support a healthcare business.
- a health insurance society operates an insurance business, a healthcare guidance system, for providing healthcare guidances for preventing lifestyle diseases, and preventing severity thereof from increasing in order to reduce medical cost.
- resources such as public health nurses employed for the healthcare guidance and a cost for the healthcare guidances are limited. Therefore, a system for supporting an operation of effective and efficient insurance business is desired.
- Japanese Patent Application Laid-open No. 2012-128670 A there is described a healthcare business support system for selecting people subject to a healthcare guidance based on healthcare cost information, health checkup information, and healthcare guidance information.
- the healthcare business support system includes a medical cost model generation unit for generating a medical cost model representing an estimated medical cost for each of severities and test values of an insured person to a health insurance, a test value improvement model generation unit for generating a test value improvement model representing an improvement amount for each of the severities and the test values, an estimated medical cost reduction effect calculation unit for calculating an estimated medical cost reduction amount by a healthcare guidance for each of the severities and the test values, and a subject person selection unit for selecting an insured person to the health insurance belonging to a severity and a test value high in estimated medical cost reduction amount as a healthcare guidance subject person.
- the future medical cost is estimated based on the current severity and test value. For example, a future severity of diabetes is estimated based on current severity and blood sugar level of diabetes, and an average medical cost corresponding to the severity is considered as an estimated medical cost.
- an analysis system comprising a processor configured to execute a program and a memory configured to store the program.
- the analysis system executes the program to analyze data.
- the analysis system is capable of making access to a storage apparatus configured to store similarity information between data including a similarity between instances.
- the analysis system further comprises a data mapping unit configured to control the processor to set an attractive force and a repulsive force acting between the instances based on the similarity information between data, and arrange the instances in a vector space having a certain number of dimensions so that an energy caused by the attractive force and the repulsive force is less than a threshold defined in advance, and a clustering unit configured to classify the instances arranged in the vector space.
- the data mapping unit is further configured to virtually add one dimension to the vector space, add a minute fluctuation to coordinates of the instances in a direction of the added dimension, and calculate a minimum number of dimensions of the vector space where the instances are stable with respect to the minute fluctuation.
- the instances can be arranged based on the similarity between instances in the vector space having an appropriate number of dimensions. Therefore, the instances can be appropriately classified by means of a related-art clustering method. Objects, configurations, and effects which have not been described become apparent from a description of the following embodiments.
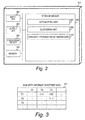
- FIG. 2 is a block diagram illustrating a configuration of the data analysis apparatus according to the first embodiment.
- a data analysis apparatus 201 includes an input unit 202, an output unit 203, a processing device 204, a memory 205, and a storage medium 206.
- the input unit 202 is a human interface such as a mouse and a keyboard, and receives an input to the data analysis apparatus 201.
- the output unit 203 includes a display and a printer for outputting arithmetic operation results by a medical data analysis system.
- the storage medium 206 is a storage apparatus for storing various programs for realizing data analysis processing by the data analysis apparatus 201, execution results of the medical data analysis processing, and the like, and is, for example, a non-volatile storage medium (such as a magnetic disk drive and non-volatile memory).
- the processing device 204 is an arithmetic operation apparatus for executing a program loaded on the memory 205, and is, for example, a CPU, a GPU, or the like.
- the data analysis apparatus 201 may be a computer system constituted by a single computer, or a computer system constituted by a server and client terminals. Moreover, the respective units of the data analysis apparatus 201 may be constituted by independent apparatus.
- the data analysis apparatus 201 is a computer system constituted on a single computer, or a plurality of logically or physically constituted computers, and may operate as independent threads on the same computer, or may operate on virtual computers constructed on a plurality of physical computer resources.
- the program executed by the processing device 204 is provided for respective servers by means of a removable medium (such as a CD-ROM and a flash memory) or a network, and is stored in a non-volatile storage apparatus which is a non-transitory storage medium. Therefore, the computer system is preferred to include an interface for reading the removable medium.
- a removable medium such as a CD-ROM and a flash memory
- a non-volatile storage apparatus which is a non-transitory storage medium. Therefore, the computer system is preferred to include an interface for reading the removable medium.
- FIG. 3 is an explanatory diagram illustrating the similarity information between data.
- Similarity information between data 301 describes similarities each between two different instances.
- the similarity information between data 301 represents that the similarity between an instance D1 and an instance D3 is 0.92.
- the instance is, for example, "person”.
- the similarity information between data 301 prescribes the similarity between two persons defined by a certain method (for example, a frequency of receiving/transmitting mails).
- Another example of the instance is "document”.
- the similarity information between data 301 prescribes the similarity between documents defined by a certain method (such as a ratio of words appearing in both the documents out of all words appearing in the two documents).
- the data analysis apparatus 201 carries out the clustering of classifying instances into similar instances.
- G (V, E).
- a state where two of an i -th node and a j -th node are coupled to each other via an edge defined in the set E is represented as i ⁇ j.
- a force-directed algorithm described below defines attractive force and repulsive force between nodes based on a presence/absence of an edge. Then, an arrangement of the nodes of the set V is corrected in a two-dimensional or three-dimensional space so that energies between the nodes decrease based on the defined attractive force and repulsive force. Thus, a stable arrangement of the nodes is defined.
- the repulsive force fr(i,j) and the attractive force fa(i,j) acting between the i -th node and the j -th node are defined by Equations (1) and (2).
- fa(i,j) 0, if i ⁇ j does not hold true
- xi and xj are respectively coordinates of the i -th d j -th nodes in the two-dimensional or three-dimensional space, and
- C and K are positive constants, and
- X n represents an n -th power of X for values X and n.
- the repulsive force fr is defined so as to act between all nodes, and the attractive force fa is defined so as to act between nodes coupled to each other via an edge.
- Equation (3) has such a meaning that an effectively acting extent of the repulsive force is adjusted, and the effectively acting extent of the repulsive force decreases as p increases.
- a force f(i) acting on the node i is represented by summing the force defined as described above as Equation (4).
- f i - ⁇ ⁇ fr i ⁇ j ⁇ v i ⁇ j + ⁇ ⁇ fa i ⁇ j ⁇ v i ⁇ j
- Equation (4) the sum is calculated for all nodes j other than the node i .
- v(j,i) is a unit vector directing from xi to xj, and is defined by Equation (5).
- v i ⁇ j xj - xi / xj - xi
- Equation (6) An energy E of the entire system is defined by using Equation (5) as Equation (6).
- E xi ⁇ K ⁇ C ⁇ ⁇ f i 2
- f(i) is a magnitude of a vector f(i) in Equation (6).
- ⁇ xi ⁇ ⁇ x1, x2, ... ⁇ , and represents coordinate arrangement of all nodes.
- An algorithm iteratively corrects the coordinates ⁇ xi ⁇ of the nodes so as to reduce the energy E. As a result, a final arrangement of all the nodes is defined.
- Equation (7) sxi is a vector generated by multiplying each of the elements of xi by s. This is understood by recognizing that a relationship represented by Equation (8) holds true.
- E xi ⁇ K ⁇ C K / K ⁇ 2 ⁇ C / C ⁇ 4 / 3 ⁇ E sxi ⁇ K ⁇ ⁇ C ⁇
- the number of dimensions is set to two or three, and an initial arrangement of the coordinates ⁇ xi ⁇ of each node is defined in a vector space having the set number of dimensions.
- the initial arrangement of the coordinate ⁇ xi ⁇ of the node may be set by using a random number, for example.
- the nodes may be classified by means of a certain method, and nodes belonging to the same class may be arranged close to one another. Further, an arrangement defined by using another simple visualization algorithm may be the initial arrangement.
- Attractive force/repulsive force setting step 402 attractive force is set between nodes having an edge, and repulsive force is set between all the nodes as described before.
- Predetermined values are used for the constants C and K, the parameter p of the repulsive force fr, and the like.
- the coordinate arrangement loop 409 is a cycle of successively selecting each of the nodes from the graph G, and correcting the coordinate of the node.
- One cycle is a one round over the entire nodes.
- a coordinate correction loop 410 is a cycle of successively selecting data, and correcting the coordinate of the data, and processing for one cycle is finished when the entire nodes are routed.
- a node i is selected from the entire nodes.
- Force calculation step 404 the sum f(i) of the vectors of the force acting on the selected node i is calculated.
- the sum f(i) can be calculated by Equation (4).
- Coordinate correction step 405 the coordinate xi is corrected in a direction of the force acting on the selected node i by using Equation (9). xi ⁇ xi + t ⁇ f i / f i
- Equation (9)
- t is a parameter for adjusting a magnitude of the correction.
- the value of t may initially be large for greatly correcting the coordinate, and may decrease for a final fine adjustment as the cycle repeats. For example, an initial value having an appropriate magnitude may be first set, and the value t may be updated by using Equation (10) after the coordinate correction for one cycle is finished.
- Step 406 whether a node which has not been selected out of all the nodes exists or not is determined.
- the algorithm returns to Sample selection step 403, and selects a next sample.
- the force acting from the node i to other nodes have changed as a result of the correction of the coordinate xi , and, in Force calculation step 404, force vectors are calculated for the new coordinate arrangement by reflecting the correction of the coordinate.
- the algorithm proceeds to Convergence determination step 407.
- a degree of convergence of the algorithm is determined, thereby determining whether the algorithm is finished or not. For example, a coordinate arrangement ⁇ yi ⁇ of the node i after one cycle of the coordinate correction for the last time and a coordinate arrangement ⁇ xi ⁇ of the node i after one cycle of the coordinate correction for this time are compared with each other, and if a correction amount is smaller than a predetermined threshold, the algorithm determines that the coordinates are sufficiently converged, and is finished.
- the correction amount may be calculated by using, for example, ⁇
- the nodes of the graph G are arranged on a screen for visualization based on the arrangement of the respective nodes in the two or three dimensional space.
- the method described by referring to FIG. 4 is intended for the visualization, and the number of dimensions for the arrangement is first set to two or three. However, if a large number of nodes exist, it is difficult to represent the positional relationship among the nodes in the space having a low dimension such as two or three dimensions.
- the method illustrated in FIG. 4 can be easily extended to a space having four or more dimensions by arranging the nodes in a space having a large number of dimensions, and correcting the arrangement of the nodes.
- the method illustrated in FIG. 4 determines the number of dimensions of the space before the nodes are arranged, and it is difficult to select an appropriate number of dimensions for representing the positional relationship among data. For example, if the predetermined number of dimensions is small, the positional relationship among data cannot be sufficiently represented. On the other hand, if the predetermined number of dimensions is large, the representation of the data degrades, precisions of the clustering and the like carried out later decrease, and an amount of calculation increases.
- the first embodiment provides a method of selecting an appropriate number of dimensions for representing the positional relationship among the data based on the similarity among data.
- the data can be arranged on a vector space having the appropriate number of dimensions based on the similarity among the data.
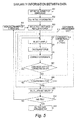
- FIG. 5 is a flowchart of the processing by a data mapping unit 207 according to the first embodiment.
- the data mapping unit 207 arranges the data in the space having the appropriate number of dimensions based on the similarity information between data 209.
- an initial value of the dimension of the coordinates is set.
- the initial value of the dimension of the coordinates is set to as small a value as possible, but if it is known that the representation of the data apparently requires at least n dimensions (n is a positive number), n is set to the initial value. If the prior knowledge does not exist, the initial value for the dimension may be set to two.
- an initial arrangement of the coordinate ⁇ xi ⁇ of each of the data is defined on the vector space having the number of dimensions set in Initial number-of-dimensions setting step 501.
- the initial arrangement of the coordinate ⁇ xi ⁇ of the data may be set by using a random number, for example.
- the data may be classified by means of a certain method, and nodes belonging to the same class may be arranged close to one another. Further, an arrangement defined by using another simple visualization algorithm may be the initial arrangement.
- 2 / K if s(i,j) ⁇ h holds true fa i ⁇ j 0 if s i ⁇ j ⁇ h holds true
- the acting attractive force is proportional to the similarity between the data i and the data j if the similarity is equal to or more than the predetermined threshold h.
- the repulsive force is defined by Equation (1) as in the case illustrated in FIG. 4 .
- the constants C and K are defined in advance.
- An algorithm iteratively corrects the coordinates ⁇ xi ⁇ of the nodes so as to reduce the energy E. As a result, a final arrangement of all the data is defined.
- a coordinate correction loop 514 is a cycle of successively selecting data, and correcting a coordinate of the data, and processing for one cycle is finished when the entire nodes are routed.
- Sample selection step 504 data i is selected from the entire data.
- Force calculation step 505 the sum f(i) of the vectors of the force acting on the selected data i is calculated.
- the sum f(i) can be calculated by Equation (4).
- Coordinate correction step 506 the coordinate xi is corrected in a direction of the force acting on the selected data i by using Equation (9).
- Equation (9) t is a parameter for adjusting a magnitude of the correction.
- the value of t may initially be large for greatly correcting the coordinate, and may decrease for a final fine adjustment as the cycle repeats.
- an initial value having an appropriate magnitude may be first set, and the value t may be updated by using Equation (10) after the coordinate correction for one cycle is finished.
- Step 507 whether data which has not been selected out of all the nodes exists or not is determined. As a result of the determination, if data which has not been selected out of all the data exists, the algorithm returns to Sample selection step 504, and selects a next sample. On this occasion, the force acting from the data i to other data have changed as a result of the correction of the coordinate xi, and, in Force calculation step 505, the force vectors are calculated for the new coordinate arrangement by reflecting the correction of the coordinate. On the other hand, if all the data have been selected, the algorithm proceeds to Convergence determination step 508.
- Convergence determination step 508 a degree of convergence of the algorithm is determined, thereby determining whether the algorithm is finished or not. For example, a coordinate arrangement ⁇ yi ⁇ of the data i after one cycle of the coordinate correction for the last time and a coordinate arrangement ⁇ xi ⁇ of the data i after one cycle of the coordinate correction for this time are compared with each other, and if a correction amount is smaller than a predetermined threshold, the algorithm determines that the coordinates are sufficiently converged, and is finished.
- the correction amount may be calculated by using, for example, ⁇
- a stability of the arrangement of data generated in Step 513 is calculated in order to appropriately select the number of dimensions according to the first embodiment. If the number of dimensions is insufficient, there is a problem in the positional relationship among the data, and it is assumed that a distortion is present in the force. The stability is evaluated by calculating a magnitude of the distortion. If the arrangement of data is stable, it is determined that the number of dimensions is sufficient. On the other hand, if the arrangement of data is not stable, in Number-of-dimensions addition step 511, the number of dimensions is incremented by one, and the coordinates of the data are arranged again in a space having the increased number of dimensions.
- the instability of the data arrangement generated in Coordinate arrangement step 513 is calculated by the following method. If the number of dimensions currently set is N, the data are arranged in an N -dimensional space. The instability is calculated by means of a degree of instability in the current arrangement if one dimension is virtually added to the dimension N. In other words, if the data is minutely fluctuated in a direction of the added dimension, and a force acts in a direction to pull back the fluctuation, the data arrangement is stable. On the other hand, if a force acts in the direction of the fluctuation, the data arrangement is unstable.
- Equation (1) the repulsive force between the data i and the data j is represented by Equation (1), and the attractive force is represented by Equation (11).
- Equation (12) The attractive force acting on the data i in the direction of the added dimension if the data i is minutely fluctuated by ⁇ in the direction of the added dimension is represented as Equation (12), and the repulsive force is represented by Equation (13).
- fr i ⁇ j ⁇ ⁇ C ⁇ K 2 / xi - xj 2 + ⁇ 2 ) ⁇ - ⁇ ⁇ C ⁇ K 2 / xi - xj 2
- fa i ⁇ j ⁇ ⁇ s i ⁇ j ⁇ xi - xj 2 + ⁇ 2 1 / 2 / K ⁇ ⁇ ⁇ s i ⁇ j ⁇ xi - xj / K if s i ⁇ j ⁇ h holds true
- fa i ⁇ j 0 if s i ⁇ j ⁇ h holds true
- a denominator M ( M -1) is a term for normalizing by the number of sums caused by the number of samples
- KC 1/3 is a term for normalizing the coordinate scaling.
- Instability calculation step 509 U is calculated as an index representing the instability by the processing described before. Then, in Finish determination step 510, whether U is equal to or more than a predetermined threshold or not is determined. As a result of the determination, if U is equal to or more than the predetermined threshold, it is determined that the arrangement of data is unstable, and the algorithm proceeds to Number-of-dimensions addition step 511. On the other hand, if U is less than the predetermined threshold, it is determined that the data arrangement is stable, and the algorithm proceeds to Data arrangement output step 512 to output the coordinates of the data. If U decreases drastically compared with the previous cycle, it may be determined that the arrangement of data is stable.
- Final determination step 510 if it is determined that the arrangement of data is unstable, the algorithm returns to Number-of-dimensions addition step 511, and the number of dimensions is incremented by one.
- the coordinate in the added dimension of the data is set to O.
- attractive force and repulsive force is set in the N +1-dimensional space.
- Coordinate arrangement step 513 a coordinate arrangement is determined in the N +1-dimensional space.
- the above-described processing can arrange the data in the space having the appropriate number of dimensions.
- the clustering unit 208 clusters data arranged in the N -dimensional space.
- the data are represented as points in the N -dimensional space, and hence the K-means method or the EM method can be used for the clustering.
- the K-means method first defines the number K of clusters. Then, each of the pieces of data is randomly assigned to any of the clusters. Then, an average vector of data belonging to a cluster is acquired for each of the clusters. Then, each of the pieces of data is assigned to a cluster corresponding to the closest average vector. If a change does not arise as a result of the reassignment, the clustering is finished. On the other hand, if a change occurs as a result of the reassignment, the process returns to the processing of acquiring the average vector of data belonging to a cluster for each of the clusters, and the processing is repeated. As a result of the processing, the data can be classified into K clusters.
- the data clustering apparatus can arrange data based on the similarity between data in a vector space having an appropriate number of dimensions. For example, if the similarity between people or documents is given, this embodiment is suitably used for classification into similar people or similar documents.
- the data is arranged in the vector space having an appropriate number of dimensions, and the related-art clustering method can thus be used to appropriately classify the instances.
- the related-art clustering method can thus be used to appropriately classify the instances.
- the related-art clustering method can thus be applied.
- the instability of the arrangement of data is calculated, thereby determining an appropriate number of dimensions. Therefore, the appropriate number of dimensions can be determined automatically without necessity of a prior knowledge on the data.
- medical data such as healthcare cost information, health checkup information, and medical inquiry information.
- the healthcare cost information is information recording names of injury and illness when a health insurance insured person visits a medical institute for consultation, prescribed medicines, applied clinical actions, and medical costs (points), and, referring to FIG. 6 , a description is given of an example thereof.
- the prescribed medicines and the applied clinical actions are generally referred to as medical action.
- the health checkup information is information on a result of a test received by an insured person to the health insurance at a health checkup facility, and, referring to FIG. 7 , a description is later given of an example thereof.
- the medical inquiry information is information on a result of a medical inquiry (such as the life style, health history, and subjective symptoms) received at a health checkup facility by an insured person of the health insurance at a health checkup facility, and, referring to FIG. 8 , a description is later given of an example thereof
- Insured persons of the health insurance in a similar state are clustered based on medical data according to the second embodiment.
- the cluster represents states of a disease (absence/presence of a disease onset, the degree of severity, the test value, and the like).
- a model based on state transitions between the clusters is generated, a tendency of all the insured persons is analyzed from statistics of insured persons in a cluster based on the generated model, a future state is estimated, and a medical cost is estimated according to the second embodiment.
- FIG. 1 is a block diagram illustrating a configuration of the medical data analysis system according to the second embodiment.
- the medical data analysis system includes a medical data analysis apparatus 101 and a database 116.
- the medical data analysis apparatus 101 includes an input unit 102, an output unit 103, a processing device 104, a memory 105, and a storage medium 106.
- the input unit 102 is a human interface such as a mouse and a keyboard, and receives an input to the medical data analysis apparatus 101.
- the output unit 103 includes a display and a printer for outputting an arithmetic operation result by the medical data analysis system.
- the storage medium 106 is a storage apparatus for storing various programs for realizing medical data analysis processing by the medical data analysis system, an execution result of the medical data analysis processing, and the like, and is, for example, a non-volatile storage medium (such as a magnetic disk drive and non-volatile memory).
- the programs stored in the storage medium 106 are extended on the memory 105.
- the processing device 104 is an arithmetic operation apparatus for executing a program loaded on the memory 105, and is, for example, a CPU, a GPU, or the like. Processing and arithmetic operation described later are carried out by the processing device 104.
- the medical data analysis system may be a computer system constituted by a single computer, or a computer system constituted by a server and client terminals.
- the medical data analysis system is a computer system constituted on a single computer, or a plurality of logically or physically constituted computers, and may operate as independent threads on the same computer, or may operate on virtual computers constructed on a plurality of physical computer resources.
- the program executed by the processor is provided for respective servers by means of a removable medium (such as a CD-ROM and a flash memory) or a network, and is stored in a non-volatile storage apparatus which is a non-transitory storage medium. Therefore, the computer system is preferred to include an interface for reading the removable medium.
- a removable medium such as a CD-ROM and a flash memory
- a non-volatile storage apparatus which is a non-transitory storage medium. Therefore, the computer system is preferred to include an interface for reading the removable medium.
- a medical information storage unit 117 stores the medical data input to the input unit 102.
- the medical data includes the healthcare cost information, the health checkup information, and the medical inquiry information.
- the healthcare cost information includes healthcare cost basic information, injury and illness name information, clinical action information, medicine information, injury and illness name classification information, clinical action classification information, and medicine classification information.
- FIG. 6 is an explanatory diagram illustrating healthcare cost basic information 601.
- the healthcare cost basic information 601 is information holding relationships between a healthcare cost and an insured person.
- the healthcare cost basic information 601 includes search numbers 602, insured person IDs 603, sex 604, ages 605, months and years of clinical action 606, and total points 607.
- the search number 602 is an identifier for uniquely identifying a healthcare cost record.
- the insured person ID 603 is an identifier for uniquely identifying an insured person of the health insurance.
- the sex 604 is information representing a gender of the insured person.
- the age 605 is information representing an age of the insured person.
- the month and year of clinical action 606 is a month and a year when the insured person visits a medical institute.
- the total point 607 is information representing a total point of one healthcare cost. It should be noted that a medical cost (in yen) is calculated by multiplying the total point by "10". If a plurality of injury and illness names are registered to one search number in injury and illness name information 901 illustrated in FIG. 9 , a total point of the medical actions for the plurality of injuries/illnesses is registered to the total point 607.
- FIG. 9 is an explanatory diagram illustrating the injury and illness name information 901.
- the injury and illness name information 901 includes search numbers 602, injury and illness codes 902, and injury and illness names 903.
- the search number 602 is an identifier for uniquely identifying the healthcare cost record, and uses the same number as the search number ( FIG. 6 ) of the healthcare cost basic information 601.
- the injury and illness code 902 is an injury and illness code described in the healthcare cost record.
- the injury and illness name 902 is an injury and illness name corresponding to the injury and illness code.
- injury and illness names 903 of entries having "11" in the search number 602 are "diabetes” and “hypertension” in the injury and illness name information 901 illustrated in FIG. 9
- the injury and illness names, which are diabetes and hypertension are described in the healthcare cost records having "11" in the search number.
- FIG. 10 is an explanatory diagram illustrating the injury and illness name classification information.
- Traum and illness name classification information 1001 is information for associating an injury and illness classification and an injury and illness name belonging to the injury and illness classification with each other, and includes an injury and illness classification 1002, an injury and illness code 902, an injury and illness name 903, and a complication 1003.
- the injury and illness classification 1002 is the classification to which an injury and illness in question belongs.
- the injury and illness code 902 is an injury and illness code described in healthcare cost record, and uses the same numbers as used in the injury and illness code 902 of the injury and illness name information 901 illustrated in FIG. 9 .
- the injury and illness name 903 is the name of an injury and illness corresponding to this injury and illness code, and uses the same names as used in the injury and illness name 903 of the injury and illness name information 901 illustrated in FIG. 9 .
- the complication absence/presence 1003 indicates whether this injury and illness is the name of a complication
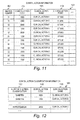
- FIG. 11 is an explanatory diagram illustrating the clinical action information.
- Clinical action information 1101 includes search numbers 602, clinical action codes 1102, clinical action names 1103, and clinical action points 1104.
- the search number 602 is an identifier for uniquely identifying a healthcare cost record, and uses the same number as the search number ( FIG. 6 ) of the healthcare cost basic information 601.
- the clinical action code 1102 is an identifier for identifying a clinical action described in the healthcare cost record.
- the clinical action name 1103 is a name of the clinical action described in the healthcare cost record.
- the clinical action point 1104 is a point relating to the clinical action.
- FIG. 12 is an explanatory diagram illustrating the clinical action classification information.
- Clinical action classification information 1201 includes injury and illness classifications 1002, clinical action codes 1102, and clinical action names 1103.
- the injury and illness classification 1002 uses the same classification as the injury and illness classification 1002 ( FIG. 10 ) of the injury and illness name classification information 1001.
- the clinical action code 1102 is a clinical action code for identifying a clinical action practiced for the injury and illness in the injury and illness classification 1002, and uses the same code as the clinical action code 1102 ( FIG. 11 ) of the clinical action information 1101.
- the clinical action name 1103 is a name of the clinical action corresponding to the clinical action code, and uses the same code as the clinical action name 1103 ( FIG. 11 ) of the clinical action information 1101.
- FIG. 13 is an explanatory diagram illustrating the medicine information.
- Medicine information 1301 includes search numbers 602, medicine codes 1302, medicine names 1303, and medicine points 1304.
- the search number 602 is an identifier for uniquely identifying a healthcare cost, and uses the same number as the search number 602 ( FIG. 6 ) of the healthcare cost basic information 601.
- the medicine code 1302 is a medicine code for identifying the medicine described in the healthcare cost record.
- the medicine name 1303 is a name of a medicine described in the healthcare cost record.
- the medicine point 1304 is an insurance point of the medicine.
- FIG. 14 is an explanatory diagram illustrating the medicine classification information.
- Medicine classification information 1401 includes injury and illness classifications 1002, medicine codes 1302, and medicine names 1303.
- the injury and illness classification 1002 uses the same classification as the injury and illness classification 1002 ( FIG. 10 ) of the injury and illness name classification information 1001.
- the medicine code 1302 is a medicine code for identifying a medicine prescribed in the classification registered to the injury and illness classification 1002, and uses the same code as the medicine code 1302 ( FIG. 13 ) of the medicine information 1301.
- the medicine name 1303 is a name of a medicine corresponding to the medicine code, and uses the same name as the medicine name 1301 ( FIG. 13 ) of the medicine information 1303.
- clinical action information 1101 illustrated in FIG. 11 and the medicine information illustrated in FIG. 13 are generally referred to as medical action information.
- clinical action classification information 1201 illustrated in FIG. 12 and the medicine classification information illustrated in FIG. 14 are generally referred to as medical action classification information.
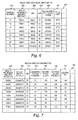
- FIG. 7 is an explanatory diagram illustrating the health checkup information.
- Health checkup information 701 is information for managing health checkup information on a plurality of insured persons for a plurality of years, and includes insured person IDs 603, health checkup dates 702, and various test values (such as BMIs 703, abdominal circumferences 704, fasting blood sugars 705, systolic blood pressures 706, and neutral fats 707) in the health checkup.
- the insured person ID 603 is an identifier of an insured person to the health insurance who has had the health checkup, and uses the same identifier as the insured person ID 603 ( FIG. 6 ) of the healthcare cost basic information 601.
- the health checkup date 702 is the date of the health checkup.
- the BMI 703 to the neutral fat 707 are results of tests in the health checkup.
- data in the health checkup information may be absent.
- the items of a test received in 2004 of an insured person having an insured person ID "K0004" lack data for the systolic blood pressure 706.
- FIG. 8 is an explanatory diagram illustrating the medical inquiry information.
- Medical inquiry information 801 is information for managing medical inquiry information on a plurality of insured persons for a plurality of years, and includes insured person IDs 603, medical inquiry dates 802, and answers of the medical inquiry (such as smoking 803, drinking 804, and walking 805.
- the medical inquiry may include a life style, health history, a constitution such as allergy, and subjective symptoms.
- the insured person ID 603 is an identifier of an insured person of the health insurance who has had the medical inquiry, and uses the same identifier as the insured person ID 603 ( FIG. 6 ) of the healthcare cost basic information 601.
- the medical inquiry date 802 is the date of the medical inquiry.
- the smoking 803 to the walking 805 are results of the medical inquiry.
- the smoking 803 represents an average number of cigarettes smoked per day if the insured person has the smoking habit, and is "none" if the insured person does not smoke.
- the drinking 804 represents an average amount (unit: ml) of alcoholic beverages drunk per day if the insured person has the drinking habit, and is "none" if the insured person does not have the drinking habit.
- the walking 805 is an average period (unit: minute) of walking per day.
- Detailed information such as the number of steps in the walking, the amount of drinking, and the number of smoked cigarettes may not be acquired from the medical inquiry. Not a specific amount of drinking, but a corresponding frequency out of frequencies classified in advance in a questionnaire may be responded. For example, if information only on absence/presence of habits of smoking and drinking are acquired, the frequency of drinking may be divided into a certain number of degrees (such as (1) none, (2) once to twice per week, (3) three times or more per week), and the frequency may be responded. In this case, the value in the medical inquiry information is the number without a quantitative meaning.
- data on the medical inquiry may be absent.
- the items of a medical inquiry received in 2004 by an insured person having an insured person ID "K0003" lack data for the walking 805.
- the data formatting unit 107 sums/unifies and formats in a tabular form the healthcare cost information, the health checkup information, and the medical inquiry information for each of the insured persons and each period from the medical data stored in the medical information storage unit 117.
- the data formatting unit 107 sums/unifies and formats in a tabular form the healthcare cost information, the health checkup information, and the medical inquiry information for each of the insured persons and each period from the medical data stored in the medical information storage unit 117.
- a description is given while assuming one period is one year, but the one period may be another period such as half a year, two years, and three years.
- FIG. 15 is an explanatory diagram illustrating an example of formatted information 1501. Referring to FIG. 15 , a description is given of the processing by the data formatting unit 107.
- the formatted information 1501 includes healthcare cost formatted information acquired by formatting the healthcare cost information in the year of 2004. Each row of the formatted information 1501 represents data summed for one insured person ID for one year.
- An insured person ID 603, a sex 604, an age 605, and a total point 607 are the same as the insured person ID 603, the sex 604, the age 605, and the total point 607 ( FIG. 6 ) of the healthcare cost basic information 601.
- a data year 1502 is a year of source data from which the formatted information is generated.
- the injury and illness code 10 (1503) is the number of healthcare cost records having "10" in the injury and illness code out of the healthcare cost records for the insured person ID.
- the injury and illness code 20 (1504) is similarly the number of healthcare cost records having "20" in the injury and illness code out of the healthcare cost records for the insured person ID.
- the clinical action code 1000 (1505) is the number of healthcare cost records for which a clinical action having "1000" in the clinical action code has been performed out of the healthcare cost records for the insured person ID.
- the medicine code 110 (1506) is the number of healthcare cost records for which a medicine having the medicine code of "110" has been prescribed out of the healthcare cost records for the insured person ID.
- the data formatting unit 107 acquires search numbers of healthcare cost records for the insured person ID having "2004" in the month and year of clinical action from the healthcare cost basic information 601. Then, the data formatting unit 107 refers to the injury and illness name information 901, and counts, for each injury and illness code, the number of healthcare cost records having the injury and illness code described thereon. As a result, the number of healthcare cost records for each of the injury and illness codes is acquired. Similarly, the data formatting unit 107 refers to the clinical action information 1101, counts the number of healthcare cost records for each of the clinical action codes, refers to the medicine information 1301, and counts the number of healthcare cost records for each of the medicine codes. As a result, a data row for the year of 2004 is generated for the selected insured person ID. This processing is carried out for all combinations of each of insured person IDs and each of the years subject to the analysis.
- search numbers "11", “12”, and “13” can be acquired from the healthcare cost basic information 601 for the data of the insured person ID "K0001" in the first row in 2004 in the formatted information 1501 illustrated in FIG. 15 .
- the number of healthcare cost records having "10" in the injury and illness code is two corresponding to the search numbers "11” and "13” out of the three healthcare cost records.
- 2 is registered to the column of the injury and illness code 10 in the first row of the formatted information 1501.
- the formatted information 1501 illustrated in FIG. 15 includes health checkup formatted information formatted from the health checkup information. Each row includes sums of data corresponding to a single insured person ID.
- a value of each of the items is a value of the health checkup data of an insured person and a year respectively corresponding to the insured person ID 603 and the data year 1502.
- the health checkup data can be acquired from the health checkup information 701. If the health checkup information 701 includes a plurality of pieces of health checkup data corresponding to the same insured person ID and the same year, data on any one of dates of health checkup or an average of health checkup results of the plurality of times for the year may be used. If the data on one health checkup date is used, it is preferred to use data on a simultaneous health checkup day practiced at approximately the same time of every year. Moreover, data small in amount of deficiency may be selected.
- a numerical value defined in advance for representing the deficiency is used for the deficient data.
- -1 is used. It should be noted that all values for an insured person who does not have the health checkup information are treated as the values of the deficient data.
- the formatted information 1501 illustrated in FIG. 15 includes medical inquiry formatted information formatted from the medical inquiry information. Each row includes sums of data corresponding to a single insured person ID.
- a value of each of the items is a value of the medical inquiry data of an insured person and a year respectively corresponding to the insured person ID 603 and the data year 1502.
- the medical inquiry data can be acquired from the medical inquiry information 801. If the medical inquiry information 801 includes a plurality of pieces of medical inquiry data corresponding to the same insured person ID and the same year, data on any one of the dates of medical inquiry or an average of medical inquiry results of the plurality of times for the year may be used. If the data on one health checkup date is used, it is preferred to use data on a simultaneous health checkup day practiced every year at approximately the same time of every year. Alternatively, data small in amount of deficiency may be selected. A numerical value defined in advance for representing the deficiency is used for the deficient data. In the example illustrated in FIG. 15 , -1 is used. It should be noted that all values for an insured person who does not have the medical inquiry information are treated as the values of the deficient data.
- Similar items may be summarized, thereby unifying the plurality of items. For example, if functions of the oral antidiabetic A and functions of the oral antidiabetic B out of the items of the medicines are similar, the oral medicines A and B may be summarized, and may be treated as one item. On this occasion, a sum of the number of prescriptions of the oral antidiabetic A and the number of prescriptions of the oral antidiabetic B in the same year is used as a value of the item newly summarized. Criteria for determining whether items are similar or not are described below. Clinical action names belonging to the same injury and illness classification in the clinical action classification information 1201 are considered as similar items. Moreover, medicine names belonging to the same injury and illness classification in the medicine classification information 1401 are considered as similar items. Moreover, similar item information is manually generated in advance.
- FIG. 16A is an explanatory diagram illustrating an example of the formatted information 1501 acquired by unifying the injury and illness code 10 and the injury and illness code 20 of the healthcare cost formatted information.
- the value of an injury and illness code 1601 is a sum of the value of the injury and illness code 1503 and the value of the injury and illness code 1504 in FIG. 15 , and is a sum of the number of healthcare cost records having "10" in the injury and illness code and the number of healthcare cost records having "20" in the injury and illness code.
- FIG. 16B is a flowchart of item unification processing.
- Unification subject item selection step 1602 items subject to the unification are selected out of the items in the healthcare cost basic information 601.
- a description is given of three examples of selecting the items.
- a first example is a method of considering items belonging to the same injury and illness class as the unification subjects if the clinical action and the medicines in the clinical action classification information 1201 and the medicine classification information 1401 are classified.
- a second example is a method of unifying items belonging to the same class by using a criterion such as the 10th Revision of International Classification of Diseases (IDC 10).
- a third example is a method of clustering the items by using the same method as that by the clustering unit 110 described later, and unifying items belonging to the same cluster.
- the generated healthcare cost formatted information, health checkup formatted information, and medical inquiry formatted information illustrated in FIG. 15 and 16A are stored in a formatted information storage unit 118 of the database 116.
- the formatted information 1501 is numerical data in a tabular form.
- the value in the healthcare cost formatted information is acquired by summing the number of the healthcare cost records, namely the number of prescriptions, but the value may be information representing whether the prescriptions exist or not.
- the number of prescriptions is equal to or more than 1 (prescription exists) is summarized as 1, and a case where the number of prescriptions is 0 (no prescription) is set to 0, resulting in a binary representation.
- the number of prescriptions may be considered to represent the severity
- the value of the healthcare cost formatted information may be a value representing a level as a result of classification of the number of prescription.
- a case where the number of prescriptions is 0 is set to 0, a case where the number of prescriptions is 1 to 4 is set to 1, and a case where the number of prescriptions is equal to or more than 5 is set to 2, resulting in a representation as the three stages.
- the healthcare cost formatted information, the health checkup information, and the medical inquiry information are summarized for the period of one year.
- the period may be set to a different period of two years, three years, or the like.
- a description is given of a case where the period for the summarizing is one year.
- the state transition model generation unit 108 includes an insured person arrangement coordinate generation unit 109, a clustering unit 110, and a state transition probability calculation unit 111.
- the insured person arrangement coordinate generation unit 109 uses the formatted information to calculate the similarity between insured persons, and arranges the insured persons in the space having the appropriate number of dimensions based on the similarities.
- the insured person arrangement coordinate generation unit 109 stores the coordinates in the space where the insured persons are arranged in the arrangement coordinate storage unit 119.
- the clustering unit 110 clusters (classifies) the insured persons based on the arrangement of the insured persons in the space.
- the method according to the first embodiment can be used for the arrangement of the insured persons based on the similarity in the space and for the clustering.
- the clustering unit 110 stores a result of the clustering of the insured persons in a clustering information storage unit 120.
- a description is now given of the method of calculating the similarity between the insured persons of the health insurance. It should be noted that the same insured person in different years is treated as different people. In other words, if medical data for ten thousand people for three years exists, the clustering is carried out for thirty thousand people. If a dissimilarity in an item i between two insured persons is represented as d(i) , a dissimilarity between the two insured persons is calculated as D ⁇ d(i) , which is a sum of the dissimilarities of an item used for calculating the dissimilarities. On this occasion, the sum is calculated for all the items i for the same year used for calculating the dissimilarities. If a specific disease (such as diabetes) is focused on, the medical action corresponding to the disease in the healthcare cost information can be selected as the item used for calculating the dissimilarity.
- a specific disease such as diabetes
- d(i) is set to 0 if replies of two insured persons are the same, and d(i) is set to v if the replies of the two insured persons are not the same. It should be noted that a predetermined value is used as v.
- a description is now given of a case where the item i has a quantitative meaning such as the number of prescriptions or a test value. If the item i is an item having a quantitative meaning, a cumulative probability F(t) P(X ⁇ t) of the value is acquired. F(t) is a ratio of the number of insured persons equal to or less than t in the value of the item to the number of all the insured persons, and the maximum value of F(t) is 1. Then, if the values of the item of the two insured persons are respectively t1 and t2, d(i) is set to
- d(i) is set to w. It should be noted that a predetermined value is used as w .
- the dissimilarity D ⁇ d(i) can be calculated.
- the similarity can be calculated as, for example, - D +max ⁇ d(i) ⁇ .
- the insured persons can be classified by clustering the insured persons.
- the formatted information where similar diseases are unified may be used for the calculation of the dissimilarity. If the formatted information where similar diseases are unified is used, clinical actions having similar effects are summarized and counted, and a dissimilarity close to an actual situation can thus be acquired.
- the clinical action classification information ( FIG. 12 ) and the medicine classification information ( FIG. 14 ) may be used for the unification of the clinical actions. Moreover, another unification method described below may be used.
- the another unification method calculates the similarity between items, clusters the items by using the method according to the first embodiment, and unifies the clustered items.
- a correlation coefficient between the vectors x1 and x2 are represented as r(x1,x2).
- x1 and x2 include deficit values, and hence elements which are deficit in any one of x1 and x2 are removed. For example, if x1i is deficit, x2i is also removed.
- the dependency is considered to be 0 in this case, and
- the similarity compared with the random case (case of no dependency) can be calculated.
- the insured persons can be classified by using the unified items, thereby clustering the insured persons.
- the insured persons are classified into K clusters, C1, C 2, ... , CK.
- Each of the clusters represents a state of a disease, and the insured person is classified to any of the clusters according to the second embodiment. It should be noted that pieces of data of the same person in different years are treated as data of different people as described before.
- the state transition probability calculation unit 111 calculates a transition probability between clusters.
- a specific description is given of a method of calculating a transition probability from a cluster Ci to a cluster Cj.
- the number of insured persons having data for a next year out of insured persons belonging to the cluster Ci is set to M1 .
- the number of insured persons in the state Cj in the next year out of the insured persons is set to M2 .
- the transition probability from the cluster Ci to the cluster Cj is represented as M2 / M1.
- the state transition probability calculation unit 111 stores the values of the transition probability of all combinations of the clusters Ci and Cj in a state transition probability storage unit 121.
- the state transition estimation unit 112 includes a state characterization/reconfiguration unit 113, a state transition/medical cost estimation unit 114, and a healthcare guidance support unit 115.
- the state characterization/reconfiguration unit 113 provides a state with meaning (characterizes the state), thereby reconfiguring the model.
- the insured persons are classified by means of the clustering, thereby configuring clusters in the model generated by the state transition model generation unit 108. Transition between states of a disease is modeled by acquiring the state transition probability between the configured clusters.
- the cluster is a set of insured persons, and the cluster needs to be characterized. How a disease is onset or how a severity of a disease increases can be intuitively recognized by characterizing clusters, and displaying states of diseases represented by the clusters on the output unit.
- a cluster is characterized by insured persons belonging to the cluster.
- FIG. 18A is a flowchart of cluster characterization processing.
- Intra-cluster statistical amount calculation step 1802 a statistical amount of values of each of the items of insured persons belonging to a cluster is calculated, and a state of the cluster is represented by the calculated statistical amount.
- the state can be represented by an average of the values of each of the items of the insured persons belonging to the cluster.
- a blood sugar level of the cluster is an average of the blood sugar levels of the insured persons belonging to the cluster or the like.
- a deviation rate of each of the insured persons from an average value is calculated for each of the items of the cluster.
- the deviation rate is calculated as
- Characterizing item selection step 1804 an item to be used for the characterization is selected.
- an item candidate to be used for the characterization may be manually determined in advance.
- a predetermined number of items highest in the deviation rate may be selected out of item candidates to be used for the characterization, and screen data for displaying the selected items and values thereof on the output unit 103 may be generated.
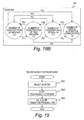
- FIG. 18B is a diagram illustrating a display example of the selected items and the values thereof.
- Pij represents the transition probability from a cluster i to a cluster j .
- the model generated by the state transition model generation unit 108 includes a large number of clusters, and such a problem that a calculation amount for the estimation is large in this state, the model is complex, the display is complicated, and understanding is difficult exists. Therefore, the generated model is reconfigured into a compact model, thereby modeling a state and a transition currently focused on.
- FIG. 19 is a flowchart of reconfiguration processing.
- Cluster selection step 1901 based on an item specified as a subject to focusing, a cluster characterizing an item is selected.
- the items subject to focusing are such as the number of prescriptions of the insulin, the number of prescriptions of an oral antidiabetic, and the blood sugar level if the diabetes is focused on.
- a cluster having a value equal to or more than a predetermined value in the deviation rate in these items is selected.
- clusters high in the transition probability (equal to or more than a predetermined value in the transition probability) from the cluster are selected.
- Non-subject cluster unification step 1902 the clusters which are not selected are unified into one cluster.
- the selected clusters are set to R1, R2, ... , RL, and the clusters which are not selected are summarized into one cluster O .
- insured persons who do not belong to R1, R2, ... , RL are set to belong to the cluster O , and the model is constituted by the L +1 clusters.
- Transition probability calculation step 1903 a transition probability between each pair of clusters out of L +1 clusters constituting the model is calculated.
- a transition probability between the clusters Ri and Rj is the same as the transition probability pij between the original clusters generated by the state transition model generation unit 108.
- the transition probability from the cluster R1 to the cluster O is 1- ⁇ p1j .
- the summation is carried out for j from 1 to L.
- the transition probability from the cluster O to the cluster R1 is 1- ⁇ pj1 .
- the summation is carried out for j from 1 to L.
- the clusters and the transition probabilities between the clusters in the reconfigured model are generated.
- the clusters are characterized by using the same method as that described before.
- the state transition/medical cost estimation unit 114 uses the model generated by the state transition model generation unit 108 or the model reconfigured by the state characterization/reconfiguration unit 113 to estimate the state of disease and the medical cost in the next year from information in this year on each of insured persons subject to analysis specified by the healthcare guidance support unit 115.
- the state transition/medical cost estimation unit 114 stores the estimated states of the diseases and medical costs in an estimated result storage unit 122.
- a description is given of a method for the state transition estimation namely, a method of estimating the state in the next year from the information in this year on each of the insured persons subject to an analysis specified by the healthcare guidance support unit 115.
- the information in this year on each of the insured persons subject to the analysis is converted to formatted information in a form illustrated in FIG. 15 or 16A .
- the similarities between the clusters C1 , ... , CK and all the insured persons are calculated based on the converted formatted information.
- a cluster Ci highest in similarity is considered as the state in this year of the insured person subject to the analysis.
- the transition probability to each of the states in the next year can be calculated by the state transition probability stored in the state transition probability storage unit 121.
- a cluster Ci to which a insured person subject to the analysis belongs is specified based on the information of the insured person in this year by using the same method as in the state transition estimation. Moreover, the medical cost of each of clusters is calculated.
- the medical cost of the cluster Cj is an average medical cost M(j) of insured persons belonging to Cj . If the transition probability from the cluster Ci to the cluster Cj is represented as P(j
- the healthcare guidance support unit 115 provides a function of supporting prevention of the disease onset of a disease in the future, and reduction of the medical cost.
- a health insurance business operator wants to select subject people high in a prevention effect by means of the healthcare guidance by priority within the budget, and to provide a guidance appropriate for each of the subject people.
- a plurality of healthcare guidance services (such as a healthcare guidance service 1 and a healthcare guidance service 2) which the health insurance business operator can provide exist.
- the healthcare guidance service 1 is such a guidance as to reduce mainly the BMI value
- the healthcare guidance service 2 is such a guidance to reduce the cholesterol level.
- FIG. 17A is a flowchart of the processing by the support function for a health insurance business operator.
- Subject disease setting step 1701 a disease subject to the processing is set. For example, if diabetes, dyslipidemia, and hypertension, which are the three major lifestyle-related diseases are considered as the subject, the state characterization/reconfiguration unit 113 reconstructs the model by using items of the medical action, items of the health checkup, and items of the medical inquiry corresponding to diabetes, dyslipidemia, and hypertension out of the items of the healthcare cost formatted information. If all the diseases are considered as the subject, the model generated by the state transition model generation unit 108 is used.
- the estimated effect by the healthcare guidance service 1 is a weight loss by 5 kg, for example.
- Healthcare guidance effect estimation step 1703 medical cost reduction effects are estimated for all combinations of each of the healthcare guidance services and each of the healthcare guidance subject candidates.
- a description is given of a calculation method for the medical cost reduction effect for a combination of the healthcare guidance service 1 and a healthcare guidance subject candidate 1.
- a medical cost for the next year of the healthcare guidance subject candidate 1 if a healthcare guidance service is not provided is estimated.
- a state of the node corresponding to the items in this year is set based on values of the healthcare cost, health checkup, and medical inquiry of the healthcare guidance subject candidate 1 in this year, and the state transition/medical cost estimation unit 114 estimates a medical cost ( M1 ).
- a test value improved by the healthcare guidance service is set to the value of the healthcare guidance subject candidate 1 in this year, and the state transition/medical cost estimation unit 114 estimates a medical cost ( M2 ) in the next year.
- M1 is the estimated medical cost without the healthcare guidance
- M2 is the estimated medical cost with the healthcare guidance.
- a combination highest in the medical-cost-reduction cost-effectiveness is selected out of the combinations of each of the healthcare guidance services and each of the healthcare guidance subject candidates. Then, the selected healthcare guidance subject candidate is set as "selected”. Then, a combination highest in the medical-cost-reduction cost-effectiveness is selected out of combinations of each of the healthcare guidance services and each of the healthcare guidance subject candidates, which have not been selected. Then, the selected healthcare guidance subject candidate is set as "selected”. The combinations between each of the healthcare guidance services and each of the healthcare guidance subject candidates are selected in a descending order of the effect in this way. Finally, combinations high in the effect are selected within a budget of the healthcare guidance, thereby setting healthcare guidance subject people and healthcare guidance contents.
- Effect estimation step 1705 pieces of the medical-cost-reduction cost-effectiveness of the selected combinations in Healthcare guidance content planning step 1704 are summed, and a value acquired by subtracting the healthcare guidance cost from the medical cost reduction effect is output as the effect.
- FIG. 17B is a flowchart of the processing by the support function for a responsible person and a subject person.
- Subject disease setting step 1701 a disease subject to the processing is set. For example, if diabetes, dyslipidemia, and hypertension, which are the three major lifestyle-related diseases are considered as the subject, the state characterization/reconfiguration unit 113 reconstructs the model by using items of the medical action, items of the health checkup, and items of the medical inquiry corresponding to diabetes, dyslipidemia, and hypertension out of the items of the healthcare cost formatted information. If all the diseases are considered as the subject, the model generated by the state transition model generation unit 108 is used.
- a disease whose processing is requested by a subject person or a responsible person is selected.
- an item corresponding to a certain medical action is selected.
- dependencies of the item on all the other items are calculated.
- items equal to or more than a certain value in dependency on the selected item are extracted, and a model reconstructed by the state characterization/reconfiguration unit 113 based on the selected item and a list of the extracted items is used.
- the above-mentioned similarity between items may be used as the dependency.
- the state transition/medical cost estimation unit 114 estimates disease state transition probabilities and the medical costs of the respective diseases in the next year while the states of all the nodes are not set yet.
- the disease onset probability of each of the diseases is acquired as a probability of a case where the number of prescriptions for a node relating to a medical action corresponding to the disease in the next year is equal to or more than 1. This probability can be considered as an average disease onset probability of the disease.
- a state of the node corresponding to the item in this year is set based on values of the healthcare cost, the health checkup, and medical inquiry of the subject person in this year, and the state transition/medical cost estimation unit 114 estimates a disease state transition probability and a medical cost of each of the diseases in the next year.
- the disease onset probability of each of the diseases is the disease onset probability of the disease of the subject person.
- a ratio of a risk of developing disease of the subject person with respect to an average is calculated by dividing the disease onset probability of the disease of the subject person by an average disease onset probability of the disease for each of the diseases.
- High risk disease presentation step 1707 diseases having a risk of developing disease higher than the average by a predetermined threshold or more and risks thereof are presented.
- the subject person and the person responsible for the healthcare guidance can know the disease risks of the subject person.
- Improvement item presentation step 1708 test values each having a dependency equal to more than a certain value on a medical action node corresponding to the high risk disease calculated in High risk disease presentation step 1707 are presented. On this occasion, the above-mentioned similarity between items may be used as the dependency.
- Target value user input step 1709 a user is prompted to input an improvement target value (such as a target value of the weight) for each of the test items presented in Improvement item presentation step 1708.
- an improvement target value such as a target value of the weight
- Effect estimation step 1710 the value of each of the test items is updated by each of the target values input in Target value user input step 1709, and a disease onset probability of developing disease of each of the diseases after the target is attained is estimated by the same method as that in Step 1706, thereby presenting changes in the risks of developing disease.
- the user can recognize the changes in the risks of developing disease to set improvement targets, or to use the changes for self-management.
- the healthcare guidance support effective for the medical cost reduction can be carried out.
- the clustering is carried out by calculating the similarities between insured persons based on the healthcare cost information and the health checkup information, and classifying people into clusters each in a similar disease state based on the similarities as described above in the medical data analysis system according to the second embodiment. Therefore, insured persons in a similar state are clustered, and the state of the insured persons can be represented by the cluster.
- the state of the cluster is characterized by an average of states of the insured persons belonging to the cluster. Therefore, the state and the severity of a disease can be represented by the cluster.
- the state of the cluster is represented by averages of the BMI value, the blood sugar level, the number of prescriptions of a clinical action, and the medical cost.
- the cluster is characterized by an item large in separation from a population, and hence the cluster can be automatically characterized.
- the transition between states (state and severity of the disease) is modeled by the transition probability between clusters.
- One insured person in a certain year belongs to any one of clusters, and one state of the disease corresponds to one cluster.
- a cluster to which a person belonging to the cluster belongs next year can be represented by the transition probability. Therefore, how a future transition occurs can be represented in an intuitively easy to understand manner as a transition between clusters.
- how many people are in what state can be easily recognized by the number of insured persons belonging to each cluster.
- a difference in characteristic between groups can be recognized by comparing in a ratio of numbers of insured persons belonging to respective clusters between the groups.
- Differences in a disease rate, a ratio of serious case, and a state of increase in severity of diabetes can be recognized by comparing a group having a value equal to or less than a predetermined value in the blood sugar level and a group having a value more than the predetermined value in the blood sugar level with each other.
- This model enables an efficient use of the healthcare cost information and the health checkup information including a large number of items, thereby representing a large number of diseases and states thereof.
- This model enables accurate and precise estimation of the future state transition and the medical cost of a disease.
- a healthcare guidance can be efficiently and effectively supported by selecting healthcare guidance subject people and healthcare guidance contents based on the estimation result.
- a cluster to which a person subject to the analysis belongs is determined based on the similarity between the insured persons, and, thus, an unknown subject person can be clustered.
- the similarity between insured persons is calculated by using an item acquired by unifying a plurality of items of the healthcare cost information, and the similarity can thus be highly precisely calculated.
- the similarity between insured persons is calculated by using the difference in position of the insured persons with respect to a population, and the similarity can thus be calculated using the same scale even between different items.
- the medical-cost-reduction cost-effectiveness is calculated as M1 - M2 - M3 ( M1 : estimated medical cost without a healthcare guidance, M2 : estimated medical cost with the healthcare guidance, and M3 : cost required for the healthcare guidance), and the medical-cost-reduction cost-effectiveness can thus be accurately estimated.
- the risk of developing disease for an improvement target value is calculated by using the transition probability between clusters, and the risk reduction effect by the improvement can thus be displayed in an easy-to-understand manner.
- a transition probability of at least one of diabetes, hypertension, or dyslipidemia is selected, and the healthcare guidance can thus be provided for diabetes, dyslipidemia, and hypertension, which are the three major lifestyle-related diseases.
- the above-described configurations, functions, processing modules, and processing means, for all or a part of them, may be implemented by hardware: for example, by designing an integrated circuit.
- the above-described configurations and functions may be implemented by software, which means that a processor interprets and executes programs providing the functions.
- the information of programs, tables, and files to implement the functions may be stored in a storage device such as a memory, a hard disk drive, or an SSD (a Solid State Drive), or a storage medium such as an IC card, or an SD card.
- the drawings shows control lines and information lines as considered necessary for explanation but do not show all control lines or information lines in the products. It can be considered that almost of all components are actually interconnected.
Landscapes
- Engineering & Computer Science (AREA)
- Health & Medical Sciences (AREA)
- Business, Economics & Management (AREA)
- Medical Informatics (AREA)
- Public Health (AREA)
- Accounting & Taxation (AREA)
- Finance (AREA)
- Epidemiology (AREA)
- General Health & Medical Sciences (AREA)
- Primary Health Care (AREA)
- Biomedical Technology (AREA)
- Marketing (AREA)
- Theoretical Computer Science (AREA)
- Strategic Management (AREA)
- Technology Law (AREA)
- Physics & Mathematics (AREA)
- General Business, Economics & Management (AREA)
- General Physics & Mathematics (AREA)
- Economics (AREA)
- Development Economics (AREA)
- Data Mining & Analysis (AREA)
- Databases & Information Systems (AREA)
- Pathology (AREA)
- Information Retrieval, Db Structures And Fs Structures Therefor (AREA)
- Medical Treatment And Welfare Office Work (AREA)
- Management, Administration, Business Operations System, And Electronic Commerce (AREA)
Applications Claiming Priority (1)
| Application Number | Priority Date | Filing Date | Title |
|---|---|---|---|
| JP2013104659A JP6066825B2 (ja) | 2013-05-17 | 2013-05-17 | データ分析装置及び保健事業支援方法 |
Publications (2)
| Publication Number | Publication Date |
|---|---|
| EP2804121A2 true EP2804121A2 (de) | 2014-11-19 |
| EP2804121A3 EP2804121A3 (de) | 2015-04-08 |
Family
ID=50735920
Family Applications (1)
| Application Number | Title | Priority Date | Filing Date |
|---|---|---|---|
| EP20140168542 Withdrawn EP2804121A3 (de) | 2013-05-17 | 2014-05-15 | Analysesystem und Gesundheitswirtschaftsunterstützungsverfahren |
Country Status (4)
| Country | Link |
|---|---|
| US (1) | US20140343966A1 (de) |
| EP (1) | EP2804121A3 (de) |
| JP (1) | JP6066825B2 (de) |
| CN (1) | CN104166881A (de) |
Cited By (3)
| Publication number | Priority date | Publication date | Assignee | Title |
|---|---|---|---|---|
| CN111179102A (zh) * | 2019-12-25 | 2020-05-19 | 北京亚信数据有限公司 | 医疗保险核保风控方法、装置及存储介质 |
| CN111767283A (zh) * | 2020-06-19 | 2020-10-13 | 北京思特奇信息技术股份有限公司 | 一种数据系统监测方法和系统 |
| CN113434937A (zh) * | 2021-06-29 | 2021-09-24 | 广联达科技股份有限公司 | 设计模型转换为算量模型的方法、装置、设备和介质 |
Families Citing this family (21)
| Publication number | Priority date | Publication date | Assignee | Title |
|---|---|---|---|---|
| JP6436535B2 (ja) * | 2015-03-17 | 2018-12-12 | Kddi株式会社 | 予測モデル構築装置 |
| JP6468653B2 (ja) * | 2015-07-27 | 2019-02-13 | Kddi株式会社 | 予測モデル構築装置 |
| JP6474132B2 (ja) * | 2015-07-27 | 2019-02-27 | Kddi株式会社 | 選別装置 |
| JP6474103B2 (ja) * | 2015-08-07 | 2019-02-27 | Kddi株式会社 | 提示装置 |
| JP6555061B2 (ja) * | 2015-10-01 | 2019-08-07 | 富士通株式会社 | クラスタリングプログラム、クラスタリング方法、および情報処理装置 |
| JP6652699B2 (ja) * | 2015-10-05 | 2020-02-26 | 富士通株式会社 | アノマリ評価プログラム、アノマリ評価方法、および情報処理装置 |
| US10055435B2 (en) * | 2016-05-04 | 2018-08-21 | International Business Machines Corporation | Interactive presentation of large scale graphs |
| JP6932654B2 (ja) * | 2016-07-06 | 2021-09-08 | オムロンヘルスケア株式会社 | リスク分析システム及びリスク分析方法 |
| JP6861481B2 (ja) * | 2016-07-06 | 2021-04-21 | オムロンヘルスケア株式会社 | リスク分析システム及びリスク分析方法 |
| JP6901308B2 (ja) * | 2017-04-14 | 2021-07-14 | 株式会社日立製作所 | データ分析支援システム及びデータ分析支援方法 |
| JP6905892B2 (ja) | 2017-08-04 | 2021-07-21 | 株式会社日立製作所 | 計算機システム |
| JP6537121B1 (ja) * | 2017-12-19 | 2019-07-03 | 学校法人産業医科大学 | 傷病別医療費推計装置および方法並びにプログラム |
| JP6999403B2 (ja) * | 2017-12-20 | 2022-01-18 | 富士フイルム株式会社 | 健診結果出力装置とその作動方法および作動プログラム |
| JP6863591B2 (ja) * | 2018-01-10 | 2021-04-21 | オムロンヘルスケア株式会社 | リスク分析システム及びリスク分析方法 |
| JP7007027B2 (ja) | 2018-03-30 | 2022-01-24 | Necソリューションイノベータ株式会社 | 予測システム、モデル生成システム、方法およびプログラム |
| JP7158175B2 (ja) * | 2018-05-16 | 2022-10-21 | 日鉄ソリューションズ株式会社 | 情報処理装置、システム、情報処理方法及びプログラム |
| JP6979392B2 (ja) * | 2018-07-26 | 2021-12-15 | 株式会社日立製作所 | 分析方法、分析装置及びプログラム |
| CN112428263B (zh) * | 2020-10-16 | 2022-06-10 | 北京理工大学 | 机械臂控制方法、装置及聚类模型训练方法 |
| WO2023079712A1 (ja) * | 2021-11-05 | 2023-05-11 | 日本電信電話株式会社 | 処理装置、処理方法及び処理プログラム |
| WO2024116536A1 (ja) * | 2022-11-30 | 2024-06-06 | 一般財団法人Lhs研究所 | 健康管理支援システム、健康管理支援方法、及びプログラム |
| CN119968683A (zh) * | 2022-11-30 | 2025-05-09 | 一般财团法人Lhs研究所 | 健康管理支援系统、健康管理支援方法以及程序 |
Citations (1)
| Publication number | Priority date | Publication date | Assignee | Title |
|---|---|---|---|---|
| JP2012128670A (ja) | 2010-12-15 | 2012-07-05 | Hitachi Ltd | 保健事業支援システム、保険事業支援装置、及び保険事業支援プログラム |
Family Cites Families (11)
| Publication number | Priority date | Publication date | Assignee | Title |
|---|---|---|---|---|
| US20040078228A1 (en) * | 2002-05-31 | 2004-04-22 | Fitzgerald David | System for monitoring healthcare patient encounter related information |
| CN101410842A (zh) * | 2003-05-21 | 2009-04-15 | 西门子医疗健康服务公司 | 用于健康护理及其他领域的服务订购系统与用户界面 |
| US8684922B2 (en) * | 2006-05-12 | 2014-04-01 | Bao Tran | Health monitoring system |
| GB2440562A (en) * | 2006-08-03 | 2008-02-06 | Sony Uk Ltd | Apparatus and method of data organisation |
| US8200506B2 (en) * | 2006-12-19 | 2012-06-12 | Accenture Global Services Limited | Integrated health management platform |
| JP4863908B2 (ja) * | 2007-03-16 | 2012-01-25 | 株式会社ソニー・コンピュータエンタテインメント | データ処理装置、データ処理方法、及びデータ処理プログラム |
| JP2009087057A (ja) * | 2007-09-28 | 2009-04-23 | Sharp Corp | ベクトルデータをクラスタリングするクラスタリング装置、クラスタリング方法、プログラムおよび記録媒体 |
| US9015633B2 (en) * | 2007-10-22 | 2015-04-21 | Sony Corporation | Data management apparatus and method for organizing data elements into multiple categories for display |
| EP2701131A2 (de) * | 2008-05-12 | 2014-02-26 | Earlysense Ltd. | Überwachung, Prognose und Behandlung von klinischen Episoden |
| EP2583237A4 (de) * | 2010-06-20 | 2017-02-15 | Univfy, Inc. | Verfahren zur bereitstellung von entscheidungsunterstützungssystemen und elektronischen patientenakten für reproduktive pflege, vorgeburtliche pflege, fruchtbarkeitsbehandlungen und andere gesundheitsbehandlungen |
| US20130297342A1 (en) * | 2012-05-07 | 2013-11-07 | Healtheo360 | Computer-based system for managing a patient support and information network |
-
2013
- 2013-05-17 JP JP2013104659A patent/JP6066825B2/ja active Active
-
2014
- 2014-05-15 EP EP20140168542 patent/EP2804121A3/de not_active Withdrawn
- 2014-05-15 US US14/278,534 patent/US20140343966A1/en not_active Abandoned
- 2014-05-16 CN CN201410208266.5A patent/CN104166881A/zh active Pending
Patent Citations (1)
| Publication number | Priority date | Publication date | Assignee | Title |
|---|---|---|---|---|
| JP2012128670A (ja) | 2010-12-15 | 2012-07-05 | Hitachi Ltd | 保健事業支援システム、保険事業支援装置、及び保険事業支援プログラム |
Non-Patent Citations (1)
| Title |
|---|
| Y. F. HU: "Efficient, High-Quality Force-Directed Graph Drawing", THE MATHEMATICA JOURNAL, vol. 10, no. 1, 2006, pages 37 - 71 |
Cited By (5)
| Publication number | Priority date | Publication date | Assignee | Title |
|---|---|---|---|---|
| CN111179102A (zh) * | 2019-12-25 | 2020-05-19 | 北京亚信数据有限公司 | 医疗保险核保风控方法、装置及存储介质 |
| CN111179102B (zh) * | 2019-12-25 | 2023-10-03 | 北京亚信数据有限公司 | 医疗保险核保风控方法、装置及存储介质 |
| CN111767283A (zh) * | 2020-06-19 | 2020-10-13 | 北京思特奇信息技术股份有限公司 | 一种数据系统监测方法和系统 |
| CN111767283B (zh) * | 2020-06-19 | 2023-08-18 | 北京思特奇信息技术股份有限公司 | 一种数据系统监测方法和系统 |
| CN113434937A (zh) * | 2021-06-29 | 2021-09-24 | 广联达科技股份有限公司 | 设计模型转换为算量模型的方法、装置、设备和介质 |
Also Published As
| Publication number | Publication date |
|---|---|
| EP2804121A3 (de) | 2015-04-08 |
| JP6066825B2 (ja) | 2017-01-25 |
| JP2014225175A (ja) | 2014-12-04 |
| CN104166881A (zh) | 2014-11-26 |
| US20140343966A1 (en) | 2014-11-20 |
Similar Documents
| Publication | Publication Date | Title |
|---|---|---|
| EP2804121A2 (de) | Analysesystem und Gesundheitswirtschaftsunterstützungsverfahren | |
| Delias et al. | Supporting healthcare management decisions via robust clustering of event logs | |
| US7584166B2 (en) | Expert knowledge combination process based medical risk stratifying method and system | |
| JP6066826B2 (ja) | 分析システム及び保健事業支援方法 | |
| JP6182431B2 (ja) | 医療データ分析システム、及び医療データを分析する方法 | |
| Sáez et al. | On the influence of class noise in medical data classification: Treatment using noise filtering methods | |
| JP2014225175A5 (de) | ||
| US11984226B2 (en) | Systems and methods for selecting an intervention based on effective age | |
| JP6038727B2 (ja) | 分析システム及び分析方法 | |
| Kamila et al. | Pareto-based multi-objective optimization for classification in data mining | |
| US20200303071A1 (en) | Implementation of machine-learning based query construction and pattern identification through visualization in user interfaces | |
| JPWO2015132903A1 (ja) | 医療データ分析システム、医療データ分析方法及び記憶媒体 | |
| Kampa et al. | Sparse optimization in feature selection: application in neuroimaging | |
| CN114048379A (zh) | 服务推荐方法及装置、存储介质和电子设备 | |
| CN109564782B (zh) | 基于医院人口统计的电子临床决策支持设备 | |
| US20240274301A1 (en) | Systems and methods for clinical cluster identification incorporating external variables | |
| Cauchi et al. | Individualized survival predictions using state space model with longitudinal and survival data | |
| Guglielmi et al. | Semiparametric Bayesian models for clustering and classification in the presence of unbalanced in-hospital survival | |
| Ouyang et al. | A design of experiments approach to validation sampling for logistic regression modeling with error-prone medical records | |
| Steele et al. | Multilevel structural equation models for longitudinal data where predictors are measured more frequently than outcomes: An application to the effects of stress on the cognitive function of nurses | |
| Thulasi et al. | Classification of diabetic patients records using Naïve Bayes classifier | |
| Pouya et al. | Enhancing Adaboost performance in the presence of class-label noise: A comparative study on EEG-based classification of schizophrenic patients and benchmark datasets | |
| Serbout et al. | Toward consumption characterization in a pharmaceutical products supply chain | |
| Badolato et al. | The limits of predicting individual-level longevity | |
| De Amorim | Learning feature weights for K-Means clustering using the Minkowski metric |
Legal Events
| Date | Code | Title | Description |
|---|---|---|---|
| PUAI | Public reference made under article 153(3) epc to a published international application that has entered the european phase |
Free format text: ORIGINAL CODE: 0009012 |
|
| 17P | Request for examination filed |
Effective date: 20140603 |
|
| AK | Designated contracting states |
Kind code of ref document: A2 Designated state(s): AL AT BE BG CH CY CZ DE DK EE ES FI FR GB GR HR HU IE IS IT LI LT LU LV MC MK MT NL NO PL PT RO RS SE SI SK SM TR |
|
| AX | Request for extension of the european patent |
Extension state: BA ME |
|
| PUAL | Search report despatched |
Free format text: ORIGINAL CODE: 0009013 |
|
| AK | Designated contracting states |
Kind code of ref document: A3 Designated state(s): AL AT BE BG CH CY CZ DE DK EE ES FI FR GB GR HR HU IE IS IT LI LT LU LV MC MK MT NL NO PL PT RO RS SE SI SK SM TR |
|
| AX | Request for extension of the european patent |
Extension state: BA ME |
|
| RIC1 | Information provided on ipc code assigned before grant |
Ipc: G06F 19/00 20110101AFI20150302BHEP |
|
| 17Q | First examination report despatched |
Effective date: 20160624 |
|
| STAA | Information on the status of an ep patent application or granted ep patent |
Free format text: STATUS: THE APPLICATION HAS BEEN WITHDRAWN |
|
| 18W | Application withdrawn |
Effective date: 20171006 |