EP2402876A2 - Verfahren und Vorrichtung zum Korrelieren von Simulationsmodellen mit physischen Vorrichtungen auf Grundlage von Korrelationsmetriken - Google Patents
Verfahren und Vorrichtung zum Korrelieren von Simulationsmodellen mit physischen Vorrichtungen auf Grundlage von Korrelationsmetriken Download PDFInfo
- Publication number
- EP2402876A2 EP2402876A2 EP11169770A EP11169770A EP2402876A2 EP 2402876 A2 EP2402876 A2 EP 2402876A2 EP 11169770 A EP11169770 A EP 11169770A EP 11169770 A EP11169770 A EP 11169770A EP 2402876 A2 EP2402876 A2 EP 2402876A2
- Authority
- EP
- European Patent Office
- Prior art keywords
- metrics
- baseline
- correlation
- metric
- normalized
- Prior art date
- Legal status (The legal status is an assumption and is not a legal conclusion. Google has not performed a legal analysis and makes no representation as to the accuracy of the status listed.)
- Withdrawn
Links
Images





Classifications
-
- G—PHYSICS
- G06—COMPUTING OR CALCULATING; COUNTING
- G06F—ELECTRIC DIGITAL DATA PROCESSING
- G06F30/00—Computer-aided design [CAD]
- G06F30/20—Design optimisation, verification or simulation
-
- G—PHYSICS
- G06—COMPUTING OR CALCULATING; COUNTING
- G06F—ELECTRIC DIGITAL DATA PROCESSING
- G06F2111/00—Details relating to CAD techniques
- G06F2111/10—Numerical modelling
Definitions
- the present invention embodiments pertain to data correlation.
- the present invention embodiments pertain to correlating a simulation model with a physical device based on correlation metrics and plotting the metrics to indicate variance between the simulation model and device.
- Numerical analysis is widely used to find approximate solutions for problems lacking exact solutions. In mathematics, these problems can range from approximating the values of roots, e.g., square roots, and the value of ⁇ , to evaluating integrals and differential equations.
- the mathematical problems may represent many real-world problems for which numerical analysis can provide solutions (e.g., weather prediction, scheduling and pricing algorithms, crash simulation, explosion modeling, etc.).
- simulation is highly desirable because of the lower cost or the impracticality of building a prototype.
- a simulation is preferred over building a physical device or test case for each test scenario.
- building a test case is impractical due to scaling effects (e.g., it is impractical to build a physical prototype to simulate world weather patterns or to simulate earthquakes).
- a method, program product, and apparatus are provided to correlate operation of a first system and a second system.
- correlation metrics are generated for a first set of data and a second set of data
- a correlation score is computed between the correlation metrics
- a plot of the correlation metrics and correlation score is displayed.
- the apparatus includes at least an output module and a processor.
- the output module is coupled to a display to present the plurality of correlation metrics and the correlation score.
- the processor controls the presentation of the plurality of correlation metrics and the correlation score.
- the processor includes a correlation module to generate a first set of metrics from the first set of data produced during operation of the first system, generate a second set of metrics that correspond to each of the first set ofmetrics from the second set of data produced during operation of the second system, and compute a correlation score for the first and second systems based on differences between the first set of metrics and the second set of metrics.
- the first set of metrics, the second set of metrics, and the correlation score are presented on the display via the output module to indicate the similarity of operation of the first and second systems.
- model developers have devised various tests or metrics to compare how well a simulation models a real-world system, e.g., simulation data may be compared to actual test data using test statistics or metrics.
- a structure may be fitted with strain gauges and then be subjected to an impulse or force, e.g., a mass is dropped on the structure. The outputs of the test strain gauges are recorded. The structure and strain gauge outputs may be simulated in software using FEA.
- the simulated strain gauge outputs are then compared to the recorded test strain gauge outputs using a metric, e.g., a root-mean square (RMS) error between the simulation strain gauge outputs and test strain gauge outputs.
- a metric e.g., a root-mean square (RMS) error between the simulation strain gauge outputs and test strain gauge outputs.
- RMS root-mean square
- the present invention embodiments provide a methodology and apparatus that provides a consistent and objective approach to quantitatively correlate test data, simulation results, or test data and simulation results. Also provided is a concise way to display correlation metrics and compute an associated correlation score based on the correlation metrics.
- FIG. 1 An example device configured to generate and display correlation metrics is illustrated in Fig. 1 .
- the device comprises a general purpose computer 100 with a processor 110, a network interface 120, a plurality of input/output (IO) modules 130, a display 140, and a correlation module 300.
- General purpose computer 100 may further include other application specific components (e.g., a sensor interface module or other data gathering devices for the collection of test data).
- Processor 110 is preferably implemented by a conventional microprocessor or controller and controls the various components and modules in accordance with the techniques described below.
- Network interface 120 is preferably implemented by a conventional network interface, e.g., a network interface card (NIC), and provides network communications for general purpose computer 100.
- NIC network interface card
- IO modules 130 are preferably implemented by conventional IO components typically included on a motherboard of general purpose computer 100 and may include IO interfaces for a keyboard, a computer mouse, and a video output for a computer display monitor e.g., for output to display 140.
- correlation module 300 contains the intelligence to generate correlation metrics associated with two or more sets of data and display the metrics to a user according to a present invention embodiment.
- Module 300 may be in the form of computer instructions that are executed by processor 110 or may be implemented in hardware, e.g., logic built into an application specific integrated circuit (ASIC) or logic programmed into a field programmable gate array (FPGA).
- ASIC application specific integrated circuit
- FPGA field programmable gate array
- FIG. 2 An example radial or spider plot 200 of the correlation metrics and score is depicted in Fig. 2 .
- a series of metrics 1-8 are being compared for two sets of data.
- Spider plot 200 has a series of concentric dashed rings or circles 210, and a solid baseline ring 220. The rings 210 and 220 are labeled with a percentage deviation from baseline 230.
- the baseline ring 220 represents the first set of metrics, e.g., metrics generated from test data collected for a real-world system.
- a second set of metrics 240 are plotted as a thick line relative to baseline ring 220.
- the second set ofmetrics 240 may be generated from data collected from a simulation of the real-world system. Alternatively, the two sets of data could come from two simulation runs and the simulation metrics are compared to each other or the two sets of data could come from two real-world tests and the test metrics are compared to each other.
- General purpose computer 100 preferably employs Graphical User Interface (GUI) functionality to display spider plot 200 with normalized metrics plotted against the baseline.
- Spider plot 200 depicts the first set ofmetrics 220 as a baseline of zero percent and the second set of metrics 240 is plotted as a percentage deviation from the baseline metrics 220.
- Spider plot 200 shows deviations from the baseline ring 220 for the second set of metrics 240 of approximately+5%, 0%, +8%, -1%, 0%, -7%, +10%, and-3% for metrics 1-8, respectively.
- Metrics with little or no deviation from the baseline, e.g., metrics 2, 4, and 5, correlate closely with the real-world system being modeled.
- Metrics with a larger deviation, e.g., metrics 3, 6, and 7, do not correlate as closely with the real-world system and indicate areas in which the simulation model may be improved.
- the absolute values of all the deviations from the baseline could be summed to attain an overall correlation score. Summing the absolute values of the above deviations from the baseline yields a correlation score of 34. If the metrics are not equally important, then weights could be assigned to each metric before computing the correlation score, i.e., a weighted summation or average may be used to compute the correlation score. The correlation score may also be displayed on the display 140.
- Spider plot 200 is drawn using concentric rings 210 and 220, but could be drawn using concentric polygons, e.g., for eight metrics concentric octagons could be used.
- FIG. 3 A procedural flowchart generally outlining the manner in which correlation module 300 generates correlation metrics and computes a correlation score according to a present invention embodiment is illustrated in Fig. 3 .
- a first and a second set of data have already been generated or captured, e.g., a set of simulation data and a set of test data.
- the first and second sets of data may be preprocessed at step 310.
- the test data and simulation data may be subject to preprocessing by an application, whereby the amount of data may be reduced.
- the application Prior to evaluating the performance metrics, the application formats the data to ensure consistent calculation of all metrics.
- the application may provide a user with the ability to convert data between various units using, e.g., a dropdown box. In one example, strain data may be converted to micro-strain based upon the user selection in the dropdown box.
- the application may also provide for time alignment of the data sets to ensure a reliable correlation score.
- the minimum time of all data sets are set to 0.0 seconds. This eliminates test data preceding 0.0 seconds or data that are not pertinent to the test.
- the application may also set the maximum time for each data set by using the lesser of the two maximum time values from each data file. This will allow the analysis of the maximum amount of data for the calculations.
- Data for both the simulation and test may be filtered.
- LPF Butterworth low-pass filter
- Design of the filter may include 3dB of ripple in the pass-band and 10 decibels (dB) of attenuation in the 5 kHz stop-band.
- Filter order may be calculated using, for example, the MATLAB function buttord. With the order of the filter defined, together with the pass-band and stop-band definition, the MATLAB function, butter, calculates the filter coefficients. These filter coefficients define the filter and are used by the MATLAB filter command, filtfilt, to filter the data forwards and backwards, mitigating any phase distortion.
- An example response curve for such a low-pass filter is shown in Fig. 4 .
- the application may perform data decimation as the final step in data reduction prior to calculating the metrics.
- Data may be decimated to 100 kHz, thereby generating congruent sampling rates for the simulation and test data. Identical sampling rates and time duration ensures that any Fast Fourier Transforms (FFTs) of both test and simulation data have equal number and length frequency bands.
- FFTs Fast Fourier Transforms
- a first set of metrics is generated from a first set of data, e.g., test data, at step 320.
- a second set ofmetrics is generated from a second set of data, e.g., simulation data, at step 330. Since the metrics are to be compared, the types of metrics generated from the first and second sets of data are the same.
- Test data 510 and simulation data 520 are plotted as microstrain versus time.
- Test data 510 was captured from a strain gauge labeled s247 that is coupled to a structure. A force was applied to the structure and the response from strain gauge s247 was recorded.
- Simulation data 520 were derived from a mathematical model of the structure and strain gauge s247. Simulation data 520 may be generated using commercially available mathematics simulation software, such as MATLAB or Mathematica that runs on a general purpose computer.
- Correlation metrics were generated from both sets of data 510 and 520.
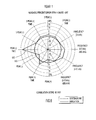
- a spider plot of the correlation metrics generated in year 1 is shown in Fig. 6 .
- the correlation metrics for the test data 510 are plotted as a dodecagon or baseline ring 610.
- Simulation correlation metrics 620 are plotted relative to the baseline 610.
- the spider plot provides a convenient way of highlighting highly similar or dissimilar correlation metrics.
- Example correlation metrics and corresponding weights are described.
- the metrics include peak to peak, timing, and frequency correlation metrics. However, any suitable metrics and weights may be used.
- the Peak (+) Time Metric is the percent error between an occurrence time of the maximum response value of the FEA and an occurrence time of the maximum response value of the test data, divided by one millisecond.
- the one millisecond denominator normalizes the calculation by mitigating the effect of small time denominator at an early time or a large time denominator at a late time that would otherwise be used in the calculation.
- the Peak (-) Time Metric is the percent error between an occurrence time of the minimum response value of the FEA and an occurrence time of the minimum response value of the test data, divided by one millisecond.
- the one millisecond denominator normalizes the calculation by mitigating the effect of small time denominator at an early time or a large time denominator at a late time that would otherwise be used in the calculation.
- the 3 Peaks (+) Metric is the average absolute difference between the subsequent 3 largest positive response values following the maximum value, divided by the average of the test's subsequent 3 largest positive response values.
- the 3 Peaks (+) Metric is given a weight of 7.5% as shown in Eq. 5.
- 3 Peak + 7.5 % ⁇ average ⁇ FEA max 3 - Test max 3 average Test max 3 ⁇ 100
- the 3 Peaks (+) Time Metric is the average absolute difference between the occurrence times of the subsequent 3 largest positive response values following the maximum value, divided by one millisecond.
- the one millisecond denominator normalizes the calculation by mitigating the effect of small time denominator at an early time or a large time denominator at a late time that would otherwise be used in the calculation.
- the 3 Peaks (-) Time Metric is given a weight of 2.5% as shown in Eq. 6.
- 3 Peak + Time 2.5 % ⁇ average ⁇ FEA max 3 - Test max 3 0.001 ⁇ sec ⁇ 100
- the 3 Peaks (-) Metric is the average absolute difference between the subsequent 3 most negative response values following the minimum value, divided by the average of the test's subsequent 3 most negative response values.
- the 3 Peaks (-) Metric is given a weight of 7.5% as shown in Eq. 7.
- 3 Peak - 7.5 % ⁇ average ⁇ FEA min 3 - Test min 3 average Test min 3 ⁇ 100
- the 3 Peaks (-) Time Metric is the average absolute difference between the occurrence times of the subsequent 3 most negative response values following the minimum value, divided by one millisecond.
- the one millisecond denominator normalizes the calculation by mitigating the effect of small time denominator at an early time or a large time denominator at a late time that would otherwise be used in the calculation.
- the 3 Peaks (-) Time Metric is given a weight of 2.5% as shown in Eq. 8.
- 3 Peak - Time 2.5 % ⁇ average ⁇ FEA min 3 - Test min 3 0.001 ⁇ sec ⁇ 100
- the Frequency (0-5 kHz) Metric is the percent error between the dominant frequency components of the FEA output and test output over the 0 to 5 kHz band, and divided by the 5 kHz bandwidth.
- the 5 kHz denominator normalizes the calculation by mitigating the affect of a small denominator at lower frequencies or a large denominator at higher frequencies that would otherwise be used in the calculation.
- the Frequency (0-5 kHz) Metric is given a weight of 10.0% as shown in Eq. 9.
- Frequency 0 - 5 kHz 10.0 % ⁇ FEA 0 - 5 ⁇ KHz - Test 0 - 5 ⁇ KHz 5 ⁇ KHz ⁇ 100
- the Frequency (0-5 kHz) Absolute Magnitude Metric is the percent error between the magnitude of the dominant frequency of the FEA and the magnitude of the dominant frequency of the test data over the 0 to 5 kHz band.
- the Frequency (0-5 kHz) Absolute Magnitude Metric is given a weight of 5.0% as shown in Eq. 10.
- Freq 0 - 5 kHz Abs . Mag . 5.0 % ⁇ FEA mag ⁇ 0 - 5 ⁇ KHz - Test mag ⁇ 0 - 5 ⁇ KHz Test mag ⁇ 0 - 5 ⁇ KHz ⁇ 100
- the Frequency (5-10 kHz) Metric is the percent error between the dominant frequency components of the FEA output and test output over the 5 to 10 kHz band, and divided by the 5 kHz bandwidth.
- the 5 kHz denominator normalizes the calculation by mitigating the effect of a small denominator at lower frequencies or a large denominator at higher frequencies that would otherwise be used in the calculation.
- the Frequency (5-10 kHz) Metric is given a weight of 10.0% as shown in Eq. 11.
- Frequency 5 - 10 ⁇ kHz 10.0 % ⁇ FEA 5 - 10 ⁇ KHz - Test 5 - 10 ⁇ KHz 5 ⁇ KHz ⁇ 100
- the Frequency (5-10 kHz) Absolute Magnitude Metric is the percent error between the magnitude of the dominant frequency of the FEA and the magnitude of the dominant frequency of the test data over the 5 to 10 kHz band.
- the Frequency (5-10 kHz) Absolute Magnitude Metric is given a weight of 5.0% as shown in Eq. 12.
- Freq 5 - 10 kHz Abs . Mag . 5.0 % ⁇ FEA mag ⁇ 5 - 10 ⁇ KHz - Test mag ⁇ 5 - 10 ⁇ KHz Test mag ⁇ 5 - 10 ⁇ KHz ⁇ 100
- the sets of data are normalized relative to each other at step 340.
- the metrics for one set of data are normalized relative to the other such that one set of metrics forms a baseline.
- each of the metrics in the second set of metrics are mathematically divided by corresponding metrics in the first set of metrics, whereby each metric in the first set of metrics become a baseline, e.g., a baseline of zero or one, and each metric in the second set of metrics is normalized thereto.
- Metrics generated in equations 1-12 are normalized to the test data by dividing the metric by corresponding test data or a neutral parameter, e.g., .001 seconds or 5 KHz.
- Other mathematical operations may be performed on the data sets, e.g., quantization or a Euclidian norm operation.
- the normalized metrics are presented, displayed, or otherwise plotted against the baseline at step 350, for example, the second set of metrics 620 as shown in Fig. 6 .
- a correlation score is computed based on differences between the first and second sets of metrics at step 360.
- the Correlation Score provides the final score, rating the correlation of simulation data with test data. Summing the absolute values of the twelve weighted metric scores described above produces the Correlation Score as shown in Eq. 13. Perfect correlation would result in a Correlation Score of 0.0, while an imperfect correlation score ranges between 0.0 and infinity (an upper bound does not exist).
- the correlation score for the set of model correlation metrics depicted in Fig. 6 is 60.1001.
- the metrics used for plotting and computing the correlation score are chosen based upon the real-world system that is being modeled. For example, weighted performance metrics may be chosen and vetted through a peer review process. The metrics may be chosen to correlate system response in both the time and/or frequency domains. The metrics may be weighted based upon their peer reviewed importance or other industry standards. The summation of weighted metrics leads to a correlation score that is a quantitative measure of how well the computational model represents the response of the system based upon the chosen weighting scheme. In addition to correlating current simulation results with test data, the correlation score provides a baseline to compare future results and determine if updates to the computational model have a positive effect.
- Test data 510 is the same test data that was shown in Fig. 5 .
- the simulation data 710 were generated in year 2 from an updated simulation model (the mathematical model of the structure and strain gauge s247). Test data 510 and simulation data 710 are plotted as microstrain versus time.
- Correlation metrics were generated from both sets of data 510 and 710.
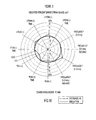
- a spider plot of the correlation metrics generated in year 2 is shown in Fig. 8 .
- the correlation metrics for the test data 510 are plotted as the baseline ring 610 as in Fig. 6 .
- Simulation correlation metrics 810 are plotted relative to the baseline 610.
- the types of correlation metrics shown in Fig. 8 are the same as those described in connection with Fig. 6 .
- the correlation score for the correlation metrics generated in year 2 is 20.4154. This correlation score is lower than the correlation score generated in year 1 and indicates that simulation model has improved since year 1.
- Test data 510 is the same test data that was shown in Figs. 5 and 7 .
- the simulation data 910 were generated in year 3 from a further updated simulation model. Test data 510 and simulation data 910 are plotted as microstrain versus time.
- Correlation metrics were generated from both sets of data 510 and 910.
- a spider plot of the correlation metrics generated in year 3 is shown in Fig. 10 .
- the correlation metrics for the test data 510 are plotted as the baseline ring 610 as in Figs. 6 and 8 .
- Simulation correlation metrics 1010 are plotted relative to the baseline 610.
- the types of correlation metrics shown in Fig. 10 are the same as those described in connection with Fig. 6 .
- the correlation score for the correlation metrics generated in year 3 is 15.1404. This correlation score is lower than the correlation score generated in year 2 and indicates that simulation model has improved since year 2.
- accelerometers may be attached to the structure in addition to or in lieu of the strain gauges.
- the accelerations from the accelerometer are recorded.
- Simulation data are derived from a mathematical model of the structure and the accelerometer.
- Correlation metrics were generated from the recorded accelerometer data and the simulation data.
- a spider plot of the correlation metrics is shown in Fig. 11 .
- the correlation metrics for the acceleration test data are plotted as the baseline ring 1110.
- Simulation correlation metrics 1120 are plotted relative to the baseline ring 1110. Starting with the Peak (+) Metric and preceding clockwise, each of the correlation metrics shown in Fig. 11 will now be described.
- the Peak (+/-) Metrics, Peak (+/-) Time Metrics, Frequency (0-5/5-10kHz), and Frequency (0-5/5-10kHz) Absolute Magnitude Metrics operate essentially as described above.
- the 3 Peak Metrics are not used and two new metrics have been added that are more germane to modeling accelerometer simulations.
- the new metrics are RMS error between the test data and simulation data and the Los Alamos National Laboratory (LANL) Shock Response Spectrum (SRS).
- the RMS metric is the percent error between the RMS value of the FEA results and the RMS value of the test data divided by the RMS value of the test data. For purposes of calculating the correlation score, the RMS Error metric is given a weight of 17.5% as shown in Eq. 14.
- the RMS (FEA) used in Eq. 14 is calculated according to Eq. 15.
- RMS Error 17.5 % ⁇ RMS FEA - RMS Test RMS Test
- RMS FEA FEA 2 2 + FEA 2 2 + ⁇ + FEA n 2 n
- the LANL SRS metric is the percent error between the FEA results and the test data using the SRS Factor , where the SRS Factor is the average difference between computer simulation results and test data for each peak response comprising the SRS.
- the use of common logarithms in the SRS Factor calculation ensures positive integer values.
- the LANL SRS Metric is given a weight of 17.5% as shown in Eq. 16.
- the SRS is a plot of the maximum peak response corresponding to a specific forcing function to a single degree-of-freedom (SDOF) system as a function of the natural frequency of the system. Numerical analysis is used to compute the peak response of the SDOF for the specific forcing function.
- SDOF single degree-of-freedom
- the forcing function input is acceleration data recorded during testing or predicted by the computer model.
- Eqs. 17 and 18 provide an example calculation of the SRS Factor used in Eq. 16.
- LANL SRS 17.5 % ⁇ SRS FACTOR - 1
- the functions of the general purpose computer employed by the present invention embodiments may be implemented and/or performed by any quantity of any personal or other type of computer system (e.g., IBM-compatible, Apple, Macintosh, laptop, rack or cluster systems, palm pilot, etc.) or processing device (e.g., microprocessor, controller, circuitry, etc.), and may include any commercially available operating system (e.g., Windows, OS/2, Unix, Linux, etc.) and any commercially available or custom software (e.g., browser software, communications software, server software). These systems may include any types ofmonitors and input devices (e.g., keyboard, mouse, touch screens, etc.) to enter and/or view information.
- any types of computer system e.g., IBM-compatible, Apple, Macintosh, laptop, rack or cluster systems, palm pilot, etc.
- processing device e.g., microprocessor, controller, circuitry, etc.
- microprocessor, controller, circuitry, etc. e.g., microprocessor, controller
- Databases for storing test and simulation data may be implemented by any quantity of any type of conventional or other databases (e.g., relational, hierarchical, etc.) or storage structures (e.g., files, data structures, disk or other storage, etc.).
- the databases may store any desired information arranged in any fashion (e.g., tables, relations, hierarchy, etc.).
- the databases may be queried with any quantity or type, and request any type of database or other operation.
- the queries may include any desired format and may be directed toward any conventional or other database or storage unit.
- the correlation metrics may be of any type or quantity.
- the correlation metrics may be grouped or combined in any manner and generated any number of times, e.g., using Monte Carlo simulation.
- the correlation score may be computed in any manner suitable for indicating a similarity of operation between two or more systems.
- the systems may be of any type or quantity, and represent real-world systems, simulations of real-world systems, or both.
- Mathematical operations performed on the underlying data, the correlation metrics, and the correlation score may be of any type including matrix operations, quantization, normalization, etc., to produce an indication of similarity of operation between two or more systems.
- the display of the correlation metrics and score may be radial plots, spider plots, nested plots (with drill-down options via a GUI), or any visual representation for presenting a plurality ofmetrics and the associated correlation score.
- the software e.g., the correlation module or logic
- the computer systems and/or processing devices of the present invention embodiments may be implemented in any desired computer language (e.g., ADA, C, C++, C#, Java, etc.) and could be developed by one of ordinary skill in the computer arts based on the functional descriptions contained in the specification and flow charts illustrated in the drawings.
- the software is extensible and may be an add-on module to various simulation packages, e.g., Ansys FLUENT ® , Abaqus ® , Simulation Environment and Response Program Execution Nesting Tool (SERPENT), Aeroheating and Thermal Analysis Code (ATAC), etc.
- any references herein of software performing various functions generally refer to computer systems or processors performing those functions under software control.
- the software of the present invention embodiments may be available on a recordable medium (e.g., magnetic or optical mediums, magneto-optic mediums, floppy diskettes, CD-ROM, DVD, memory devices, etc.) for use on stand-alone systems or systems connected by a network or other communications medium, and/or may be downloaded (e.g., in the form of carrier waves, packets, etc.) to systems via a network or other communications medium.
- a recordable medium e.g., magnetic or optical mediums, magneto-optic mediums, floppy diskettes, CD-ROM, DVD, memory devices, etc.
- the computer systems and/or processing devices of the present invention embodiments may alternatively be implemented by any type of hardware and/or other processing circuitry.
- the functions of the computer systems and/or processing devices may be implemented by logic encoded in one or more tangible media (e.g., embedded logic such as an application specific integrated circuit (ASIC), digital signal processor (DSP) instructions, software that is executed by a processor, etc.).
- ASIC application specific integrated circuit
- DSP digital signal processor
- functions of the computer systems and/or processing devices may be implemented with fixed logic or programmable logic (e.g., software/computer instructions executed by a processor) by way of a programmable processor, programmable digital logic (e.g., field programmable gate array (FPGA)) or an ASIC that comprises fixed digital logic, or a combination thereof.
- FPGA field programmable gate array
- the various functions ofthe computer systems and/or processing devices ofthe present invention embodiments may be distributed in any manner among any quantity of software and hardware modules or units, processing or computer systems and/or circuitry, where the computer or processing systems may be disposed locally or remotely of each other and communicate via any suitable communications medium (e.g., LAN, WAN, Intranet, Internet, hardwire, modem connection, wireless, etc.).
- the functions of the present invention embodiments may be distributed in any manner among several computer systems (e.g., test data may be processed on one computer, simulation data on a second computer, while correlation metrics may be generated on a third computer).
- the software and/or algorithms described above and illustrated in the flow charts may be modified in any manner that accomplishes the functions described herein.
- the functions in the flow charts or description may be performed in any order that accomplishes a desired operation.
- the computer systems of the present invention embodiments may include any conventional or other communications devices to communicate over the networks via any conventional or other protocols.
- the computer may utilize any type of connection (e.g., wired, wireless, etc.) for access to the network.
- the communication over the communication networks may be implemented by any quantity of any type of communications protocol (e.g., TCP/IP, SONET, MAC, ATM, IP/Ethernet over WDM, etc.) operable within or outside the OSI model.
- the present invention embodiments are not limited to the applications disclosed herein, but may be utilized for any device or system that is to be modeled. Further, the present invention embodiments may be used to generate metrics in real-time and may be implemented using a real-time operating system. Such systems may include earthquake or weather modeling in which test data are environmentally collected in real-time. In one example, weather simulation may be run concurrently with real-time weather data collection. Near real-time correlation metrics may be generated for the simulation. The real-time correlation metrics may be fed back into the simulation such that an adaptive simulation model may be improved. The correlation metrics and score may be watched in real-time, e.g., by updating the spider plots and scores at a predetermined rate.
- the invention makes available a novel method and apparatus for correlating simulation models with physical devices or physical systems based on correlation metrics.
Landscapes
- Engineering & Computer Science (AREA)
- Physics & Mathematics (AREA)
- Theoretical Computer Science (AREA)
- Computer Hardware Design (AREA)
- Evolutionary Computation (AREA)
- Geometry (AREA)
- General Engineering & Computer Science (AREA)
- General Physics & Mathematics (AREA)
- Management, Administration, Business Operations System, And Electronic Commerce (AREA)
- Debugging And Monitoring (AREA)
Applications Claiming Priority (1)
| Application Number | Priority Date | Filing Date | Title |
|---|---|---|---|
| US12/826,745 US8922560B2 (en) | 2010-06-30 | 2010-06-30 | Method and apparatus for correlating simulation models with physical devices based on correlation metrics |
Publications (2)
| Publication Number | Publication Date |
|---|---|
| EP2402876A2 true EP2402876A2 (de) | 2012-01-04 |
| EP2402876A3 EP2402876A3 (de) | 2013-10-09 |
Family
ID=44803436
Family Applications (1)
| Application Number | Title | Priority Date | Filing Date |
|---|---|---|---|
| EP11169770.2A Withdrawn EP2402876A3 (de) | 2010-06-30 | 2011-06-14 | Verfahren und Vorrichtung zum Korrelieren von Simulationsmodellen mit physischen Vorrichtungen auf Grundlage von Korrelationsmetriken |
Country Status (5)
| Country | Link |
|---|---|
| US (1) | US8922560B2 (de) |
| EP (1) | EP2402876A3 (de) |
| JP (1) | JP5561787B2 (de) |
| AU (1) | AU2011202731B2 (de) |
| CA (1) | CA2742368C (de) |
Cited By (3)
| Publication number | Priority date | Publication date | Assignee | Title |
|---|---|---|---|---|
| WO2014070147A1 (en) | 2012-10-30 | 2014-05-08 | Hewlett-Packard Development Company, L.P. | Analyzing data with computer vision |
| WO2016146169A1 (de) * | 2015-03-17 | 2016-09-22 | Siemens Aktiengesellschaft | Ermitteln von verhaltensähnlichen komponenten für ein system |
| CN113219819A (zh) * | 2021-02-09 | 2021-08-06 | 兰州空间技术物理研究所 | 一种基于Matlab/Simulink的静电悬浮加速度计落塔实验仿真系统 |
Families Citing this family (15)
| Publication number | Priority date | Publication date | Assignee | Title |
|---|---|---|---|---|
| EP2759938B1 (de) * | 2011-09-19 | 2019-09-11 | Nec Corporation | Betriebsmanagementvorrichtung, betriebsmanagementverfahren und programm dafür |
| US20130124714A1 (en) * | 2011-11-11 | 2013-05-16 | Vmware, Inc. | Visualization of combined performance metrics |
| US20140095132A1 (en) * | 2012-10-01 | 2014-04-03 | Ford Global Technologies, Llc | System and method for rating computer model relative to empirical results for dynamic systems |
| US20140108072A1 (en) * | 2012-10-17 | 2014-04-17 | Bank Of America | Vendor Contract Assessment Tool |
| US9171000B2 (en) * | 2013-03-15 | 2015-10-27 | Yahoo! Inc. | Method and system for mapping short term ranking optimization objective to long term engagement |
| US9980351B2 (en) * | 2013-08-12 | 2018-05-22 | Abl Ip Holding Llc | Lighting element-centric network of networks |
| KR102379171B1 (ko) * | 2015-02-27 | 2022-03-25 | 삼성전자주식회사 | 전자 장치 및 그의 영상 표시 방법 |
| US10459929B2 (en) | 2017-03-16 | 2019-10-29 | Raytheon Company | Quantifying robustness of a system architecture by analyzing a property graph data model representing the system architecture |
| US10430463B2 (en) | 2017-03-16 | 2019-10-01 | Raytheon Company | Systems and methods for generating a weighted property graph data model representing a system architecture |
| US10430462B2 (en) | 2017-03-16 | 2019-10-01 | Raytheon Company | Systems and methods for generating a property graph data model representing a system architecture |
| US10496704B2 (en) * | 2017-03-16 | 2019-12-03 | Raytheon Company | Quantifying consistency of a system architecture by comparing analyses of property graph data models representing different versions of the system architecture |
| JP6779171B2 (ja) * | 2017-04-27 | 2020-11-04 | 株式会社日立製作所 | 運用支援装置及び運用支援方法 |
| US10073440B1 (en) * | 2018-02-13 | 2018-09-11 | University Of Central Florida Research Foundation, Inc. | Method for the design and manufacture of composites having tunable physical properties |
| DE102020213892A1 (de) * | 2020-11-04 | 2022-05-05 | Robert Bosch Gesellschaft mit beschränkter Haftung | Verfahren zum Validieren von Simulationsmodellen |
| US11762888B2 (en) * | 2020-12-16 | 2023-09-19 | Landmark Graphics Corporation | Geological database management using signatures for hydrocarbon exploration |
Family Cites Families (17)
| Publication number | Priority date | Publication date | Assignee | Title |
|---|---|---|---|---|
| JPH08314526A (ja) | 1995-05-18 | 1996-11-29 | Fujitsu Ltd | 製造管理システム |
| JP2004532646A (ja) * | 2001-06-20 | 2004-10-28 | ラバット・ブルウィング・カンパニイ・リミテッド | 組み合わせ連続/バッチ発酵プロセス |
| US20030061226A1 (en) * | 2001-09-25 | 2003-03-27 | Bowman David M. | Data loader for handling imperfect data and supporting multiple servers and data sources |
| JP3882720B2 (ja) * | 2002-02-19 | 2007-02-21 | 株式会社島津製作所 | におい測定装置 |
| JP2004013295A (ja) | 2002-06-04 | 2004-01-15 | Hitachi Ltd | サプライチェーン評価支援システム、及びサプライチェーン評価支援システムの構築方法 |
| JP4583698B2 (ja) | 2002-08-01 | 2010-11-17 | トヨタ自動車株式会社 | 解析対象物の部品間境界条件の同定装置 |
| US20040122534A1 (en) * | 2002-08-30 | 2004-06-24 | Paulin Matthew A. | Method for facilitating computer-based modeling |
| JP4177671B2 (ja) * | 2003-01-10 | 2008-11-05 | 住友ゴム工業株式会社 | タイヤ情報の提供方法及び提供装置 |
| US7268782B2 (en) * | 2003-10-31 | 2007-09-11 | Sap Aktiengesellschaft | Smart radar chart |
| AR043163A1 (es) * | 2004-02-12 | 2005-07-20 | Univ Buenos Aires | Dispositivo electronico para discriminacion, identificacion y analisis de muestras liquidas, semi-solidas y solidas que contengan compuestos volatiles |
| JP4644533B2 (ja) | 2005-06-15 | 2011-03-02 | 株式会社日立メディコ | 医療運営シミュレーションシステム |
| JP4861687B2 (ja) * | 2005-11-21 | 2012-01-25 | シスメックス株式会社 | 医療用シミュレーションシステム及びそのコンピュータプログラム |
| US20070238094A1 (en) * | 2005-12-09 | 2007-10-11 | Baylor Research Institute | Diagnosis, prognosis and monitoring of disease progression of systemic lupus erythematosus through blood leukocyte microarray analysis |
| US7689624B2 (en) * | 2007-03-01 | 2010-03-30 | Microsoft Corporation | Graph-based search leveraging sentiment analysis of user comments |
| US20090089234A1 (en) * | 2007-09-28 | 2009-04-02 | Rockwell Automation Technologies, Inc. | Automated code generation for simulators |
| US20090099907A1 (en) * | 2007-10-15 | 2009-04-16 | Oculus Technologies Corporation | Performance management |
| US8296114B2 (en) * | 2008-07-14 | 2012-10-23 | Baker Hughes Incorporated | System, program product, and related methods for bit design optimization and selection |
-
2010
- 2010-06-30 US US12/826,745 patent/US8922560B2/en active Active
-
2011
- 2011-06-06 CA CA2742368A patent/CA2742368C/en active Active
- 2011-06-08 AU AU2011202731A patent/AU2011202731B2/en not_active Ceased
- 2011-06-14 EP EP11169770.2A patent/EP2402876A3/de not_active Withdrawn
- 2011-06-29 JP JP2011144919A patent/JP5561787B2/ja not_active Expired - Fee Related
Non-Patent Citations (1)
| Title |
|---|
| None |
Cited By (6)
| Publication number | Priority date | Publication date | Assignee | Title |
|---|---|---|---|---|
| WO2014070147A1 (en) | 2012-10-30 | 2014-05-08 | Hewlett-Packard Development Company, L.P. | Analyzing data with computer vision |
| CN104487961A (zh) * | 2012-10-30 | 2015-04-01 | 惠普发展公司,有限责任合伙企业 | 用计算机视觉来分析数据 |
| EP2915059A4 (de) * | 2012-10-30 | 2016-08-10 | Hewlett Packard Entpr Dev Lp | Analyse von daten mit computeranzeige |
| CN104487961B (zh) * | 2012-10-30 | 2018-05-18 | 企业服务发展公司有限责任合伙企业 | 用计算机视觉来分析数据 |
| WO2016146169A1 (de) * | 2015-03-17 | 2016-09-22 | Siemens Aktiengesellschaft | Ermitteln von verhaltensähnlichen komponenten für ein system |
| CN113219819A (zh) * | 2021-02-09 | 2021-08-06 | 兰州空间技术物理研究所 | 一种基于Matlab/Simulink的静电悬浮加速度计落塔实验仿真系统 |
Also Published As
| Publication number | Publication date |
|---|---|
| EP2402876A3 (de) | 2013-10-09 |
| AU2011202731B2 (en) | 2013-09-19 |
| JP2012014698A (ja) | 2012-01-19 |
| AU2011202731A1 (en) | 2012-01-19 |
| US20120001916A1 (en) | 2012-01-05 |
| JP5561787B2 (ja) | 2014-07-30 |
| CA2742368C (en) | 2015-05-26 |
| US8922560B2 (en) | 2014-12-30 |
| CA2742368A1 (en) | 2011-12-30 |
Similar Documents
| Publication | Publication Date | Title |
|---|---|---|
| US8922560B2 (en) | Method and apparatus for correlating simulation models with physical devices based on correlation metrics | |
| Carlton et al. | Issues and approaches for implementing conditional mean spectra in practice | |
| US20150149128A1 (en) | Systems and methods for analyzing model parameters of electrical power systems using trajectory sensitivities | |
| EP3111190A1 (de) | Anwendung von virtueller überwachung von lasten für wartungsnutzen | |
| EP2863509A1 (de) | System und Verfahren zur Analyse der Oszillationsstabilität in elektrischen Kraftübertragungssystemen | |
| CN106197807B (zh) | 一种用于动态力的测量方法 | |
| US20250278528A1 (en) | Method for Probabilistic Assessment of Seismic Resistance of Long-Span Arch Bridge Based on Time-Frequency Hybrid Computation | |
| US10983492B1 (en) | Adaptive PMU missing data recovery method | |
| CA3016000A1 (en) | Processing data to characterize the thermal behavior of a battery | |
| US20110166799A1 (en) | Trending of vibration data taking into account torque effect | |
| Mucchielli et al. | Higher-order stabilized perturbation for recursive eigen-decomposition estimation | |
| CN115062424A (zh) | 航空发动机转子系统的数字孪生体建模方法及数字孪生体 | |
| CN103186575A (zh) | 一种传感数据的聚类分析方法和系统 | |
| JP5255924B2 (ja) | 電力系統縮約モデル作成装置、電力系統縮約モデル作成方法および電力系統縮約モデル作成プログラム | |
| CN120611639B (zh) | 基于气泡注意力机制的管道内多相流压力特征预测方法 | |
| CN118194127B (zh) | 电力振荡数据处理方法、装置、存储介质及电子设备 | |
| CN115573866A (zh) | 惯性量值处理方法、装置、计算机设备、存储介质和产品 | |
| Pourgholi et al. | Output-Error Methods in Structural Modal Identification | |
| WO2012038219A1 (en) | An analysis method, apparatus and software for a system with frequency dependent materials | |
| CN120336861B (zh) | 基于迁移深度学习的高层结构风荷载谱识别方法、装置 | |
| Torkamani | Hyperchaotic and delayed oscillators for system identification with application to damage assessment | |
| Lampton et al. | Overview of System Identification Tool Advancements at Systems Technology, Incorporated | |
| US11924606B2 (en) | Systems and methods for determining the incident angle of an acoustic wave | |
| Jimenez et al. | Time-dependent reliability analysis of rotor-blade systems with Floquet-moment-EVD interval approximation | |
| CN121765996A (zh) | 基于变分模态分解的航空发动机内场非线性特征预测方法 |
Legal Events
| Date | Code | Title | Description |
|---|---|---|---|
| AK | Designated contracting states |
Kind code of ref document: A2 Designated state(s): AL AT BE BG CH CY CZ DE DK EE ES FI FR GB GR HR HU IE IS IT LI LT LU LV MC MK MT NL NO PL PT RO RS SE SI SK SM TR |
|
| AX | Request for extension of the european patent |
Extension state: BA ME |
|
| PUAI | Public reference made under article 153(3) epc to a published international application that has entered the european phase |
Free format text: ORIGINAL CODE: 0009012 |
|
| RAP1 | Party data changed (applicant data changed or rights of an application transferred) |
Owner name: EXELIS INC. |
|
| PUAL | Search report despatched |
Free format text: ORIGINAL CODE: 0009013 |
|
| RIC1 | Information provided on ipc code assigned before grant |
Ipc: G06F 17/50 20060101AFI20130828BHEP |
|
| AK | Designated contracting states |
Kind code of ref document: A3 Designated state(s): AL AT BE BG CH CY CZ DE DK EE ES FI FR GB GR HR HU IE IS IT LI LT LU LV MC MK MT NL NO PL PT RO RS SE SI SK SM TR |
|
| AX | Request for extension of the european patent |
Extension state: BA ME |
|
| 17P | Request for examination filed |
Effective date: 20140408 |
|
| RBV | Designated contracting states (corrected) |
Designated state(s): AL AT BE BG CH CY CZ DE DK EE ES FI FR GB GR HR HU IE IS IT LI LT LU LV MC MK MT NL NO PL PT RO RS SE SI SK SM TR |
|
| RAP1 | Party data changed (applicant data changed or rights of an application transferred) |
Owner name: EXELIS INC. |
|
| RAP1 | Party data changed (applicant data changed or rights of an application transferred) |
Owner name: EAGLE TECHNOLOGY, LLC |
|
| STAA | Information on the status of an ep patent application or granted ep patent |
Free format text: STATUS: REQUEST FOR EXAMINATION WAS MADE |
|
| RAP1 | Party data changed (applicant data changed or rights of an application transferred) |
Owner name: PERATON, INC. |
|
| STAA | Information on the status of an ep patent application or granted ep patent |
Free format text: STATUS: THE APPLICATION IS DEEMED TO BE WITHDRAWN |
|
| 18D | Application deemed to be withdrawn |
Effective date: 20180103 |