EP2302368B1 - Method and apparatus for detecting microparticles in fluid samples - Google Patents
Method and apparatus for detecting microparticles in fluid samples Download PDFInfo
- Publication number
- EP2302368B1 EP2302368B1 EP10011461.0A EP10011461A EP2302368B1 EP 2302368 B1 EP2302368 B1 EP 2302368B1 EP 10011461 A EP10011461 A EP 10011461A EP 2302368 B1 EP2302368 B1 EP 2302368B1
- Authority
- EP
- European Patent Office
- Prior art keywords
- microparticles
- fluorescent substance
- capillary tube
- fluorescent
- sample
- Prior art date
- Legal status (The legal status is an assumption and is not a legal conclusion. Google has not performed a legal analysis and makes no representation as to the accuracy of the status listed.)
- Expired - Lifetime
Links
Images


Classifications
-
- G—PHYSICS
- G01—MEASURING; TESTING
- G01N—INVESTIGATING OR ANALYSING MATERIALS BY DETERMINING THEIR CHEMICAL OR PHYSICAL PROPERTIES
- G01N15/00—Investigating characteristics of particles; Investigating permeability, pore-volume or surface-area of porous materials
- G01N15/10—Investigating individual particles
- G01N15/14—Optical investigation techniques, e.g. flow cytometry
- G01N15/1484—Optical investigation techniques, e.g. flow cytometry microstructural devices
-
- G—PHYSICS
- G01—MEASURING; TESTING
- G01N—INVESTIGATING OR ANALYSING MATERIALS BY DETERMINING THEIR CHEMICAL OR PHYSICAL PROPERTIES
- G01N15/00—Investigating characteristics of particles; Investigating permeability, pore-volume or surface-area of porous materials
- G01N15/10—Investigating individual particles
- G01N15/14—Optical investigation techniques, e.g. flow cytometry
- G01N15/1456—Optical investigation techniques, e.g. flow cytometry without spatial resolution of the texture or inner structure of the particle, e.g. processing of pulse signals
-
- G—PHYSICS
- G01—MEASURING; TESTING
- G01N—INVESTIGATING OR ANALYSING MATERIALS BY DETERMINING THEIR CHEMICAL OR PHYSICAL PROPERTIES
- G01N21/00—Investigating or analysing materials by the use of optical means, i.e. using sub-millimetre waves, infrared, visible or ultraviolet light
- G01N21/01—Arrangements or apparatus for facilitating the optical investigation
- G01N21/03—Cuvette constructions
- G01N2021/0346—Capillary cells; Microcells
-
- G—PHYSICS
- G01—MEASURING; TESTING
- G01N—INVESTIGATING OR ANALYSING MATERIALS BY DETERMINING THEIR CHEMICAL OR PHYSICAL PROPERTIES
- G01N21/00—Investigating or analysing materials by the use of optical means, i.e. using sub-millimetre waves, infrared, visible or ultraviolet light
- G01N21/62—Systems in which the material investigated is excited whereby it emits light or causes a change in wavelength of the incident light
- G01N21/63—Systems in which the material investigated is excited whereby it emits light or causes a change in wavelength of the incident light optically excited
- G01N21/64—Fluorescence; Phosphorescence
Definitions
- the present invention relates to a method and apparatus for detecting microparticles in fluid samples. More particularly, the present invention relates to a method and apparatus which uses a fluid delivery system and laser fluorescence detection system to detect fluorescently tagged microparticles in low concentrations in fluid samples.
- Detection of microorganisms present at low concentration in fluids is critical to provide microbiological contamination answers faster to better treat patient diseases, to prevent deadly outbreaks, to better manage quality control processes in food, drink, and drug manufacturing plants, and to provide scientists with powerful and easy to use analytical research tools.
- Testing methods for microorganisms such as M. tuberculosis, Trichomonas vaginalis, Campylobacter, Salmonella, E. coli, and Cyclospora include growth culture methods, PCR methods, fluorescently enhanced microscopic visualizations, ATP bioluminescence techniques, and bactometers. These methods are often slow and expensive, and have limited detection capabilities.
- Testing devices include epifluorescent microscopes, fluorometers, and flow cytometers.
- Epifluorescent microscopes are coupled with cooled CCD high-resolution cameras to permit epifluorescent microscopic visualizations of microscopic particles.
- Fluorometers have limited detection capabilities, and is also not well suited when spectral differentiation in a large population of organisms is required. This is often the case when live versus dead organism differentiation is required.
- Flow cytometers can be very accurate in detecting and differentiating immuno-fluorescentlv dead or live labeled particles. However, flow cytometers are expensive and require an experienced technician or scientist to operate it and interpret the data.
- Cryptosporidium oocysts and Giardia cysts may be detected using an immunofluorescent assay (IFA) procedure.
- IFA immunofluorescent assay
- This method uses polyclonal antibodies to stain the cysts which then can be detected by epifluorescent microscopy. This method is extremely labor-intensive, considering the number of particles to be investigated under the epifluorescent microscope by an experienced technician.
- Flow cytometeters may also be used, but they are very expensive and require an experienced and well-trained technician to operate. Furthermore, flow cytometers still require microscopy confirmation of oocyst identification.
- Water quality monitoring is vital for managing supplies of unpolluted water for agriculture, industry, and human consumption. Water quality monitoring may be performed using test organisms as indicators of freshwater toxicity, for example, the fathead minnow Pimephales promelas, the cladoceran Ceriodaphnia dubia, and the green alga Selenastrum capricornutum. Test organisms are cultured under standard conditions, and exposed for a period of time to toxicants. Comparison of survival and reproduction rates of test organisms to control organisms provides an indication of water toxicity.
- Bacteria enzyme activity may be used to assess water quality by using a specially designed enzyme substrate that becomes fluorescent when cleaved. This substrate is cleaved by enzymes in the bacteria and emits fluorescence light when exposed to light of the proper wavelength. The rate of enzyme activity can be measured using a fluorometer, and provides an indirect measurement of the level of toxicant stress on the bacteria.
- Zooplankton feeding behavior may also be used to assess water quality.
- Extensive acute toxicity studies have been performed using plankton, in general, and various species of rotifer, in particular.
- Rotifer feeding and reproduction rates can be used as a rapid toxicity assessment tool.
- the effect of a wide range of chemicals including xylene, cadmium, copper, mercury, and diazanon on the feeding and reproduction rates of the rotifer Brachionus calyciflorus for fresh water and Brachionus plicatilis for marine waters has been extensively studied.
- the rotifers are exposed for several minutes to water containing a toxicant, and then allowed to feed on fluorescently labeled beads.
- the rotifers are then anesthetized, washed, transferred to a microscope slide, and individually examined using a fluorescent microscope.
- the feeding rate is estimated by quantifying the intensity of fluorescence of ingested beads in the digestive tract of individual rotifers using an imaging technique. This method requires a trained operator, a camera, and a fluorescent microscope, which makes it slow and expensive.
- the present invention is a device for detecting a fluorescent substance tagged to a microparticle, as defined in claim 1, and a corresponding method, as defined in claim 7
- the device comprises a single capillary flow carrier system for transporting the microparticle past a selected location, a source of electromagnetic radiation for irradiating the substance tagged to the microparticle, and a detection system for measuring fluorescent light emitted from the substance at the selected location.
- FIGURE 1 shows a sample preparation system 100.
- Sample preparation system 100 contains a fluid sample 102 suspected of containing microparticles 104. Fluid sample 102 may be run through a filter or trap to separate out any unwanted or macroscopic particulate matter.
- a fluorescent substance 106 is allowed to react with fluid sample 102 and microparticles 104. Fluorescent substance 106 may be one or more fluorescent stains, dyes, or reagents designed to stain, tag, or otherwise attach themselves to microparticles 104.
- a test sample 108 is obtained by filtering out any free remaining fluorescent substance 106 from fluid sample 102. Test sample 108 thus contains fluid sample 102 and fluorescent substance 106 attached to microparticles 104.
- Fluid sample 102 may be a water sample, urine sample, blood sample, food product sample, or any other fluid to be tested. Fluid sample 102 may contain PCR-amplified samples for detection of viruses such as HIV.
- Microparticles 104 may be M. tuberculosis, Trichomonas vaginalis, Campylobacter, Salmonella, E. coli, Cyclospora, Cryptosporidium oocysts, Giardia cysts, or any other bacterium, virus, fungus, or microorganism that is capable of being tagged. Microparticles 104 may also be CD4 or CD8 cells for monitoring of AIDS patients.
- fluorescent substance 106 may be used with microparticles 104 to allow different types of microorganisms to be detected and distinguished from each other.
- fluorescent substance 106 can be standard DNA or surface-label-reagent stains.
- fluorescent substance 106 can be a fluorescent dye conjugated with anti -Cryptosporidium or anti -Giardia antibodies, respectively.
- Fluorescent substance 106 may also be magnetically charged so that it can be affected by a magnetic field.
- Microparticles 104 may also be microscopic beads containing a fluorescent substance 106.
- filtro-feeder microorganisms such as rotifers or zooplankton may be added to fluid sample 102 in known quantities. Such filtro-feeder microorganisms have a feeding rate which is a well-known function of toxicant concentration.
- microparticles 104 are added to fluid sample 102.
- Microparticles 104 may be fluospheres capable of being ingested by the filtro-feeder organisms, such as latex beads containing a fluorescent dye available from Molecular Probes, Inc., Eugene, Oregon.
- the fluospheres may have a uniform diameter of 2 ⁇ m or have non-uniform sizes. They may have uniform spectro-photometric properties, with a maximum absorption wavelength of 624 nm, and a maximum emission wavelength of 645 nm, or have varying spectro-photometric properties.
- a test sample 108 is drawn from sample preparation system 100. Test sample 108 is obtained by filtering out any uningested microparticles 104 from fluid sample 102. Test sample 108 thus contains water sample 102 and organisms 104 with microparticles 104 in their digestive tracts.
- FIGURE 2A shows a flow carrier system 200.
- Flow carrier system 200 is a fluid delivery system which introduces test sample 108 into a capillary tube 202.
- Capillary tube 202 may have very thin walls and excellent optical properties.
- Capillary tube 202 may have an internal diameter configured to admit microparticles 104 one at a time.
- a section of capillary tube 202 defines a test volume 204.
- Capillary tube 202 may be at least partially coupled to an optical table 206, which serves to hold capillary tube 202 in place.
- Multiple capillary tubes 202 may be arranged in parallel to obtain higher throughputs.
- Flow carrier system 200 includes a pump system 216 coupled to capillary tube 202.
- Pump system 216 may be a syringe 208 which contains test sample 108, and injects test sample 108 through capillary tube 202 and test volume 204. After passing through capillary tube 202. sample 108 may pass into a dump 212. In this manner, microparticles 104 in test sample 102 may be passed one at a time through capillary tube 202.
- Pump system 216 may further include a syringe pump 214 coupled to syringe 208. Syringe pump 214 is configured for precise control of flow of test sample 108 through capillary tube 202. Pump system 216 may also be a peristaltic pump.
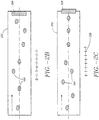
- FIGURES 2B and 2C show detailed views of two embodiments of capillary tube 202.
- FIGURE 2B shows microparticles 104 flowing through capillary tube 202 towards test volume 204.
- FIGURE 2C shows capillary tube 202 with a magnetic element 220 positioned in a concentric fashion around capillary tube 202.
- Magnetic element 220 may be a continuous ring, or be comprised of one or more separate elements.
- Magnetic element 220 is used in conjunction with microparticles 104 and fluorescent substance 106 which are magnetically charged. This configuration may assist in substantially focusing microparticles 104 tagged with fluorescent substance 106 to the center of capillary tube 202 as they flow through test volume 204, thus improving detection of microparticles 104.
- FIGURE 3A shows a laser fluorescent measurement setup 300.
- a laser 302 generates a laser beam 304.
- Laser beam 304 may be focused through one or more lenses 306 onto test volume 204.
- the wavelength and beam size of laser 302 is selected according to the absorption wavelength of fluorescent substance 106 and the size of capillary tube 202.
- any fluorescent substance 106 present in test sample 108 is exposed to laser beam 302.
- a standing test sample 108 in capillary tube 202 may be moved relative to laser beam 302 to expose test sample 108.
- a collecting lens 310 collects and images fluorescence light emitted by fluorescent substance 106 onto a photo-multiplier 312.
- a set of interference filters 314 may be placed in front of photo-multiplier 312 to filter out the resonant light from the fluorescence light.
- a photodiode 316 may be placed on the opposite side of test chamber 308 to collect the resonant light. Output from photo-multiplier 312 may be sent to a first digital processing unit 318 to analyze fluorescence peaks. Output from photodiode 316 may be sent to a second digital processing unit 320 to analyze Mie scattering peaks.
- FIGURE 3B shows another laser fluorescent measurement setup 300.
- the fluorescence emissions pass through a diffraction grating 313 and are imaged onto a multiple detector array 315.
- the focal length and aperture of collecting lens 310, the dispersion characteristics of grating 313, and the size and separation of the multiple detectors in array 315 are optimized to detect at least two or three fluorescent emission bands specific to the emission spectrum of fluorescent substance 106 as well as resonant light.
- a set of interference filters 317 may be used to single out the fluorescence emission of fluorescent substance 106 used to tag microparticles 104. By reading the fluorescence emission at multiple spectral locations using multiple interferential filters 317 with specific transmission characteristics, the particular fluorescent substance 106 used can be detected and distinguished.
- Output from multiple detector array 315 may be fed to a digital processing unit 318, which processes and digitizes the multiple signals delivered by multiple detector array 315.
- FIGURE 3C shows yet another laser fluorescent measurement setup 300
- a plurality of lasers 302 generates a plurality of laser beams 304.
- Laser beams 304 may be focused through one or more lenses 306 onto test volume 204.
- the size of laser beam 304 may be matched to the size of capillary tube 202.
- the wavelengths of lasers 302 are tuned to specific absorption bands of fluorescent substance 106. This multiple laser and detection system may assist in reducing false positive and negative results associated with a single laser system.
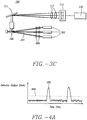
- FIGURE 4A shows a sample output from digital processing unit 318.
- the voltage signal coming out of photo-multiplier 312 is digitized and transferred to a computer where it can be manipulated and analyzed.
- the voltage signal may be digitized at a frequency of up to 3000 Hz with 8-bit precision.
- a threshold value 404 may be selected according to the baseline signal level and its variance. The number of fluorescence peaks 402 detected above threshold value 404, along with the size of voltage spikes, give a measurement of the amount of fluorescent substance 106. In the case of toxicant concentration, comparing this data with the data for an uncontaminated control sample permits determination of the toxicant concentration in water sample 102.
- FIGURE 4B shows another sample output from digital processing unit 318.
- an microparticle 104 which has been tagged by fluorescent substance 106 passes through test volume 204, the it generates a burst of fluorescence light with a time signature 406 and spectral signature 408
- the time signature 406 and spectral signature 408 is then processed by the digital signal processing unit 318 and compared with the expected time and spectral signatures of microparticle 104 and fluorescent substance 106 to be detected.
- the use of multiple signals provides normalization and improved selectivity. Measurements at more than one fluorescence emission wavelength and/or at more than one excitation wavelength give spectral selectivity which can distinguish different dye sources. Because the dyes used for immunofluorescence commonly have relatively narrow emission peaks compared to background fluorescence sources, ratios of on-peak to off-peak signals may reliably distinguish dye-labeled particles from background events of similar absolute fluorescence.
- FIGURE 5A shows emission spectra of various fluorescent cyanide dyes which may be used to tag microparticles 104: Cy5, Cy5.5, and Cy7, with maximum absorption peaks of 650 nm, 675 nm, and 743 nm, respectively.
- Multiple detector array 318 may be used to first record the fluorescent spectrum of the particular dye. The fluorescent spectra emitted by the tagged microparticles 104 in the sample is then compared to the recorded fluorescent spectrum of the dye. In this fashion, tagged microparticles 104 can be identified and distinguished from other fluorescently tagged microparticles 104.
- the width of the trace signal can be considered proportional to the diameter of microparticle 104 crossing test volume 204.
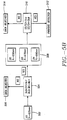
- FIGURE 5B shows a flowchart of a signal processing strategy to detect a Cy5 tagged microparticle 104 in the presence of other fluorescently labeled microparticles.
- Detector D1 is centered on the resonant laser excitation, in this case 635 nm.
- Detectors D2, D3. and D4 are centered at 650 nm. 670 nm, and 690 nm, corresponding to features of the Cy5 fluorescence emission.
- the time trace of the signal detected by detector D 1 is analyzed (block 502) and the signal intensity S1 and the pulse width W1 are compared with the expected time trace (Sc, Wc) generated by the passage of the particular microparticle in the test volume (block 504). If the detected signal does not meet this criteria, then the data is rejected (block 506). If the detected signal passes this first test, then the fluorescence intensity ratio of the detectors D2, D3, and D4 are analyzed (block 508). The fluorescent ratio of S2/S3 and S2/S4 are compared with the expected fluorescence ratios corresponding to the Cy5 fluorescence spectra Sca and Scb, respectively (block 510). If these two tests are positive, a microparticle is counted (block 512); if the tests are negative the data is rejected (block 514).
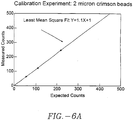
- Flow carrier system 100 was calibrated using water samples with known fluosphere concentrations. A reference solution of 3 x 10 9 beads/ml was diluted 1000 times. Then water samples containing 0, 3, 500, 7000, 14000 and 28000 beads/ml were prepared with a 10% confidence interval using a 20 ⁇ l micropipet. These water samples were passed through the device.
- FIGURE 6A shows detected fluorescence peak counts versus expected counts for the calibration samples. An excellent correlation was consistently obtained.
- a reference sample of 10 7 E. coli SYTOTM 60 DNA-stained was prepared by first killing the bacteria using a 70% isopropanol exposure for one hour and then following with three sterile washes. The E. coli bacteria population was then stained with a 5 ⁇ mol concentration SYTOTM 60 dye.
- E. coli per ml stained Five graded concentration samples from 10 7 to 0 E. coli per ml stained were prepared using a 20 ⁇ l micropipette and 2 ⁇ m filtered de-ionized water. A 100 ⁇ l solution of each sample was drawn using a 1 ml syringe. The syringe was placed onto a syringe pump, and a 10 ⁇ l/min flow rate of the solution was injected into a 70 ⁇ m single capillary towards the test volume.
- the fluorescent test volume was defined by a 20 ⁇ m focused laser beam using a 635 nm, 5 mW laser diode and a single 10 mm focal lens.
- the test volume was imaged onto a 3 mm x 3 mm slit using a 40x objective microscope.
- the photodetector signal was digitized at 3000 Hz and 8 byte dynamic range.
- the digitized signal was transmitted through a single serial cable onto a laptop computer.
- the signal was displayed on-line on a window screen using proprietary software.
- a time series corresponding to an injection of each sample at 10 ⁇ l/min flow rate during 30 sec was recorded.
- a triplicate experiment was performed for each sample, which corresponds to a 90 sec injection. By controlling the flow rate, the injection time, and the expected concentration, an expected fluorescent peak count was calculated and compared with the actual measured count. For each sample, the average peak residence time, peak intensity, and peak power (peak integral) were also computed.
- the arrival process of the particle across the test volume was assumed to follow a random arrival process and therefore follow a Poisson process.
- the expected count number was corrected accordingly, to take into account the probability of having more than one particle arriving into the test volume during a time window equivalent to the particle transit time across the laser beam, taking into account the fact that a single detected count could be attributed to more than one particle.
- FIGURE 6B represents the particle arrival rate distribution at the test volume for the organism concentration investigated. For concentrations greater than 10 5 p/ml at a 10 ⁇ l/min flow rate, a Poisson statistical correction is necessary. In particular, at a concentration of 10 7 E. coli per ml, there is more than one E. coli crossing the test volume 80% of the time.
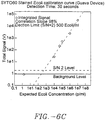
- FIGURE 6C represents a correlation between the expected concentration and the integrated detected fluorescence signal corresponding to the passage of individual stained E . coli through the laser test volume.
- the integrated signal was computed as the product of the number of detected peaks corrected by Poisson statistics, and the average peak power (V/ms). The correlation is excellent, with a 98% slope.
- an integrated background noise of 4 peaks every 30 seconds was detected. These background peaks where attributed to bubbles deflecting the beam reflection into the photo-detector slit or to naturally fluorescent particles.
- the use of multiple wavelength detection arrays and a light scattering detector may eliminate these false positive counts.
- Water quality monitoring using rotifers was performed using a capillary tube with an internal diameter of 70 ⁇ m, a narrow band, 635 nm, 3 mW diode laser with a beam diameter of 40 ⁇ m was used. Interference filters were selected to transmit 12% at 670 nm (20 nm FWM), and 10 -6 at all other wavelengths.
- T d mean + 2 variance
- the number of peaks with an intensity above T d were calculated for each file, as well as the average peak intensity, the average peak width, and the average peak area.
- V Cl ⁇ ⁇ ⁇ ⁇ d 2 4
- V contains organisms with an average motility ⁇ .
- the concentration of food particles or beads is C b (t).
- K ⁇ ⁇ d 2 4 ⁇ ⁇ ⁇ N 0 V
- 1/K is a time constant which reflects the rate at which the bead concentration decreases.
- FIGURE 7A shows normalized bead concentrations versus feeding time according to the model given in Eq. 8 for three different organism concentrations: 100 rotifers/ml, 250 rotifers/ml, and 1000 rotifers/ml.
- the analytical value used to model the feeding rate (FR) in this case is 2.7 beads/min.
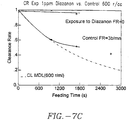
- FIGURE 7B shows normalized fluosphere concentrations versus feeding time for a test sample containing 1 ppm of diazanon and a control sample. To compare the experimental results to the model, a concentration of 500 rotifers/ml was used.
- the correlation between model and experiment is excellent for the first 600 seconds.
- the average feeding rate is 29 x 10 -3 beads/sec.
- the departure of experiment from the model after 900 seconds can be attributed to two factors.
- the model assumes that the variation of C b remains small compared to C b and therefore the feeding rate is a constant. In fact, the feeding rate depends on the food concentration, which after 900 seconds has dropped by 50%. This variation cannot be neglected.
- the rotifers have an average digestion transit time of 1200 seconds. Since the fluospheres are not metabolized by the rotifers, they are ejected back into the sample by the rotifer after 1000 seconds, which may contribute to an increase in bead concentration.
- the concentration of fluospheres decreases slightly with a slope corresponding to an ingestion rate per organism of 10 -3 beads/sec.
- the feeding rate was reduced by a factor of 30 from exposure to I ppm of diazanon.
- FIGURE 7C shows normalized fluosphere concentrations versus feeding time for a test sample containing I ppm of diazanon and a control sample.
- concentration of organisms is now 600 rotifers/ml.
- the agreement between model and experiment is excellent for the first 600 seconds.
- the feeding rate is now 3 beads/min per organism, compared well to the 1.7 beads/min per organism value obtained earlier.
- the concentration of beads remains almost unchanged with time and indicates a feeding rate of less than 0.05 beads/min. This measurement is consistent with previous experiments.
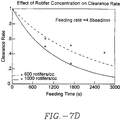
- FIGURE 7D shows normalized fluosphere concentrations versus feeding time for a 600 rotifers/ml sample and an 1000 rotifers/ml sample. The two samples are exposed to concentrated 2 ⁇ m fluospheres for 1700 seconds. The fluosphere concentrations are monitored continuously and the normalized concentrations are reported and compared to the clearance rate model described earlier. The agreement between model and experiment is optimum for an average feeding rate per organism equal to 4.8 beads/min.
- . M FR ⁇ ⁇ ⁇ V fluo
- FR, ⁇ , and V fluo are the average feeding rate per individual rotifer, the fluosphere density, and the individual fluosphere volume, respectively.
- M-dot 21 x 10 -12 g/min per organism.
Landscapes
- Chemical & Material Sciences (AREA)
- General Physics & Mathematics (AREA)
- Dispersion Chemistry (AREA)
- Health & Medical Sciences (AREA)
- Life Sciences & Earth Sciences (AREA)
- Analytical Chemistry (AREA)
- Biochemistry (AREA)
- Physics & Mathematics (AREA)
- Immunology (AREA)
- General Health & Medical Sciences (AREA)
- Pathology (AREA)
- Investigating, Analyzing Materials By Fluorescence Or Luminescence (AREA)
- Investigating Or Analysing Biological Materials (AREA)
- Apparatus Associated With Microorganisms And Enzymes (AREA)
- Measuring Or Testing Involving Enzymes Or Micro-Organisms (AREA)
- Farming Of Fish And Shellfish (AREA)
Applications Claiming Priority (2)
| Application Number | Priority Date | Filing Date | Title |
|---|---|---|---|
| US4901297P | 1997-06-09 | 1997-06-09 | |
| EP98926490.8A EP0988523B1 (en) | 1997-06-09 | 1998-06-09 | Method and apparatus for detecting microparticles in fluid samples |
Related Parent Applications (2)
| Application Number | Title | Priority Date | Filing Date |
|---|---|---|---|
| EP98926490.8 Division | 1998-06-09 | ||
| EP98926490.8A Division EP0988523B1 (en) | 1997-06-09 | 1998-06-09 | Method and apparatus for detecting microparticles in fluid samples |
Publications (2)
| Publication Number | Publication Date |
|---|---|
| EP2302368A1 EP2302368A1 (en) | 2011-03-30 |
| EP2302368B1 true EP2302368B1 (en) | 2017-04-05 |
Family
ID=21957617
Family Applications (2)
| Application Number | Title | Priority Date | Filing Date |
|---|---|---|---|
| EP10011461.0A Expired - Lifetime EP2302368B1 (en) | 1997-06-09 | 1998-06-09 | Method and apparatus for detecting microparticles in fluid samples |
| EP98926490.8A Expired - Lifetime EP0988523B1 (en) | 1997-06-09 | 1998-06-09 | Method and apparatus for detecting microparticles in fluid samples |
Family Applications After (1)
| Application Number | Title | Priority Date | Filing Date |
|---|---|---|---|
| EP98926490.8A Expired - Lifetime EP0988523B1 (en) | 1997-06-09 | 1998-06-09 | Method and apparatus for detecting microparticles in fluid samples |
Country Status (6)
| Country | Link |
|---|---|
| EP (2) | EP2302368B1 (enExample) |
| JP (2) | JP4754661B2 (enExample) |
| AU (1) | AU7831798A (enExample) |
| CA (1) | CA2293426C (enExample) |
| ES (1) | ES2626646T3 (enExample) |
| WO (1) | WO1998057152A1 (enExample) |
Families Citing this family (26)
| Publication number | Priority date | Publication date | Assignee | Title |
|---|---|---|---|---|
| JP4323571B2 (ja) | 1997-01-31 | 2009-09-02 | エックスワイ, インコーポレイテッド | 光学装置 |
| US6149867A (en) | 1997-12-31 | 2000-11-21 | Xy, Inc. | Sheath fluids and collection systems for sex-specific cytometer sorting of sperm |
| US6071689A (en) | 1997-12-31 | 2000-06-06 | Xy, Inc. | System for improving yield of sexed embryos in mammals |
| US7208265B1 (en) | 1999-11-24 | 2007-04-24 | Xy, Inc. | Method of cryopreserving selected sperm cells |
| US20020028434A1 (en) * | 2000-09-06 | 2002-03-07 | Guava Technologies, Inc. | Particle or cell analyzer and method |
| JP4685229B2 (ja) * | 2000-10-31 | 2011-05-18 | オリンパス株式会社 | レーザ顕微鏡 |
| WO2002043574A2 (en) | 2000-11-29 | 2002-06-06 | Xy, Inc. | System to separate frozen-thawed spermatozoa into x-chromosome bearing and y-chromosome bearing populations |
| US7713687B2 (en) | 2000-11-29 | 2010-05-11 | Xy, Inc. | System to separate frozen-thawed spermatozoa into x-chromosome bearing and y-chromosome bearing populations |
| DE60126775T2 (de) * | 2001-10-10 | 2007-10-31 | Borealis Technology Oy | Teilchendatenanalyse |
| US8211629B2 (en) | 2002-08-01 | 2012-07-03 | Xy, Llc | Low pressure sperm cell separation system |
| US8486618B2 (en) | 2002-08-01 | 2013-07-16 | Xy, Llc | Heterogeneous inseminate system |
| CA2534394C (en) | 2002-08-15 | 2013-01-08 | Xy, Inc. | High resolution flow cytometer |
| US7169548B2 (en) | 2002-09-13 | 2007-01-30 | Xy, Inc. | Sperm cell processing and preservation systems |
| DK2308419T3 (da) | 2003-03-28 | 2016-06-06 | Inguran Llc | Fremgangsmåde til bedømmelse af farvningstilstandene for dyresperm, som skal sorteres. |
| EP1625203B1 (en) | 2003-05-15 | 2015-04-08 | Xy, Llc | Efficient haploid cell sorting for flow cytometer systems |
| WO2005095590A2 (en) | 2004-03-29 | 2005-10-13 | Monsanto Technology Llc | Sperm suspensions for sorting into x or y chromosome-bearing enriched populations |
| AR049732A1 (es) | 2004-07-22 | 2006-08-30 | Monsanto Co | Proceso para enriquecer una poblacion de celulas de esperma |
| EP2085762B1 (en) * | 2008-01-30 | 2018-07-04 | Palo Alto Research Center Incorporated | Transmitting/reflecting emanating light with time variation |
| CN101672841B (zh) * | 2008-09-09 | 2013-05-08 | 北京万德高科技发展有限公司 | 用于生物样品的检测仪器和检测方法 |
| WO2012061155A2 (en) * | 2010-10-25 | 2012-05-10 | Accuri Cytometers, Inc. | Systems and user interface for collecting a data set in a flow cytometer |
| EP2594334A1 (en) | 2011-11-21 | 2013-05-22 | Drive O2 | Sample vial for digital holographic analysis of a liquid cell sample |
| KR20160103175A (ko) | 2011-07-19 | 2016-08-31 | 오비지오 이미징 시스템스 엔.브이. | 세포 샘플에서의 암 세포들의 검출 및/또는 분류를 위한 방법 및 시스템 |
| EP2626686A1 (en) | 2012-02-13 | 2013-08-14 | Ovizio Imaging Systems NV/SA | Flow cytometer with digital holographic microscope |
| US9904248B2 (en) | 2012-09-20 | 2018-02-27 | Ovizio Imaging Systems NV/SA | Digital holographic microscope with fluid systems |
| EP3196631A1 (en) | 2016-01-19 | 2017-07-26 | Ovizio Imaging Systems NV/SA | Digital holographic microscope with electro-fluidic system, said electro-fluidic system and methods of use |
| CN109270032B (zh) * | 2018-08-20 | 2021-08-20 | 杭州腾海科技有限公司 | 一种水体藻类在线监测装置 |
Citations (2)
| Publication number | Priority date | Publication date | Assignee | Title |
|---|---|---|---|---|
| DE3718407A1 (de) * | 1987-06-02 | 1988-12-22 | Hund Helmut Gmbh | Anordnung fuer die optische analyse von partikelpopulationen in gasen und fluessigkeiten |
| EP0745682A1 (de) * | 1995-06-02 | 1996-12-04 | Bayer Ag | Sortiervorrichtung für biologische Zellen oder Viren |
Family Cites Families (24)
| Publication number | Priority date | Publication date | Assignee | Title |
|---|---|---|---|---|
| DE2732272C2 (de) | 1977-07-16 | 1979-07-05 | Deutsches Krebsforschungszentrum Stiftung Des Oeffentlichen Rechts, 6900 Heidelberg | Verfahren und Vorrichtung zur Fluoreszenzanalyse von gefärbten Partikeln, insbesondere biologischen Zellen |
| US4172227A (en) | 1978-07-21 | 1979-10-23 | Becton, Dickinson And Company | Flow microfluorometer |
| DE3266669D1 (en) * | 1981-06-24 | 1985-11-07 | Becton Dickinson Co | Analyzer for simultaneously determining volume and light emission characteristics of particles |
| DE3574617D1 (de) * | 1984-09-11 | 1990-01-11 | Partec Ag | Verfahren und vorrichtung zur sortierung von mikroskopischen partikeln. |
| FI844027A7 (fi) * | 1984-10-12 | 1986-04-13 | Labsystems Oy | Immunologiskt bestaemningsfoerfarande. |
| US4756884A (en) * | 1985-08-05 | 1988-07-12 | Biotrack, Inc. | Capillary flow device |
| US4668868A (en) | 1986-02-20 | 1987-05-26 | Noller Hans T | Apparatus for performing fluoroimmunoassays of biological specimens |
| JPS63231244A (ja) * | 1987-03-20 | 1988-09-27 | Hitachi Ltd | 細胞分析装置 |
| DE3715114A1 (de) | 1987-05-06 | 1988-11-17 | Krause Hans | Verfahren und einrichtung zum toxizitaetsnachweis in oberflaechengewaessern sowie in trink- und brauchwasser |
| US4838688A (en) * | 1987-10-16 | 1989-06-13 | Robert Rhoads | High sensitivity chromatography detector |
| JPH02145941A (ja) * | 1988-11-28 | 1990-06-05 | Hitachi Ltd | 細胞分析装置 |
| US4979824A (en) * | 1989-05-26 | 1990-12-25 | Board Of Trustees Of The Leland Stanford Junior University | High sensitivity fluorescent single particle and single molecule detection apparatus and method |
| DK111990D0 (da) | 1990-05-04 | 1990-05-04 | Biometic Aps | Apparat og fremgangsmaade til analyse af en vaeskesuspension |
| JPH04102062A (ja) * | 1990-08-22 | 1992-04-03 | Hitachi Ltd | 粒子免疫側定法 |
| JP3102938B2 (ja) * | 1991-12-30 | 2000-10-23 | シスメックス株式会社 | 粒子画像分析装置 |
| JP2756397B2 (ja) * | 1992-02-20 | 1998-05-25 | キヤノン株式会社 | 粒子操作方法及び装置、並びにこれを用いた測定装置 |
| JP3076144B2 (ja) * | 1992-05-01 | 2000-08-14 | キヤノン株式会社 | 生体微量成分検査装置 |
| US5430541A (en) * | 1993-01-12 | 1995-07-04 | Applied Biosystems Inc. | High efficiency fluorescence flow cell for capillary liquid chromatography or capillary electrophoresis |
| US5585246A (en) | 1993-02-17 | 1996-12-17 | Biometric Imaging, Inc. | Method for preparing a sample in a scan capillary for immunofluorescent interrogation |
| NO932088L (no) * | 1993-06-08 | 1995-01-05 | Oddbjoern Gjelsnes | Anordning for anvendelse ved væskeströmscytometri |
| JPH07286953A (ja) * | 1994-04-19 | 1995-10-31 | Toa Medical Electronics Co Ltd | イメージングフローサイトメータ |
| JPH08163996A (ja) * | 1994-12-13 | 1996-06-25 | Sumitomo Bakelite Co Ltd | 動物細胞毒性試験方法 |
| FI98765C (fi) * | 1995-01-16 | 1997-08-11 | Erkki Soini | Virtaussytometrinen menetelmä ja laite |
| US5726751A (en) * | 1995-09-27 | 1998-03-10 | University Of Washington | Silicon microchannel optical flow cytometer |
-
1998
- 1998-06-09 AU AU78317/98A patent/AU7831798A/en not_active Abandoned
- 1998-06-09 ES ES10011461.0T patent/ES2626646T3/es not_active Expired - Lifetime
- 1998-06-09 CA CA002293426A patent/CA2293426C/en not_active Expired - Lifetime
- 1998-06-09 JP JP50311999A patent/JP4754661B2/ja not_active Expired - Lifetime
- 1998-06-09 WO PCT/US1998/011958 patent/WO1998057152A1/en not_active Ceased
- 1998-06-09 EP EP10011461.0A patent/EP2302368B1/en not_active Expired - Lifetime
- 1998-06-09 EP EP98926490.8A patent/EP0988523B1/en not_active Expired - Lifetime
-
2009
- 2009-09-14 JP JP2009211291A patent/JP4999900B2/ja not_active Expired - Lifetime
Patent Citations (2)
| Publication number | Priority date | Publication date | Assignee | Title |
|---|---|---|---|---|
| DE3718407A1 (de) * | 1987-06-02 | 1988-12-22 | Hund Helmut Gmbh | Anordnung fuer die optische analyse von partikelpopulationen in gasen und fluessigkeiten |
| EP0745682A1 (de) * | 1995-06-02 | 1996-12-04 | Bayer Ag | Sortiervorrichtung für biologische Zellen oder Viren |
Non-Patent Citations (1)
| Title |
|---|
| BALKANSKI M ET AL: "Resonant light scattering", JOURNAL OF LUMINESCENCE, ELSEVIER BV NORTH-HOLLAND, NL, vol. 18-19, 1 January 1979 (1979-01-01), pages 665 - 672, XP024486436, ISSN: 0022-2313, [retrieved on 19790101], DOI: 10.1016/0022-2313(79)90214-X * |
Also Published As
| Publication number | Publication date |
|---|---|
| CA2293426A1 (en) | 1998-12-17 |
| JP4754661B2 (ja) | 2011-08-24 |
| JP2010017188A (ja) | 2010-01-28 |
| ES2626646T3 (es) | 2017-07-25 |
| CA2293426C (en) | 2007-05-15 |
| EP2302368A1 (en) | 2011-03-30 |
| JP4999900B2 (ja) | 2012-08-15 |
| JP2002506522A (ja) | 2002-02-26 |
| EP0988523B1 (en) | 2013-08-14 |
| WO1998057152A1 (en) | 1998-12-17 |
| AU7831798A (en) | 1998-12-30 |
| EP0988523A1 (en) | 2000-03-29 |
Similar Documents
| Publication | Publication Date | Title |
|---|---|---|
| US6816257B2 (en) | Method and apparatus for detecting microparticles in fluid samples | |
| EP2302368B1 (en) | Method and apparatus for detecting microparticles in fluid samples | |
| US5798222A (en) | Apparatus for monitoring substances in organisms | |
| Marie et al. | Phytoplankton cell counting by flow cytometry | |
| US9683920B2 (en) | Use of focused light scattering techniques in biological applications | |
| US7973294B2 (en) | Methods and devices for characterizing particles in clear and turbid media | |
| US3916197A (en) | Method and apparatus for classifying biological cells | |
| EP2843410B1 (en) | Sample analyzing method and sample analyzer | |
| US6964857B2 (en) | Measuring indigenous photosynthetic organisms to detect chemical warefare agents in water | |
| AU2002255500A1 (en) | Tissue-based water quality biosensors for detecting chemical warfare agents | |
| US6556296B1 (en) | Method for characterizing samples by determination of a function of at least one specific property of particles in a sample | |
| ES2357035T3 (es) | Método de discriminación de al menos dos poblaciones celulares y aplicación. | |
| EP1019687B1 (en) | A method for characterizing samples by determination of a function of at least one specific physical property of particles of said sample | |
| JP5799086B2 (ja) | 分類学的階層分類を用いる微生物因子の同定及び/又はキャラクタリゼーション | |
| CN101310173A (zh) | 用于检测活细胞活性的装置和方法 | |
| US20190346555A1 (en) | Use of focused light scattering techniques in biological applications | |
| US20090326358A1 (en) | Non-invasive fast-response biodosimeter | |
| Saxena et al. | Flow Cytometry: Basics and Applications | |
| EP4646582A1 (en) | Method of fluorescent dye variation compensation by free state fluorescence measurement | |
| Gheewala et al. | Available online through www. jpronline. info |
Legal Events
| Date | Code | Title | Description |
|---|---|---|---|
| PUAI | Public reference made under article 153(3) epc to a published international application that has entered the european phase |
Free format text: ORIGINAL CODE: 0009012 |
|
| AC | Divisional application: reference to earlier application |
Ref document number: 0988523 Country of ref document: EP Kind code of ref document: P |
|
| AK | Designated contracting states |
Kind code of ref document: A1 Designated state(s): AT BE CH CY DE DK ES FI FR GB GR IE IT LI LU MC NL PT SE |
|
| 17P | Request for examination filed |
Effective date: 20110929 |
|
| RAP1 | Party data changed (applicant data changed or rights of an application transferred) |
Owner name: EMD MILLIPORE CORPORATION |
|
| 17Q | First examination report despatched |
Effective date: 20150526 |
|
| GRAC | Information related to communication of intention to grant a patent modified |
Free format text: ORIGINAL CODE: EPIDOSCIGR1 |
|
| GRAP | Despatch of communication of intention to grant a patent |
Free format text: ORIGINAL CODE: EPIDOSNIGR1 |
|
| INTG | Intention to grant announced |
Effective date: 20161026 |
|
| STAA | Information on the status of an ep patent application or granted ep patent |
Free format text: STATUS: GRANT OF PATENT IS INTENDED |
|
| GRAS | Grant fee paid |
Free format text: ORIGINAL CODE: EPIDOSNIGR3 |
|
| GRAA | (expected) grant |
Free format text: ORIGINAL CODE: 0009210 |
|
| STAA | Information on the status of an ep patent application or granted ep patent |
Free format text: STATUS: THE PATENT HAS BEEN GRANTED |
|
| AC | Divisional application: reference to earlier application |
Ref document number: 0988523 Country of ref document: EP Kind code of ref document: P |
|
| AK | Designated contracting states |
Kind code of ref document: B1 Designated state(s): AT BE CH CY DE DK ES FI FR GB GR IE IT LI LU MC NL PT SE |
|
| REG | Reference to a national code |
Ref country code: GB Ref legal event code: FG4D |
|
| REG | Reference to a national code |
Ref country code: CH Ref legal event code: EP |
|
| REG | Reference to a national code |
Ref country code: AT Ref legal event code: REF Ref document number: 882277 Country of ref document: AT Kind code of ref document: T Effective date: 20170415 |
|
| REG | Reference to a national code |
Ref country code: IE Ref legal event code: FG4D |
|
| REG | Reference to a national code |
Ref country code: DE Ref legal event code: R096 Ref document number: 69843608 Country of ref document: DE Ref country code: FR Ref legal event code: PLFP Year of fee payment: 20 |
|
| REG | Reference to a national code |
Ref country code: NL Ref legal event code: FP |
|
| PGFP | Annual fee paid to national office [announced via postgrant information from national office to epo] |
Ref country code: NL Payment date: 20170512 Year of fee payment: 20 |
|
| REG | Reference to a national code |
Ref country code: ES Ref legal event code: FG2A Ref document number: 2626646 Country of ref document: ES Kind code of ref document: T3 Effective date: 20170725 |
|
| PGFP | Annual fee paid to national office [announced via postgrant information from national office to epo] |
Ref country code: FR Payment date: 20170511 Year of fee payment: 20 Ref country code: DE Payment date: 20170606 Year of fee payment: 20 Ref country code: GB Payment date: 20170607 Year of fee payment: 20 Ref country code: CH Payment date: 20170613 Year of fee payment: 20 |
|
| PGFP | Annual fee paid to national office [announced via postgrant information from national office to epo] |
Ref country code: IT Payment date: 20170619 Year of fee payment: 20 Ref country code: BE Payment date: 20170515 Year of fee payment: 20 |
|
| REG | Reference to a national code |
Ref country code: AT Ref legal event code: MK05 Ref document number: 882277 Country of ref document: AT Kind code of ref document: T Effective date: 20170405 |
|
| PG25 | Lapsed in a contracting state [announced via postgrant information from national office to epo] |
Ref country code: GR Free format text: LAPSE BECAUSE OF FAILURE TO SUBMIT A TRANSLATION OF THE DESCRIPTION OR TO PAY THE FEE WITHIN THE PRESCRIBED TIME-LIMIT Effective date: 20170706 Ref country code: AT Free format text: LAPSE BECAUSE OF FAILURE TO SUBMIT A TRANSLATION OF THE DESCRIPTION OR TO PAY THE FEE WITHIN THE PRESCRIBED TIME-LIMIT Effective date: 20170405 Ref country code: FI Free format text: LAPSE BECAUSE OF FAILURE TO SUBMIT A TRANSLATION OF THE DESCRIPTION OR TO PAY THE FEE WITHIN THE PRESCRIBED TIME-LIMIT Effective date: 20170405 |
|
| PGFP | Annual fee paid to national office [announced via postgrant information from national office to epo] |
Ref country code: ES Payment date: 20170706 Year of fee payment: 20 |
|
| PG25 | Lapsed in a contracting state [announced via postgrant information from national office to epo] |
Ref country code: SE Free format text: LAPSE BECAUSE OF FAILURE TO SUBMIT A TRANSLATION OF THE DESCRIPTION OR TO PAY THE FEE WITHIN THE PRESCRIBED TIME-LIMIT Effective date: 20170405 |
|
| REG | Reference to a national code |
Ref country code: DE Ref legal event code: R097 Ref document number: 69843608 Country of ref document: DE |
|
| PG25 | Lapsed in a contracting state [announced via postgrant information from national office to epo] |
Ref country code: DK Free format text: LAPSE BECAUSE OF FAILURE TO SUBMIT A TRANSLATION OF THE DESCRIPTION OR TO PAY THE FEE WITHIN THE PRESCRIBED TIME-LIMIT Effective date: 20170405 Ref country code: MC Free format text: LAPSE BECAUSE OF FAILURE TO SUBMIT A TRANSLATION OF THE DESCRIPTION OR TO PAY THE FEE WITHIN THE PRESCRIBED TIME-LIMIT Effective date: 20170405 |
|
| PLBE | No opposition filed within time limit |
Free format text: ORIGINAL CODE: 0009261 |
|
| STAA | Information on the status of an ep patent application or granted ep patent |
Free format text: STATUS: NO OPPOSITION FILED WITHIN TIME LIMIT |
|
| 26N | No opposition filed |
Effective date: 20180108 |
|
| REG | Reference to a national code |
Ref country code: IE Ref legal event code: MM4A |
|
| PG25 | Lapsed in a contracting state [announced via postgrant information from national office to epo] |
Ref country code: LU Free format text: LAPSE BECAUSE OF NON-PAYMENT OF DUE FEES Effective date: 20170609 Ref country code: IE Free format text: LAPSE BECAUSE OF NON-PAYMENT OF DUE FEES Effective date: 20170609 |
|
| REG | Reference to a national code |
Ref country code: DE Ref legal event code: R071 Ref document number: 69843608 Country of ref document: DE |
|
| REG | Reference to a national code |
Ref country code: NL Ref legal event code: MK Effective date: 20180608 |
|
| REG | Reference to a national code |
Ref country code: CH Ref legal event code: PL |
|
| REG | Reference to a national code |
Ref country code: GB Ref legal event code: PE20 Expiry date: 20180608 |
|
| PG25 | Lapsed in a contracting state [announced via postgrant information from national office to epo] |
Ref country code: GB Free format text: LAPSE BECAUSE OF EXPIRATION OF PROTECTION Effective date: 20180608 |
|
| REG | Reference to a national code |
Ref country code: BE Ref legal event code: MK Effective date: 20180609 |
|
| PG25 | Lapsed in a contracting state [announced via postgrant information from national office to epo] |
Ref country code: CY Free format text: LAPSE BECAUSE OF NON-PAYMENT OF DUE FEES Effective date: 20170405 |
|
| PG25 | Lapsed in a contracting state [announced via postgrant information from national office to epo] |
Ref country code: PT Free format text: LAPSE BECAUSE OF FAILURE TO SUBMIT A TRANSLATION OF THE DESCRIPTION OR TO PAY THE FEE WITHIN THE PRESCRIBED TIME-LIMIT Effective date: 20170405 |
|
| REG | Reference to a national code |
Ref country code: ES Ref legal event code: FD2A Effective date: 20220128 |
|
| PG25 | Lapsed in a contracting state [announced via postgrant information from national office to epo] |
Ref country code: ES Free format text: LAPSE BECAUSE OF EXPIRATION OF PROTECTION Effective date: 20180610 |