EP2000794B1 - Vorrichtung und Verfahren zum Bestimmen einer spektral aufgelösten bi-direktionalen Erscheinungseigenschaft einer Oberfläche - Google Patents
Vorrichtung und Verfahren zum Bestimmen einer spektral aufgelösten bi-direktionalen Erscheinungseigenschaft einer Oberfläche Download PDFInfo
- Publication number
- EP2000794B1 EP2000794B1 EP08157476.6A EP08157476A EP2000794B1 EP 2000794 B1 EP2000794 B1 EP 2000794B1 EP 08157476 A EP08157476 A EP 08157476A EP 2000794 B1 EP2000794 B1 EP 2000794B1
- Authority
- EP
- European Patent Office
- Prior art keywords
- reflectance
- directions
- spectrum
- points
- wavelengths
- Prior art date
- Legal status (The legal status is an assumption and is not a legal conclusion. Google has not performed a legal analysis and makes no representation as to the accuracy of the status listed.)
- Active
Links
Images


Classifications
-
- G—PHYSICS
- G01—MEASURING; TESTING
- G01N—INVESTIGATING OR ANALYSING MATERIALS BY DETERMINING THEIR CHEMICAL OR PHYSICAL PROPERTIES
- G01N21/00—Investigating or analysing materials by the use of optical means, i.e. using sub-millimetre waves, infrared, visible or ultraviolet light
- G01N21/17—Systems in which incident light is modified in accordance with the properties of the material investigated
- G01N21/47—Scattering, i.e. diffuse reflection
- G01N21/4738—Diffuse reflection, e.g. also for testing fluids, fibrous materials
- G01N21/474—Details of optical heads therefor, e.g. using optical fibres
-
- G—PHYSICS
- G01—MEASURING; TESTING
- G01N—INVESTIGATING OR ANALYSING MATERIALS BY DETERMINING THEIR CHEMICAL OR PHYSICAL PROPERTIES
- G01N21/00—Investigating or analysing materials by the use of optical means, i.e. using sub-millimetre waves, infrared, visible or ultraviolet light
- G01N21/17—Systems in which incident light is modified in accordance with the properties of the material investigated
- G01N21/55—Specular reflectivity
-
- G—PHYSICS
- G01—MEASURING; TESTING
- G01N—INVESTIGATING OR ANALYSING MATERIALS BY DETERMINING THEIR CHEMICAL OR PHYSICAL PROPERTIES
- G01N21/00—Investigating or analysing materials by the use of optical means, i.e. using sub-millimetre waves, infrared, visible or ultraviolet light
- G01N21/84—Systems specially adapted for particular applications
- G01N21/8422—Investigating thin films, e.g. matrix isolation method
-
- G—PHYSICS
- G01—MEASURING; TESTING
- G01N—INVESTIGATING OR ANALYSING MATERIALS BY DETERMINING THEIR CHEMICAL OR PHYSICAL PROPERTIES
- G01N21/00—Investigating or analysing materials by the use of optical means, i.e. using sub-millimetre waves, infrared, visible or ultraviolet light
- G01N21/17—Systems in which incident light is modified in accordance with the properties of the material investigated
- G01N21/47—Scattering, i.e. diffuse reflection
- G01N2021/4704—Angular selective
- G01N2021/4711—Multiangle measurement
Definitions
- measurements of the visual appearance of an object can reveal properties of any paints, pigments, specialty coatings, surface treatments, etc., that may be present on the object.
- measurements of the visual appearance of an object can be used to create computer models, set production tolerances, etc. It is known to use various devices to provide spectral measurements of a surface of an object. Existing devices, however, either produce results of limited detail or are exorbitant in cost, size, and the time necessary for measurements.
- discrete multi-angle spectrometers that measure reflectance over a limited number of viewing and illumination directions.
- An example of such a device is the MA68 available from X-RITE. All of these devices, however, either consider a limited number of viewing directions (e.g ., coplanar directions), or consider data derived from all viewing angles together, for example, by summing or averaging over all directions.
- known discrete multi-angle spectrometers provide results that do not reflect directional variations in surface appearance. Referring to the coatings industry, these results can be useful to measure some properties of surfaces including conventional paints, pigments, and coatings.
- BRDF Bidirectional Reflectance Distribution Function
- Goniospectrophotometers such as the GCMS-4 Gonio-Spectro-Photometric Colorimeter available from MURAKAMI, measure the complete BRDF by scanning both illumination and detection angles, typically over a complete hemisphere. Although they can provide good results, the devices are extremely large and expensive. Also, it can take several hours to scan illumination and detection angles over a complete hemisphere, making real-time applications impossible. Parousiameters, such as the one described in U.S. Patent No. 6,557,397 to Wademan, measure the complete BRDF by projecting a range of illumination and detection angles onto a hemispheric screen and imaging the screen using a camera.
- Embodiments of the present invention are directed to methods and apparatuses for measuring and/or analyzing a spatially under-sampled Bidirectional Reflectance Distribution Function (BRDF) of a surface.
- BRDF Bidirectional Reflectance Distribution Function
- the BRDF of a surface is an expression of the intensity of this reflectance over all or multiple wavelengths and reflectance directions as a function of illumination angle and other variables (e.g., polarization).
- the BRDF of a surface is spatially under-sampled by measuring the intensity of reflectance at only a discrete number of reflectance directions.
- At least a first, a second, and a third discrete reflectance direction are non-coplanar.
- the measured reflectance may then be processed to derive one or more appearance properties of the surface under observation.
- the appearance properties may reflect directional variation in the appearance of the surface, as captured by the measured reflectance.
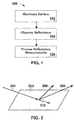
- Figure 1 shows a flow chart illustrating a process flow 100 for measuring and processing a spatially under-sampled BRDF of a surface according to various embodiments.
- light may be directed toward the surface.
- the light may be formed into one or more beams, which may be collimated or non-collimated.
- the light may originate from one or more broad spectrum illumination sources and may be incident on the surface from one or more illumination directions.
- the number of illumination sources and illumination directions may vary based on the particular application. It will be appreciated, however, that increasing the number of illumination sources and/or directions may increase the quality of the resulting BRDF.
- the illumination direction or directions may form any angle with the surface normal. In various embodiments, however, the illumination direction or directions may form angles with the surface normal of between zero and sixty-five degrees (e.g., zero degrees, 45 degrees, etc.).
- the intensity of the reflectance off of the surface in a plurality of discrete reflectance directions may be measured. It will be appreciated that these measured reflectances, along with the corresponding reflectance directions, represent a spatially under-sampled BRDF of the surface.
- the complete set of reflectance directions may be non-coplanar. According to the invention, multiple measurements are taken at each reflectance direction, with each measurement recording the reflectance intensity at a particular wavelength or wavelength range. In various embodiments, the measurements may be taken from fixed sensors, with one sensor fixed on each of the plurality discrete reflectance directions.
- the time necessary to measure the reflectance may be less than that taken by complete BRDF devices (e.g ., goniospectrophotometers and parousiameters). In various embodiments, the measurements may be taken in under five seconds.
- the spatially under-sampled BRDF may be expressed as a series of reflectance vectors representing the observed intensities at each reflectance direction.
- each observed reflectance direction may have a vector pointing in the reflectance direction with a magnitude equal to the observed reflectance intensity in the reflectance direction. It will be appreciated that if multiple wavelengths or wavelength ranges are observed in a reflectance direction, then reflectance directions may have a vector corresponding to each of the wavelengths or wavelength ranges.
- Figure 2 shows an exemplary surface 202 with light incident on the surface 202 from an illumination direction 204.
- Three discrete non-coplanar reflectance directions 206, 208, 210 are observed.
- Figure 3 shows another exemplary surface 302 according to various embodiments having incident light from one illumination direction 304 and eleven observed reflectance directions 306, 308, 310, 312, 314, 316, 318, 320, 322, 324 and 326. It will be appreciated that the number and identity of the reflectance directions may vary. For example, in various embodiments, there may be between five and fifteen reflectance directions.
- the reflectance directions may include industry standard reflectance directions (e.g., those having aspecular angles of 15, 25, 45, 75 and 100 degrees.) Also, in various embodiments, at least one of the reflectance directions may be chosen orthogonal to the illumination direction relative to a surface normal of the surface.
- the number of observed reflectance directions may be chosen based on a desired resolution of results and/or the complexity of the surface to be measured.
- each layer and/or materials contained in the layers of a surface may have a number of physical properties (e.g ., roughness, local slope, curvature, real and imaginary portions of the index of refraction, etc.).
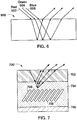
- Figure 4 shows an exemplary surface 400 that may be observed according to various embodiments.
- the surface 400 has a specialty coating, such as, for example, an interference or pearlescent coating, discussed above.
- the surface 400 includes three layers, clear coat 402, pigment layer 404 and substrate 406, as well as one material contained in the layers ( e.g., metal flakes 408). Accordingly, a minimum number of observed reflectance directions for the surface 400 would be seven. It will be appreciated that useful readings may be obtained using less than the minimum number of reflectance directions according to Equation 1, however, in that case, the observed reflectance may not capture the contribution to BRDF from each of the surface features.
- Equation 2 may define the number of reflectance directions necessary to have an independent relationship for each physical property to be measured.
- the reflectance measured at step 104 may be processed to generate an appearance property or properties of the surface.
- the spatially under-sampled BRDF itself may be considered an appearance property of the surface, though it will be appreciated that other appearance properties may be generated, for example, by manipulating the BRDF.
- At least one of the appearance properties may reflect directional differences in the appearance of the surface that are inherent in the measured reflectance intensities and directions.
- additional appearance properties may be found by performing manipulations to the BRDF.
- Figure 5 shows a process flow 500, described below, for processing measured reflectance by plugging the measured reflectance into a mathematical model for the BRDF of the surface and performing certain mathematical manipulations.
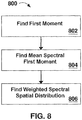
- Figure 8 shows a process flow 800 for analyzing various moments of the BRDF data.
- the appearance properties generated at step 106 may yield information about the composition and features of the surface under measurement (e.g ., physical properties). For example, in the coatings industry, properties of the formulation and application process of any coatings present on the surface may be found. For some physical properties, closed form solutions may exist that allow values for the properties to be derived directly from the measured reflectance or BRDF. For example, as discussed below, a grating structure period may be derived from the BRDF, and may relate directly to the distance between regularly spaced features of the surface. Also, some physical properties may be derived using experimental methods. For example, appearance properties of surfaces with known physical properties may be measured. A database may then be created showing correlations between appearance properties and physical properties. When a surface with unknown physical properties is measured, appearance properties (e.g ., BRDF, and/or values derived therefrom) may be compared to the database to find the unknown physical properties.
- physical properties e.g ., BRDF, and/or values derived therefrom
- Figure 5 shows the process flow 500 for processing measured reflectance (e.g., BRDF) and deriving additional appearance properties of the surface using mathematical models based on the BRDF.
- the BRDF may be converted to a Bidirectional Scatter Distribution Function (BSDF).
- the BSDF represents the portion of the BRDF due to scattering of incident light.
- the specular component of BRDF is subtracted from the BRDF.
- the specular component is that portion of the BRDF that is due to Fresnel reflection of incident light.
- the specular component is concentrated in a reflectance direction that is related to the illumination direction such that the angle of incidence of the illumination direction is equal to the angle of reflectance of the specular reflectance direction.
- the illumination direction 304 forty-five degrees from the surface and 45 degrees from the surface normal. Accordingly, the specular component is directed in reflectance direction 306, which is also 45 degrees from the surface and surface normal. It will be appreciated that if there is more than one illumination direction, then the specular component may be concentrated in more than one angle.
- the specular component may be subtracted from the BRDF in a number of different ways.
- one of the observed reflectance directions may be the specular direction.
- the BSDF may be found by subtracting the contribution of this reflectance direction from the overall BRDF.
- the specular direction is not one of the observed reflectance directions, then the specular component may be approximated based on the responses at observed reflectance directions near the specular direction. The approximation of the specular component may then be subtracted from the BRDF.
- PSD Power Spectral Distribution
- a material scattering term may be found.
- the material scattering term may be indicative of fluctuations in the composition or density of the surface material (e.g ., homogeneity, bubbles, inclusions, randomly dispersed or distributed pigments smaller than approximately 30 microns, etc.).
- This PSD may be related to specific models of the material inhomogeneities, such as the magnitudes and spatial distribution of variations in composition.
- a material scattering term may then be found by dividing the BSDF by (1/ ⁇ 2 ). Experimental methods may be used to tie values of the material scattering term (e.g., an appearance property) to particular types, sizes, etc. of fluctuations in composition and/or density of the surface ( e.g ., physical properties).
- Equation 4 may be applied to a surface that is measured or assumed to be relatively free of blemishes.
- Equation 5 may be applied to surfaces with known defects.
- an index of refraction of the surface may be found.
- Figure 6 shows a surface 600 having red 602, green 604, and blue 606 beams incident thereon.
- Figure 6 illustrates how refraction may cause the different beams 602, 604, 606 to behave differently.
- the index of refraction may be considered a physical property of the surface, however, it will be appreciated that additional physical properties (e.g ., the grating structure period below) may be derived based on the index of refraction.
- a grating structure period of the surface may be found.
- the grating structure period may provide information about surface features, interface features, bulk material structure, pigments, particles, flakes, etc., present in the surface that have an ordered structure. Such ordered features may cause diffraction and/or interference in reflected light based on the grating structure period of the features.
- Figure 7 shows an exemplary surface 700 having a series of flakes 708 embedded therein at a regular or semi-regular interval and orientation.
- the grating structure period of the surface 700 may reflect the distance between and/or orientation of the flakes 708.
- FIG. 8 shows a process flow 800 for deriving values indicative of surface properties using a moment or moments of the BRDF.
- a first moment, or weighted directional response may be found.
- the weighted direction response may be the vector summation of all of each of the vectors representing the observed intensities and reflectance directions over a given wavelength or wavelength range. It will be appreciated that where multiple wavelengths or wavelength ranges are considered, a weighted directional response may be calculated for each of the considered wavelengths or wavelength responses.
- weighting factors may be applied to one or more of the observe reflectance directions.
- the weighting factors may be chosen so that the resulting weighted BRDF more closely approximates a geometrically uniform distribution of reflectance directions.
- weighting factors may be chosen to accentuate reflectance directions that have increased significance for certain surface types. For example, when the surface includes an interference pigment, the reflectance direction having an aspecular angle of -15° may be disproportionately weighed, when the surface includes a retroreflective material, reflectance directions having aspecular angles of 75° and 110° may be disproportionately weighted.
- weighting factors may be chosen to be compatible with various standards.
- the DIN 6175-2 standard defines color difference formulas with weighting functions that depend on the standard measurement angles, (e.g., the 15/25/45/75/110 angles described above).
- the weighting factors may be chosen based on human perceptual studies (e.g ., the reflectance directions that humans most strongly perceive may be given higher weighting factors).
- the weighting factors may also be chosen to more accurately represent the distribution of energy reflected off the surface. For example, if the total energy reflected off the surface is 20 mW, and it is expected that a disproportionately high portion of the 20 mW is expected to be reflected in a certain range of reflectance directions, then intensity measurements taken in that range of reflectance directions may be given a relatively higher weighting compared to other directions. In this way, the spatially under-sampled BRDF may more closely match the actual energy distribution modeled by the full BRDF.
- the weighted directional response may be tied to various properties of the surface. For example, in the case of a surface having a coating, the weighted directional response may be used to identify application process variations between two surfaces. For example, when two surfaces differ only in the application process of a coating on the surfaces, the weighted directional response of the first surface can typically be transformed into the weighted directional response of the second surface. The necessary translations, rotations and scaling can be experimentally tied to particular application process variations.
- a mean spectral first moment of the surface may be found.
- the mean spectral first moment may be a vector whose direction represents the average spectral first moment.
- a weighted spectral spatial distribution function may be found at step 806.
- the weighted spectral spatial distribution may be a function that describes the general line shape defined by the directional endpoints of the weighted directional response. Both of these appearance properties (e.g ., the mean spectral first moment and weighted spectral spatial distribution) may be experimentally tied to various physical properties of the surface.
- Figure 9 shows a diagram of a system 901 that may be used to implement methods of measuring and/or analyzing a spatially under-sampled BRDF of a surface, for example, as described above, according to various embodiments.
- the system 901 includes a measuring device 900, and may also include various other information storage, processing and/or interface devices such as, for example, a server 922, a user machine 926 and/or a database 924.
- the various devices 900, 922, 924, 926 of the system 901 may be in contact with one another via a network 920, which may be any suitable type of wired or wireless network.
- the measuring device 900 may include an optics unit 902 and an electronics unit 904.
- the optics unit 902 may include illumination optics 912 configured to direct light 908 towards a surface 906 under inspection, and receiver optics 914 for receiving and sensing the reflectance 910 of the light 908 off of the surface 906.
- the illumination optics 912 and receiver optics 914 may sense a spatially under-sampled BRDF of the surface 906 as described above.
- the electronics unit 904 may process the reflectance results generated by the optics unit 902.
- the electronics unit 904 may include calculation logic 916 for deriving appearance properties of the surface and/or relating appearance properties to physical properties.
- a user interface module 918 may present results (e.g., raw reflectance data, appearance properties, physical properties, etc.) to a user of the device 900.
- results e.g., raw reflectance data, appearance properties, physical properties, etc.
- some or all of the processing and presenting of results may be performed by other components of the system for processing (e.g ., server 922, database 924, user machine 926).
- the server 922 and/or user machine 926 may perform processing to derive appearance and/or physical properties; results of the processing may be presented to a user through the user machine 926; and the database 924 may store experimental correlations between measured reflectance and surface properties.
- the illumination optics 912 may include one or more illumination sources 913 configured for directing light 908 toward the surface 906 from one or more illumination directions.
- the illumination sources 913 may include any kind of suitable illumination source including, for example, an incandescent source, a white LED, etc.
- each illumination source 913 may include a plurality (e.g., nine) LED's of various spectral outputs. The LED's may be positioned on a leadless chip carrier or any other kind of installation technology. It will be appreciated that the illumination source or sources 913 may generate light across the wavelengths that are to be measured by the receiver optics 914 as described herein below.
- the illumination sources 913 may be configured to generate collimated or non-collimated beams, for example, as described above.
- the receiver optics 914 may include one or more sensors 915 positioned along discrete reflectance directions.
- the sensors 915 may be positioned to sense non-coplanar reflectance directions such as, for example, reflectance directions 206, 208 and 210 shown in Figure 2 .
- the sensors 915 may be any kind of imaging or non-imaging sensor or sensor assembly suitable for measuring reflectance ( e.g ., across multiple discrete wavelength ranges).
- the sensors 915 may include one or more photodiodes. Any suitable kind of wavelength discriminating equipment (e.g., any kind of band-pass spectral filter, diffraction grating spectrograph, etc.) may be placed in front of the photodiode to sense discrete wavelength ranges.
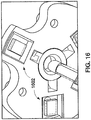
- the MAZet Jencolour product line may be used, as shown by sensors 1602 in Figure 16 .
- a wheel or other movable device including multiple band-pass filters may be selectively placed in front of the photodiode, allowing one photodiode to measure several discrete wavelength ranges.
- multiple photodiodes may be provided along each reflectance direction, which each of the multiple photodiodes having a separate band-pass filter.
- the sensors 915 may include a wide-band detector capable of discretely measuring multiple wavelength ranges simultaneously such as, for example, a RGB sensor, such as a camera with a logarithmic response or a small array of pixels (e.g ., the TCS230 line available from Taos, Inc.).
- a RGB sensor such as a camera with a logarithmic response or a small array of pixels (e.g ., the TCS230 line available from Taos, Inc.).
- FIG 10 shows an exemplary database schema 1000 that may be used to store measurement data, for example, at database 924 and/or electronics unit 904.
- Box 1002 may include information about the instrument (e.g ., instrument 900) that is taking the measurement. Such information can include a name, serial number, etc.
- Box 1004 may include information about a particular measurement including, for example, date, time, location number, instrument orientation, etc.
- Boxes 1006 and 1008 may include information about the panel or surface under measurement.
- box 1006 may include information about the panel or surface itself while box 1008 may include a template of preferred measurements to be taken on the surface (e.g., the number, height, width, distance from the edge, etc.).
- Box 1010 may include information about each of the angles or reflectance directions that are to be observed, and box 1012 may include actual measured data. For example, if eleven reflectance directions are measured over thirty-one wavelength ranges, then the total number of data points for each measurement may be 341.
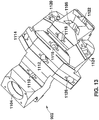
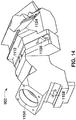
- FIGS 11-14 show views of an exemplary optics unit 902 according to various embodiments.
- the exemplary optics unit 902 includes one illumination source 1104 and eleven apertures or pupils for receiving sensors 1106, 1108, 1110, 1112, 1114, 1116, 1118, 1120, 1122, 1124, 1126.
- sensor may comprise an aperture for receiving light and a receiving element for sensing the intensity of the light.
- the illumination source 1104 is directed toward a surface positioned below the unit (not shown) at a forty-five degree angle relative to the surface normal. Accordingly, the specular reflectance direction is also at a forty-five degree angle relative to the surface normal.
- Pupil 1106 may be positioned to sense reflectance at the specular reflectance direction.
- the positions of the other pupils may be expressed relative to the specular reflectance direction, although, it will be appreciated that the positions of the pupils may be expressed in any suitable coordinate system.
- pupil 1122 may be positioned at -15° relative to the specular.
- Pupil 1118 may be at 15° relative to the specular, with pupil 1116 at 25°, pupil 1112 at 45°, pupil 1110 at 75°, and pupil 1108 at 110°.
- the location of pupils off the plane of pupils 1106, 1108, 1110, 1112, 1116, and 1118 may also be expressed relative to the specular reflectance direction.
- pupil 1124 is positioned 25° from the specular reflectance direction and rotated 90° counterclockwise out of plane.
- pupil 1120 is positioned 25° from the specular reflectance direction and rotated 90° clockwise out of plane.
- Pupils 1114 and 1126 are both positioned 60° from the specular reflectance direction and rotated 54.7° clockwise and counterclockwise out of plane, respectively.
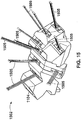
- FIG. 15 shows another exemplary optics unit 1502 having optical fibers 1505 originating at various pupils.
- the fibers 1505 may transport light incident at the pupils to a remote location (not shown) that may house one or more receiving elements.
- Figure 17 shows an exemplary process flow 1700 for identifying properties of an unknown surface using the methods and/or apparatuses described above.
- various appearance properties may be derived from the observed reflectance or BRDF of the surface.
- BRDF weighted spectral spatial distribution
- an integrated BRDF of the surface may be found.
- An integrated BSDF of the surface may be found at step 1706.
- a grating line structure of the surface may be found at step 1708.
- the appearance properties are compared to a look-up table, such as look-up Table 1, below to identify the unknown surface and/or physical properties thereof.
- the look-up table may be stored, for example, by the database 924 and/or the electronics unit 904 of the device 900.
- TABLE 1 Surface Type ⁇ Properties Weighted Spectral Spatial Distribution Magnitude Integrated BRDF Integrated BSDF Grating Structure Line Moment Size Diffuse/Specular Specular Absorber Small Small Small N/A N/A Specular Pigmented Surface Small Small Large N/A Medium N/A Surface Texture Absorber Small Small Large N/A Small N/A Specular Pure Absorber Small Large Small N/A N/A N/A Heavy Surface Structure Large Small Small Yes N/A N/A Metal Flake Large Small Large No N/A N/A Special Effect - Chroma Flair Large Small Large Yes N/A N/A Special Effect - Mica Large Large Small No N/A N/A Surface Scratches Large Large Small Yes N/A N/A Special Effect - Chroma Flair Large Large Large Yes N/A N/A Potential Calibration Error Large Large Large No N/A N/A Potential Calibration Err
- Figure 18 shows a process flow 1800 for using the processes and/or apparatuses described above to find a directional color difference between two surfaces according to various embodiments.
- the directional color difference is a Delta E value computed according to the CIELAB equations, though it will be appreciated that any suitable color measurement methodology may be used.
- an XYZ weight matrix may be computed based on a specified illuminant and observer.
- the XYZ weight matrix may be of size 3 by X, where X is the number of discrete wavelengths or wavelength range that are measured. Recall that the weighted directional response can be represented by a set of vectors, with one vector for each wavelength range.
- the weighted directional response may be represented as a vector of size X by d, where d is the number of terms necessary to represent the spatial coordinate axis ( e.g., in three dimensions, d is equal to 3).
- the two matrices may be multiplied at step 1804 resulting in a 3 by d matrix.
- the CIELAB functions may be applied at step 1806. In various embodiments, the CIELAB functions may be applied to each column of the 3 by d matrix individually. Alternatively, the CIELAB functions may be applied to the magnitude of each column of the 3 by d matrix.
- the Delta E value may be calculated.
- Figure 19 shows a process flow 1900 that may be utilized in the coatings industry, for example, by a finisher of automotive parts, to match the appearance of coatings applied to two components, which may be manufactured and coated at different times and different facilities (e.g ., a door handle may be made at Factory A, while a bumper may be made at Factory B).
- the process flow 1900 may be used to determine coating formulation and/or process factors for the second component based on observations of the first component.
- an appearance property of a first coated component may be measured and/or calculated.
- the appearance property may be, for example, a weighted directional response, BRDF, etc.
- an appearance property of a second coated component may be measured, for example in the same way as the first.
- the appearance properties of the two coated components may be compared. If differences are found, (e.g ., because the second coated component does not match the first) then the appearance property exhibiting the differences may be tied to a particular formulation or application factor at step 1908, for example, as described above. The formulation or application factor of the second coated component may then be modified to coat additional components to match the first, allowing a higher quality appearance match between components.
- Figure 20 shows a process flow 2000 for determining process and/or formulation factors to be used when coating a replacement part.
- an appearance property of a first coated component may be found (e.g ., a weighted directional response, BRDF, etc .).
- the first coated component may be, for example, a component of an automobile.
- a formulation or application factor for reproducing the appearance of the coating on the first component may be found ( e.g ., by tying the appearance property to the formulation or application factor).
- a coating may be applied to a second component, considering the formulation or application factor found at step 2004.
- the process flow 2000 may be useful, for example, to autobody shops. In this way the coating of the second component may match that of the first.
- an autobody shop may match the paint formulation and process used to repaint a component or paint a replacement component to match the appearance of components already on the car. This may provide a better appearance match then reproducing the original formulation and process factors, as the appearance of the components changes with weathering and wear.
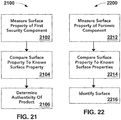
- Figure 21 shows a process flow 2100, according to various embodiments, for verifying the identity of a security component.
- the security component may be, for example, a security ink (e.g., a security ink having an appearance that depends on viewing angle).
- the ink may be present on a label or other indicator on a product.
- the security component may be the product itself, for example, in the instance of a cosmetic or similar product having a distinct appearance.
- an appearance property of the first unknown component may be measured.
- the appearance property may be a weighted directional response, BDRF, etc.
- the measured appearance property may be compared to a known appearance property of an authentic security component.
- the authenticity of the product under test may be found at step 2106. For example, if the appearance property of the unknown security component matches the appearance property of the known product, then the unknown product is likely authentic. If the property of the tested security component does not match the known property, then the product may be counterfeit. It will be appreciated that the reliability of the match may be increased by considering multiple independent appearance properties.
- Figure 22 shows a process flow 2200 according to various embodiments, for identifying the source of a component.
- the process flow 2200 may be useful, for example, to forensic investigations.
- an appearance property of a component may be analyzed.
- the component may be, for example, an automobile body piece at the scene of a hit and run accident, a scrap of clothing left at the scene of a crime, or other component that is the subject of a forensic investigation.
- the appearance property of the component may be compared to similar properties of components of known origins.
- the component may be identified based on a match between the measured appearance property and the known appearance properties. For example, an automobile body piece may be tied to a particular make, model, production run, etc.
- digital numerical analysis may be employed to summarize and/or transform multiangle spectral data into a two or three dimensional spectral representation.
- DNA processing may be advantageously used to generate a weighted vector sum based on values for the various measurement directions, with the weights being determined and implemented based on reflectance factors for each direction.
- the result of this sum is a spectrum of points in 2D or 3D space, one point for each measured wavelength, which represent "fingerprint" values for the surface-of-interest.
- the weighted vector sum is also generally scaled by the length of the vector sum of an ideal white Lambertian reflector for enhance comparability of the fingerprint values for the surface-of-interest relative to typical reflectance values.
- the coordinate system for DNA consists of the specular direction (z axis), the projection of the illumination direction orthogonal to the specular direction (y axis), and the cross product of these two directions (x axis).
- a measurement direction is described with reference to the angle it makes with the specular direction and by its angle of rotation about the specular axis from the positive y axis.
- the (x,y,z) coordinates of the measurement direction ⁇ as ⁇ az ⁇ are then (sin( ⁇ )*sin( ⁇ ),sin( ⁇ )*cos( ⁇ ),cos( ⁇ )).
- exemplary measurement directions are 45as-15az0, 45as15az0, 45as25az-90, 45as25az0, 45as25az90, 45as45az0, 45as60az-54.7,45as60az54.7, 45as75az0, and, 45as110az0.
- the (x,y,z) coordinates and reflectance factors for these directions are (0, -0.26, 0.97), (0, 0.26, 0.97), (-0.42, 0.00, 0.91), (0, 0.42, 0.91), (0.42, 0.00, 0.91), (0, 0.71, 0.71), (-0.71, 0.50, 0.50), (0.71, 0.50, 0.50), (0, 0.97, 0.26), and (0, 0.94, -0.34), respectively.
- Table 2 shows spectra and corresponding DNA coordinates for a hypothetical measured sample.
- the exemplary embodiment of Table 1 includes measurements at sixteen (16) wavelengths.
- FIG. 23 A plot of the (y, z) projection based on the DNA coordinates for this hypothetical measured sample, i.e., a fingerprint for such measured sample is set forth in Figure 23 .
- any sample/substrate that exhibits the same (or substantially the same) plot will appear identical regardless of lighting, viewing angle, or other environmental conditions.
- the disclosed technique and associated systems facilitate matching of color/appearance based on appearance properties, as described herein.
- the DNA spectrum disclosed herein incorporates two distinct principles for purposes of measuring, matching or otherwise using/accessing color properties.
- the disclosed DNA spectrum represents the color appearance of the measured surface at a given wavelength.
- the unique shape of the DNA spectrum represents the optical properties of the measured surface.
- the shape of the DNA spectra can be used to represent, assess and/or determine formulation characteristics.
- two samples having DNA spectra of the same shape, but a different position and orientation in space, will have a different color appearance. The difference in position and orientation of their DNA spectra represent process differences.
- the disclosed DNA methodology is applicable to any multiangle geometry.
- the geometry required for measuring a particular class of materials generally depends on the physical properties of the samples to be measured. For example, diffuse materials can be accurately characterized with a single angle measurement. Typically, three positive aspecular angles may be sufficient to characterize coatings with metallic pigments. Adequate measurements of coatings with pearlescent and special effect pigments generally require additional angles beyond the traditional multiangle directions.
- These goals/uses/purposes include: (i) distinguishing process differences from formulation differences, (ii) monitoring process stability, and (iii) guiding process changes to compensate for normal variation(s) in coating formulation.
- the separation between process and formulation is not entirely sharp.
- additives such as fumed silica may be used to control metallic flake orientation in a coating. Since the index of refraction of fumed silica matches the index of refraction of common solvents, fumed silica is generally invisible except in its effect on flake orientation. Inasmuch as process variables (e.g., flow rate and atomization) also affect flake orientation, the use of fumed silica is generally not distinguishable from process changes and/or variations.
- exemplary implementations of the present disclosure employ linear operations of translation, rotation and scaling.
- translation of a DNA spectrum is based on the average 3D position over all wavelengths.
- the magnitude of translation may be denoted by xT, and the individual components are therefore denoted xTx, xTy, and xTz.
- the translation of a DNA spectrum to be centered at the origin is denoted DNAt.
- the rotation process generally includes three (3) rotations, performed in the following order:
- An alignment angle and scale factor are generally computed together using a least squares fit to minimize the distance between a sample DNA spectrum and a standard DNA spectrum.
- the alignment angle is denoted xA
- the scale factor is denoted xS.
- the alignment angle and the scale factor are computed together, they are generally applied separately.
- Rotation of the spectrum DNAr in the yz plane by the alignment angle is denoted DNAa
- the result of scaling the spectrum DNAa is denoted DNAs.
- the DNA of a surface results from both the underlying material, characterized by DNAs, and its interaction with its environment, represented by application process conditions.
- the transformed spectra and the transformation parameters should be considered.
- colorimetric values in use with multiangle measurements include Lab values per angle and Flop Index.
- Flop Index is a measure of relative lightness change between near specular and near retro angles.
- the parameters xT, xA, and xS are related to the difference in reflectance at various angles, but they provide different views as compared to a Flop Index.
- a Flop Index of a coating containing metallic flakes can be reduced by coating application under dryer conditions and/or by using finer flakes in the coating. Such changes would more likely be detected by monitoring xT, xA, and xS, as compared to monitoring only the Flop Index.
- Flop Index remains a potentially useful tool.
- multiangle measurements are useful with materials whose multiangle reflectances have multiple dimensions. No single number/parameter can capture all information of interest in such situations.
- useful colorimetric data can be advantageously derived from 3D DNA spectra.
- possible approaches to generalizing color difference formulae to higher dimensional spectra include:
- the measure dF which is calculated as the square root of the sum of the squared distances between corresponding points on the two DNA spectra, is employed.
- the measure dF thus represents the ordinary Euclidean distance between spectra.
- a logarithmic scale is frequently used instead of a linear scale in reflectance measurements.
- This function is similar to the non-linear function applied to XYZ values in the CIELAB formula.
- dFt, dFr, dFa, dFs, dGt, dGr, dGa, and dGs may be used to denote the result of applying dF or dG to transformed DNA spectra, and plain dF and dG for the result of application to untransformed DNA spectra.
- ⁇ dDNA dDNAt - dDNAa
- ⁇ dGvs dG - dGs ('v' is used for untransformed spectra).
- the DNA vector sum is generally a sum of the detector direction vectors, scaled by the reflectance in each direction, as well as an additional weight factor in each direction.
- the optional weight can be used to restrict the vector sum to certain directions, to emphasize particular directions, and/or to correspond to the energy present in each direction.
- the specular direction may be excluded from the DNA vector sum (or have an extraordinary scale factor) because the specular channel tends to measure with an extremely high reflectance, but with little color information.
- direction measurements and vector sums are generated with a single illuminator, but multiple illuminators may be employed as well. If data from different illuminators is combined in a single 3D DNA sum, the out-of-plane axes will be aligned.
- Surface normal vectors and/or specular vectors from the different illuminators' vectors may also be aligned when combining data from different illuminators.
- data from different illuminators may be combined in a higher dimensional plot because, inter alia, some colors, particularly those with strong interference pigments, have multiangle data that is effectively more than three dimensional, so that a 3D DNA sum would potentially lose valuable information.
- the detector directions are all in-plane, the DNA sum will lie in a two-dimensional space.
- R is the 31 ⁇ m matrix of measured reflectance values (for 31 wavelength measurements)
- R ⁇ , ⁇ is the reflectance at wavelength ⁇ and measurement direction ⁇
- ⁇ x , ⁇ z and ⁇ z are the components of the measurement direction, where the z , y , and x components are the specular direction, the in-plane projection of the illuminator direction orthogonal to specular, and the out-of-plane direction, respectively
- W ⁇ is the additional weight in direction ⁇ .
- the alignment of DNA curves is generally performed in two steps. First, the rotation angles are computed to align the best fit plane to the DNA curve with the yz -plane. These angles are the azimuth and colatitude. The second step is to simultaneously compute a rotation angle within the yz plane and a scale factor using least squares.
- M DNAt + 10 0,0 .
- M DNAt + 10 0,0 .
- Azimuth arctan 2 n y n x
- Colatitude arctan 2 n z n x 2 + n Y 2
- DNAr The result of rotating DNAt by the azimuth and colatitude
- EMT is the relative power in the xy components of the DNA curve. Graphically, this may be presented directly, or weighted by the inverse wavelength squared to mimic a dispersion curve. If EMT refers to the weighted version, the unweighted version may be denoted by EMTn.
- CIELAB, DE and DE94 values may be computed on each plane of the DNA curve, and then the planes may be combined to arrive at single L, a, b, and/or DE values based on the DNA curve.
- the single DE values may be denoted dDNA and such values may be computed on raw or transformed DNA curves.
- Delta dDNA values may also be computed based on the difference of different transformed dDNA values.
- the first step in computing CIELAB data is generally to compute XYZ values based on a specified illuminant and a specified observer. In the case of 31 point data, this computation involves multiplication of a 3 x 31 weight matrix by a 31 x 1 vector to produce a 3 x 1 vector.
- dDNA L x ⁇ L x ′ 2 + a x ⁇ a x ′ 2 + b x ⁇ b x ′ + L y ⁇ L y ′ 2 + ... + a z ⁇ a z ′ 2 + b z ⁇ b z ′ 2
- the DNA curve utilized in the above-noted computations may be the raw DNA curve, or one of the transformed curves DNAt, DNAr, DNAa, or DNAs. It is noted that dDNAt, dDNAr, dDNAa, and dDNAs are generally used for the results of computing dDNA on transformed curves.
- DF ⁇ ⁇ DNA ⁇ , x ⁇ DNA ⁇ , x ′ 2 + DNA ⁇ , y ⁇ DNA ⁇ , y ′ 2 + DNA ⁇ , z ⁇ DNA ⁇ , z ′ 2
- the noted values may also be computed on raw and transformed DNA curves, giving DFt, DFr, DFa, and DFs.
- the traditional DE, DE94 and DEp/DIN6175-2 formulae may be applied to each angle individually. It is noted that the aspecular angle is required for DIN 6175-2, and the absolute value of the designated aspecular angle (i.e., 15 for the -15 direction) may be used.
- the Flop Index is typically computed in a traditional manner using 15°, 45°, and 110° L values.
- the per-angle (a*, b*) value pairs may be plotted for the 45° illuminator directions, and for the 15° illuminator, ⁇ 15° aspecular directions.
- the value pairs are connected in a 'T' shape, showing the aspecular line and a rough approximation of the interference line.
- An automobile manufacturer and a paint supplier desire to coordinate and collaborate in the development, selection and implementation of one or more paint formulations.
- the paint supplier formulates a palette of colors and effects for review by the automobile manufacturer.
- the color palette is developed using color formulation software provided by X-Rite, Inc., the assignee of the present application, and the manufacturer and supplier exchange physical samples and electronic data to facilitate the collaborative effort.
- Electronic data is advantageously facilitated with visual appearance management software/solutions, e.g., monitor optimizers and/or auto software.
- the supplier develops production recipes and processes using robotic spray booths. A series of panels are then sprayed to create a design of experiment (DOE) around formulation and process variations in order to establish baseline tolerances for full appearance. DNA prints are created for each panel and the expression values computed for each variant relative to the sample selected by the manufacturer. Recipe variants are tested based on variations of pigment grind, e.g., based on grind samples at 50% of the original, 75% of the original, and over grind.
- DOE design of experiment
- the formulation may then be released by the supplier for production and a final run of panels, e.g., 1000 panels,
- the panels are graded and sorted to create the QA masters for use at various manufacturing and supply-related locations, and for in-house supplier use.
- DNA prints are automatically computed for each plate and sorted by process around the desired DNA centroid. A virtual standard centroid and tolerances for each print group are also created for distribution with the master plates.
- the DNA prints represent all possible viewing conditions, i.e., total appearance, thereby ensuring accuracy.
- Colorimetric values and DNA's are created from the collected measurements and used to compare to the samples provided to the manufacturer.
- the process of transferring to others involved in the manufacturing process may commence.
- the automobile manufacturer may receive the DNA files from the supplier and import them into a software system.
- the DNA database immediately provides a master fingerprint along with a 3D set of tolerances that would help guide the manufacturer and its QC team to implement production.
- DNA tolerances according to the present disclosure are used to monitor production. Standards and tolerances are established for production line(s) and, using a portable color measuring apparatus according to the present disclosure, manufacturing personnel are able to track the DNA process, formulation, and recipe expression tolerances, as well as the change in those tolerances (dF, dFb, dFg, dFr). Colorimetric measurement may only be necessary when the process drift indicator signals an out-of-tolerance condition. Because manufacturing personnel can directly relate the process tolerances to the nominal condition, process parameters may be adjusted based on the new tolerance statistics directly.
- the systems, apparatus and method of the present disclosure facilitate prompt and efficient troubleshooting and corrective action. For example, by comparing the measurement results to the process standard, manufacturing personnel may determine that a low atomization/low flow condition exists. In response, an adjustment to the flow and atomization settings may be made and confirmatory measurements taken. A series of iterations may be necessary to achieve an appropriate settings.
- each paint system has a unique "DNA" represented by the points plotted in 3D space and that pattern is dependent on the recipe for the paint and the process settings used, corrective action is facilitated according to the present disclosure.
- exemplary instruments of the present disclosure can overlay and scale the measurements for analysis and corrective action. For example, it may become apparent -- after scaling -- that it was the same paint coating, and that therefore the production line issue must have been caused by a process change.
- measurements indicate something has changed with respect to the body paint. Although the color looks correct, the measurements indicate the line is now running at the limit of the allowable tolerances. The issue is not yet visually perceivable but, if the process is allowed to continue to drift, the color issue will become visually apparent. Manufacturing personnel are confronted with a need to diagnose the problem, e.g., to determine if the issue may have been caused by the paint spray equipment, a new batch of paint, or some other issue. In troubleshooting the issue, measurements are taken of multiple body part locations, e.g., the fenders and the hood.
- the manufacturing personnel advantageously view the DNA shapes and check the xA plots and xS plots.
- the xS plots look identical to the master standard, so they are confident the paint formulation has not changed.
- the xA may be a different size relative to the Master Panel data.
- the manufacturing personnel may decide to compare the dF's for the hood and door panels to the Master sample data. If they look different, the Delta dF's may be plotted, which might show that the hood is in fact different as compared to the door, even though they are sprayed at the same time.
- This phenomenon may suggest that the particle size has changed, e.g., due to larger/heavier flakes falling out of the droplet cloud and not making it to the vertical sides of the automobile body.
- the Delta dF's for the hood and door panel would have been similar.
- a panel study on the pigment may be helpful in diagnosing the problem, e.g., to determine if the process may have been impacted by changes in humidity and temperature.
- a panel study generally involves grinding the current lot of pigment to various levels from under grind to over grind. The panels can then be compared, inter alia, to the original master panel study. For example, the over ground results of the panel study may match up with the master panel study, suggesting that humidity is the issue. Corrective action may involve a shortening of the grinding cycle for the next lot of material.
- a bumper manufacturer (OEM) for an automobile manufacturer receives the master panels and associated DNA database for a new bumper from the manufacturer.
- a sample lot is provided for the OEM's use in manufacturing the bumpers.
- a process study is completed to understand the paint formulation. Based on the measurement results, the OEM determines that a reasonable match can be achieved, but by comparing the DNA prints, the dF's, and the dDNA's, it is apparent that the current formulation and the new formulation are different, requiring the OEM to hold tighter process tolerances to allow for lot to lot variations in paint, while not resulting in a difference in appearance under certain lighting conditions.
- the OEM uses the xA values to establish a virtual process centroid for the formulation.
- the OEM is able to compare first master panel values to those from the process study and immediately identify the closest samples.
- the disclosed software/system estimates the "ideal" xA values for the DNA that would provide the best match to the master and the largest tolerances.
- the OEM may use the differences in process settings and their associated xA values to estimate the ideal process settings.
- baseline process settings the OEM can prepare sprayed samples for measurement. Based on the reasonably close match in DNA and, after colorimetric confirmation checks, the OEM is able to move forward with OEM manufacture of the new bumper.
- a "computer” or “computer system” may be, for example and without limitation, either alone or in combination, a personal computer (PC), server-based computer, main frame, server, microcomputer, minicomputer, laptop, personal data assistant (PDA), cellular phone, pager, processor, including wireless and/or wireline varieties thereof, and/or any other computerized device capable of configuration for processing data for standalone application and/or over a networked medium or media.
- Computers and computer systems disclosed herein may include operatively associated memory for storing certain software applications used in obtaining, processing, storing and/or communicating data. It can be appreciated that such memory can be internal, external, remote or local with respect to its operatively associated computer or computer system.
- Memory may also include any means for storing software or other instructions including, for example and without limitation, a hard disk, an optical disk, floppy disk, ROM (read only memory), RAM (random access memory), PROM (programmable ROM), EEPROM (extended erasable PROM), and/or other like computer-readable media.
- ROM read only memory
- RAM random access memory
- PROM programmable ROM
- EEPROM extended erasable PROM
- the various modules 916, 918 of the system 901 may be implemented as software code to be executed by a processor(s) of the system 901 or any other computer system using any type of suitable computer instruction type.
- the software code may be stored as a series of instructions or commands on a computer readable medium.
- computer-readable medium as used herein may include, for example, magnetic and optical memory devices such as diskettes, compact discs of both read-only and writeable varieties, optical disk drives, and hard disk drives.
- a computer-readable medium may also include memory storage that can be physical, virtual, permanent, temporary, semi-permanent and/or semi-temporary.
- a computer-readable medium may further include one or more data signals transmitted on one or more carrier waves.
Landscapes
- Physics & Mathematics (AREA)
- Health & Medical Sciences (AREA)
- Life Sciences & Earth Sciences (AREA)
- Chemical & Material Sciences (AREA)
- Analytical Chemistry (AREA)
- Biochemistry (AREA)
- General Health & Medical Sciences (AREA)
- General Physics & Mathematics (AREA)
- Immunology (AREA)
- Pathology (AREA)
- Mathematical Physics (AREA)
- Investigating Or Analysing Materials By Optical Means (AREA)
Claims (17)
- Vorrichtung zum Messen von Spektraldaten für eine Oberfläche, die Folgendes umfasst:eine erste Lichtquelle, die derart ausgerichtet ist, dass sie die Oberfläche aus einer ersten Beleuchtungsrichtung (304) in mehreren Wellenlängen beleuchtet;mehrere Sensoren, die derart positioniert sind, dass sie Licht aufnehmen, das durch die Oberfläche in mehreren Reflexionswinkeln reflektiert wird, wobei die mehreren Sensoren Folgendes umfassen:einen ersten Sensor, der derart positioniert ist, dass er Licht bei den mehreren Wellenlängen, die durch die Oberfläche in einer ersten Relexionsrichtung (306) reflektiert werden, aufnimmt;einen zweiten Sensor, der derart positioniert ist, dass er Licht bei den mehreren Wellenlängen, die durch die Oberfläche in einer zweiten Relexionsrichtung (308) reflektiert werden, aufnimmt; undeinen dritten Sensor, der derart positioniert ist, dass er Licht bei den mehreren Wellenlängen, die durch die Oberfläche in einer dritten Reflexionsrichtung (310) reflektiert werden, aufnimmt, wobei die erste, die zweite und die dritte Richtung nicht koplanar sind, wobeidie mehreren Sensoren konfiguriert sind, reflektiertes Licht bei den mehreren Wellenlängen in mehreren Reflexionsrichtungen (306, 308, 310) zu messen, wobei die mehreren Reflexionsrichtungen (306, 308, 310) mindestens die ersten Relexionsrichtung (308), die zweite Reflexionsrichtung (308) und die dritte Reflexionsrichtung (310) enthalten;die Vorrichtung einen Computer in Kommunikation mit den mehreren Sensoren umfasst, wobei der Computer programmiert ist, Spektralmessungen von den mehreren Sensoren bei mehreren Wellenlängen in ein erstes Aussehensmerkmal für die Oberfläche umzuwandeln,der Computer konfiguriert ist, eine digitale numerische Analyse einzusetzen, um die gemessenen Mehrfachwinkelspektraldaten in eine dreidimensionale Spektraldarstellung umzuwandeln, wobei die Mehrfachwinkelspektraldaten die Reflexionsgradwerte des reflektierten Lichts bei den mehreren Wellenlängen, die durch die mehreren Sensoren in den mehreren Reflexionsrichtungen, die die erste bis dritte Reflexionsrichtung enthalten, empfangen wurden, repräsentiert, unddie digitale numerische Analyse Folgendes umfasst:Erzeugen für jede Wellenlänge der mehreren Wellenlängen einer gewichteten Vektorsumme von Vektoren, wobei die Vektoren die mehreren Reflexionsrichtungen (306, 308, 310), die die erste bis dritte Reflexionsrichtung (306, 308, 310) enthalten, repräsentieren, mit Gewichten, die auf den mehreren gemessenen Reflexionsgradwerten bei jeder der mehreren Reflexionsrichtungen basieren, wobei das Ergebnis der gewichteten Vektorsumme ein Spektrum von Punkten in einem dreidimensionalen Raum ist, ein Punkt für jede gemessene Wellenlänge vorliegt, und das Spektrum von Punkten dem ersten Aussehensmerkmal entspricht,dadurch gekennzeichnet, dass der Computer ferner konfiguriert ist zumSkalieren der gewichteten Vektorsumme mit der Länge der Vektorsumme eines idealen weißen Lambert-Reflektors,Umsetzen des Spektrums von Punkten, um das Spektrum von Punkten um ein Zentrum eines Normspektrums von Punkten auf der Grundlage einer durchschnittlichen dreidimensionalen Position über alle gemessenen Wellenlägen zu zentrieren,Drehen des umgesetzten Spektrums von Punkten derart, dass eine am besten zum Spektrum von Punkten passende Ebene auf eine Ebene gedreht wird, die durch eine Spiegelrichtung und eine Projektion der ersten Beleuchtungsrichtung senkrecht zur Spiegelrichtung definiert ist, undAusrichten und Skalieren des gedrehten Spektrums von Punkten in der Ebene, um den Abstand zwischen dem gedrehten Spektrum von Punkten und dem Normspektrum von Punkten zu minimieren.
- Vorrichtung nach Anspruch 1, wobei der erste Sensor, der zweite Sensor und/oder der dritte Sensor eine Fotodiode und mindestens ein spektrales Bandpassfilter, das zwischen reflektiertem Licht und der Fotodiode positioniert ist, umfassen.
- Vorrichtung nach Anspruch 1, wobei der erste Sensor, der zweite Sensor und/oder der dritte Sensor ein Aufnahmeelement und eine Pupille, die ausgerichtet ist, um das Licht aufzunehmen, das in die entsprechende Reflexionsrichtung reflektiert wird, umfassen, wobei die Pupille zwischen der Oberfläche und dem aufnehmenden Element positioniert ist.
- Vorrichtung nach einem der Ansprüche 1 bis 3, wobei die mehreren Sensoren Sensoren enthalten, die bei nicht spiegelbildlichen Winkeln von 15, 25, 45, 75 und 110 Grad positioniert sind.
- Vorrichtung nach einem der Ansprüche 1 bis 4, wobei die erste Lichtquelle eine weiße Leuchtdiode (LED) umfasst.
- Vorrichtung nach einem der Ansprüche 1 bis 5, wobei die erste Lichtquelle mehrere LED umfasst, die verschiedene spektrale Ausgaben aufweisen.
- Vorrichtung nach Anspruch 6, wobei die mehreren LED neun LED umfassen und jede der neun LED eine unterschiedliche spektrale Ausgabe aufweisen.
- Vorrichtung nach einem der Ansprüche 1 bis 7, wobei das erste Aussehensmerkmal auf Spektralmessungen bei einunddreißig Wellenlängen basiert.
- Vorrichtung nach einem der Ansprüche 1 bis 8, die ferner eine Datenbank umfasst, in der mehrere erste Aussehensmerkmale gespeichert sind, die mehreren Oberflächen entsprechen, wobei der Computer in Kommunikation mit der Datenbank ist.
- Verfahren zum Messen von Spektraldaten für eine Oberfläche, das Folgendes umfasst:Beleuchten der Oberflächen mit einer ersten Lichtquelle, die auf die Oberfläche aus einer ersten Beleuchtungsrichtung (304) mit mehreren Wellenlängen einfällt;Messen (104) von reflektiertem Licht bei den mehreren Wellenlängen in mehreren Reflexionsrichtungen (306, 308, 310), wobei die mehreren Reflexionsrichtungen (306, 308, 310) mindestens die ersten Relexionsrichtung (308), die zweite Reflexionsrichtung (308) und die dritte Reflexionsrichtung (310) enthalten; wobei die erste, die zweite und die dritte Richtung (306, 308, 310) nicht koplanar sind;Bestimmen (106) eines ersten Aussehensmerkmals für die Oberfläche auf der Grundlage der Messungen des reflektierten Lichts in der ersten, der zweiten und/oder der dritten Reflexionsrichtung (306, 308, 310) undSteuern mindestens eines farbbezogenen Vorgangs, der der Oberfläche zugeordnet ist, mindestens teilweise auf der Grundlage des ersten Aussehensmerkmals, wobeidas Verfahren Folgendes umfasst:Einsetzen einer digitalen numerischen Analyse, um die gemessenen Mehrfachwinkelspektraldaten in eine dreidimensionale Spektraldarstellung umzuwandeln, wobei die Mehrfachwinkelspektraldaten die Reflexionsgradwerte des reflektierten Lichts bei den mehreren Wellenlängen, die durch die mehreren Sensoren in den mehreren Reflexionsrichtungen, die die erste bis dritte Reflexionsrichtung enthalten, empfangen wurden, repräsentiert, wobeidie digitale numerische Analyse Folgendes umfasst:Erzeugen für jede Wellenlänge der mehreren Wellenlängen einer gewichteten Vektorsumme von Vektoren, wobei die Vektoren die mehreren Reflexionsrichtungen, die die erste bis dritte Reflexionsrichtung (306, 308, 310) enthalten, repräsentieren, mit Gewichten, die auf den mehreren gemessenen Reflexionsgradwerten bei jeder der mehreren Reflexionsrichtungen basieren, wobei das Ergebnis der gewichteten Vektorsumme ein Spektrum von Punkten in einem dreidimensionalen Raum ist, ein Punkt für jede gemessene Wellenlänge vorliegt und das Spektrum von Punkten dem ersten Aussehensmerkmal entspricht,dadurch gekennzeichnet, dass das Verfahren ferner Folgendes umfasst:Skalieren der gewichteten Vektorsumme mit der Länge der Vektorsumme eines idealen weißen Lambert-Reflektors,Umsetzen des Spektrums von Punkten, um das Spektrum von Punkten um ein Zentrum eines Normspektrums von Punkten auf der Grundlage einer durchschnittlichen dreidimensionalen Position über alle gemessenen Wellenlägen zu zentrieren,Drehen des umgesetzten Spektrums von Punkten derart, dass eine am besten zum Spektrum von Punkten passende Ebene auf eine Ebene gedreht wird, die durch eine Spiegelrichtung und eine Projektion der ersten Beleuchtungsrichtung senkrecht zur Spiegelrichtung definiert ist, undAusrichten und Skalieren des gedrehten Spektrums von Punkten in der Ebene, um den Abstand zwischen dem gedrehten Spektrum von Punkten und dem Normspektrum von Punkten zu minimieren.
- Verfahren nach Anspruch 10, wobei die mehreren Reflexionsrichtungen (306, 308, 310) durch Folgendes berechnet werden:

L gleich der Anzahl von Schichten, die auf der Oberfläche vorliegen, ist und m gleich der Anzahl verschiedener Materialien, die in der Oberfläche enthalten sind, ist. - Verfahren nach Anspruch 10, wobei die mehreren Reflexionsrichtungen (306, 308, 310) durch Folgendes berechnet werden:

L gleich der Anzahl von Schichten, die auf der Oberfläche vorliegen, ist und m gleich der Anzahl verschiedener Materialien, die in der Oberfläche enthalten sind, ist. - Verfahren nach einem der Ansprüche 10 bis 12, das ferner ein Vergleichen des ersten Aussehensmerkmals für die Oberflächen mit einem Aussehensmerkmal eines bekannten Objekts umfasst.
- Verfahren nach Anspruch 13, wobei das Steuern des mindestens einen farbbezogenen Vorgangs, der der Oberfläche zugeordnet ist, mindestens teilweise auf dem Vergleich basiert.
- Verfahren nach Anspruch 13 oder 14, das ferner ein Bestimmen der Authentizität der Oberfläche mindestens teilweise auf der Grundlage des Vergleichs und/oder ein Identifizieren einer Quelle der Oberfläche mindestens teilweise auf der Grundlage des Vergleichs umfasst.
- Verfahren nach Anspruch 10, das ferner ein Belegen einer Datenbank mit ersten Aussehensmerkmalen für mehrere Oberflächen umfasst.
- Verfahren nach Anspruch 16, das ferner ein Zugreifen auf die Datenbank umfasst, um Vergleiche von Aussehensmerkmalen für eine oder mehrere Oberflächen zu ermöglichen.
Priority Applications (1)
| Application Number | Priority Date | Filing Date | Title |
|---|---|---|---|
| EP12171005A EP2505958A1 (de) | 2007-06-04 | 2008-06-03 | Messung einer Erscheinungseigenschaft einer Fläche mit einer bidirektionalen Reflexionsgradverteilungsfunktion |
Applications Claiming Priority (1)
| Application Number | Priority Date | Filing Date | Title |
|---|---|---|---|
| US11/810,012 US7944561B2 (en) | 2005-04-25 | 2007-06-04 | Measuring an appearance property of a surface using a bidirectional reflectance distribution function |
Related Child Applications (2)
| Application Number | Title | Priority Date | Filing Date |
|---|---|---|---|
| EP12171005A Division-Into EP2505958A1 (de) | 2007-06-04 | 2008-06-03 | Messung einer Erscheinungseigenschaft einer Fläche mit einer bidirektionalen Reflexionsgradverteilungsfunktion |
| EP12171005A Division EP2505958A1 (de) | 2007-06-04 | 2008-06-03 | Messung einer Erscheinungseigenschaft einer Fläche mit einer bidirektionalen Reflexionsgradverteilungsfunktion |
Publications (3)
| Publication Number | Publication Date |
|---|---|
| EP2000794A2 EP2000794A2 (de) | 2008-12-10 |
| EP2000794A3 EP2000794A3 (de) | 2010-04-21 |
| EP2000794B1 true EP2000794B1 (de) | 2019-09-11 |
Family
ID=39864688
Family Applications (2)
| Application Number | Title | Priority Date | Filing Date |
|---|---|---|---|
| EP08157476.6A Active EP2000794B1 (de) | 2007-06-04 | 2008-06-03 | Vorrichtung und Verfahren zum Bestimmen einer spektral aufgelösten bi-direktionalen Erscheinungseigenschaft einer Oberfläche |
| EP12171005A Withdrawn EP2505958A1 (de) | 2007-06-04 | 2008-06-03 | Messung einer Erscheinungseigenschaft einer Fläche mit einer bidirektionalen Reflexionsgradverteilungsfunktion |
Family Applications After (1)
| Application Number | Title | Priority Date | Filing Date |
|---|---|---|---|
| EP12171005A Withdrawn EP2505958A1 (de) | 2007-06-04 | 2008-06-03 | Messung einer Erscheinungseigenschaft einer Fläche mit einer bidirektionalen Reflexionsgradverteilungsfunktion |
Country Status (2)
| Country | Link |
|---|---|
| US (1) | US7944561B2 (de) |
| EP (2) | EP2000794B1 (de) |
Families Citing this family (32)
| Publication number | Priority date | Publication date | Assignee | Title |
|---|---|---|---|---|
| US20030204410A1 (en) * | 2002-04-26 | 2003-10-30 | Clariant International, Ltd. | Method and apparatus for approving color samples |
| EP1376484A1 (de) * | 2002-06-25 | 2004-01-02 | Mars Incorporated | Verfahren und Vorrichtung zur Signalverarbeitung in der Geldprüfung |
| US8345252B2 (en) * | 2005-04-25 | 2013-01-01 | X-Rite, Inc. | Method and system for enhanced formulation and visualization rendering |
| US8139220B2 (en) | 2008-09-16 | 2012-03-20 | X-Rite, Inc. | Point-of purchase (POP) spectrophotometer for open-view measurement of a color sample |
| WO2011070927A1 (ja) * | 2009-12-11 | 2011-06-16 | 株式会社トプコン | 点群データ処理装置、点群データ処理方法、および点群データ処理プログラム |
| CN102117488B (zh) * | 2011-02-21 | 2014-06-25 | 北京航空航天大学 | 一种虚拟环境中构造真实物体表面反射特性的方法 |
| DE102011108599A1 (de) * | 2011-07-27 | 2013-01-31 | Byk-Gardner Gmbh | Vorrichtung und Verfahren zur Untersuchung von Beschichtungen mit Effektpigmenten |
| EP2914942B1 (de) | 2012-11-02 | 2023-06-14 | Variable Inc. | Computerimplementiertes system und verfahren für farberfassung, -speicherung und -vergleich |
| US10147043B2 (en) | 2013-03-15 | 2018-12-04 | Ppg Industries Ohio, Inc. | Systems and methods for texture assessment of a coating formulation |
| US10586162B2 (en) | 2013-03-15 | 2020-03-10 | Ppg Industries Ohio, Inc. | Systems and methods for determining a coating formulation |
| US9204115B1 (en) | 2013-08-27 | 2015-12-01 | George Yu | Color sensing system, method and device having defined optical channels |
| US9674323B1 (en) | 2013-08-29 | 2017-06-06 | Variable, Inc. | Modular multi-functional device, method, and system |
| NZ631068A (en) | 2013-11-08 | 2015-10-30 | Ppg Ind Ohio Inc | Texture analysis of a coated surface using electrostatics calculations |
| NZ631063A (en) | 2013-11-08 | 2015-10-30 | Ppg Ind Ohio Inc | Texture analysis of a coated surface using cross-normalization |
| NZ631047A (en) | 2013-11-08 | 2015-10-30 | Ppg Ind Ohio Inc | Texture analysis of a coated surface using kepler’s planetary motion laws |
| US9607403B2 (en) | 2014-10-28 | 2017-03-28 | Ppg Industries Ohio, Inc. | Pigment identification of complex coating mixtures with sparkle color |
| EP3289322B1 (de) | 2015-05-01 | 2026-01-14 | Variable Inc. | Intelligentes ausrichtungssystem und verfahren für farbmessvorrichtungen |
| US9818205B2 (en) | 2016-02-19 | 2017-11-14 | Ppg Industries Ohio, Inc. | Simplified texture comparison engine |
| US10613727B2 (en) | 2016-02-19 | 2020-04-07 | Ppg Industries Ohio, Inc. | Color and texture match ratings for optimal match selection |
| US10600162B2 (en) | 2016-12-29 | 2020-03-24 | Konica Minolta Laboratory U.S.A., Inc. | Method and system to compensate for bidirectional reflectance distribution function (BRDF) |
| US11085761B2 (en) * | 2017-10-30 | 2021-08-10 | Hewlett-Packard Development Company, L.P. | Determining surface structures of objects |
| US11119035B2 (en) | 2018-04-26 | 2021-09-14 | Ppg Industries Ohio, Inc. | Systems and methods for rapid coating composition determinations |
| US11874220B2 (en) | 2018-04-26 | 2024-01-16 | Ppg Industries Ohio, Inc. | Formulation systems and methods employing target coating data results |
| US10970879B2 (en) | 2018-04-26 | 2021-04-06 | Ppg Industries Ohio, Inc. | Formulation systems and methods employing target coating data results |
| US10871888B2 (en) | 2018-04-26 | 2020-12-22 | Ppg Industries Ohio, Inc. | Systems, methods, and interfaces for rapid coating generation |
| US10746599B2 (en) | 2018-10-30 | 2020-08-18 | Variable, Inc. | System and method for spectral interpolation using multiple illumination sources |
| CN115066598A (zh) * | 2019-12-03 | 2022-09-16 | 艾迈斯传感器德国有限责任公司 | 颜色测量 |
| EP3937136A1 (de) | 2020-07-07 | 2022-01-12 | X-Rite Europe GmbH | Visualisierung des erscheinungsbildes von mindestens zwei materialien |
| EP3937137A1 (de) | 2020-07-07 | 2022-01-12 | X-Rite Europe GmbH | Visualisierung des erscheinungsbildes von mindestens zwei materialien |
| EP3937133A1 (de) | 2020-07-07 | 2022-01-12 | X-Rite Europe GmbH | Erzeugen einer zieltextur aus einer vielzahl von quellentexturen |
| CN113029977B (zh) * | 2021-03-11 | 2022-03-15 | 武汉大学 | 一种针对宽视场角多光谱传感器的自动交叉辐射定标方法 |
| USD1067145S1 (en) * | 2022-11-30 | 2025-03-18 | Volvo Car Corporation | Vehicle panel with pattern |
Family Cites Families (38)
| Publication number | Priority date | Publication date | Assignee | Title |
|---|---|---|---|---|
| US4479718A (en) * | 1982-06-17 | 1984-10-30 | E. I. Du Pont De Nemours And Company | Three direction measurements for characterization of a surface containing metallic particles |
| US4711580A (en) * | 1985-01-28 | 1987-12-08 | Hunter Associates Laboratory, Inc. | Modeling properties of flake finishes using directional resolution and statistical flake orientation distribution function |
| US4887906A (en) * | 1988-04-11 | 1989-12-19 | Clarence Koehler | Color match predictability system and method |
| US5241369A (en) * | 1990-10-01 | 1993-08-31 | Mcneil John R | Two-dimensional optical scatterometer apparatus and process |
| US5137364A (en) * | 1991-01-31 | 1992-08-11 | Mccarthy Cornelius J | Optical spectral analysis apparatus |
| US5231472A (en) * | 1991-09-16 | 1993-07-27 | Ppg Industries, Inc. | Color matching and characterization of surface coatings |
| US5313542A (en) * | 1992-11-30 | 1994-05-17 | Breault Research Organization, Inc. | Apparatus and method of rapidly measuring hemispherical scattered or radiated light |
| GB2293448B (en) * | 1994-09-20 | 1996-12-11 | Honda Motor Co Ltd | Method of determining color tone of glitter-containing coating |
| EP0732577B1 (de) * | 1995-03-13 | 2004-05-19 | Dainichiseika Color & Chemicals Mfg. Co. Ltd. | Verfahren zur Bestimmung des kolorimetrischen Wertes |
| IL113428A0 (en) * | 1995-04-20 | 1995-07-31 | Yissum Res Dev Co | Glossmeter |
| US6373573B1 (en) * | 2000-03-13 | 2002-04-16 | Lj Laboratories L.L.C. | Apparatus for measuring optical characteristics of a substrate and pigments applied thereto |
| JP4039470B2 (ja) * | 1997-05-09 | 2008-01-30 | 日清紡績株式会社 | メタリック・パール系塗料のコンピュータ調色における着色材と光輝材の配合比又は光輝材の配合量を求める方法 |
| JP3986117B2 (ja) * | 1997-05-22 | 2007-10-03 | 日本ペイント株式会社 | 自動車補修用塗料の調色装置 |
| KR100849370B1 (ko) * | 1998-12-21 | 2008-07-31 | 코닌클리케 필립스 일렉트로닉스 엔.브이. | 스캐터로미터 |
| JP2001050817A (ja) * | 1999-08-10 | 2001-02-23 | Minolta Co Ltd | マルチアングル測色計 |
| JP3626387B2 (ja) * | 2000-02-04 | 2005-03-09 | 関西ペイント株式会社 | コンピュータ調色装置及びこの装置を用いた塗料の調色方法 |
| US6888544B2 (en) * | 2000-03-17 | 2005-05-03 | Hewlett-Packard Development Company, L.P. | Apparatus for and method of rendering 3D objects with parametric texture maps |
| US6772151B1 (en) * | 2000-06-16 | 2004-08-03 | Polyone Corporation | Color matching system and method |
| US6765573B2 (en) * | 2000-10-26 | 2004-07-20 | Square Enix Co., Ltd. | Surface shading using stored texture map based on bidirectional reflectance distribution function |
| EP1217346A1 (de) | 2000-12-19 | 2002-06-26 | Akzo Nobel N.V. | Verfahren zum Selektieren der Zusammensetzung einer oder mehrerer Schichten eines mehrschichtigen Überzugs |
| DE10103163A1 (de) * | 2001-01-19 | 2002-08-01 | Steag Eta Optik Gmbh | Meßeinrichtung |
| JP4623842B2 (ja) * | 2001-02-28 | 2011-02-02 | 関西ペイント株式会社 | メタリック塗色の近似色を高速に検索する方法 |
| DE10118604B4 (de) * | 2001-04-12 | 2005-05-04 | Maschinenfabrik Wifag | Verfahren und Vorrichtung zur Beurteilung der Qualität einer Druckfarbe |
| DE10122917A1 (de) * | 2001-05-11 | 2002-11-14 | Byk Gardner Gmbh | Vorrichtung und Verfahren zur Bestimmung der Eigenschaften von reflektierenden Körpern |
| DE10143602B4 (de) | 2001-09-06 | 2007-08-23 | Display-Messtechnik & Systeme Gmbh & Co.Kg | Einrichtung zur meßtechnischen Bewertung von reflektierenden Objekten, insbesondere von reflektiven Anzeigen |
| JP2004189780A (ja) * | 2002-12-06 | 2004-07-08 | Kansai Paint Co Ltd | 光輝性塗料の調色方法 |
| JP4500498B2 (ja) * | 2003-02-25 | 2010-07-14 | 関西ペイント株式会社 | 変更色の生成及び表示方法及び装置 |
| US20040218182A1 (en) * | 2003-04-30 | 2004-11-04 | Alman David H. | Method for identifying effect pigments in a paint film for field color matching |
| DE10319543B4 (de) * | 2003-04-30 | 2011-03-03 | Byk-Gardner Gmbh | Vorrichtung und Verfahren zur Bestimmung von Oberflächeneigenschaften |
| JP2007505202A (ja) * | 2003-05-07 | 2007-03-08 | イー・アイ・デュポン・ドウ・ヌムール・アンド・カンパニー | 色合わせされた塗料の製造方法およびそれに使用される装置 |
| DE10324104B4 (de) * | 2003-05-27 | 2014-01-16 | Byk Gardner Gmbh | Vorrichtung und Verfahren zur Bestimmung von Oberflächeneigenschaften |
| US7064830B2 (en) * | 2003-06-12 | 2006-06-20 | Eastman Kodak Company | Dental color imaging system |
| FR2860869B1 (fr) | 2003-10-10 | 2007-04-20 | Optis | Dispositif portable de mesure de l'intensite lumineuse d'un objet et utilisation d'un tel dispositif |
| US7430316B2 (en) | 2004-01-29 | 2008-09-30 | Datacolor Holding Ag | Method for visually accurately predicting color matches on different materials |
| US7154505B2 (en) * | 2004-11-11 | 2006-12-26 | Stonecube Limited | Method of and apparatus for generating a representation of an object |
| WO2006116386A1 (en) * | 2005-04-25 | 2006-11-02 | X-Rite, Incorporated | Measuring an appearance property of a surface using a spatially under-sampled bidirectional reflectance distribution function |
| DE602007012287D1 (de) | 2006-11-20 | 2011-03-10 | Du Pont | Verfahren zur erzeugung bidirektionaler reflektanzverteilungsfunktionen gonioapparenter materialien mit begrenzten messdaten |
| EP2130014B1 (de) | 2007-03-29 | 2019-05-15 | Coatings Foreign IP Co. LLC | System für farbabgleich und digitale farbanzeige |
-
2007
- 2007-06-04 US US11/810,012 patent/US7944561B2/en active Active
-
2008
- 2008-06-03 EP EP08157476.6A patent/EP2000794B1/de active Active
- 2008-06-03 EP EP12171005A patent/EP2505958A1/de not_active Withdrawn
Non-Patent Citations (1)
| Title |
|---|
| None * |
Also Published As
| Publication number | Publication date |
|---|---|
| EP2000794A2 (de) | 2008-12-10 |
| EP2000794A3 (de) | 2010-04-21 |
| EP2505958A1 (de) | 2012-10-03 |
| US7944561B2 (en) | 2011-05-17 |
| US20070291993A1 (en) | 2007-12-20 |
Similar Documents
| Publication | Publication Date | Title |
|---|---|---|
| EP2000794B1 (de) | Vorrichtung und Verfahren zum Bestimmen einer spektral aufgelösten bi-direktionalen Erscheinungseigenschaft einer Oberfläche | |
| US8345252B2 (en) | Method and system for enhanced formulation and visualization rendering | |
| EP1880196B1 (de) | Messung einer aussehenseigenschaft einer oberfläche unter verwendung einer räumlich unterabgetasteten bidirektionalen reflexionsverteilungsfunktion | |
| US10178351B2 (en) | Multi-angular color, opacity, pigment characterization and texture analysis of a painted surface via visual and/or instrumental techniques | |
| EP2912437B1 (de) | Texturanalyse einer lackierten oberfläche mit spiegelnden winkeldaten | |
| AU2005284094B2 (en) | Method for matching paint | |
| Riviere et al. | Multispectral polarized BRDF: design of a highly resolved reflectometer and development of a data inversion method. | |
| US11988558B2 (en) | Method and device for identifying interference pigments in a coating | |
| Medina et al. | Classification of batch processes in automotive metallic coatings using principal component analysis similarity factors from reflectance spectra | |
| Ceolato et al. | Supercontiuum laser-based instrument to measure hyperspectral polarized BRDF | |
| Klein | Measuring Colors | |
| Perales et al. | Estimation of spectral bands of metallic coatings assessed by multi-angle spectrophotometers |
Legal Events
| Date | Code | Title | Description |
|---|---|---|---|
| PUAI | Public reference made under article 153(3) epc to a published international application that has entered the european phase |
Free format text: ORIGINAL CODE: 0009012 |
|
| AK | Designated contracting states |
Kind code of ref document: A2 Designated state(s): AT BE BG CH CY CZ DE DK EE ES FI FR GB GR HR HU IE IS IT LI LT LU LV MC MT NL NO PL PT RO SE SI SK TR |
|
| AX | Request for extension of the european patent |
Extension state: AL BA MK RS |
|
| PUAL | Search report despatched |
Free format text: ORIGINAL CODE: 0009013 |
|
| AK | Designated contracting states |
Kind code of ref document: A3 Designated state(s): AT BE BG CH CY CZ DE DK EE ES FI FR GB GR HR HU IE IS IT LI LT LU LV MC MT NL NO PL PT RO SE SI SK TR |
|
| AX | Request for extension of the european patent |
Extension state: AL BA MK RS |
|
| RIC1 | Information provided on ipc code assigned before grant |
Ipc: G01N 21/55 20060101AFI20081027BHEP Ipc: G01B 11/30 20060101ALI20100316BHEP Ipc: G01J 3/46 20060101ALI20100316BHEP |
|
| 17P | Request for examination filed |
Effective date: 20101021 |
|
| AKX | Designation fees paid |
Designated state(s): DE GB |
|
| 17Q | First examination report despatched |
Effective date: 20130131 |
|
| RAP1 | Party data changed (applicant data changed or rights of an application transferred) |
Owner name: X-RITE, INC. |
|
| STAA | Information on the status of an ep patent application or granted ep patent |
Free format text: STATUS: EXAMINATION IS IN PROGRESS |
|
| GRAP | Despatch of communication of intention to grant a patent |
Free format text: ORIGINAL CODE: EPIDOSNIGR1 |
|
| STAA | Information on the status of an ep patent application or granted ep patent |
Free format text: STATUS: GRANT OF PATENT IS INTENDED |
|
| RIC1 | Information provided on ipc code assigned before grant |
Ipc: G01N 21/55 20140101AFI20190314BHEP Ipc: G01N 21/47 20060101ALI20190314BHEP Ipc: G01J 3/46 20060101ALI20190314BHEP Ipc: G01N 21/84 20060101ALI20190314BHEP Ipc: G01B 11/30 20060101ALI20190314BHEP |
|
| INTG | Intention to grant announced |
Effective date: 20190409 |
|
| GRAS | Grant fee paid |
Free format text: ORIGINAL CODE: EPIDOSNIGR3 |
|
| GRAA | (expected) grant |
Free format text: ORIGINAL CODE: 0009210 |
|
| STAA | Information on the status of an ep patent application or granted ep patent |
Free format text: STATUS: THE PATENT HAS BEEN GRANTED |
|
| AK | Designated contracting states |
Kind code of ref document: B1 Designated state(s): DE GB |
|
| REG | Reference to a national code |
Ref country code: GB Ref legal event code: FG4D |
|
| REG | Reference to a national code |
Ref country code: DE Ref legal event code: R096 Ref document number: 602008061152 Country of ref document: DE |
|
| REG | Reference to a national code |
Ref country code: DE Ref legal event code: R097 Ref document number: 602008061152 Country of ref document: DE |
|
| PLBE | No opposition filed within time limit |
Free format text: ORIGINAL CODE: 0009261 |
|
| STAA | Information on the status of an ep patent application or granted ep patent |
Free format text: STATUS: NO OPPOSITION FILED WITHIN TIME LIMIT |
|
| 26N | No opposition filed |
Effective date: 20200615 |
|
| GBPC | Gb: european patent ceased through non-payment of renewal fee |
Effective date: 20200603 |
|
| PG25 | Lapsed in a contracting state [announced via postgrant information from national office to epo] |
Ref country code: GB Free format text: LAPSE BECAUSE OF NON-PAYMENT OF DUE FEES Effective date: 20200603 |
|
| PGFP | Annual fee paid to national office [announced via postgrant information from national office to epo] |
Ref country code: DE Payment date: 20250618 Year of fee payment: 18 |