EP1656552B1 - Evaluation de stabilite acceleree de dispersions et d'emulsions - Google Patents
Evaluation de stabilite acceleree de dispersions et d'emulsions Download PDFInfo
- Publication number
- EP1656552B1 EP1656552B1 EP04753441.7A EP04753441A EP1656552B1 EP 1656552 B1 EP1656552 B1 EP 1656552B1 EP 04753441 A EP04753441 A EP 04753441A EP 1656552 B1 EP1656552 B1 EP 1656552B1
- Authority
- EP
- European Patent Office
- Prior art keywords
- sample
- particles
- pdp
- stress
- particle
- Prior art date
- Legal status (The legal status is an assumption and is not a legal conclusion. Google has not performed a legal analysis and makes no representation as to the accuracy of the status listed.)
- Expired - Lifetime
Links
Images


Classifications
-
- G—PHYSICS
- G01—MEASURING; TESTING
- G01N—INVESTIGATING OR ANALYSING MATERIALS BY DETERMINING THEIR CHEMICAL OR PHYSICAL PROPERTIES
- G01N33/00—Investigating or analysing materials by specific methods not covered by groups G01N1/00 - G01N31/00
- G01N33/02—Food
- G01N33/03—Edible oils or edible fats
-
- G—PHYSICS
- G01—MEASURING; TESTING
- G01N—INVESTIGATING OR ANALYSING MATERIALS BY DETERMINING THEIR CHEMICAL OR PHYSICAL PROPERTIES
- G01N15/00—Investigating characteristics of particles; Investigating permeability, pore-volume or surface-area of porous materials
- G01N15/10—Investigating individual particles
- G01N15/14—Optical investigation techniques, e.g. flow cytometry
- G01N15/1456—Optical investigation techniques, e.g. flow cytometry without spatial resolution of the texture or inner structure of the particle, e.g. processing of pulse signals
-
- G—PHYSICS
- G01—MEASURING; TESTING
- G01N—INVESTIGATING OR ANALYSING MATERIALS BY DETERMINING THEIR CHEMICAL OR PHYSICAL PROPERTIES
- G01N21/00—Investigating or analysing materials by the use of optical means, i.e. using sub-millimetre waves, infrared, visible or ultraviolet light
- G01N21/17—Systems in which incident light is modified in accordance with the properties of the material investigated
- G01N21/47—Scattering, i.e. diffuse reflection
- G01N21/49—Scattering, i.e. diffuse reflection within a body or fluid
- G01N21/53—Scattering, i.e. diffuse reflection within a body or fluid within a flowing fluid, e.g. smoke
- G01N21/532—Scattering, i.e. diffuse reflection within a body or fluid within a flowing fluid, e.g. smoke with measurement of scattering and transmission
-
- G—PHYSICS
- G01—MEASURING; TESTING
- G01N—INVESTIGATING OR ANALYSING MATERIALS BY DETERMINING THEIR CHEMICAL OR PHYSICAL PROPERTIES
- G01N15/00—Investigating characteristics of particles; Investigating permeability, pore-volume or surface-area of porous materials
- G01N2015/0092—Monitoring flocculation or agglomeration
-
- G—PHYSICS
- G01—MEASURING; TESTING
- G01N—INVESTIGATING OR ANALYSING MATERIALS BY DETERMINING THEIR CHEMICAL OR PHYSICAL PROPERTIES
- G01N15/00—Investigating characteristics of particles; Investigating permeability, pore-volume or surface-area of porous materials
- G01N15/10—Investigating individual particles
- G01N15/14—Optical investigation techniques, e.g. flow cytometry
- G01N2015/1493—Particle size
-
- G—PHYSICS
- G01—MEASURING; TESTING
- G01N—INVESTIGATING OR ANALYSING MATERIALS BY DETERMINING THEIR CHEMICAL OR PHYSICAL PROPERTIES
- G01N2203/00—Investigating strength properties of solid materials by application of mechanical stress
- G01N2203/0014—Type of force applied
- G01N2203/0025—Shearing
-
- Y—GENERAL TAGGING OF NEW TECHNOLOGICAL DEVELOPMENTS; GENERAL TAGGING OF CROSS-SECTIONAL TECHNOLOGIES SPANNING OVER SEVERAL SECTIONS OF THE IPC; TECHNICAL SUBJECTS COVERED BY FORMER USPC CROSS-REFERENCE ART COLLECTIONS [XRACs] AND DIGESTS
- Y10—TECHNICAL SUBJECTS COVERED BY FORMER USPC
- Y10T—TECHNICAL SUBJECTS COVERED BY FORMER US CLASSIFICATION
- Y10T436/00—Chemistry: analytical and immunological testing
- Y10T436/25—Chemistry: analytical and immunological testing including sample preparation
- Y10T436/2525—Stabilizing or preserving
Definitions
- the present invention relates to systematic methods and apparatus for stressing dispersions and emulsions in order to accelerate the onset of particle agglomeration or droplet coalescence and thereby assess their stability and evaluate their quality and performance.
- particles there are many products and intermediate process materials in widespread commercial use that depend on fine particles dispersed or suspended in a liquid, frequently water, thus classified as 2-phase systems. These particles may be solid, as in the case of aqueous polymer suspensions. Alternatively, the "particles" may consist of droplets of a liquid normally immiscible in the suspending fluid - e.g. oil droplets, in the case of oil-in-water emulsions, or water droplets (usually containing water-soluble species), in the case of water-in-oil emulsions. As well, more complex dispersions exist as multi-phase systems, forming, for example, water-in-oil-in-water and oil-in-water-in-oil emulsions.
- the particles or droplets comprising the "dispersed phase” usually possess a variety of sizes, often ranging from 0.1 micrometer (micron, or ⁇ m), or smaller, to 1 ⁇ m, or larger.
- the distribution of particle or droplet sizes for a particular product depends on the chemical composition of the dispersion or emulsion in question (including the dispersant(s) used in conjunction with the particles or droplets) and the physical mechanism(s) used to achieve the final product. Examples of the latter include homogenization, in the case of an oil-in-water emulsion, and emulsion polymerization, in the case of a polymer suspension.
- the dispersed phase consists of solid particles or liquid droplets
- PSD particle size distribution
- particles particles
- dispersions products
- the effectiveness of these and other dispersion- or emulsion-based products depends critically on their stability, both on the shelf and during use.
- the term “stability” refers to the tendency of the particles comprising the dispersed phase to remain separated, without significant agglomeration or coalescence, over an extended (ideally, indefinite) period of time.
- the stability of a given dispersion or emulsion is typically a function not only of its chemical composition, but also of the "details" of the manufacturing process involved.
- the "quality,” or performance, of these dispersion- or emulsion-based final products and intermediate process materials is often related to their stability - i.e. to the underlying forces that can drive them toward destabilization.
- PSD dispersion or emulsion in question.
- important physical properties that are affected by the PSD include viscosity, hardness, strength, conductivity (thermal and electrical), appearance, color, hue, gloss, taste and texture.
- Physicochemical stability is an important outcome for the use of any commercially available suspension or dispersion.
- An unstable dispersion is characterized by adverse changes in the spatial distribution of the dispersed phase, such that otherwise homogeneously distributed fine particles or droplets irreversibly agglomerate or coalesce, respectively.
- liquid dispersions e.g. oil-in-water or water-in-oil emulsions
- the liquid droplets coalesce, resulting in ever larger, over-size "globules,” ultimately leading to phase separation on a macroscopic scale.
- This process of particle agglomeration or droplet coalescence results in an increase not only in the mean particle/droplet size, but also in the "polydispersity,” or range of particle/droplet sizes, comprising the overall PSD.
- the most devastating effects of agglomeration or coalescence in a commercially prepared dispersion or emulsion often occur in a size range that is approximately 1 ⁇ 2 to 1 log larger than the mean particle or droplet size. This size range where significant changes occur is referred to as the large-diameter "tail" of the PSD and is usually of the greatest interest.
- the relatively remote population constituting the tail of the PSD for stable dispersions generally accounts for less (often, substantially less) than 1% of the overall dispersed phase, on either a number- or volume-weighted basis.
- Growth in the tail of the PSD, relative to "baseline" values obtained for "good” (stable, high-quality) products can occur at any stage - i.e. during manufacturing, storage or distribution of products, or during subsequent improper, or sub-optimal, use by the industrial or private consumer.
- Failures may occur in a variety of ways that make the final manufactured product unattractive, unusable or even dangerous in the hands of the consumer. There are numerous common examples of such failures, including: poor taste associated with an unstable beverage concentrate, dairy product, food dressing or sauce; poor appearance or orifice clogging by an ink, caused by large-particle agglomerates; creation of defects (e.g.
- the products or materials of interest are colloidal in nature, in which the great majority of particles (or droplets) are smaller than 1 ⁇ m with population mean diameters typically lying in the range of 0.05 - 0.10 ⁇ m ("microemulsions"), 0.10 - 1.0 ⁇ m (“mini-emulsions”) or 1.0 - 10.0 ⁇ m (“macro-emulsions”).
- PSD population mean diameters typically lying in the range of 0.05 - 0.10 ⁇ m
- mini-emulsions 0.10 - 1.0 ⁇ m
- 1.0 - 10.0 ⁇ m 1.0 - 10.0 ⁇ m
- the most widely encountered class of dispersions and emulsions are aqueous systems, in which the "continuous" phase surrounding the dispersed phase of particles or droplets consists of water.
- the aqueous phase is not purely water. It invariably contains one or more species of charged, mobile ions (electrolyte) plus possibly other dissolved molecules, both charged and uncharged, together with whatever concentrations of H + and OH - ions are required to establish the pH of the dispersion medium.) Consequently, the most widely employed physical mechanism for stabilizing aqueous dispersions and emulsions is that of charge stabilization.
- the electrostatic interparticle repulsive force arises from the net charge (either positive or negative) residing on the surfaces of the particles.
- This charge may result from moieties that are covalently bonded to the surfaces - i.e. which are an intrinsic part of the particle in question - and which lose their neutrality by virtue of the dissociation of ions into the surrounding aqueous phase.
- the extent to which these oppositely charged "counterions” are released into the continuous phase, thereby leaving a net charge on the surface depends on the value(s) of the individual dissociation constant(s), or pKa(s), of the "titratable,” surface-bound moieties, relative to the pH of the surrounding aqueous phase.
- the pH of the aqueous phase is significantly greater than the pKa of the COOH groups (i.e. ⁇ 2 pH units above the pKa value)
- most of the H + ions will become dissociated from the latter, leaving negatively charged COO- groups attached to the surfaces of the particles.
- only 50% of the H + ions are dissociated.
- the pH falls below the pKa value, the surface charge greatly diminishes, even approaching zero, because more H + ions are now adsorbed onto the particles, and the dispersion becomes unstable.
- the net charge that resides on the particles to ensure their stabilization may be provided by charged molecules adsorbed onto their surfaces.
- a familiar example is provided by the same polystyrene latex particles (without the COOH groups), but in this case coated by molecules of an ionic surfactant, such as sodium dodecyl sulfate (SDS).
- SDS sodium dodecyl sulfate
- the hydrophobic hydrocarbon "tails" of the SDS monomers are attracted to the surface and/or interior of the similarly hydrophobic polymeric particles, while the hydrophilic head groups are favorably disposed to lie on the surface, allowing maximal exposure to the surrounding water molecules.
- the majority of the Na + ions are free to diffuse in the aqueous phase, leaving a net negative charge on the surfaces of the particles, by virtue of the SO 3 - groups belonging to the adsorbed SDS monomers.
- the region immediately surrounding the surface of each particle contains a relatively high concentration of ions having a charge opposite in sign to that of the particle surface, attracted to the latter.
- the concentration of these oppositely-charged ions decreases progressively with increasing distance from the particle surface.
- the concentration of charged ions having the same sign as that of the macro-particle increases with increasing distance from the latter.
- the diffuse region that extending beyond the Stem Layer, containing both positively and negatively charged mobile ions, free to diffuse between the macro-particles is referred to as the Gouy-Chapman Layer.
- the second fundamental influence on the stability of charged particles suspended in an aqueous medium is the London-van der Waals attractive force, originating from the interaction of electrical dipole moments in two neighboring particles.
- the dipole moment in one particle is induced by a dipole moment momentarily created in the other due to random fluctuations in local charge density.
- the strength of the interaction is characterized by the Hamaker coefficient, which depends on the composition of the particles.
- the London-van der Waals force is effective over only relatively short distances, falling off with particle separation, x, much faster than 1/x. That is, its decay with increasing distance is much faster than the corresponding decay exhibited by the interparticle electrostatic repulsive force in the absence of significant electrolyte concentration, owing to the longer-range nature of the latter force.
- the behavior of the resulting attractive interparticle potential energy, V A is also shown schematically (curve "V A ”) in Fig. 2 .
- V TOT V R + V A
- V TOT rolls over and decreases with further increases in particle separation, x (i.e. assuming that the influence of V R is great enough to avoid the occurrence of a secondary minimum in the plot of V TOT vs x), eventually falling effectively to zero at large separations.
- the detailed behavior, or shape, of V TOT vs x depends on the magnitudes and shapes of the two competing potential energy functions, V R and V A , that combine to form V TOT .
- V TOT vs x The shape and magnitude of the net interparticle potential energy curve, V TOT vs x, shown schematically in Fig. 2 , determines whether a particular charge-stabilized dispersion or emulsion will, in fact, remain stable, resisting agglomeration or coalescence over a long period of time.
- the peak in the V TOT vs x plot, having magnitude V MAX constitutes an interparticle energy "barrier" that protects two charged particles from approaching each other too closely (by Brownian motion, or diffusion), lest they be so strongly attracted to each other that they fall irreversibly into the deep energy well created by the strong, short-range London-van der Waals attractive force.
- V MAX interparticle potential energy barrier
- the half-life, t 1/2 is defined as the time needed for half of the original number of droplets in the emulsion to agglomerate, or coalesce.
- the rate of agglomeration, or flocculation is proportional to the square of the number of particles per unit volume, to the radius of the particles (assumed spherical) and to their diffusion coefficient.
- the half-life is less than one second. The presence of an interparticle potential energy barrier serves to slow down the rate of agglomeration, thereby increasing the half-life.
- t 1/2 increases to only 38.2 sec.
- a doubling of the interparticle interparticle barrier height, to V MAX 10kT, causes t 1/2 to increase significantly, but only to 1.55 hr - clearly inadequate for a final product that typically must have a shelf life of many weeks or months, if not years.
- Another doubling of the interparticle barrier height, to V MAX 20kT, results in a half-life of 3.91 years, approximating what is needed for many products of commercial significance.
- Friberg et al ( op cit, pp. 70-71) conclude their pessimistic assessment with the admission that faster, reliable testing methods do not exist. "This problem would be avoided if a reliable method for accelerated testing were found; that is, if a method were available that made it possible to judge the long-term behavior from short-term changes. Unfortunately, a general method of this kind is not available. There are methods in use that accelerate the destabilization process for emulsions of specific kinds, and these are useful within their realm of application. On the other hand, the important fact that these methods may give completely erroneous results when applied outside their established realm cannot be overemphasized.”
- DLVO theory teaches that the stability of a dispersion or emulsion worsens with a decrease in the interparticle potential energy barrier height, V MAX , relative to a fixed value of kT.
- V MAX interparticle potential energy barrier height
- an increase in temperature for a fixed value of V MAX should produce the same result - diminished stability.
- the extent to which the dispersion reveals symptoms of instability is therefore correlated with increases in temperature.
- the effect of temperature on the rates of chemical reactions i.e.
- Garver et al in U.S. Pat 6,263,725 B1 (2001 ), describe the use of an on-line sensor based on UV-visible light absorption and/or scattering to detect and identify colloidal substances, such as pitch or wood resin in pulp or paper process water.
- the difference or ratio of light attenuation or scattering measurements of a colloidal mixture performed at two or more temperatures provides a measure of the stability of the dispersion with respect to temperature.
- the observed differences in thermal stability for different samples provide a means for distinguishing different components of colloid-based fluids.
- Vadas Stability of Pharmaceutical Products
- p. 641 highlights the pitfalls associated with the use of elevated temperatures to accelerate stability assessment, in: Remington: The Science and Practice of Pharmacy, Gennaro (ed.), Vol. 1, Mack Publishing, Easton, PA (1995 ).
- “Two simple tests are used to screen emulsion formulations.
- First, the stability of an emulsion can be determined by heating it to 50-70 °C, and its gross physical stability observed visually or checked by turbidimetric measurements. Usually the emulsion that is most stable to heat is most stable at room temperature. However, this may not be true because an emulsion at 60 °C may not be the same at room temperature.
- Second, the stability of the emulsion can be estimated by the "coalescence time” test. Although this is a rough quantitative test, it is useful for detecting gross differences in emulsion stability at room temperature.”
- the second approach that has been utilized for assessing emulsion stability is application of mechanical stress - e.g., "shaking" it in one form or another - in order to subject the dispersion or suspension to shear forces.
- mechanical stress e.g., "shaking" it in one form or another - in order to subject the dispersion or suspension to shear forces.
- moderate-to-strong shear forces will cause less stable emulsions to exhibit coalescence faster than more stable ones.
- Degouy et al in U.S. Pat 5,257,528 (1993 ), describe a device for studying, on an accelerated basis the aging of a fluid circulating in a closed circuit - e.g., for testing the stability of muds used in oil drilling.
- the fluid is subjected to predetermined, elevated temperature and pressure and is circulated at a much faster rate than normally utilized, thus resulting in much higher shear forces.
- the fluid thereby undergoes accelerated aging, requiring only a relatively short time to reveal its rheological properties and, ultimately, its stability.
- Redhead et al summarize the results obtained from accelerated physical stability testing (vigorous shaking) of their brand-name product, a phospholipid-stabilized 10% soybean oil-in-water emulsion (pH 6-9) containing 1% propofol, used for intravenous anesthesia and sedation purposes.
- a "wrist-action" shaker operating at 270 shakes/min for up to 16 hours was used to provide prolonged mechanical stress to the emulsion.
- particle size analysis techniques were used to assess changes in the PSD as a function of the duration of shaking. Results were compared with those obtained for a generic "equivalent" product (pH 4.5-6.4).
- the generic product exhibited large changes in the volume percentage of large-diameter (> 2 ⁇ m) oil droplets, compared to no measurable changes after 16 hours for the brand-name product.
- the relatively poor stability of the generic product was attributed to its low pH, expected to reduce the negative surface charge (and corresponding zeta potential) of the phospholipid-stabilized oil droplets.
- Centrifugation was listed earlier as a third means of testing emulsion stability on an accelerated basis.
- Vadas op cit, p. 641 reviews the usefulness of centrifugation for assessing emulsion stability, where the droplets are assumed to have a lower density than that of the surrounding water phase. "The ultracentrifuge also is used to determine emulsion stability. When the amount of separated oil is plotted against the time of centrifugation, a plateau curve is obtained. A linear graph results when the oil flotation (creaming) rate is plotted vs the square of the number of centrifuge revolutions per minute.
- the flotation rate is represented by the slope of the line resulting when the log distance of emulsion-water boundary from the rotor center is plotted against time for each revolution per minute.”
- the progression of the emulsion-water boundary with elapsed time is typically followed by measuring the radial distribution of turbidity as a function of time, for various rotational speeds.
- the use of a centrifuge serves to decrease greatly the time needed to achieve significant oil flotation (creaming), compared to the long times required using a simple (gravity) sedimentation/flotation device, also based on turbidity.
- the centrifugal approach has at least one serious potential shortcoming.
- the act of progressive sedimentation or flotation of the suspended droplets causes large changes in the local concentration of these droplets.
- Kanicky et al. (Surface Chemistry in the Petroleum Industry," p. 257) demonstrates the ongoing gaps in knowledge in emulsion technology, in: Handbook of Applied Surface and Colloid Chemistry, Holberg (ed.), Vol. 1, John Wiley and Sons, Ltd, West Wales, UK (2002 ). Kanicky et al ( op cit, p.257) write: "It is clearly evident that emulsions are very complicated systems. Progress has been made on theoretical studies attempting to clarify the complexities of these systems. However, the majority of predictions of the type and stability of emulsions derives more from empirical observation than from theory.
- Emulsion formulation is still considered to be an art rather than a scientific method in many circles of industry.”
- Nicoli et al. discussed a method for determining the quality of a sample comprising a dispersion of solid or liquid droplet particles suspended in a liquid carrier. The quality being the measurement of the mean particle diameter.
- the present invention teaches applying physicochemical stress to the sample dispersion or emulsion in a way which accelerates the onset of significant particle agglomeration and which in particular, stresses the sample dispersion or emulsion by reducing the height of the interparticle energy barrier between particles of the dispersion or emulsion, which barrier inhibits neighboring particles from approaching each other closely enough to permit irreversible agglomeration due to strong, short-range attractive forces.
- the stability of the dispersion or emulsion is then determined in a preferred embodiment of the invention by detecting increases in the particle agglomeration with a high sensitivity, quantitative detector, such as a single-particle optical sensor (SPOS).
- a high sensitivity, quantitative detector such as a single-particle optical sensor (SPOS).
- SPOS single-particle optical sensor
- PSD particle size distribution
- the stress factor reduces the charge on the surfaces of the particles by changing the pH of the sample.
- the stress factor is an acid or buffered acid added to the sample to reduce the pH of the sample.
- the stress factor is a base or buffered base added to the sample to raise the pH of the sample.
- the stress factor reduces the net charge on the surfaces of the particles by adding adsorbing electrolyte to the sample, permitting dissociated ions of the appropriate charge to adsorb onto the surfaces of the particles.
- the particles have a net negative charge
- positively charged ions dissociated from the added electrolyte bind to the surfaces of the particles and reduce the net charge on the particles and thereby reduce the height of the interparticle potential energy barrier.
- negatively charged ions dissociated from the added electrolyte bind to the surfaces of the particles, similarly reducing the net charge on the particles and reducing the height of the interparticle potential energy barrier.
- the stress factor partially screens electrostatic repulsions between the charged particles, thus promoting particle agglomeration.
- the stress factor is applied as a simple monovalent salt, such as sodium chloride, or as a divalent or trivalent salt
- the percentage of the dispersed phase is calculated from each measured PSD.
- the rate of change of the PDP with elapsed time for each of the stress factor levels is then computed.
- a figure of merit is then derived from the rate of change of the PDP with elapsed time for a given stress factor level. It is to be observed that stable dispersions or emulsions will have relatively small values of FM, while inferior, less stable dispersions and emulsions will have relatively large values of FM.
- the value of FM of a sample may be obtained in other ways.
- the increase of the PDP per unit change in the stress factor level for a given value of elapsed time may be computed, and a value of FM is then derived from the increase in the PDP per unit change in the stress factor level for a given value of elapsed time, provided that the elapsed time is sufficiently long to permit accelerated instability and significant, particle agglomeration to be established.
- the larger the value of FM for a given value of elapsed time and level of applied stress factor the less stable the sample.
- the value of FM of a sample may also be derived from the rate of change of PDP with elapsed time for a given stress factor level combined with the increase in PDP per unit change in the stress factor level for a given value of elapsed time.
- the stress factor is applied in successive increments at spaced time intervals, resulting in successively increasing stress factor levels, and the step of detecting increases in particle agglomeration is repeated after each stress factor increment.
- the sample is divided into several batches.
- a different level of the stress factor is applied to each corresponding batch.
- the increase in particle agglomeration is measured for each batch, and this measurement is preferably a measurement of the PSD of each batch after the passage of time ⁇ t.
- the increase in particle agglomeration may also be detected in each of the batches immediately after the application of the stress factor to each of the batches.
- a control batch may be provided to which no stress factor is applied, and the increase, if any, in particle agglomeration in the control batch is detected after the passage of time ⁇ t.
- the high sensitivity detector comprises a detector, which does not respond to single particles of the sample.
- the detector senses a value X responsive to particles passing through a given region for a given time interval.
- the value X may be a measure of the attenuation of light in response to the turbidity of the sample dispersion or emulsion or a measure of the intensity of light scattered over a given range of angles from the particles of the sample dispersion or emulsion.
- the apparatus of the invention is used to perform the steps of the method of the invention.
- the apparatus uses a dispensing pump to feed a sample of the dispersion or emulsion under test to a test container or, as separate batches, to several test containers.
- Another dispensing pump feeds a stress factor, as discussed above, to the sample in a test container.
- the sample from the test container is then fed through a detector, which detects the increase in particle agglomeration.
- the detector is a single-particle analyzer, such as a SPOS, which provides a PSD, which may include a tail of large-diameter outlier particles indicative of the extent of the agglomeration of the particles.
- the apparatus facilitates the calculation of the PDP, the rate of change of the PDP, and the increase in PDP per unit change in the stress factor level, and derives values of FMs from these data.
- the detector senses a value X responsive to particles of the sample dispersion or emulsion passing through a given region for a given time interval.
- the value X may be a measure of the attenuation of light in response to the turbidity of the sample dispersion or emulsion; or X may be a measure of the intensity of light scattered over a given range of angles from particles of the sample dispersion or emulsion.
- the apparatus of the invention includes a computer controller/processor, suitably programmed to control the pumps, the flow of the sample and stress factors to the test container or containers, the operation and timing of the sensors, and the computations and manipulation of the data in accordance with the methods of the invention.
- the present invention is motivated by the universally recognized need for more reliable and quantitative methods for determining the stability of emulsions and dispersions. More specifically, this invention is directed to a novel method of stability testing which provide significantly accelerated results relative to techniques that are in current use, such as those alluded to in the references cited above.
- the new method to be described address the long-standing need for significant improvements in stability testing of dispersions, not only with respect to faster determination, but also with respect to improved reproducibility and predictive capability.
- the concentration of mobile ions in the aqueous phase can be reduced, thereby reducing the screening of the electrical field extending out from each particle or droplet.
- This action has the effect of "stretching" out to longer distances the curve of V R vs x, thus permitting a greater intersection, or overlap, of the repulsive electrical double layers associated with the particles or droplets.
- Either of these two actions has the effect of increasing the height of the net interparticle potential energy barrier, thereby preventing to a greater degree neighboring particles from approaching each other closely enough to permit irreversible agglomeration due to strong, short-range attractive forces.
- V MAX interparticle energy barrier height
- the effect of successive incremental reductions in the interparticle repulsive potential energy on the height of the resulting energy barrier is shown schematically in Fig. 3 .
- the "starting" repulsive energy, V R for the dispersion, before the application of a stress factor, is indicated by curve V R1 in Fig. 3 .
- the resulting net (total) interparticle potential energy is also shown, by curve V TOT1 .
- the attractive potential energy, V A also shown in Fig. 3 , is assumed to be constant, unaffected by the stress factor.
- the application of increasing amounts of the stress factor results in a progressive reduction in the interparticle repulsive energy, V R - e.g., from curve V R1 to curve V R2 .
- agglomeration is sometimes used herein to indicate coalescence, as well, in the case of liquid-in-liquid emulsions.
- the presence of particle/droplet agglomeration is the physical manifestation of the extent of instability of the dispersion; the greater the progression toward instability, the larger the extent of agglomeration. Therefore, a measurement of the PSD (including the "globule size distribution, or GSD) constitutes the most direct way of probing the stability of an emulsion or dispersion.
- Fig. 4A solid curve, 1) shows a simplified (stylized) representation of the PSD for a relatively stable dispersion or emulsion, before significant particle agglomeration has taken place.
- 4A (dashed curve, 2) also shows a simplified picture of the PSD for the same sample after an elapsed period of time, when a measurable amount of agglomeration has occurred - e.g. after application of one or more particular stress factors to the dispersion. If the increase in agglomeration is modest, indicative of only a small progression toward instability, the change in the PSD should, to first approximation, be relatively small growth in the "tail" of large-diameter “outlier" particles.
- the technique that is employed to determine the PSD must, in practice, be sensitive enough to detect quantitatively relatively small changes in the state of agglomeration of the dispersion in question. If the technique utilized lacks sufficient sensitivity to changes in the PSD associated with relatively small increases in particle/droplet agglomeration, then the rationale underlying the new methods of this invention may be compromised. In that case, the stress applied to the dispersion would need to be larger than desired in order to produce enough agglomeration to permit detection of a meaningful change in the PSD after a relatively short time. That is, a relatively large reduction in V MAX - no longer the assumed small perturbation of the dispersion - would be needed, resulting in two potential problems.
- SPOS single-particle optical sensing
- OPC optical particle counting
- the resulting signal consists of negative-going pulses, of height ⁇ V LE , superimposed on a relatively large background voltage level, V 0 .
- the signal consists of positive-going pulses, of height AV LS , ideally superimposed on a zero background voltage level.
- the pulse height increases monotonically with the particle diameter, d.
- Particles or droplets can therefore be sized from their measured pulse heights using a predetermined "calibration curve," ⁇ V LE vs d or ⁇ V LS vs d, obtained using "standard” particles (typically polystyrene latex) of several known, uniform diameters.
- the LE-type SPOS technique typically provides the largest particle size range, depending on the optical design of the sensor.
- a representative LE-type sensor the Model LE400-1.3 (Particle Sizing Systems, Santa Barbara, CA), provides a nominal size range of 1.3 to 400 ⁇ m and is ideally suited for measuring the large-diameter tails of both mini- and macro-emulsions. (The results discussed below were obtained using this sensor.)
- the lower size detection threshold can be reduced significantly by utilizing the LS method, owing to the absence of the large background voltage, V 0 , and the ability to increase the pulse height for a given particle size by increasing the intensity of the light source.
- an LS-type sensor lacks the upper size limit that is readily available using the LE method.
- the LE and LS methods can be combined in a hybrid sensor design, thus producing a “summation" response, termed “LE+LS,” as described by Wells et al, in U.S. Pat. 5,835,211 (1998 ).
- This approach yields both a lower size limit and a wide dynamic size range (e.g. 0.5 to 400 ⁇ m), features that, together, are unavailable using either the LE ort LS principle alone.
- a second consideration is whether a reliable, reasonably accurate measurement of the large-diameter tail of the PSD - i. e. for diameters, d, above a suitable threshold, do - can be made using the SPOS-LE technique, given the fact that the vast majority (typically > 99%) of the particles comprising the dispersed phase lie below d 0 . Large numbers of these smaller particles invariably pass simultaneously through the OSZ, even when the larger particles/droplets of interest are sufficiently dilute in concentration to guarantee that they pass through the sensing zone one at a time. Fortunately, for most dispersions of interest, the presence of this "sea" of smaller particles has relatively little effect on the PSD, as measured by SPOS-LE, provided the sample has been diluted adequately.
- this attribute constitutes one of its outstanding, intrinsic attributes.
- the pulse height, ⁇ V LE is roughly proportional to the square of the diameter.
- the physical mechanism responsible for light extinction shifts from simple geometric refraction, to light scattering, described by Mie scattering theory.
- the pulse height falls faster with decreasing d, approximating a 4 th power dependence.
- the particles of diminishing size that pass through the OSZ although typically of enormous number compared to the population of larger particles of interest (d > do), have a negligible effect on the tail of the PSD, as measured by SPOS-LE.
- This assertion assumes, of course, that the sample suspension has been diluted to an adequate and appropriate extent.
- the effective irrelevance of the smaller particles can be confirmed by measuring the PSD tail again at lower concentration(s). If the dilution chosen for the initial measurement was appropriate, the PSD tails, expressed as the number (#) of particles per ml of the original sample, will be substantially the same and overlay one another. This equivalence, of course, is apart from statistical fluctuations resulting from inadequate numbers of particles of a given size being counted - typically a concern at the largest sizes, where the fewest particles are measured.
- the SPOS-LE technique by virtue of its single-particle resolution and high sensitivity (typically quadratic, or higher) to changes in particle size, is well suited to the determination of small increases in particle agglomeration associated with the acceleration of instability in dispersions.
- the apparent shortcoming of the technique - i. e. its lack of sensitivity to particles substantially smaller than the measurement threshold, d 0 - is, in the context of the present invention, transformed into a distinct advantage. Determination of a "partial PSD" - i.
- the tail, d > do only - makes the resulting measurement more sensitive to a small change in a small fraction of the overall distribution, i.e., representing the larger particles/droplets.
- the fractional change in the population, or even better, in the volume fraction associated with the measured PSD tail is now larger.
- the "gain" of the SPOS-LE detection technique is therefore substantially increased, relative to that of other, “ensemble” techniques that effectively respond to all particles comprising the dispersed phase.
- the SPOS technique is therefore able to transform the small absolute change in the PSD seen in sample "2," relative to "1," in Fig. 4A , into a much larger relative change (d > do), seen in Fig. 4B .
- the resistive pore technique has a number of disadvantages relative to SPOS. These include: requirement of relatively concentrated electrolyte levels in the aqueous phase, susceptibility to clogging, relatively low particle counting rate and relatively small dynamic size range. The first of these disadvantages will be seen below to be particularly serious, given that the systematic addition of salt to the dispersion of interest constitutes one of the important embodiments of the present invention.
- Another potentially viable technique is that of "laser diffraction,” usually consisting of two physical techniques, used in combination or separately - i.e., large-angle Mie scattering and forward-angle Fraunhofer diffraction.
- the angular-dependent diffracted intensity "pattern” is again “inverted,” using appropriate algorithms, to obtain an estimated PSD.
- Yet another example of an ensemble technique for particle size analysis that can be considered to implement the methods taught in this invention is that of ultrasound attenuation.
- the variation in transmission of ultrasonic waves through a quantity of the sample as a function of wavelength, when combined with suitable inversion algorithms, can be used to obtain an estimate of the PSD.
- a second example of a technique that can be used as a proxy for a particle size analyzer is the simple method of turbidometry, or spectrophotometry.
- a light beam of an appropriate wavelength, or range of wavelengths is passed through a fluid sample of given thickness (i.e., optical path length) and appropriate concentration.
- the extent to which the intensity of the light beam is attenuated is related to the underlying PSD.
- the turbidity, or optical density, of the sample ideally increases monotonically with the growth in the "tail" of large-particle agglomerates associated with the onset of instability.
- the techniques of turbidometry and light scattering can be considered to be roughly complementary to each other, that is, the transmitted light intensity for the former decreases, while the intensity associated with the latter increases, with increasing particle agglomeration.
- a second mechanism for inducing accelerated instability in a system consists of reducing the surface charge on the particles or droplets by selective adsorption of charged ions of opposite sign - e.g.
- the first example of a product that can be systematically stressed to permit successful accelerated testing of stability is a dairy fat emulsion - i.e., commercially available whole (homogenized) milk.
- Whole milk is an oil-in-water emulsion that contains dairy fat droplets dispersed in water.
- the fat droplets are charge-stabilized by a coating of bovine casein, a protein of moderately large molecular weight (-23,600 Daltons) that exhibits its primary emulsifying action via ionization of its anionic amino acid head groups.
- bovine casein a protein of moderately large molecular weight (-23,600 Daltons) that exhibits its primary emulsifying action via ionization of its anionic amino acid head groups.
- the molecules of casein may provide additional stabilization against coalescence through the mechanism of steric hindrance.
- milk generally has a shelf life of about two weeks.
- the quality of the homogenized dispersion can be evaluated qualitatively by simple sensory assessments. These include whether it is visually obvious that dairy fat from the dispersed phase has separated from the continuous bulk aqueous phase, and/or whether there is a foul smell and/or taste-i.e. a "souring" of the final product.
- the souring of milk indicates failure of the dispersion, and its occurrence ideally coincides with, or immediately follows, the expiration date (ED) printed on the container, although in practice this is rarely the case.
- the purpose of the first study was to evaluate the effects of "pH stress" on the stability of whole milk.
- This negatively-charged dispersion, stabilized by bovine casein typically at pH 6.5, was stressed by addition of acid, resulting in a reduction of surface charge on the finely dispersed milk-fat droplets, thus inducing agglomeration.
- the milk batches were acidified using a standard buffer solution, constructed from stock solutions of 0.1 M (21.01 g/L) citric acid monohydrate (C 6 H 8 O 7 ⁇ H 2 O) and 0.2 M (28.44 g/L) dibasic anhydrous sodium phosphate (Na 2 HPO 4 ).
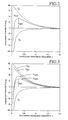
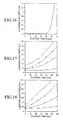
- Fig. 5 depicts the PDP values (i.e., the volume of fat droplets larger than 1.8 ⁇ m, expressed as a percentage of the total fat volume) vs elapsed time, t, obtained from the three control samples of whole milk, in the absence of exogenous buffers.
- the plots of PDP vs t are nearly the same (apart from experimental scatter) for batches # 1 ("0608,” solid circles) and #2 ("0612,” solid squares).
- the plot obtained for batch #3 (“0615,” solid triangles)
- the youngest" sample according to its ED value exhibits a slightly higher percentage of large-diameter fat droplets compared to the other, "older” batches. This latter behavior is interesting, but of no particular significance, as will be appreciated shortly.
- Fig. 7 shows PDP vs t obtained following a more powerful stress of the samples - i. e. a larger reduction in pH, from 6.5 to 5.7.
- the PDP value for batch #2 (solid squares) increased approximately to 1.4 % after 240 min, compared to 1.25 % for the somewhat milder pH reduction (from 6.5 to 6.1).
- This behavior is not surprising.
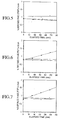
- the indicated slope values associated with each value of reduced pH provide a useful quantitative measure of the inferiority of batch #2 - i.e. how quickly it destabilizes after application of the acid stress factor. It would be useful to divide the increase in slope (i.e., relative to the control sample) by the change in pH, ⁇ pH, in order to arrive at a quantitative measure of the instability induced in the sample by application of that particular level of stress.
- the fact that the r-values are so close to unity for batch #2 reinforces the predictive value of the accelerated stress-testing method outlined in the present invention and ratifies the conclusion of instability, or inferiority, previously drawn for this sample.
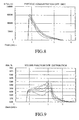
- Fig. 9 shows the differential distributions of the absolute volume fractions of the fat globules corresponding to the particle concentration tails of Fig. 8 .
- the increase in volume fraction of the dispersed phase at each droplet diameter with increasing elapsed time is evident.
- the second study consisted of exposing the same three batches of whole milk to a second kind of stress factor - addition of adsorbing electrolyte, permitting dissociated ions of the appropriate charge, that are able to adsorb to the surfaces of the fat droplets.
- calcium chloride (CaCl 2 ) an inorganic divalent salt, was added to the milk samples, causing some of the dissociated Ca ++ ions to become bound to the surfaces of the droplets.
- the stressed samples were prepared using a standard stock solution consisting of 0.2 M (29.4 g/L) calcium chloride dihydrate (CaCl 2 •2H 2 O).
- this second stress factor was designed to reduce the net charge on the droplets, thus reducing the height of the inter-droplet energy barrier and promoting droplet coalescence.
- the means for reducing the surface charge is different.
- positively-charged Ca ++ ions adsorb onto the surfaces of the oppositely charged droplets (made negatively-charged at pH 6.5 by virtue of the already-adsorbed molecules of bovine casein) that causes a net reduction of the charge on each particle.
- the greater the concentration of CaCl 2 added to the sample the greater the number of Ca ++ ions that become bound to each casein-coated fat droplet, and the lower the resulting average charge on the latter. (This conclusion assumes that the added concentration of Ca ++ is not so high as to cause charge "reversal,” resulting in a net positive charge on the particles.)
- the second study was conducted two days after the acid-stress study was carried out. Hence, the ED for batch # 1 was exceeded by one day, with 3 days remaining before the ED of batch #2 and 6 days before the ED of batch #3. Each batch was subjected to "calcium-stress" at two different concentrations of added Ca ++ , equal to 0.005M and 0.01M. Each batch provided its own “control” - i.e. in the absence of added CaCl 2 . The milk samples were studied at six different time intervals over a 24-hour period, and all samples were refrigerated (4-8 °C) between analyses, conducted at room temperature, as before.
- Figs. 10-13 summarize the effects of the ionic challenges on the stability of the dispersions vis-à-vis fat droplet coalescence.
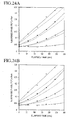
- Fig. 10 summarizes the calculated values of PDP vs t over a period of 24 hours for batch # 1 ("0608") for the "control" sample (no added CaCl 2 , solid circles) and the two concentrations of added CaCl 2 , 0.005M (solid squares) and 0.01M (solid triangles).
- Fig. 11 summarizes the results for batch #2 ("0612"), and Fig. 12 , the results for batch #3 ("0615"), using the same symbols as in Fig. 10 .
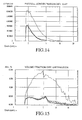
- Fig. 13 is a compressed version of Fig. 11 , allowing the entire set of data points for batch #2, 0.01M CaCl 2 (solid triangles) to be plotted.
- this level of calcium chloride stress can no longer be considered to be a "small” perturbation of the dispersion in the case of batch #2, given the eventual much larger, nonlinear response of the measured PDP to the added CaCl 2 after more than 12 hours have elapsed. (Even the previously stable batch # 1 "collapsed" under the concentrated conditions in this case.) In the case of batch #3 ( Fig. 12 , solid triangles), the higher stress level yielded only slight growth in the PDP over the full elapsed time period, consistent with the fact that this was the "youngest” milk product and therefore, not surprisingly, the most stable.
- the indicated slope values associated with each value of [CaCl 2 ] again provide a useful quantitative measure of the inferiority of batch #2.
- the fact that the r-values are relatively close to unity for batch #2 again reinforces the predictive value of the accelerated stress-testing method outlined in the present invention and again ratifies the conclusion of instability, or inferiority, previously drawn for this sample.
- the dispersed phase consists of droplets of vegetable oil, stabilized by an anionic surfactant, utilized to impart a negative charge to the surfaces of the oil droplets.
- an anionic surfactant utilized to impart a negative charge to the surfaces of the oil droplets.
- the stressed samples were analyzed as before, using particle size analysis (SPOS) based on light extinction (i.e., SPOS-LE), and the results again expressed as the volume percentage of large-diameter (range: 1.8-50 ⁇ m) oil droplets ("globules”), or PDP, at various elapsed time intervals.
- SPOS particle size analysis
- the main effect of the added salt ions was to partially screen the electrostatic repulsions between the charged droplets (i.e., shrinking the electrical double layers associated with the droplets), thus promoting their coalescence.
- a simple monovalent salt, NaCl has been described for partially screening electrostatic interparticle repulsion, it is to be understood that a simple divalent or trivalent salt could also be used for partially screening the electrostatic repulsions.
- the indicated slope values associated with each value of [NaCl] again provide a useful quantitative measure of the extent of instability, or inferiority, of the vegetable fat emulsion in the presence of the mixed ionic species.
- the fact that all of the r-values are so close to unity for all three values of [NaCl] again reinforces the predictive value of the accelerated stress-testing method outlined in the present invention and ratifies conclusions of instability drawn for this sample.
- the mixed ionic species (same concentration) were again added to four separate aliquots, or batches, of the same vegetable oil emulsion (5% w/v), to form the same "baseline" dispersion utilized in the previous experiment.
- the batches were systematically stressed by the addition of acid (i.e. pH reduction), similar to the technique that was utilized in one of the milk stability studies, discussed earlier.
- acid i.e. pH reduction
- hydrochloric acid (HCl) was added to the batches in increasing proportions, in order to reduce the pH of the final dispersions in successive stages.
- the vegetable oil droplets comprising the starting emulsion were stabilized by a lecithin surfactant, having an isoelectric point (pH) of ⁇ 3.2.
- This dispersion stabilized by an anionic surfactant that induces a net negative charge under low acid conditions, was stressed by addition of acid, causing a reduction in the electrostatic charge residing on the finely dispersed milk droplets, thus inducing agglomeration.
- the pH of the unstressed starting sample was 6.56.
- the PDP plots shown in Fig. 18 resemble those seen in Fig. 17 , obtained from NaCl stressing of the dispersion containing vegetable oil emulsion plus mixed ionic species.
- the acceleration in the time frame needed to establish the extent of instability of the dispersion is similar to that which was obtained from NaCl stressing of the dispersion.
- the greater the level of applied stress the faster the onset of significant oil droplet coalescence.
- the indicated slope values associated with each value of pH again provide a useful quantitative measure of the extent of instability, or inferiority, of the vegetable fat emulsion in the presence of the mixed ionic species.
- ⁇ pH change in pH
- the fact that all of the r-values are so close to unity for all three values of reduced pH again reinforces the predictive value of the accelerated stress-testing method outlined in the present invention and ratifies the conclusion of instability drawn for this sample.
- the systematic addition of significant, increasing amounts of acid served its intended function - i.e., acceleration of the onset of reproducible instability of the dispersion.
- the first embodiment of the method of this invention utilizes stress factor ⁇ A," consisting of controlled alteration of the pH- i.e., involving either an increase or a decrease in the pH of the continuous phase of the dispersion or emulsion in question.
- stressing of the starting sample by means of changing its pH causes the average amount of charge on the surfaces of the particles (or droplets) to decrease, resulting in a reduction in the interparticle potential energy barrier height, V MAX , and a consequent acceleration in the rate of irreversible agglomeration of neighboring particles (or coalescence of neighboring droplets).
- the choice of whether to increase or decrease the pH of the sample depends on whether the particles (or droplets) carry a net negative or positive charge in their normal, unperturbed state. If the pH of the unperturbed dispersion is greater than the "isoelectric point," or IEP (i.e., the pH value at which the charge on the particles is approximately zero), the particles carry a net negative charge.
- the stress factor consists of lowering the pH of the sample by one or more predetermined increments. This systematic titration is accomplished by adding one or more measured amounts of concentrated acid (either in "pure” or buffered form) to the starting sample. Each resulting reduction in the pH value brings the dispersion closer to its IEP, with a corresponding reduction in the average charge on the particles or droplets, thus resulting in a correspondingly greater propensity for particle agglomeration or coalescence.
- the stress factor consists of raising the pH of the dispersion by one or more predetermined increments, through the systematic addition of concentrated base (again, either in pure or buffered form).
- concentrated base again, either in pure or buffered form.
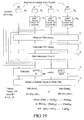
- the starting dispersion or emulsion to be tested is divided into N+1 separate aliquots, or batches, 10 0 , 10 1 , 10 2 , ....10 N , with N ⁇ 1.
- Each aliquot contains either the same sample volume or, possibly, a different volume, depending on the specific design of the stability test.
- the sample aliquot referred to as 10 0 constitutes the "control" for the stability test, as it is not subjected to any (acid or base) stress. Inclusion of this control sample in the test protocol is not strictly required. However, given the variability in sample composition that often occurs from one manufacturing period to another, it is usually desirable to include in the testing procedure a sample that has not been stressed. In this way, the ability of the new accelerated stress testing method to detect reliably small changes in particle agglomeration is potentially enhanced and speaks to the quality of the individual batch.
- This new, lower value is ideally measured, but can be calculated (based on the volume of the sample aliquot and the volume and pH of the concentrated acid or buffer that is used to effect the reduction in pH) after addition of the stress factor.
- stress factor "A” consisting of the addition of acid or base (whichever is appropriate)
- N distinct (ideally identical) aliquots at 11 1 , 11 2 , ....11 N of the dispersion to be tested.
- the particle size distributions (PSDs) for each, as well as for the unstressed control (#0) sample are measured at 12, using a technique for particle size analysis that possesses adequate sensitivity and resolution.
- the technique of SPOS typically based on the principle of light extinction (LE), but optionally based or light scattering (LS), or a combination of the two (“LE+LS”), depending on the type of emulsion or dispersion to be evaluated, is preferred.
- the measured PSD typically relates to a range of particle diameters, d ⁇ do, which defines the "tail" of largest particles comprising the PSD.
- the threshold value, do is chosen to maximize the statistical significance (i.e., signal/noise ratio) of the resulting PSD, based on the desired maximum analysis time and extent of sample dilution.
- the measurement of the PSD for each sample aliquot is carried out immediately (i.e., as quickly as possible) following the application of the acid or base stress factor.
- the PSDs may be measured serially, one sample aliquot after another, or in parallel, using several independent sensors and associated instrumentation to perform each SPOS measurement at substantially the same time.
- the "percent dispersed phase," or PDP typically also for d ⁇ do
- corresponding stress level ⁇ pH I
- elapsed time is calculated at 13 from each measured PSD.
- a time delay, ⁇ t, at 14 is allowed to occur for each sample, following which the PSD is again measured, and the corresponding PDP value calculated, for each sample.
- the time delay, ⁇ t is typically chosen to be substantially the same for all samples, but this is not a requirement. Optionally, it may be chosen to be different for one or more samples, depending on the levels of acid or base stress chosen.
- the nominal time delay between successive sets of PSD measurements may be chosen to be zero. In the latter case, measurement of the PSDs and calculation of the PDP values for the set of sample aliquots effectively becomes a continuous process, without significant idle periods between successive sets of measurements.
- the repetitive cycles of PSD measurements and corresponding PDP calculations for the set of acid- or base-stressed sample aliquots are carried out for a long enough time to permit reliable determination of the PDP as a function of elapsed time for each applied stress level.
- the presumption is that the levels of applied stress have been chosen judiciously, so that significant increases in the PDP values are observed after the desired, relatively short period of time, for at least the highest level of stress (i.e., the largest ⁇ pH I ).
- the number of measurement and calculation cycles is typically predetermined, especially in the case of a dispersion that has been well characterized in the past with respect to stability and performance.
- the number of measurement cycles, and therefore the overall duration of accelerated stress testing may be "open-ended.”
- the procedure is terminated only after sufficient time has elapsed to permit reliable determination of changes in the PDP values for one or more levels of applied (acid or base) stress. If meaningful changes in the PDP values are not observed at even the highest level(s) of applied stress following a reasonable length of time, the procedure would typically be repeated using a new set of higher stress levels, ⁇ pH I .
- a set of PDP values (d ⁇ do) as a function of pH and time, t, are obtained. From these PDP values, at least two potentially useful quantities, or sets of quantities, can be derived at 15. The first of these is the rate of change of the PDP with elapsed time, t, for each given pH value, ⁇ (PDP)/ ⁇ t
- the slope ⁇ (PDP)/ ⁇ (pH) associated with a decrease in pH from 6.6 to 6.1 increases with time as follows: 0.07 (80 min), 0.48 (160 min) and 0.85 (240 min).
- the corresponding computed values of the slope based on a decrease in pH from 6.6 to 5.7 are 0.17 (80 min), 0.41 (160 min) and 0.62 (240 min).
- the values of the slope based on a decrease in pH from 6.56 to 4.46 are 0.046 (60 min), 0.076 (120 min), 0.112 (180 min) and 0.135 (240 min).
- the slope ⁇ (PDP)/ ⁇ (pH) increases with increasing ⁇ pH for all values of elapsed time.
- pH obtained after the pH of the dispersion has been changed by a given amount, ⁇ pH I , describes how quickly the dispersion undergoes irreversible agglomeration, owing to the change in pH.
- the sensitivity of the PDP values to changes in pH after a given elapsed time can be used to assess the stability of the starting sample. That is, the FM can be defined using the computed value of ⁇ (PDP)/ ⁇ (pH)
- t for a given value of elapsed time, t, and relatively small value of applied stress, ⁇ pH I the less stable is the starting sample.
- the sensitivity of the dispersion to a given change in pH can be used to determine the optimal stress level, or range of stress levels, for performing accelerated stress testing.
- Such comparisons provide the means for determining whether the product in question is sufficiently stable to permit its continued manufacture, distribution and use, or whether key aspects of the manufacturing process (including the quality of raw input materials) require improvement or modification, whether used individually or as an entire set of values (i.e., incorporated into an appropriate algorithm), provide the means for assigning one or more measures of the FM for the dispersion, and hence assessing its stability.
- the second embodiment of this invention is the same as the first embodiment in all respects but one.
- the only difference is that it utilizes a different stress factor, labeled "B,” consisting of the controlled, systematic addition of a particular electrolyte which, after dissociation, supplies ions that are (partially) adsorbed by the charged particles in the dispersion or emulsion of interest. Adsorption of the charged ions by the oppositely charged particles or droplets causes the average charge on their surfaces to be decreased. The greater the concentration of added electrolyte, the greater the average number of charged ions that are adsorbed onto the charged surfaces of the particles or droplets, and the lower the resulting net charge on the latter.
- B stress factor
- a suitable electrolyte must be selected - i.e., one that, after dissociation, provides ions that are adsorbed to a significant extent by the surfaces of the oppositely charged particles/droplets.
- ions that are adsorbed to a significant extent by the surfaces of the oppositely charged particles/droplets.
- calcium chloride proved to be a good choice for the electrolyte, as the dissociated Ca ++ ions obviously have an affinity for the (bovine) casein-coated fat droplets comprising the dispersed phase of whole milk.
- electrolytes are suitable candidates for stressing dispersions of interest, providing ions that adsorb to some extent onto the charged particles/droplets.
- a second choice that must be made is the appropriate range of concentration for the added electrolyte, once the latter has been selected. Estimates can be made based on theoretical considerations (i.e., using models for selective ion adsorption, together with numerical predictions of DLVO theory). Alternatively, and more typically, the range of suitable concentrations can be determined by trial and error, through stress testing of the dispersion of interest.
- the set of PDP values obtained for the N different levels of applied stress - i.e. the various concentrations of added electrolyte, [elector] I , - and the various elapsed times give rise to quantities that describe the sensitivity of the dispersion to the applied stress factor. These quantities can be used to assess the stability of the dispersion or emulsion of interest.
- the first of these at 25 is the rate of change of the PDP with elapsed time, t, for a given concentration of added electrolyte, [electr], written as ⁇ (PDP)/ ⁇ t
- This partial derivative is computed separately for each level of applied absorbing-electrolyte stress, [electr] I , i.e., for [electr] 1 , [electr] 2 , ..., [electr] N.
- Values for this "slope,” obtained by linear regression analysis of the PDP vs t data for each value of [CaCl 2 ] are shown in Table II for the three samples of whole milk discussed above.
- the "slope" can be approximately by ⁇ (PDP)/ ⁇ [electr] for each value of t.
- this slope will in general increase with increasing time, t, given a positive slope for ⁇ (PDP)/ ⁇ t
- the computed values of the partial derivatives relevant to the adsorbing-electrolyte stress utilized in the second embodiment - i.e., ⁇ (PDP)/ ⁇ t
- the FM can be defined using the computed value of ⁇ (PDP)/ ⁇ [electr]
- the PDP for the sample identified as inferior, "0612" Figs.
- the electrolyte chosen for implementation of the second embodiment does not produce ions that adsorb too strongly to the surfaces of the charged particles/droplets. Otherwise, there may be too small a range of concentration of added electrolyte over which the resulting net charge on the particles can be modified, from very little (at lowest [electr]) to maximal (at greatest [electr]). Such compression in the response (i.e. net charge on the particles/droplets) of the dispersion to the application of the stress factor might make it difficult to achieve a linear response in the PDP to changes in electrolyte concentration, elapsed time, or both.
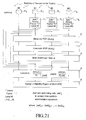
- the third, and final, embodiment of the invention is similar to the second embodiment and is summarized schematically in Fig. 21 . Like the second embodiment, it also utilizes added electrolyte - now, however, referred to simply as “salt” - to stress the starting sample. The only difference is that in this case the salt, labeled as stress factor "C,” is assumed to be of a type that, upon dissociation, yields charged ions that are not appreciably adsorbed by the charged particles or droplets that comprise the dispersed phase of the dispersion. Rather, the dissociated salt ions remain in the continuous phase of the dispersion, free to diffuse therein.
- the average amount of electrical charge residing on the particles or droplets is substantially unchanged by the addition of different amounts of this salt to aliquots of the starting sample. Therefore, the way in which the added salt reduces the stability of the dispersion (i.e., promoting agglomeration) differs from that achieved in the first and second embodiments, in which interparticle repulsive forces are reduced by decreasing the net charge residing on the surfaces of the particles. Rather, in the present case the interparticle repulsive forces are reduced through the addition of mobile ions in the continuous phase. These ions distribute themselves in thermodynamic equilibrium, in such a way that they serve to "screen,” or partially neutralize, the electrostatic fields that emanate from each charged particle.
- a suitable salt must be selected - i.e., one that, after dissociation, provides ions that remain in the aqueous phase of the dispersion under study, largely not adsorbed onto the surfaces of the oppositely charged particles/droplets.
- the effectiveness of the dissociated salt ions to shrink the thickness of the electrical double layers associated with each charged particle is also highly dependent on the valence of the ions, as taught by the Debye- Hückel theory.
- sodium chloride proved to be a good choice for the added salt.
- the second choice involves the appropriate range of concentration for the added salt. Again, estimates can be made using DLVO theory. However, typically the range of suitable concentrations is established by trial and error, through stress testing of the dispersion of interest.
- each cycle of stress testing is the same as that described above for the previous two embodiments.
- these are (for each sample aliquot, including the control): 1) measurement at 32 of the PSD (d ⁇ do), using a suitable technique for particle size analysis, preferably SPOS-LE; 2) calculation at 33 of the PDP (typically also d ⁇ do); 3) optionally allowing at 34 a time, ⁇ t (typically, but not necessarily, substantially the same for each aliquot), to elapse before the next cycle of PSD measurement and PDP calculation commences.
- the set of PDP values obtained for the N different levels of applied stress - i.e. the various concentrations of added salt, [salt] I , - and the various elapsed times give rise at 35 to calculated quantities that describe the sensitivity of the dispersion to the applied stress factor. That is, these quantities can be used to assess the stability of the dispersion or emulsion of interest.
- the first of these is the rate of change of the PDP with elapsed time, t, for a given concentration of added salt, [salt], written as ⁇ (PDP)/ ⁇ t
- the value of ⁇ (PDP)/ ⁇ t depended not only on the value of [NaCl] (i.e., increasing as the latter increased), but also to a modest extent on the value of t.
- the degree of curvature in PDP vs t was small enough to permit a linear approximation, allowing the slope, ⁇ (PDP)/ ⁇ t, to be characterized by a single value for each value of [NaCl].
- the value of the slope increased progressively, from 0.00085 to 0.00152 to 0.00195, when [NaCl] was increased from 0.1M to 0.15M to 0.2M, respectively. (The slope was negligible, 0.000098, for the control sample.)
- the computed values of the partial derivatives relevant to the salt-screening stress utilized in the third embodiment - i.e., ⁇ (PDP)/ ⁇ t
- the FM can be defined using the computed value of ⁇ (PDP)/ ⁇ [salt]
- Which of these derivative quantities are used, whether singly or in combination with each other (by means of a suitable algorithm), depends on the dispersion being investigated and the type (and concentration range) of the salt stress factor employed. In the case of the vegetable oil emulsion (plus destabilizing mixture of ionic species) stressed by sodium chloride, discussed earlier, the PDP ( Fig. 17 ) was found to increase somewhat nonlinearly with time for all three levels of applied stress factor, [NaCl] 0.05M, 0.10M and 0.15M.
- FIG. 22 A simplified block diagram of a typical apparatus that is suitable for implementing any of the three embodiments shown in Figs. 19-21 is shown in Fig. 22 .
- a computer controlled autosampler means 38 conveniently allows multiple batches of the sample dispersion of interest (having an appropriate, predetermined concentration) to be stress tested.
- Autosampler means 38 is shown schematically as including a controlled support member 39, which as indicated, can be moved up and down and laterally so that it may move pipes 56 and 66, which, as will be explained below, selectively feed the sample dispersion or emulsion and stress factor to test containers 40, 41, 42, and 43, and move pipe 72 which selectively withdraws the mixture of sample and stress factor from the test containers.
- a controlled support member 39 which as indicated, can be moved up and down and laterally so that it may move pipes 56 and 66, which, as will be explained below, selectively feed the sample dispersion or emulsion and stress factor to test containers 40, 41, 42, and 43, and move pipe 72 which selectively withdraws the mixture of sample and stress factor from the test containers.
- pipes 56 and 66 selectively feed the sample dispersion or emulsion and stress factor to test containers 40, 41, 42, and 43, and move pipe 72 which selectively withdraws the mixture of sample and stress factor from the test containers.
- the additional sample batch (designated as #0), to which the stress factor is not applied, serves as the control sample, as described previously.
- the first fluidics subsystem 50 (upper right-hand corner) employs a fluid dispensing means 52 (e.g., a syringe pump) to deliver a predetermined volume of original sample dispersion of appropriate concentration from a holding vessel 54 through a pipe 56 to the appropriate sample batch vessel 40, 41, 42, or 43 located in the autosampler means.
- This fluid dispensing means is typically controlled by the same computer controller/processor subsystem 100 that controls the autosampler means and the other subsystems comprising the testing apparatus shown schematically in Fig. 22 .
- the second fluidics subsystem 60 (upper left-hand corner) employs a separate fluid dispensing means 62 (e.g., another syringe pump) to deliver a predetermined volume of fluid comprising the chosen stress factor from a vessel 64 through a pipe 66.
- a separate fluid dispensing means 62 e.g., another syringe pump
- the latter might be relatively concentrated acid or base of a particular molarity and pH (or a particular buffer having a particular composition and pH), or a relatively concentrated electrolyte or salt, or a combination thereof.
- Each of the fluid dispensing means shown in Fig. 22 is controlled by the same computer controller/processor subsystem 100 that is also used to control and communicate with the other subsystems that comprise the stress testing apparatus.
- the desired volume of original sample dispersion fluid is first dispensed into each of the sample batch vessels contained in the autosampler means.
- the desired (typically much smaller volume) volume of "stress factor” fluid is then dispensed into each of the sample batch vessels (i.e., #1, #2 and #3 in Fig. 22 ).
- the volume of stress factor fluid added to each vessel is different, determined by the final pH or electrolyte/salt concentration - i.e., stress level - desired for that particular sample batch.
- a stirring means (not shown), such as a mechanical propeller, or preferably a magnetic actuated stirring bar, is used to achieve efficient mixing of the original sample dispersion fluid and added stress factor fluid in each vessel during dispensing, thus ensuring homogeneous suspensions in each vessel.
- t 0
- Particle size analyzer 80 is a single particle optical sensor (SPOS) and includes a laser diode 82 which projects a light beam 83 through beam shaping optics 84 and an optical flow cell 86 to a photo detector 88.
- Particle size analyzer 80 preferably operates on the light extinction (LE) principle, although, as explained above, for certain applications may be of the light scattering (LS) type, or use a combined sensor design LE + LS.
- the analyzer provides a particle size distribution (PSD).
- PSD particle size distribution
- a suitable pump means70 e.g., a third syringe pump
- the stressed dispersion to be analyzed is drawn through the optical flow cell 86 at a prescribed flow rate.
- the total volume of fluid that flows through the cell is determined by the volume originally available in the sample batch vessel (and the anticipated total number of discrete analyses, separated over the total elapsed time of testing) and the desired statistical accuracy of the resulting PSD.
- the signal produced by particles of appropriate size (i.e., d > do) that pass through SPOS-type particle size analyzer 80 is, after appropriate conditioning in signal conditioner 90, analyzed using appropriate electronic circuits in computer controller/processor 100 (typically, but not necessarily, the same as the computer that is used to control the other subsystems).
- computer controller/processor 100 typically, but not necessarily, the same as the computer that is used to control the other subsystems.
- a PSD is obtained, which reveals information about the state of agglomeration of the particles (e.g., those comprising the large-particle "tail" of the PSD).
- Predetermined quantities of each of the stressed sample batches, plus (optionally) the unstressed control sample batch are likewise caused to pass one at a time through the particle size analyzer subsystem 80 at predetermined time intervals following the initial dispensing of the stress factor into each sample batch vessel.
- the predetermined quantities of each of the sample batches can be fed in parallel at the same time through corresponding particle size analyzer subsystems.
- the PSD is obtained for each stressed sample batch at each value of elapsed time, t, for that batch.
- the value of the PDP (i.e., for d > do) is further calculated by the system computer, with appropriate corrections made in the final computed PDP values to reflect the addition of different volumes of stress factor fluid(s).
- the set of results, PDP vs t, thus obtained for each stressed sample batch constitutes the "raw data" for the accelerated stress testing of the sample dispersion of interest, as described earlier.
- the computer is used to obtain other derived quantities of interest, used to characterize the stability and/or quality of the dispersion, as described above.
- PDP itself, for any given value of elapsed time, t, and quantities related to the PDP, including, but not limited to, the partial derivatives, ⁇ (PDP)/ ⁇ t
- autosampler 38 schematically indicates that pipes 56 from pump 52 and pipes 66 from pump 62 may be moved for dispensing original sample or stress factor into a selected vessel 40, 41, 42, or 43, and that a pipe 72 is moved to drain liquid from a selected vessel 40, 41, 42, or 43 through pump 70, it is to be understood that other means, such as a computer controlled valve system, may be used for managing the fluid movement as required.
- SPOS-type particle size analyzer subsystem 80 shown in Fig. 22 one could substitute other types of particle size detectors.
- Some examples of potentially useful technology that can be employed include those mentioned above: electrical resistive pore, dynamic light scattering, laser diffraction (i.e., Mie scattering and/or Fraunhofer diffraction), ultrasound attenuation, among others.
- the value of X will increase monotonically with the extent of particle agglomeration due to stressing of the dispersion, assuming that the instrumentation has been properly designed.
- the longer the elapsed time for a given level of applied stress the greater in general will be the measured value of X.
- the greater the level of applied stress for a given length of elapsed time the greater in general will be the value of X.
- quantities derived from the measured quantity, X that can be used to characterize the stability or quality of the dispersion being tested.
- the particle size analyzer 80 of Fig. 22 is replaced by a sensor 180, which includes a light source 182 projecting a light beam 184 through a flow cell 186.
- the light beam then strikes a photo sensor 188, which serves as a turbidity detector.
- An increase in particle agglomeration in the sample dispersion results in a decrease in the intensity of the light beam as it passes through flow cell 186.
- a decrease of the signal V x as detected by turbidity detector 188 thus indicates an increase in the agglomeration of particle signifying a lower quality dispersion sample.
- Signal V x is fed from turbidity detector 188 through a schematic switch 189 to a signal conditioner 190 to computer controller/processor 100 to generate quality X derived from signal V x.
- a light scattering detector 192 receives light scattered from particles in flow cell 186.
- An increase in the agglomeration of particles results in an increase in scattered light striking photo detector 192 resulting in an increase in a signal V x generated in detector 192 signifies an increase in agglomeration and a lowering of the quality of the sample dispersion.
- the signal V x is fed through switch 189 to signal conditioner 190 and computer controller/processor 100 to provide the quantity X derived from signal V x .
- the stability of certain dispersions under investigation may be "multi-dimensional" - i.e., it may be conferred by more than one physical mechanism.
- the most effective stress testing of such a dispersion might call for the simultaneous application of more than one type of stress factor - i. e., through the use of a multi-dimensional stress factor.
- a given dispersion may be stable by virtue of the particles being relatively highly charged and also there being relatively few mobile ions between the particles.
- a multi-dimensional stress factor may be specifically engineered by combining two or more of the stress factors utilized singly in the embodiments described herein, applied in various combinations and concentrations/intensities. Again, these include: addition of acid (or base); addition of adsorbing electrolyte; and addition of non-adsorbing salt.
- the main purpose of the stress factors is to quantitatively identify the net effect of perturbations of existing interparticle stability, which in charge-stabilized dispersions is governed by the magnitude of V MAX
- the methods outlined in this invention permit calibration of the degradation of the underlying stability of the dispersion by systematic titration of V MAX .
- L-SPOS an exquisitely sensitive particle sizing capability
- PDP dependent outcome variable
- This approach constitutes a form of "parallel processing," in which the effects of different levels of stress are measured using as many sample batches as there are stress levels.
- This "brute-force" approach is particularly appropriate when a relatively new dispersion - i.e., one that has not been well characterized with respect to stability and/or quality - is being investigated by accelerated stress testing.
- This approach is effective for establishing an optimal stress "profile" for the dispersion of interest - i. e., for establishing an effective range of stress levels for a given stress factor.
- This useful first step would typically be applied in a research and development phase, prior to the start of routine manufacturing of the dispersion of interest.
- the resulting plot of PDP vs t can be expected to consist of a monotonically increasing ("concave up") curve, in which the detailed behavior of the curve - i.e. ⁇ (PDP)/ ⁇ t vs t- reveals the underlying stability of the dispersion of interest. The more stable the starting (unstressed) dispersion, the "flatter” (less-curved) the resulting plot of PDP vs t, for a given set of increasing applied stress levels. Comparison of the resulting curve with a reference, or benchmark, curve obtained previously for a sample of known, acceptable stability would permit the quality of the production batch to be monitored and verified.
- novel methods of this invention are based on the supposition that the response of a given dispersion - i. e., the growth in particle agglomeration over a given size range, d ⁇ do , measured by SPOS or another sufficiently sensitive technique - to the application of a given stress factor is a sensitive and reproducible function of the magnitude of the stress level, the elapsed time and the underlying stability of the dispersion.
- the relative stability of a given type of dispersion or emulsion can be judged from the behavior of PDP vs t (elapsed time after application of stress) for one or more levels (i.e., magnitudes) of applied stress.
- PDP vs t elapsed time after application of stress
- levels i.e., magnitudes
- This concept can be more easily understood by comparing hypothetical and actual plots of PDP vs t for dispersions that are either more or less stable (i.e., higher or lower quality, respectively) than the particular sample that is being evaluated using the methods of this invention.
- Fig. 24A contains two sets of plots of PDP vs t, pH.
- the other set of plots indicates a "hypothetical" response from a similar, but morse stable, emulsion.
- the solid curves (and related data points) are identical to the results shown in Fig.
- the magnitude of the response - i.e., the extent of droplet coalescence - is lower for any given value of t, given the (presumed) greater stability of the hypothetical sample before the application of stress.
- the difference in the PDP values obtained for the actual and hypothetical samples, for any given value of t, is expected to grow with increasing stress level, for reasons discussed previously.
- Fig. 24B shows a similar comparison between actual and hypothetical PDP vs t, pH results, assuming that the hypothetical emulsion (dashed curves) is even more stable than the one represented in Fig. 24A .
- the hypothetical emulsion dashed curves
- Figs. 24B shows a similar comparison between actual and hypothetical PDP vs t, pH results, assuming that the hypothetical emulsion (dashed curves) is even more stable than the one represented in Fig. 24A .
- 25A and 25B show comparisons between actual and hypothetical PDP vs t, pH plots for the same kind of emulsion, where the two hypothetical samples (dashed curves) are moderately less stable and considerably less stable, respectively, than the actual sample tested (solid curves, same in all figures).
- the vegetable fat emulsion (plus destabilizing mixed ionic species) was subjected to acid (i.e., reduced pH) stress, with the results shown in Fig. 18 and Table IV.
- the measured response of the emulsion, the PDP was found to increase approximately linearly with elapsed time, t, for each level of applied stress, or pH value.
- the endpoint of the accelerated stress study predictions described herein is contingent upon the nature of the individual product being analyzed and its applications, together with what are considered to be acceptable stability criteria. For example, in the case of a very costly (i.e., valuable) product, for which a decision to accept or reject a manufactured batch based on accelerated stress testing has great economic consequences, application of this invention should be based on highly specific endpoints that minimize the number of false positives. That is, the specificity of the test(s) should be as close to 100% as possible, recognizing that there will be a higher tolerance for false negatives.
- the outcome of applying a stress factor to a given dispersion or emulsion should be based on highly sensitive endpoints(s) that minimize the number of false negatives . That is, the sensitivity of the test(s) should be as close to 100% as possible, recognizing that there will necessarily be a higher tolerance for false positives, because the outcome may be a matter of life or death.
- sensitivity bears an inverse relationship to specificity - i.e., as sensitivity increases, specificity decreases, and vice-versa.
- the usual technique that relates sensitivity and specificity is known as the receiver/operating characteristic.
- the present invention is intended to be used for evaluating the quality of dispersions and emulsions, where the response obtained by selective particle size analysis is highly sensitive and/or specific in identifying inferior products, ideally prior to their use or administration.
- the procedures taught in this invention have been portrayed as "performance assessment" methods, to be employed at the end of a production cycle, prior to packaging, as well as for testing a certain number of final packaged units prior to commercial distribution.
- Critical “moments” in the manufacturing of dispersions or emulsions on any scale can occur at key processing intervals. These moments are frequently related to different mixing or application steps; the physicochemical conditions are specific to the composition, processing or final use of the dispersion, or emulsion, as well as to the individual manufacturer. The critical moments may also differ even when the dispersion is produced by the same manufacturer, but made at different production sites. Thus, application of the methods taught in this invention will permit optimization of many aspects of the manufactured product throughout its production and life-use cycle.
- the industrial or private manufacturer of a commercial or specially-prepared dispersion or emulsion may not only improve its final quality or safety profile, but also extend the shelf-life customarily assigned to currently available products, further decreasing the potential for economic loss or waste.
- the application of the methods introduced herein may also improve the physicochemical tolerance of the product to stresses that may occur during the transport, storage and final use condition to which it will be exposed or applied by the end-user. These include high-risk events that can occur during the handling of the product at any level until use.
- the methods described herein will be uniquely applied in ways that, in many cases, are proprietary in nature. For example, these may depend on (but are not limited to), the following general conditions: composition of the dispersion or emulsion; types of stress factors applied; means of achieving the desired dispersion or emulsion (e.g., mechanical stirring, milling, homogenization, polymerization, etc.); sequences of mixing; experience of production personnel; and physical conditions of manufacturing, transportation and end-user environments.
Landscapes
- Chemical & Material Sciences (AREA)
- Health & Medical Sciences (AREA)
- Life Sciences & Earth Sciences (AREA)
- General Physics & Mathematics (AREA)
- Physics & Mathematics (AREA)
- Analytical Chemistry (AREA)
- Biochemistry (AREA)
- General Health & Medical Sciences (AREA)
- Immunology (AREA)
- Pathology (AREA)
- Engineering & Computer Science (AREA)
- Food Science & Technology (AREA)
- Dispersion Chemistry (AREA)
- Medicinal Chemistry (AREA)
- Colloid Chemistry (AREA)
- Measuring Or Testing Involving Enzymes Or Micro-Organisms (AREA)
Claims (29)
- Procédé pour déterminer une mesure de la stabilité d'un échantillon comprenant une dispersion de particules de gouttelettes solides ou liquides suspendues dans un support liquide, procédé dans lequel une barrière d'énergie potentielle interparticulaire empêche les particules voisines de s'approcher assez près les unes des autres pour permettre une agglomération irréversible due à de fortes forces d'attraction de courte portée, ledit procédé comprenant les étapes :d"application d'un facteur de contrainte audit échantillon pour réduire une hauteur de ladite barrière d'énergie potentielle interparticulaire de manière à accélérer l'agglomération des particules, ledit facteur de contrainte comprenant un changement de la valeur de pH, l'addition d'un électrolyte absorbant ou l'addition d'un sel,ledit procédé étant caractérisé par les étapes :de calcul d'un taux de changement d'un pourcentage de phase dispersée (PDP) associé aux particules d'une taille prédéterminée représentant des agglomérats de particules avec le temps écoulé pour un niveau appliqué de facteur de contrainte etde détection d'une augmentation de ladite agglomération de particules après le passage d'un temps Δt comme mesure de la stabilité.
- Procédé selon la revendication 1 dans lequel ledit facteur de contrainte réduit une charge de surface sur lesdites particules en modifiant la valeur de pH dudit échantillon.
- Procédé selon la revendication 2 dans lequel lesdites particules ont une charge négative nette et dans lequel ledit facteur de contrainte est un acide ou un acide tamponné ajouté audit échantillon pour réduire la valeur de pH dudit échantillon en réduisant ainsi la charge négative nette sur les particules.
- Procédé selon la revendication 2 dans lequel lesdites particules ont une charge positive nette et dans lequel ledit facteur de contrainte est une base ou une base tamponnée ajoutée audit échantillon pour augmenter la valeur de pH dudit échantillon en réduisant ainsi la charge positive nette sur les particules.
- Procédé selon la revendication 1 dans lequel ledit facteur de contrainte est un électrolyte absorbant ajouté audit échantillon permettant à des ions dissociés de charge appropriée d'être adsorbés aux surcharges de charge opposée desdites particules pour réduire une charge nette sur lesdites particules.
- Procédé selon la revendication 5 dans lequel lesdites particules ont une charge négative nette et lesdits ions dissociés de l'électrolyte adsorbant comprennent des ions à charge positive qui se lient aux surfaces desdites particules et qui réduisent la charge nette sur lesdites particules et qui réduisent ainsi ladite hauteur de ladite barrière d'énergie potentielle interparticulaire.
- Procédé selon la revendication 1 dans lequel ledit facteur de contrainte est un sel ajouté audit échantillon donnant lieu à des ions mobiles dissociés qui filtrent partiellement des répulsions électrostatiques entre des particules chargées es favorisant ainsi leur agglomération.
- Procédé selon la revendication 7 dans lequel ledit facteur de contrainte est appliqué en tant que sel monovalent simple.
- Procédé selon la revendication 8 dans lequel ledit sel monovalent est du chlorure de sodium.
- Procédé selon la revendication 1 dans lequel ledit facteur de contrainte est appliqué en incréments successifs à des intervalles de temps espacés résultant en des niveaux de contrainte successivement plus élevés dans ledit échantillon devant être affecté par la contrainte et ladite étape de détection de l'augmentation de ladite agglomération de particules est répétée après chaque incrément de facteur de contrainte.
- Procédé selon la revendication 1 dans lequel ledit échantillon est divisé en deux lots ou plus, dans lequel chaque étape d'application dudit facteur de contrainte audit échantillon comprend l'application de différents niveaux dudit facteur de contrainte à chaque lot et dans lequel ladite étape de détection de l'augmentatîon de ladite agglomération de particules dans chaque lot est réalisée après le passage d'un ou plusieurs intervalles de temps Δt.
- Procédé selon la revendication 1 prévoyant de plus un lot de contrôle de chaque échantillon, l'application d'aucun facteur de contrainte audit lot de contrôle et la détection de l'augmentation de l'agglomération des particules dans ledit lot de contrôle après le passage dudit intervalle de temps Δt.
- Procédé selon la revendication 11 dans lequel immédiatement après avoir effectué ladite application dudit facteur de contrainte il y a une étape de détection de l'étendue de l'agglomération des particules dans chacun desdits lots.
- Procédé selon la revendication 11 dans lequel ladite étape de détection de l'augmentation de ladite agglomération des particules comprend de plus la mesure d'une distribution de taille des particules (PSD) de chaque lot sur un nombre approprié de tailles de particules et le calcul d'un pourcentage de la phase dispersée (PDP) qui décrit la fraction du volume de particules total contenu dans la queue de particules aberrantes de grand diamètre représentant des agglomérats de particules pour chaque distribution de taille de particules PSD mesurée.
- Procédé selon la revendication 14 comprenant de plus le calcul d'un taux de changement dudit PDP avec le temps écoulé pour chaque niveau de facteur de contrainte mentionné.
- Procédé selon la revendication 15 dans lequel un facteur de mérite (FM) pour ledit échantillon est dérive dudit taux de changement dudit PDP avec le temps écoulé pour un niveau de facteur de mérite donné, cependant que des dispersions ou des émulsions stables auront des valeurs de FM relativement petites et que des dispersions ou émulsions inférieures, moins stables auront des valeurs de FM relativement grandes.
- Procédé selon la revendication 14 comprenant de plus le calcul de l'augmentation dudit PDP par unité de variation dans ledit niveau de facteur de contrainte pour une valeur donnée de temps écoulé.
- Procédé selon la revendication 17 dans lequel un facteur de mérite (FM) est dérivé de ladite augmentation dudit PDP par unité de variation dans ledit niveau de facteur de contrainte pour une valeur donnée de temps écoulé, ledit temps écoulé étant suffisamment long pour permettre une accélération d'instabilité mesurable et une augmentation détectable résultante de l'agglomération de particules à établir, cependant que plus la valeur de FM est grande pour une valeur donnée de temps écoulé et un niveau donné de facteur de contrainte appliqué, moins ledit échantillon est stable.
- Appareil pour déterminer la stabilité d'un comprenant une dispersion de particules de gouttelettes solides ou liquides suspendues dans un support liquide, procédé dans lequel une barrière d'énergie potentielle interparticulaire empêche les particules voisines de s'approcher assez près les unes des autres pour permettre une agglomération irréversible due à de fortes forces d'attraction de faible portée, ledit appareil comprenant :des moyens (50) pour fournir ledit échantillon à un récipient d'essai (40, 41, 42, 43),des moyens (60) qui appliquent un facteur de contrainte audit échantillon dans ledit récipient pour réduire une hauteur de ladite barrière d'énergie potentielle interparticulaire de manière à accélérer l'agglomération de particules par une modification de valeur de pH par une adsorption sélective d'ions chargés ou par l'addition d'ions chargés mobiles,caractérisé de plus endes moyens (100) adaptés pour calculer un taux de changement d'un pourcentage de phase dispersée (PDP) associé aux particules de taille prédéterminée représentant des agglomérats de particules avec un temps écoulé pour un niveau de facteur de contrainte appliqué donné et des moyens (80, 180) adaptés pour détecter une augmentation de ladite agglomération de particules après un passage de temps Δt comme mesure de la stabilité.
- Appareil selon la revendication 19 dans lequel lesdits moyens pour détecter ladite agglomération de particules comprend un détecteur haute sensibilité (80, 180).
- Appareil selon la revendication 20 dans lequel ledit détecteur haute sensibilité est un détecteur de particule unique (80).
- Appareil selon la revendication 21 dans lequel ledit détecteur est un détecteur optique de particule unique (SPOS).
- Appareil selon la revendication 20 dans lequel ledit détecteur haute sensibilité (80, 180) comprend un détecteur détectant une valeur X en réponse aux dites particules qui passent à travers une région donnée pour un intervalle de temps donné.
- Appareil selon la revendication 23 dans lequel ladite valeur X est une mesure de l'atténuation de la lumiére en réponse à la turbidité de ladite dispersion de l'échantillon.
- Appareil selon la revendication 23 dans lequel ladite valeur X est une mesure de l'intensité de lumière dispersée sur une plage donnée d'angles desdites particules de ladite dispersion de l'échantillon.
- Appareil selon la revendication 19 dans lequel lesdits moyens (80, 180) pour détecter une augmentation de ladite agglomération de particules comprend des moyens quantitatifs sensibles pour déterminer la mesure dans laquelle ledit échantillon est devenu moins stable en vertu de ladite application dudit facteur de contrainte.
- Appareil selon la revendication 26 dans lequel lesdits moyens quantitatifs sensibles produisent une distribution de taille de particules (PSD) qui montre la concentration de particules comme fonction de la taille sur une plage de tailles de particules normales et une queue de particules aberrantes de grand diamètre plus grandes que lesdites tailles de particules normales et indiquant des agglomérats de particules.
- Appareil selon la revendication 26 dans lequel lesdits moyens pour détecter une augmentation de ladite agglomération de taille comprend un détecteur qui détecte une valeur X en réponse aux dites particules qui passent à travers une région donnée pour un intervalle de temps donné.
- Appareil selon la revendication 19 comprenant de plus des moyens pour amener ledit échantillon dudit conteneur de test aux moyens de détection mentionnés pour détecter l'augmentation de ladite agglomération de particules après que ledit facteur de contrainte ait été appliqué audit échantillon dans ledit conteneur.
Applications Claiming Priority (3)
| Application Number | Priority Date | Filing Date | Title |
|---|---|---|---|
| PCT/US2003/016220 WO2004010113A1 (fr) | 2002-07-17 | 2003-06-18 | Capteurs et procede de comptage et de mesure de la grosseur des particules optiques de haute sensibilite |
| US10/606,959 US7150996B2 (en) | 2003-06-18 | 2003-06-27 | Stability assessment of dispersions and emulsions |
| PCT/US2004/016612 WO2005001471A1 (fr) | 2003-06-18 | 2004-06-14 | Evaluation de stabilite acceleree de dispersions et d'emulsions |
Publications (3)
| Publication Number | Publication Date |
|---|---|
| EP1656552A1 EP1656552A1 (fr) | 2006-05-17 |
| EP1656552A4 EP1656552A4 (fr) | 2007-07-11 |
| EP1656552B1 true EP1656552B1 (fr) | 2014-03-26 |
Family
ID=33554653
Family Applications (1)
| Application Number | Title | Priority Date | Filing Date |
|---|---|---|---|
| EP04753441.7A Expired - Lifetime EP1656552B1 (fr) | 2003-06-18 | 2004-06-14 | Evaluation de stabilite acceleree de dispersions et d'emulsions |
Country Status (4)
| Country | Link |
|---|---|
| US (1) | US7150996B2 (fr) |
| EP (1) | EP1656552B1 (fr) |
| JP (1) | JP4444957B2 (fr) |
| WO (1) | WO2005001471A1 (fr) |
Families Citing this family (27)
| Publication number | Priority date | Publication date | Assignee | Title |
|---|---|---|---|---|
| US7213446B2 (en) * | 2004-08-27 | 2007-05-08 | Semmaterials, L.P. | Method of selecting a bituminous emulsion based on its coalescence |
| NZ555696A (en) * | 2004-12-10 | 2010-04-30 | Hercules Inc | Defoamer oil-in-water emulsion comprising hydrophobic particles of ethylene bis stearamide |
| EP1827647B1 (fr) | 2004-12-10 | 2013-11-13 | Hercules Incorporated | Anti-mousse pour des applications dans la fabrication de pate et de papier |
| CA2606380C (fr) * | 2005-05-03 | 2011-08-02 | The Procter & Gamble Company | Compositions comprenant des agregats et/ou des agglomerats de particules discretes destinees a l'application aux fibres keratineuses |
| US8557588B2 (en) * | 2007-03-27 | 2013-10-15 | Schlumberger Technology Corporation | Methods and apparatus for sampling and diluting concentrated emulsions |
| US7803320B2 (en) * | 2007-05-11 | 2010-09-28 | General Electric Company | Apparatus for quality control analysis of an on-site prepared pharmaceutical product |
| GB0812455D0 (en) * | 2008-07-08 | 2008-08-13 | Ici Ltd | Methods of and apparatus for determining properties relating to multi-phase systems |
| JP5554905B2 (ja) * | 2008-07-16 | 2014-07-23 | ポッカサッポロフード&ビバレッジ株式会社 | 分散液の安定性評価方法 |
| WO2010040371A1 (fr) * | 2008-10-07 | 2010-04-15 | Bio Explorer B.V. | Dispositif et procédé d'analyse automatique de micro-organismes dans un échantillon |
| US20100209512A1 (en) * | 2009-02-13 | 2010-08-19 | Stable Solutions Llc | Particle size-structured parenteral dispersions |
| US8993625B2 (en) | 2009-03-11 | 2015-03-31 | Stable Solutions Llc | Method of mitigating adverse drug events using omega-3 fatty acids as a parenteral therapeutic drug vehicle |
| US9034389B2 (en) | 2009-03-11 | 2015-05-19 | Stable Solutions Llc | Omega-3 enriched fish oil-in-water parenteral nutrition emulsions |
| US20110094320A1 (en) * | 2009-10-26 | 2011-04-28 | Liang Hong | Method for evaluating de-agglomeration/coagulation stability of agglomerates materials |
| EP2499478A4 (fr) * | 2009-11-13 | 2017-12-06 | Stable Solutions Llc | Profils de distribution de dimensions de particules et leur utilisation pour ajuster une caractéristique de dispersion |
| JP6321022B2 (ja) * | 2012-11-02 | 2018-05-09 | ローレンス リバモア ナショナル セキュリティー, エルエルシー | 表面活性を失うことなく荷電コロイドの凝集を阻止する方法 |
| US10281383B2 (en) * | 2012-11-15 | 2019-05-07 | Solenis Technologies, L.P. | System and methods of determining liquid phase turbidity of multiphase wastewater |
| US9834460B2 (en) * | 2013-12-19 | 2017-12-05 | Exxonmobil Upstream Research Company | Method and system for using subsea dispersants |
| JP5828012B2 (ja) * | 2014-02-21 | 2015-12-02 | ポッカサッポロフード&ビバレッジ株式会社 | 分散液の安定性評価方法 |
| US9182758B1 (en) * | 2014-02-28 | 2015-11-10 | Michael H S Dunlop | Computer-implemented system and method for capability zone-based manufacturing quality control |
| CN103940783A (zh) * | 2014-05-05 | 2014-07-23 | 光明乳业股份有限公司 | 一种预测灭菌乳保质期内稳定性的方法 |
| CN106092847B (zh) * | 2016-08-25 | 2019-05-03 | 青岛啤酒股份有限公司 | 一种评价白啤酒保质期内浑浊稳定性的方法 |
| CN106248603B (zh) * | 2016-09-27 | 2019-09-24 | 济南恒辉科济食品配料有限公司 | 食品悬浊和乳浊体系稳定性测定检测方法及检测装置 |
| JP6656641B1 (ja) * | 2018-11-16 | 2020-03-04 | サイデン化学株式会社 | 樹脂エマルションの機械的安定性評価方法 |
| CN111289687B (zh) * | 2018-12-06 | 2022-05-17 | 宝辰联合(廊坊)科技有限公司 | 一种建筑涂料用聚合物乳液耐碱性调整测试方法 |
| CN111044550B (zh) * | 2019-12-25 | 2023-06-30 | 苏州雄鹰笔墨新材料有限公司 | 一种快速测定墨水稳定性的方法 |
| KR102913785B1 (ko) * | 2025-05-09 | 2026-01-15 | 한국해양과학기술원 | 간이 탁도 평가 장치 및 이를 이용한 탁도 평가 방법 |
| CN121231185B (zh) * | 2025-12-02 | 2026-03-24 | 宁远华创粉体材料有限公司 | 一种碳酸钙颗粒度检测方法及系统 |
Citations (1)
| Publication number | Priority date | Publication date | Assignee | Title |
|---|---|---|---|---|
| US6263725B1 (en) * | 1998-09-18 | 2001-07-24 | Alberta Research Council Inc. | On-line sensor for colloidal substances |
Family Cites Families (10)
| Publication number | Priority date | Publication date | Assignee | Title |
|---|---|---|---|---|
| US3956000A (en) * | 1972-07-21 | 1976-05-11 | Hoechst Aktiengesellschaft | Fluorocarbon waxes and process for producing them |
| US3950547A (en) * | 1974-08-26 | 1976-04-13 | Syntex (U.S.A.) Inc. | Dietary composition and methods of preparing |
| US5378609A (en) * | 1988-12-28 | 1995-01-03 | Ivan E. Modrovich | Lipase single reagent system |
| FR2656098B1 (fr) * | 1989-12-20 | 1992-04-24 | Inst Francais Du Petrole | Dispositif pour etudier le vieillissement d'un fluide en circulation, dans des conditions specifiques imposees. |
| US5319958A (en) * | 1990-03-13 | 1994-06-14 | Rikagaku Kenkyusho | Apparatus and method for evaluating phase change of emulsion |
| US5835211A (en) * | 1996-03-28 | 1998-11-10 | Particle Sizing Systems, Inc. | Single-particle optical sensor with improved sensitivity and dynamic size range |
| FR2760091B1 (fr) * | 1997-02-27 | 1999-10-15 | Elf Antar France | Procede et dispositif de mesure gravimetrique des caracteristiques de la separation d'un hydrocarbure liquide en plusieurs phases |
| DE19801442A1 (de) * | 1998-01-16 | 1999-07-22 | Basf Ag | Verfahren zur Verbesserung der Stabilität wässriger Polymerisatdispersionen |
| US5987969A (en) * | 1998-02-25 | 1999-11-23 | Intevep, S.A. | Apparatus and method for determining dynamic stability of emulsions |
| US6794671B2 (en) * | 2002-07-17 | 2004-09-21 | Particle Sizing Systems, Inc. | Sensors and methods for high-sensitivity optical particle counting and sizing |
-
2003
- 2003-06-27 US US10/606,959 patent/US7150996B2/en not_active Expired - Lifetime
-
2004
- 2004-06-14 EP EP04753441.7A patent/EP1656552B1/fr not_active Expired - Lifetime
- 2004-06-14 JP JP2006517148A patent/JP4444957B2/ja not_active Expired - Fee Related
- 2004-06-14 WO PCT/US2004/016612 patent/WO2005001471A1/fr not_active Ceased
Patent Citations (1)
| Publication number | Priority date | Publication date | Assignee | Title |
|---|---|---|---|---|
| US6263725B1 (en) * | 1998-09-18 | 2001-07-24 | Alberta Research Council Inc. | On-line sensor for colloidal substances |
Non-Patent Citations (1)
| Title |
|---|
| NICOLI D; ET AL: "Particle size analysis of colloidal suspensions by SPOS compared to DLS: a sensitive indicator of quality and stability", AMERICAN LABORATORY, CT, vol. 33, no. 1, 1 January 2001 (2001-01-01), pages 32,34,36 - 38,39, XP002904317, ISSN: 0044-7749 * |
Also Published As
| Publication number | Publication date |
|---|---|
| US7150996B2 (en) | 2006-12-19 |
| JP2006527854A (ja) | 2006-12-07 |
| JP4444957B2 (ja) | 2010-03-31 |
| EP1656552A4 (fr) | 2007-07-11 |
| WO2005001471A1 (fr) | 2005-01-06 |
| US20040265177A1 (en) | 2004-12-30 |
| EP1656552A1 (fr) | 2006-05-17 |
Similar Documents
| Publication | Publication Date | Title |
|---|---|---|
| EP1656552B1 (fr) | Evaluation de stabilite acceleree de dispersions et d'emulsions | |
| Cameron et al. | Determination of interfacial areas in emulsions using turbidimetric and droplet size data: correction of the formula for emulsifying activity index | |
| Kulkarni et al. | Effects of polyethylene glycol on protein interactions | |
| Bolle et al. | Kinetics of salt-induced aggregation in polystyrene lattices studied by quasielastic light scattering | |
| Driscoll et al. | Physicochemical assessments of parenteral lipid emulsions: light obscuration versus laser diffraction | |
| EP0638164B1 (fr) | Mesure des proprietes d'une boue | |
| Sharma et al. | Measurement of colloidal stability in solutions of simple, nonadsorbing polyelectrolytes | |
| CN106383098A (zh) | 一种液体样品稳定性检测方法及装置 | |
| Sandkühler et al. | Kinetics of aggregation and gel formation in concentrated polystyrene colloids | |
| Chanamai et al. | Ultrasonic spectroscopy study of flocculation and shear-induced floc disruption in oil-in-water emulsions | |
| Tirado-Miranda et al. | Colloidal clusters with finite binding energies: Fractal structure and growth mechanism | |
| Polowczyk et al. | Stability of three‐phase water‐particle‐oil systems | |
| Gonyon et al. | Physicochemical stability of lipid injectable emulsions: correlating changes in large globule distributions with phase separation behavior | |
| Prescott et al. | Characterization of polystyrene latexes by hydrodynamic and electrophoretic fingerprinting | |
| Buffo et al. | Shelf‐life and mechanisms of destabilization in dilute beverage emulsions | |
| Matsumiya et al. | Evaluation of long-term stability of milk beverages by a novel method for rapid determination of aggregation forces between colloidal particles | |
| CN102879317B (zh) | 分散相和乳化液的加速稳定性评估 | |
| EP2309254B1 (fr) | Procédé et dispositif pour évaluer la stabilité d'une dispersion | |
| Kato et al. | Simultaneous measurement of size and density of spherical particles using two-dimensional particle tracking analysis method | |
| US20230083183A1 (en) | Liquid crystal emulsions stabilized by nanoparticles | |
| Elimelech | The effect of particle size on the kinetics of deposition of Brownian particles in porous media | |
| Gregory | Particle aggregation: modeling and measurement | |
| CN1839312A (zh) | 分散相和乳化液的加速稳定性评估 | |
| Couteau et al. | A colloidal silica reference material for nanoparticle sizing by means of dynamic light scattering and centrifugal liquid sedimentation | |
| Robins | Particle size analysis in food |
Legal Events
| Date | Code | Title | Description |
|---|---|---|---|
| PUAI | Public reference made under article 153(3) epc to a published international application that has entered the european phase |
Free format text: ORIGINAL CODE: 0009012 |
|
| 17P | Request for examination filed |
Effective date: 20051217 |
|
| AK | Designated contracting states |
Kind code of ref document: A1 Designated state(s): AT BE BG CH CY CZ DE DK EE ES FI FR GB GR HU IE IT LI LU MC NL PL PT RO SE SI SK TR |
|
| DAX | Request for extension of the european patent (deleted) | ||
| A4 | Supplementary search report drawn up and despatched |
Effective date: 20070608 |
|
| RIC1 | Information provided on ipc code assigned before grant |
Ipc: G01N 33/03 20060101AFI20070601BHEP |
|
| 17Q | First examination report despatched |
Effective date: 20090918 |
|
| GRAP | Despatch of communication of intention to grant a patent |
Free format text: ORIGINAL CODE: EPIDOSNIGR1 |
|
| INTG | Intention to grant announced |
Effective date: 20131025 |
|
| GRAS | Grant fee paid |
Free format text: ORIGINAL CODE: EPIDOSNIGR3 |
|
| GRAA | (expected) grant |
Free format text: ORIGINAL CODE: 0009210 |
|
| AK | Designated contracting states |
Kind code of ref document: B1 Designated state(s): AT BE BG CH CY CZ DE DK EE ES FI FR GB GR HU IE IT LI LU MC NL PL PT RO SE SI SK TR |
|
| REG | Reference to a national code |
Ref country code: GB Ref legal event code: FG4D |
|
| REG | Reference to a national code |
Ref country code: CH Ref legal event code: EP |
|
| REG | Reference to a national code |
Ref country code: AT Ref legal event code: REF Ref document number: 659240 Country of ref document: AT Kind code of ref document: T Effective date: 20140415 |
|
| REG | Reference to a national code |
Ref country code: IE Ref legal event code: FG4D |
|
| REG | Reference to a national code |
Ref country code: DE Ref legal event code: R096 Ref document number: 602004044685 Country of ref document: DE Effective date: 20140508 |
|
| REG | Reference to a national code |
Ref country code: SE Ref legal event code: TRGR |
|
| REG | Reference to a national code |
Ref country code: AT Ref legal event code: MK05 Ref document number: 659240 Country of ref document: AT Kind code of ref document: T Effective date: 20140326 |
|
| REG | Reference to a national code |
Ref country code: NL Ref legal event code: VDEP Effective date: 20140326 |
|
| PG25 | Lapsed in a contracting state [announced via postgrant information from national office to epo] |
Ref country code: FI Free format text: LAPSE BECAUSE OF FAILURE TO SUBMIT A TRANSLATION OF THE DESCRIPTION OR TO PAY THE FEE WITHIN THE PRESCRIBED TIME-LIMIT Effective date: 20140326 |
|
| PGFP | Annual fee paid to national office [announced via postgrant information from national office to epo] |
Ref country code: AT Payment date: 20140528 Year of fee payment: 11 Ref country code: CH Payment date: 20140627 Year of fee payment: 11 |
|
| PGFP | Annual fee paid to national office [announced via postgrant information from national office to epo] |
Ref country code: DK Payment date: 20140610 Year of fee payment: 11 |
|
| PG25 | Lapsed in a contracting state [announced via postgrant information from national office to epo] |
Ref country code: CZ Free format text: LAPSE BECAUSE OF FAILURE TO SUBMIT A TRANSLATION OF THE DESCRIPTION OR TO PAY THE FEE WITHIN THE PRESCRIBED TIME-LIMIT Effective date: 20140326 Ref country code: EE Free format text: LAPSE BECAUSE OF FAILURE TO SUBMIT A TRANSLATION OF THE DESCRIPTION OR TO PAY THE FEE WITHIN THE PRESCRIBED TIME-LIMIT Effective date: 20140326 Ref country code: RO Free format text: LAPSE BECAUSE OF FAILURE TO SUBMIT A TRANSLATION OF THE DESCRIPTION OR TO PAY THE FEE WITHIN THE PRESCRIBED TIME-LIMIT Effective date: 20140326 Ref country code: CY Free format text: LAPSE BECAUSE OF FAILURE TO SUBMIT A TRANSLATION OF THE DESCRIPTION OR TO PAY THE FEE WITHIN THE PRESCRIBED TIME-LIMIT Effective date: 20140326 Ref country code: NL Free format text: LAPSE BECAUSE OF FAILURE TO SUBMIT A TRANSLATION OF THE DESCRIPTION OR TO PAY THE FEE WITHIN THE PRESCRIBED TIME-LIMIT Effective date: 20140326 Ref country code: BG Free format text: LAPSE BECAUSE OF FAILURE TO SUBMIT A TRANSLATION OF THE DESCRIPTION OR TO PAY THE FEE WITHIN THE PRESCRIBED TIME-LIMIT Effective date: 20140626 |
|
| PGFP | Annual fee paid to national office [announced via postgrant information from national office to epo] |
Ref country code: NL Payment date: 20140610 Year of fee payment: 11 |
|
| PG25 | Lapsed in a contracting state [announced via postgrant information from national office to epo] |
Ref country code: ES Free format text: LAPSE BECAUSE OF FAILURE TO SUBMIT A TRANSLATION OF THE DESCRIPTION OR TO PAY THE FEE WITHIN THE PRESCRIBED TIME-LIMIT Effective date: 20140326 Ref country code: SK Free format text: LAPSE BECAUSE OF FAILURE TO SUBMIT A TRANSLATION OF THE DESCRIPTION OR TO PAY THE FEE WITHIN THE PRESCRIBED TIME-LIMIT Effective date: 20140326 Ref country code: PL Free format text: LAPSE BECAUSE OF FAILURE TO SUBMIT A TRANSLATION OF THE DESCRIPTION OR TO PAY THE FEE WITHIN THE PRESCRIBED TIME-LIMIT Effective date: 20140326 |
|
| PG25 | Lapsed in a contracting state [announced via postgrant information from national office to epo] |
Ref country code: PT Free format text: LAPSE BECAUSE OF FAILURE TO SUBMIT A TRANSLATION OF THE DESCRIPTION OR TO PAY THE FEE WITHIN THE PRESCRIBED TIME-LIMIT Effective date: 20140728 |
|
| REG | Reference to a national code |
Ref country code: DE Ref legal event code: R097 Ref document number: 602004044685 Country of ref document: DE |
|
| PG25 | Lapsed in a contracting state [announced via postgrant information from national office to epo] |
Ref country code: DK Free format text: LAPSE BECAUSE OF FAILURE TO SUBMIT A TRANSLATION OF THE DESCRIPTION OR TO PAY THE FEE WITHIN THE PRESCRIBED TIME-LIMIT Effective date: 20140326 Ref country code: LU Free format text: LAPSE BECAUSE OF FAILURE TO SUBMIT A TRANSLATION OF THE DESCRIPTION OR TO PAY THE FEE WITHIN THE PRESCRIBED TIME-LIMIT Effective date: 20140614 Ref country code: MC Free format text: LAPSE BECAUSE OF FAILURE TO SUBMIT A TRANSLATION OF THE DESCRIPTION OR TO PAY THE FEE WITHIN THE PRESCRIBED TIME-LIMIT Effective date: 20140326 |
|
| PLBE | No opposition filed within time limit |
Free format text: ORIGINAL CODE: 0009261 |
|
| STAA | Information on the status of an ep patent application or granted ep patent |
Free format text: STATUS: NO OPPOSITION FILED WITHIN TIME LIMIT |
|
| 26N | No opposition filed |
Effective date: 20150106 |
|
| REG | Reference to a national code |
Ref country code: IE Ref legal event code: MM4A |
|
| PG25 | Lapsed in a contracting state [announced via postgrant information from national office to epo] |
Ref country code: IT Free format text: LAPSE BECAUSE OF FAILURE TO SUBMIT A TRANSLATION OF THE DESCRIPTION OR TO PAY THE FEE WITHIN THE PRESCRIBED TIME-LIMIT Effective date: 20140326 |
|
| REG | Reference to a national code |
Ref country code: DE Ref legal event code: R097 Ref document number: 602004044685 Country of ref document: DE Effective date: 20150106 |
|
| PG25 | Lapsed in a contracting state [announced via postgrant information from national office to epo] |
Ref country code: IE Free format text: LAPSE BECAUSE OF NON-PAYMENT OF DUE FEES Effective date: 20140614 |
|
| PG25 | Lapsed in a contracting state [announced via postgrant information from national office to epo] |
Ref country code: SI Free format text: LAPSE BECAUSE OF FAILURE TO SUBMIT A TRANSLATION OF THE DESCRIPTION OR TO PAY THE FEE WITHIN THE PRESCRIBED TIME-LIMIT Effective date: 20140326 |
|
| REG | Reference to a national code |
Ref country code: CH Ref legal event code: PL |
|
| PG25 | Lapsed in a contracting state [announced via postgrant information from national office to epo] |
Ref country code: LI Free format text: LAPSE BECAUSE OF NON-PAYMENT OF DUE FEES Effective date: 20150630 Ref country code: CH Free format text: LAPSE BECAUSE OF NON-PAYMENT OF DUE FEES Effective date: 20150630 |
|
| REG | Reference to a national code |
Ref country code: FR Ref legal event code: PLFP Year of fee payment: 13 |
|
| PG25 | Lapsed in a contracting state [announced via postgrant information from national office to epo] |
Ref country code: GR Free format text: LAPSE BECAUSE OF FAILURE TO SUBMIT A TRANSLATION OF THE DESCRIPTION OR TO PAY THE FEE WITHIN THE PRESCRIBED TIME-LIMIT Effective date: 20140627 |
|
| PG25 | Lapsed in a contracting state [announced via postgrant information from national office to epo] |
Ref country code: HU Free format text: LAPSE BECAUSE OF FAILURE TO SUBMIT A TRANSLATION OF THE DESCRIPTION OR TO PAY THE FEE WITHIN THE PRESCRIBED TIME-LIMIT; INVALID AB INITIO Effective date: 20040614 Ref country code: TR Free format text: LAPSE BECAUSE OF FAILURE TO SUBMIT A TRANSLATION OF THE DESCRIPTION OR TO PAY THE FEE WITHIN THE PRESCRIBED TIME-LIMIT Effective date: 20140326 |
|
| PG25 | Lapsed in a contracting state [announced via postgrant information from national office to epo] |
Ref country code: AT Free format text: THE PATENT HAS BEEN ANNULLED BY A DECISION OF A NATIONAL AUTHORITY Effective date: 20140326 |
|
| REG | Reference to a national code |
Ref country code: FR Ref legal event code: PLFP Year of fee payment: 14 |
|
| REG | Reference to a national code |
Ref country code: FR Ref legal event code: PLFP Year of fee payment: 15 |
|
| PGFP | Annual fee paid to national office [announced via postgrant information from national office to epo] |
Ref country code: FR Payment date: 20210513 Year of fee payment: 18 |
|
| PGFP | Annual fee paid to national office [announced via postgrant information from national office to epo] |
Ref country code: BE Payment date: 20210518 Year of fee payment: 18 Ref country code: SE Payment date: 20210610 Year of fee payment: 18 Ref country code: GB Payment date: 20210520 Year of fee payment: 18 |
|
| PGFP | Annual fee paid to national office [announced via postgrant information from national office to epo] |
Ref country code: DE Payment date: 20220420 Year of fee payment: 19 |
|
| REG | Reference to a national code |
Ref country code: SE Ref legal event code: EUG |
|
| REG | Reference to a national code |
Ref country code: BE Ref legal event code: MM Effective date: 20220630 |
|
| GBPC | Gb: european patent ceased through non-payment of renewal fee |
Effective date: 20220614 |
|
| PG25 | Lapsed in a contracting state [announced via postgrant information from national office to epo] |
Ref country code: SE Free format text: LAPSE BECAUSE OF NON-PAYMENT OF DUE FEES Effective date: 20220615 Ref country code: FR Free format text: LAPSE BECAUSE OF NON-PAYMENT OF DUE FEES Effective date: 20220630 |
|
| PG25 | Lapsed in a contracting state [announced via postgrant information from national office to epo] |
Ref country code: GB Free format text: LAPSE BECAUSE OF NON-PAYMENT OF DUE FEES Effective date: 20220614 Ref country code: BE Free format text: LAPSE BECAUSE OF NON-PAYMENT OF DUE FEES Effective date: 20220630 |
|
| REG | Reference to a national code |
Ref country code: DE Ref legal event code: R119 Ref document number: 602004044685 Country of ref document: DE |
|
| PG25 | Lapsed in a contracting state [announced via postgrant information from national office to epo] |
Ref country code: DE Free format text: LAPSE BECAUSE OF NON-PAYMENT OF DUE FEES Effective date: 20240103 |