EP1246093A2 - Verfahren und/oder Gerät zur Anzeige des optimierten Ergebnisses einer Struktur - Google Patents
Verfahren und/oder Gerät zur Anzeige des optimierten Ergebnisses einer Struktur Download PDFInfo
- Publication number
- EP1246093A2 EP1246093A2 EP02007413A EP02007413A EP1246093A2 EP 1246093 A2 EP1246093 A2 EP 1246093A2 EP 02007413 A EP02007413 A EP 02007413A EP 02007413 A EP02007413 A EP 02007413A EP 1246093 A2 EP1246093 A2 EP 1246093A2
- Authority
- EP
- European Patent Office
- Prior art keywords
- value
- wall thickness
- rigidity
- components
- basis
- Prior art date
- Legal status (The legal status is an assumption and is not a legal conclusion. Google has not performed a legal analysis and makes no representation as to the accuracy of the status listed.)
- Granted
Links
Images


Classifications
-
- G—PHYSICS
- G06—COMPUTING OR CALCULATING; COUNTING
- G06F—ELECTRIC DIGITAL DATA PROCESSING
- G06F30/00—Computer-aided design [CAD]
-
- G—PHYSICS
- G06—COMPUTING OR CALCULATING; COUNTING
- G06F—ELECTRIC DIGITAL DATA PROCESSING
- G06F30/00—Computer-aided design [CAD]
- G06F30/20—Design optimisation, verification or simulation
- G06F30/23—Design optimisation, verification or simulation using finite element methods [FEM] or finite difference methods [FDM]
-
- G—PHYSICS
- G06—COMPUTING OR CALCULATING; COUNTING
- G06F—ELECTRIC DIGITAL DATA PROCESSING
- G06F2111/00—Details relating to CAD techniques
- G06F2111/06—Multi-objective optimisation, e.g. Pareto optimisation using simulated annealing [SA], ant colony algorithms or genetic algorithms [GA]
Definitions
- the present invention relates to a method of and an apparatus for displaying a structure optimizing result, which are adapted to display a result for optimizing a structure composed of a plurality of components by sensitivity analysis.
- a structure optimization analyzing apparatus has been known, for example, from Japanese Patent Publication No. Hei 7-109383.
- a suitable condition is calculated on the basis of a sensitivity analysis result
- a condition close to the calculated result is selected on the basis of a standard database
- structure analysis is performed on the basis of the selected result.
- a condition close to the target condition is taken as an optimum condition on the basis of the analysis result.
- an optimum wall thickness value of each component obtained for realizing a rigidity balance under an ideally required specification may be often different from a standard wall thickness value of an actual material of each component. Accordingly, the rigidity balance of the structure is required to be obtained by changing the optimum wall thickness value of each component to a standard wall thickness value closest to the optimum wall thickness value, and recalculating the rigidity balance of the structure on the basis of the standard wall thickness value.
- a rigidity value calculated on the basis of an optimum wall thickness value of each of components of a structure is not perfectly equal to a rigidity value calculated on the basis of a standard wall thickness value close to the optimum value.
- the method fails to determine how much deviation exists between the rigidity calculated on the basis of a standard wall thickness value and the rigidity value under a required specification.
- Sensitivity analysis has been performed for the whole of a structure on the basis of the above-described method, and the analysis results, for example, a displacement amount corresponding to a rigidity of each component of the structure or an optimum wall thickness value of each component for a predetermined stress have been schematically displayed or three-dimensionally displayed, for example, by using coloring display, whereby the structure has been displayed on a display screen in the simple, visual form.
- the displacement amount corresponding to a rigidity of each component, an optimum wall thickness value, and the like have been often displayed for each component as a list.
- an object of the present invention is to provide a method of and an apparatus for displaying a structure optimizing result, which are capable of displaying rigidity values calculated on the basis of an initial wall thickness value, an optimum wall thickness value, and a standard wall thickness value in such a manner that a change between two of these rigidity values is clearly indicated.
- a structure for optimizing the result displaying method and a structure optimizing result displaying apparatus, in which an actual rigidity value of a structure is calculated on the basis of an inputted initial value of a wall thickness of each of components of the structure.
- An optimum value of the wall thickness of each of the components is calculated on the basis of a sensitivity analysis result in order to make the calculated actual rigidity value close to a required rigidity value of the structure and the calculated result is displayed.
- the actual rigidity value and a rigidity value of the structure on the basis of the optimum wall thickness value of each of the component are comparatively displayed as a list.
- the structure optimizing result displaying method and the structure optimizing result displaying apparatus since the actual rigidity value and the rigidity value of the structure on the basis of the optimum wall thickness value of each of the components are comparatively displayed as a list, it can be easily appreciated, from the displayed list, to what degree the actual rigidity value deviates from the rigidity value on the basis of the optimum wall thickness value. As a result, it can be quickly decided whether a structure can be optimized only by changing a wall thickness value of each component or by changing the configuration of the structure.
- a difference in the rigidity value between the actual rigidity value and the rigidity value of the structure on the basis of the optimum wall thickness value of each of the components may be obtained.
- the calculated difference rigidity value for each of the components be displayed as a list.
- a structure for optimizing the result displaying method and a structure optimizing result displaying apparatus, in which an actual rigidity value of a structure is calculated on the basis of an inputted initial value of a wall thickness value of each of components of the structure.
- An optimum value of the wall thickness value of each of the components is calculated on the basis of a sensitivity analysis result in order to make the calculated actual rigidity value close to a required rigidity value of the structure and the calculated result is displayed.
- a standard wall thickness value corresponding to the optimum wall thickness value optimized by the optimizing calculation is selected for each of the components.
- the wall thickness value of each of the components of the structure is set to the selected standard wall thickness value and a rigidity value of the structure is calculated on the basis of the selected standard wall thickness value.
- the rigidity value of the structure on the basis of the selected standard wall thickness value and a rigidity value of the structure on the basis of the optimum wall thickness value are comparatively displayed for each of the components as a list.
- the structure optimizing result displaying method and the structure optimizing result displaying apparatus since the rigidity value of the structure on the basis of the optimum wall thickness value and the rigidity value of the structure on the basis of the standard wall thickness value are comparatively displayed for each of the components as a list, it can be easily appreciated, from the displayed list, to what degree the rigidity value on the basis of the standard wall thickness value deviates from the rigidity value on the basis of the optimum wall thickness value. As a result, it can be quickly decided whether a structure can be optimized only by changing a wall thickness of each component or by changing the configuration of the structure.
- a difference in the rigidity value between the rigidity value of the structure on the basis of the optimum wall thickness value and the rigidity value of the structure on the basis of the standard wall thickness value may be calculated and the difference in the rigidity value for each of the components is displayed as a list.
- an object of the present invention is to provide a method of and an apparatus for displaying a structure optimizing result, wherein when a wall thickness value of each component of a structure is set to a standard value of a material at the time of optimizing a rigidity balance of the structure, it can be easily, visually confirmed how much deviation between the standard wall thickness value and the wall thickness value before analysis occurs for a component of the structure.
- the location can be easily decided relative to the position of the three-dimensional shape of the structure each component.
- a difference value between the initial wall thickness value and the optimum wall thickness value obtained by the optimizing calculation is calculated for each of the components; the calculated difference value for each of the components is displayed as a list on one side portion of display means; a three-dimensional shape of the structure is displayed on the other side portion of the display means; and each component is displayed in such a manner that if either a component in the display list or a component in the three-dimensional shape of the structure is indicated on a screen of the display means, the indicated component is selectively displayed in the displayed list with the three-dimensional shape of the structure.
- the difference between the initial wall thickness value and the optimum wall thickness value is calculated for each component, and the calculated value is displayed for each component as a list on one side portion of the display means and the three-dimensional shape of the structure is displayed on the other side portion of the display means. If either a component in the displayed list or a component in the displayed three-dimensional shape of the structure is indicated on the screen of the display means, the indicated component is selectively displayed on the displayed list with the displayed three-dimensional shape of the structure.
- the indicated component is selectively displayed in the displayed three-dimensional shape of the structure.
- the indicated component is selectively displayed in the displayed list. Accordingly, even if the structure is complicated and/or the number of the components is large, an arbitrary component can be easily confirmed for the displacement amount before and after optimizing calculation by an operator.
- a standard wall thickness value corresponding to the optimum wall thickness value may be selected for each of the components.
- a difference in the value between the optimum wall thickness value and the selected standard wall thickness value is calculated for each of the components and the calculated difference value for each of the components is displayed as a list in addition to the displayed list.
- a wall thickness value of the component optimized for realizing a desired rigidity balance may be often replaced with a standard value of a material of the component. Accordingly, a difference occurs between the optimum value and the selected standard wall thickness value, with a result that the rigidity balance of the structure may be changed. In this case, according to the present invention, it can be easily confirmed how much change in rigidity balance occurs at which component of the structure by the display list.
- the related art method also has the following problem.
- An initial wall thickness value given for each of components of a structure, an optimum wall thickness value of each of the components of the structure and a standard wall thickness value close to the optimum wall thickness value are not perfectly equal to each other. According to the related art method, however, it fails to determine how much deviation occurs, at which portion of the structure, between two of the initial wall thickness value, the optimum wall thickness value, and the standard wall thickness value.
- the present invention has an object to provide a method of and an apparatus for displaying a structure optimizing result, which are capable of displaying an initial wall thickness value, an optimum wall thickness value, and a standard wall thickness value in such a manner that it can be easily appreciated at which portion of a structure a deviation occurs between two of the initial wall thickness value, the optimum wall thickness value, and the standard wall thickness value.
- a wall thickness value of the component optimized for realizing a desired rigidity balance may be often replaced with a standard wall thickness value of a material of the component.
- the rigidity balance of the structure may be changed. In this case, according to the present invention, it can be easily confirmed how much of a change in rigidity balance occurs at which component of the structure by the display list.
- the method of and the apparatus for displaying a structure optimizing result according to the present invention exhibits the following additional effects.
- an optimum wall thickness value of the component optimized for realizing a desired rigidity balance must be replaced with a standard wall thickness value of a material of the component. Accordingly, a difference occurs between the optimum wall thickness value and the standard wall thickness value, with a result that the rigidity balance of the structure is varied.
- a difference between an initial wall thickness value of each component of a structure and an optimum wall thickness value obtained by optimizing the calculation is displayed on one side of a display means as a list for each component, and a three-dimensional shape of the structure is displayed on the other side of the display means, if a component on one side (or the other side) of the display means is indicated, the corresponding component can be selectively displayed on the other side (or one side) of the display means.
- the display on the one side of the display means it can be easily confirmed how much of a difference occurs for a component of the structure. If the component is indicated, the corresponding component can be displayed on the displayed three-dimensional shape of the structure on the other side of the display means. Conversely, if a component is indicated on the displayed three-dimensional shape of the structure on the other side of the display means, the corresponding component can be selectively displayed on the displayed list on the one side of the display means. As a result, the difference caused by replacing the optimum wall thickness value with the standard wall thickness value can be easily checked.
- the structure optimizing result displaying method and the structure optimizing result displaying apparatus since a difference in the value between the inputted initial wall thickness value and the optimum wall thickness value obtained by the optimizing calculation is displayed for each of the components as a list, it can be easily decided how much of a difference occurs for a component of the structure.
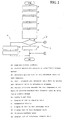
- FIG. 1 is a block diagram showing a configuration of a structure optimizing result displaying apparatus to which a structure optimizing result displaying method according to the embodiment of the present invention is applied.
- the structure optimizing result displaying apparatus 10 in FIG. 1, will be described by way of an example in which the apparatus 10 is applied to a frame body 40 for a motorcycle shown in FIG. 4(b).
- the frame body 40 for a motorcycle is a structure obtained by integrating a main frame 41 having a head pipe 45 with a sub-frame 42.
- the structure is disassembled into simple structural members taken as components. In other words, the components are integrally joined to each other, to form the structure.
- the main frame 41 is disassembled into the head pipe 45 and a plurality of other structural members 46a, 46b, 47a, 47b, 48, 49a, 49b, 50, 51, 52, and the like and the sub-frame 42 is disassembled into a plurality of structural members 55a, 55b, 56, 57, 58a, 58b, 59a, 59b, etc.
- Each of the structural members 46a and 46b of the main frame 41 is typically formed into a box having a pentagonal column shape in cross-section, wherein a reinforcing plate for reinforcement is provided in the box-shaped member.
- a plate material forms a portion, located on one side with respect to the reinforcing plate, of the pentagonal column, the reinforcing plate, and a plate material forms the other portion, located on the other side with respect to the reinforcing plate of the pentagonal column. All of the portions are taken as independent components. The same is true for the other structural members.
- the frame body 40 includes components (not shown in the figure) other than those described above.
- the components of the frame body 40 are designated by component numbers (PNos.) in a table shown in FIG. 4(a).
- a thickness of a component should be expressed by a plate thickness if the component is formed into a plate, and should be expressed by a wall thickness if the component is formed into a pipe.
- a thickness of a component is also expressed by a wall thickness even if the component is formed into a plate.
- an axial line 61 of the head pipe is illustrated having an axle 61a of a front wheel and a pivot 62 from which a rear fork and a rear wheel are suspended.
- the structure optimizing result displaying apparatus 10 includes an input unit 1, a calculation control unit 2 composed of a computer, a standard wall thickness database 3, a display unit 4, and a temporary memory and an ROM (not shown) for storing data containing a working area.
- the input unit 1 includes an initial condition indicating unit 1a and an output form indicating unit 1b.
- the initial condition indicating unit 1a three-dimensional shape data of a structure, the number of each component, the fact whether or not each component is to be analyzed, an initial value of a wall thickness of each component, a minimum value and a maximum value as limited values of the wall thickness of each component, a name of a material of each component, and a required rigidity value of the structure are indicated.
- the output form indicating unit 1b either of display of a list of wall thickness values, the display of a list of rigidity values, and a comparative display of a three-dimensional shape and a display of a list of wall thickness values (which is also simply referred to as "comparative display”) is indicated.
- the calculation control unit 2 includes a sensitivity analyzing unit 2a, an optimum wall thickness value calculating unit 2b, a standard wall thickness selecting unit 2c, a structure analyzing unit 2d, and an output calculation/display control unit 2e.
- the sensitivity analyzing unit 2a performs sensitivity analysis using a finite element method on the basis of the initial input data indicated by the initial condition indicating unit 1a.
- the optimum wall thickness value calculating unit 2b calculates an actual rigidity value of the structure on the basis of the initial input data for each component, calculates an optimum value of a wall thickness of each component on the basis of the sensitivity analysis result obtained by the sensitivity analyzing unit 2a in order to make the actual rigidity value close to a target rigidity value of the structure, and stores the optimum value for each component in the temporary memory.
- the standard wall thickness value selecting unit 2c selects a standard wall thickness value closest to the optimum value of the wall thickness obtained by the optimum wall thickness value calculating unit 2b by referring to the standard wall thickness value of the standard wall thickness database 3 for each component, and stores the standard wall thickness value for each component in the temporary memory.
- the structure analyzing unit 2d calculates a rigidity value of the structure by structural analysis using the finite element method on the basis of each of the calculated optimum value of the wall thickness and the standard wall thickness value selected by the standard wall thickness value selecting unit 2c in place of the initial wall thickness value for each component, and stores the calculated rigidity value in the temporary memory.
- the output calculation/display control unit 2e performs calculation for display based on the output form indicated by the output form indicating unit 1b and performs display control for displaying the calculated result on the display unit 4.
- the structure analyzing unit 2d calculates the rigidity value of the structure by using the calculated optimum value of the wall thickness of each component, and the rigidity value of the structure by using the selected standard value of the wall thickness of each component, and stores the calculated rigidity values in the temporary memory.
- the output calculation/display control unit 2e calculates a difference between the initial wall thickness value and the optimum value of the wall thickness and a difference between the optimum value of the wall thickness and the standard value of the wall thickness for each component, and performs display control which makes the display unit 4 display the number (PNo.) of each component, the fact whether or not each component is to be analyzed, the minimum value (MIN) as the limited value of the wall thickness of each component, the initial wall thickness value of each component, the maximum value (MAX) as the limited value of the wall thickness of each component, the optimum value (OPT-T) of the wall thickness of each component, the difference (DIF-T) between the initial wall thickness value and the optimum value of the wall thickness for each component, the standard value (STD-T) of the wall thickness of each component, the difference (SDIF-T) between the optimum value of the wall thickness and the standard value of the wall thickness for each component,
- the optimum wall thickness value (OPT-T) may be used as the standard wall thickness value (STD-T).
- STD-T standard wall thickness value
- the optimum wall thickness value is calculated as 0.2 mm or 9,0 mm, then the difference between the standard value of the material and the optimum wall thickness value becomes excessively large. In this case, it is apparent that the change in the structure should be superior to the change of the wall thickness of the component. Further, in this case, by using the optimum wall thickness value (OPT-T) as the standard wall thickness value (STD-T), it is possible to prevent an adverse effect of the partial unsuitable standard wall thickness value (STD-T) on the calculation of the rigidity of the entire structure.
- the output calculation/display control unit 2e calculates a lateral rigidity value and a torsional rigidity value for the structure, a center position of the torsion on the basis of a position of the pivot 62 or a center 63 of the head pipe, a lateral displacement of an axle, and a weight for each of the initial wall thickness value of each component, the optimum wall thickness value of each component, and the standard wall thickness value of each component; and calculates, for each component, a difference between the rigidity value for the initial wall thickness value and the required rigidity value, a difference between the rigidity value for the optimum wall thickness value and the required rigidity value, a difference between the rigidity value for the standard wall thickness value and the required rigidity, a difference between the rigidity for the optimum wall thickness value and the rigidity for the standard wall thickness value, a difference between the rigidity for the initial wall thickness value and the rigidity value for the optimum
- the output calculation/display control unit 2e performs the display control which makes the display unit 4 display the list of wall thickness values on one side (upper side) of the display unit 4 and the three-dimensional shape of the structure on the other side (lower side) of the display unit 4.
- the output calculation/display control unit 2e performs such a display control that if a component located at a position on the displayed three-dimensional shape is indicated, then a line of the number PNo. of the same component in the list of the wall thicknesses is selectively indicated, and if a line of a component in the list of the wall thicknesses is indicated, then the position of the same component on the displayed three-dimensional shape is selectively indicated.
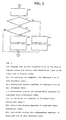
- step S1 After the start of the operation of the structure optimizing result displaying unit 10, in step S1, three-dimensional shape data of a structure, the number (PNo.) of each component, the fact whether or not each component is to be analyzed, an initial value of a wall thickness of each component, a minimum value and a maximum value of a wall thickness of each component, a name of a material of each component are indicated by the initial condition indicating unit 1a and a required rigidity value of the structure is read out.
- the initial data thus inputted is of a predetermined value for the frame body 40, a rigidity value obtained by using these values is assumed to be close to a required rigidity value of the frame body 40 as a structure.
- step S2 sensitivity analysis using the finite element method is performed on the basis of the inputted initial data by the sensitivity analyzing unit 2a.
- step S3 an actual rigidity value of the structure is calculated by a desirable combination of the conditions based on the sensitivity analysis result, and an optimum value of the wall thickness of each component is calculated by the optimum wall thickness value calculating unit 2b with the wall thickness of each component taken as a design variable and with a minimum superimposition taken as a target function in order to make the actual rigidity value close to the required rigidity value.
- the optimum wall thickness value obtained in step S3 is a calculated value, and therefore, a member having the optimum wall thickness value thus calculated is not necessarily available.
- step S4 a standard wall thickness value closest to the optimum wall thickness value is selected for each component by the standard wall thickness value selecting unit 2c by referring to standard wall thickness values of the material of each component stored in the standard wall thickness database 3.
- the structure is a steel frame structure of a building, there occurs no problem in selecting a wall thickness value closest to an optimum wall thickness value and larger than the optimum wall thickness value as a standard wall thickness value is taken in consideration of safety.
- the structure is the frame body 40 for a motorcycle, it may be undesirable that a rigidity value of the whole of the frame body 40 is excessively large or small.
- the standard wall thickness value closest to the optimum wall thickness is required to be selected.
- step S5 a structural analysis using the finite element method is performed on the basis of the optimum wall thickness value calculated for each component by the structure analyzing unit 2d, to obtain a rigidity value of the structure on the basis of the optimum wall thickness value of each component, and similarly, structure analysis using the finite element method is performed on the basis of the selected standard wall thickness value by the structure analyzing unit 2d, to obtain a rigidity value of the structure on the basis of the standard wall thickness value of each component.
- step S6 the output form inputted by the output form indicating unit 1b is read out, to decide the output form.
- step S6 If it is decided in step S6 that the output form is the display of a list of wall thickness values, the process goes on to step S7.
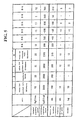
- step S7 for each component, a difference between the initial wall thickness value and the optimum wall thickness value and a difference between the optimum wall thickness value and the standard wall thickness value are calculated, and for each component, the number (PNo.) of the component, the fact whether or not the component is to be analyzed, the minimum wall thickness value, the initial wall thickness value, the maximum wall thickness value, the optimum wall thickness value, the difference between the initial wall thickness value and the optimum wall thickness value, the standard wall thickness value, the difference between the optimum wall thickness value and the standard wall thickness value, and the name of the material of each component, are displayed on the display unit 4 under the control of the output calculation/display control unit 2e.
- FIG. 4(a) One example of this display of the list of wall thickness values is shown in FIG. 4(a).
- Fig. 4(a) other components of PNos. subsequent to PNo
- character OPT designates whether or not a component is to be analyzed, wherein YES designates that a component is to be analyzed and NO designates that a component is not to be analyzed.
- MIN and MAX are the minimum value and the maximum value as the limited values of a wall thickness, respectively.
- OPT-T is an optimum wall thickness value.
- DIF-T is a difference between an initial wall thickness value and an optimum wall thickness value
- STD-T is a standard wall thickness value
- SDIF-T is a difference between an optimum wall thickness value and a standard wall thickness value.
- the difference between the initial wall thickness value and the optimum wall thickness value is relatively small, it can be readily examined whether or not the change in wall thickness value of each component of the structure should be adopted, and if the number of components in each of which a difference occurs between the initial wall thickness value and the optimum wall thickness value is large or the difference between the initial wall thickness value and the optimum wall thickness value is relatively large, it can be readily examined whether or not the overall structure should be reviewed and/or a reinforcing member should be added.
- the difference between the optimum wall thickness value and the standard wall thickness value is obtained for each component and the difference is displayed as a list for each component, it can be easily decided how much of a difference occurs for a component of the structure by the displayed list.
- a wall thickness value of the component optimized for realizing a desired rigidity balance may be often replaced with a standard wall thickness value of a material of the component, so that a difference occurs between the optimum value and the selected standard wall thickness value, with a result that the rigidity balance of the structure may be varied.
- it can be easily decided how much of a change in rigidity balance occurs at which component of the structure.
- step S6 If it is decided in step S6 that the output form is the display of a list of rigidity values, the process goes on to step S8.
- step S8 a lateral rigidity value and a torsional rigidity value for the structure, a center position of the torsion on the basis of the center 63 of the head pipe, a lateral displacement of an axle, and a weight are calculated for each of the initial wall thickness values of each component, the optimum wall thickness value of each component, and the standard wall thickness value of each component.
- step S9 the calculated results, that is, the lateral rigidity value, the torsional rigidity value, the center position of torsion, the lateral displacement of the axle, and the weight are displayed as a list together with the required rigidity value on the display unit 4 under the control of the output calculation/display control unit 2e. Part of one example of this display of a list of rigidity values is shown in FIG. 5.
- the list of rigidity values from the difference between the rigidity value of the structure on the basis of the initial wall thickness value and the rigidity value of the structure on the basis of the optimum wall thickness value, it can be easily decided whether the wall thickness value of each component should be changed or the configuration of the structure should be changed.
- the list of the rigidity values since the rigidity value of the structure on the basis of the optimum wall thickness value of each component and the rigidity value of the structure on the basis of the standard wall thickness value are comparatively displayed as a list, the effect of a change from the optimum wall thickness value to the standard wall thickness value exerted on each rigidity value can be easily understood from the displayed list.
- the list of the rigidity values from the difference between the rigidity value of the structure on the basis of the optimum wall thickness value of each component and the rigidity value of the structure on the basis of the standard wall thickness value, it can be easily decided whether the wall thickness value of each component should be changed or the configuration of the structure should be changed.
- step S6 If it is decided in step S6 that the output form is the comparative display of the display of a three-dimensional shape and the display of a list of wall thickness values, the process goes on to step S10.
- step S10 the same list of wall thickness values as that in step S7 is displayed on one side, for example, an upper side of the display unit 4, and a three-dimensional shape of the structure based on the three-dimensional data is displayed on the other side, for example, on the lower side of the display unit 4.
- step S11 it is checked whether or not one component is indicated from the displayed list of wall thickness values.
- the indication in step S11 is performed by indicating one component in the displayed list of wall thickness values by a cursor.
- step S11 If it is decided in step S11 that one component is indicated from the displayed list of wall thickness values, the process goes on to step S12.
- step S12 the one component indicated from the displayed list of wall thickness values is selectively displayed.
- the selective display in step S12 is performed by increasing a display brightness of a line of the component indicated from the displayed list of wall thickness values or changing a display color of the line of the component indicated from the displayed list of wall thickness values.
- step S13 the component corresponding to the component indicated in step S12 is selectively displayed from the displayed three-dimensional shape.
- the selective display in step S13 is performed by increasing a display brightness of the selected component or changing a display color of the selected component.
- step S11 If it is decided in step S11 that any component is not indicated from the displayed list of wall thickness values, the process goes on to step S14.
- step S14 it is checked whether or not one component is indicated from the displayed three-dimensional shape. If it is decided in step S14 that one component is indicated from the displayed three-dimensional shape, the process goes on to step S15.
- step S15 the component indicated from the displayed three-dimensional shape is selectively displayed. The selective display in step S15 is performed by increasing a display brightness of the selected component or changing a display color of the selected component.
- step S16 a line of the component corresponding to the component indicated in step S15 is selectively displayed from the displayed list of wall thickness values.
- the selective display in step S16 is performed by increasing a display brightness of the selected component or changing a display color of the selected component.
- FIGS. 4(a) and 4(b) One example of the comparative display is shown in FIGS. 4(a) and 4(b). For example, if a line of a component number PNo. 2102 is indicated in FIG. 4(a), a part 55b as the corresponding component is selectively displayed in FIG 4(b). Conversely, if the part 55b as a component is indicated in FIG. 4(b), the line of the number PNo. 2102 of the corresponding component is selectively displayed in FIG. 4(a).
- the comparative display is selected as the output form
- the indicated component is selectively displayed in the displayed three-dimensional shape of the structure on the screen of the display unit 4.
- the indicated component is selectively displayed from the displayed list of wall thickness values.
- the structure optimizing result is displayed wherein an actual rigidity value of a structure is calculated on the basis of an inputted initial value of a wall thickness of each component of the structure.
- An optimum value of the wall thickness of each of the components is calculated on the basis of a sensitivity analysis result in order to make the calculated actual rigidity value close to a required rigidity value of the structure and the calculated result is displayed.
- the actual rigidity value and a rigidity value of the structure on the basis of the optimum wall thickness value of each of the component are comparatively displayed as a list by an output calculation/display control unit.
Landscapes
- Engineering & Computer Science (AREA)
- Physics & Mathematics (AREA)
- Theoretical Computer Science (AREA)
- Computer Hardware Design (AREA)
- Evolutionary Computation (AREA)
- Geometry (AREA)
- General Engineering & Computer Science (AREA)
- General Physics & Mathematics (AREA)
- Bending Of Plates, Rods, And Pipes (AREA)
- Length Measuring Devices With Unspecified Measuring Means (AREA)
- Analysing Materials By The Use Of Radiation (AREA)
Applications Claiming Priority (6)
| Application Number | Priority Date | Filing Date | Title |
|---|---|---|---|
| JP2001094904 | 2001-03-29 | ||
| JP2001094906 | 2001-03-29 | ||
| JP2001094904A JP3924435B2 (ja) | 2001-03-29 | 2001-03-29 | 構造最適化結果表示方法および装置 |
| JP2001094912 | 2001-03-29 | ||
| JP2001094912A JP3924437B2 (ja) | 2001-03-29 | 2001-03-29 | 構造最適化結果表示方法および装置 |
| JP2001094906A JP3924436B2 (ja) | 2001-03-29 | 2001-03-29 | 構造最適化結果表示方法および装置 |
Publications (3)
| Publication Number | Publication Date |
|---|---|
| EP1246093A2 true EP1246093A2 (de) | 2002-10-02 |
| EP1246093A3 EP1246093A3 (de) | 2006-01-25 |
| EP1246093B1 EP1246093B1 (de) | 2016-06-01 |
Family
ID=27346393
Family Applications (1)
| Application Number | Title | Priority Date | Filing Date |
|---|---|---|---|
| EP02007413.4A Expired - Lifetime EP1246093B1 (de) | 2001-03-29 | 2002-03-28 | Verfahren zum Erhalten des optimisierten Ergebnisses einer Struktur |
Country Status (2)
| Country | Link |
|---|---|
| US (1) | US7657412B2 (de) |
| EP (1) | EP1246093B1 (de) |
Families Citing this family (5)
| Publication number | Priority date | Publication date | Assignee | Title |
|---|---|---|---|---|
| DE10308314A1 (de) * | 2003-02-26 | 2004-09-16 | Siemens Ag | Statistische Analyse eines technischen Ausgangsparameters unter Berücksichtigung der Sensivität |
| JP5348291B2 (ja) | 2012-03-15 | 2013-11-20 | Jfeスチール株式会社 | 構造体を構成する部品形状の最適化解析装置 |
| WO2017077609A1 (ja) * | 2015-11-04 | 2017-05-11 | 富士通株式会社 | 構造解析方法、及び構造解析プログラム |
| JP6617812B1 (ja) * | 2018-10-05 | 2019-12-11 | Jfeスチール株式会社 | 車体部品の感度解析方法及び装置、車体部品の材料特性決定方法 |
| CN109583057B (zh) * | 2018-11-16 | 2020-09-08 | 北京星际荣耀空间科技有限公司 | 一种基于刚度分析的运载火箭有限元建模方法及装置 |
Family Cites Families (16)
| Publication number | Priority date | Publication date | Assignee | Title |
|---|---|---|---|---|
| GB9302450D0 (en) * | 1993-02-08 | 1993-03-24 | Ibm | Cumputer aided design system |
| JP3278506B2 (ja) | 1993-10-14 | 2002-04-30 | 横浜ゴム株式会社 | 重荷重ラジアルタイヤトレッド用ゴム組成物 |
| JP3174223B2 (ja) * | 1993-12-14 | 2001-06-11 | 雅治 石井 | フィルタの設計方法およびフィルタ |
| US5729463A (en) * | 1995-09-01 | 1998-03-17 | Ulsab Trust | Designing and producing lightweight automobile bodies |
| US5867397A (en) * | 1996-02-20 | 1999-02-02 | John R. Koza | Method and apparatus for automated design of complex structures using genetic programming |
| US5926399A (en) * | 1996-03-04 | 1999-07-20 | Beam Technologies, Inc. | Method of predicting change in shape of a solid structure |
| US6023574A (en) * | 1996-03-29 | 2000-02-08 | Hutchinson Technology Incorporated | Method for designing and manufacturing a suspension having optimized side profile |
| US6026397A (en) * | 1996-05-22 | 2000-02-15 | Electronic Data Systems Corporation | Data analysis system and method |
| EP0865890A4 (de) * | 1996-08-08 | 1999-05-26 | Bridgestone Corp | Verfahren zum entwerfen von mehrkomponentenmaterial, optimierungsanalysator und ein speicherträger, auf welchem das mehrkomponentenmaterialoptimierungsanalyseprogramm gespeichert ist |
| JP3313040B2 (ja) * | 1997-01-23 | 2002-08-12 | 日本発条株式会社 | 構造物等の設計支援システム |
| US6092062A (en) * | 1997-06-30 | 2000-07-18 | International Business Machines Corporation | Relational database query optimization to perform query evaluation plan, pruning based on the partition properties |
| US6081654A (en) * | 1998-05-21 | 2000-06-27 | Ford Global Technologies, Inc. | Method and system for designing a vehicle door |
| US6272449B1 (en) * | 1998-06-22 | 2001-08-07 | Torrent Systems, Inc. | Computer system and process for explaining behavior of a model that maps input data to output data |
| JP3458728B2 (ja) * | 1998-11-09 | 2003-10-20 | 富士通株式会社 | 構成部品データ管理装置および構成部品データ管理プログラムを格納したコンピュータ読み取り可能な記憶媒体 |
| JP3648089B2 (ja) * | 1999-03-18 | 2005-05-18 | 富士通株式会社 | 設計システムおよび記録媒体 |
| JP3737334B2 (ja) * | 2000-03-21 | 2006-01-18 | シャープ株式会社 | 画像情報処理装置、画像情報処理方法、記録媒体および伝送媒体 |
-
2002
- 2002-03-22 US US10/102,831 patent/US7657412B2/en not_active Expired - Fee Related
- 2002-03-28 EP EP02007413.4A patent/EP1246093B1/de not_active Expired - Lifetime
Non-Patent Citations (3)
| Title |
|---|
| LEE T H ET AL: "Topology optimization of the inner reinforcement for an automobile hood using modal design sensitivity analysis" KEY ENGINEERING MATERIALS TRANS TECH PUBLICATIONS SWITZERLAND, vol. 183-187, 2000, pages 439-444, XP008056156 ISSN: 1013-9826 * |
| ODA JUHACHI ET AL: "Minimum compliance technique for shell structures (plate thickness variance approach and its applications)" NIPPON KIKAI GAKKAI RONBUNSHU A HEN; NIPPON KIKAI GAKKAI RONBUNSHU, A HEN/TRANSACTIONS OF THE JAPAN SOCIETY OF MECHANICAL ENGINEERS, PART A APR 1991, vol. 57, no. 536, April 1991 (1991-04), pages 1005-1010, XP008056160 * |
| YOON YOUNG KIM ET AL: "Topology optimization of beam cross sections" INTERNATIONAL JOURNAL OF SOLIDS AND STRUCTURES ELSEVIER UK, vol. 37, no. 3, January 2000 (2000-01), pages 477-493, XP002355463 ISSN: 0020-7683 * |
Also Published As
| Publication number | Publication date |
|---|---|
| EP1246093B1 (de) | 2016-06-01 |
| US7657412B2 (en) | 2010-02-02 |
| US20020161730A1 (en) | 2002-10-31 |
| EP1246093A3 (de) | 2006-01-25 |
Similar Documents
| Publication | Publication Date | Title |
|---|---|---|
| EP0587892B1 (de) | Navigationsvorrichtung und navigationsverfahren | |
| CN101360632B (zh) | 停车支援装置 | |
| EP0855581B1 (de) | Vorrichtung zur berechnung ungünstiger ladungsverteilung auf einem fahrzeug und zur berechnung der ladung auf einem fahrzeug | |
| US5378052A (en) | Electronic brake pedal adjustment apparatus and method therefor | |
| EP1246093A2 (de) | Verfahren und/oder Gerät zur Anzeige des optimierten Ergebnisses einer Struktur | |
| US4703819A (en) | Full hydraulic power steering system | |
| US20170369059A1 (en) | Method for operating a motor vehicle and motor vehicle | |
| JP4497386B2 (ja) | 車両用サスペンションの設計支援方法 | |
| ITTO960982A1 (it) | Dispositivo di visualizzazione di informazioni di un autoveicolo | |
| JP3924435B2 (ja) | 構造最適化結果表示方法および装置 | |
| JP3924437B2 (ja) | 構造最適化結果表示方法および装置 | |
| EP2546608B1 (de) | Kartenanzeigesystem, Verfahren und Programm | |
| JP3924436B2 (ja) | 構造最適化結果表示方法および装置 | |
| DE102007055564A1 (de) | Mobiles Navigationsgerät | |
| DE60310897T2 (de) | Verfahren und vorrichtung zum vorschlagen von reifen und zum berechnen der reifendrücke für ein bauwerkfahrzeug vor ort | |
| CA2187981C (en) | Custom vehicle wheel aligner | |
| WO2022214382A1 (de) | Verfahren zum bewerten von fahrmanövern eines fahrers auf einem fahrrad | |
| JP2005067406A (ja) | 車両情報表示のカスタマイズシステム | |
| DE19806794C2 (de) | Navigationsgerät | |
| EP1371961A1 (de) | Radauswuchteinstelleinrichtung und radauswuchteinstellverfahren | |
| JP2005067405A (ja) | 車両情報表示のカスタマイズシステム | |
| JP3285121B2 (ja) | 車両の荷重偏度算出装置及び積載重量算出装置 | |
| JP3616492B2 (ja) | 車両運転モード表示装置 | |
| JPH055616B2 (de) | ||
| US6466878B1 (en) | Method for selecting a tire set from a group of experimental tires |
Legal Events
| Date | Code | Title | Description |
|---|---|---|---|
| PUAI | Public reference made under article 153(3) epc to a published international application that has entered the european phase |
Free format text: ORIGINAL CODE: 0009012 |
|
| AK | Designated contracting states |
Kind code of ref document: A2 Designated state(s): AT BE CH CY DE DK ES FI FR GB GR IE IT LI LU MC NL PT SE TR |
|
| AX | Request for extension of the european patent |
Free format text: AL;LT;LV;MK;RO;SI |
|
| PUAL | Search report despatched |
Free format text: ORIGINAL CODE: 0009013 |
|
| AK | Designated contracting states |
Kind code of ref document: A3 Designated state(s): AT BE CH CY DE DK ES FI FR GB GR IE IT LI LU MC NL PT SE TR |
|
| AX | Request for extension of the european patent |
Extension state: AL LT LV MK RO SI |
|
| 17P | Request for examination filed |
Effective date: 20060313 |
|
| AKX | Designation fees paid |
Designated state(s): DE FR |
|
| 17Q | First examination report despatched |
Effective date: 20061129 |
|
| GRAP | Despatch of communication of intention to grant a patent |
Free format text: ORIGINAL CODE: EPIDOSNIGR1 |
|
| INTG | Intention to grant announced |
Effective date: 20151216 |
|
| GRAS | Grant fee paid |
Free format text: ORIGINAL CODE: EPIDOSNIGR3 |
|
| GRAA | (expected) grant |
Free format text: ORIGINAL CODE: 0009210 |
|
| AK | Designated contracting states |
Kind code of ref document: B1 Designated state(s): DE FR |
|
| REG | Reference to a national code |
Ref country code: DE Ref legal event code: R096 Ref document number: 60248103 Country of ref document: DE |
|
| REG | Reference to a national code |
Ref country code: DE Ref legal event code: R084 Ref document number: 60248103 Country of ref document: DE |
|
| REG | Reference to a national code |
Ref country code: DE Ref legal event code: R097 Ref document number: 60248103 Country of ref document: DE |
|
| PLBE | No opposition filed within time limit |
Free format text: ORIGINAL CODE: 0009261 |
|
| STAA | Information on the status of an ep patent application or granted ep patent |
Free format text: STATUS: NO OPPOSITION FILED WITHIN TIME LIMIT |
|
| 26N | No opposition filed |
Effective date: 20170302 |
|
| REG | Reference to a national code |
Ref country code: DE Ref legal event code: R119 Ref document number: 60248103 Country of ref document: DE |
|
| REG | Reference to a national code |
Ref country code: FR Ref legal event code: ST Effective date: 20171130 |
|
| PG25 | Lapsed in a contracting state [announced via postgrant information from national office to epo] |
Ref country code: DE Free format text: LAPSE BECAUSE OF NON-PAYMENT OF DUE FEES Effective date: 20171003 Ref country code: FR Free format text: LAPSE BECAUSE OF NON-PAYMENT OF DUE FEES Effective date: 20170331 |