EP0991951B1 - A spectrum analyser - Google Patents
A spectrum analyser Download PDFInfo
- Publication number
- EP0991951B1 EP0991951B1 EP98932291A EP98932291A EP0991951B1 EP 0991951 B1 EP0991951 B1 EP 0991951B1 EP 98932291 A EP98932291 A EP 98932291A EP 98932291 A EP98932291 A EP 98932291A EP 0991951 B1 EP0991951 B1 EP 0991951B1
- Authority
- EP
- European Patent Office
- Prior art keywords
- frequency
- signal
- frequencies
- spectrum
- power
- Prior art date
- Legal status (The legal status is an assumption and is not a legal conclusion. Google has not performed a legal analysis and makes no representation as to the accuracy of the status listed.)
- Expired - Lifetime
Links
- 238000001228 spectrum Methods 0.000 title claims abstract description 94
- 238000004458 analytical method Methods 0.000 claims abstract description 9
- 238000000034 method Methods 0.000 claims description 12
- 238000001914 filtration Methods 0.000 claims description 7
- 230000001131 transforming effect Effects 0.000 claims description 3
- 239000002131 composite material Substances 0.000 abstract description 5
- 238000005259 measurement Methods 0.000 description 13
- 230000015654 memory Effects 0.000 description 10
- 238000006243 chemical reaction Methods 0.000 description 8
- 238000005070 sampling Methods 0.000 description 7
- 230000008569 process Effects 0.000 description 4
- 238000012360 testing method Methods 0.000 description 3
- 230000008901 benefit Effects 0.000 description 2
- 230000004044 response Effects 0.000 description 2
- 238000012935 Averaging Methods 0.000 description 1
- 238000003775 Density Functional Theory Methods 0.000 description 1
- 230000006399 behavior Effects 0.000 description 1
- 238000011109 contamination Methods 0.000 description 1
- 238000001514 detection method Methods 0.000 description 1
- 230000000694 effects Effects 0.000 description 1
- 230000006870 function Effects 0.000 description 1
- 239000000203 mixture Substances 0.000 description 1
- 230000003287 optical effect Effects 0.000 description 1
- 238000012545 processing Methods 0.000 description 1
- 230000035899 viability Effects 0.000 description 1
Images


Classifications
-
- G—PHYSICS
- G01—MEASURING; TESTING
- G01R—MEASURING ELECTRIC VARIABLES; MEASURING MAGNETIC VARIABLES
- G01R23/00—Arrangements for measuring frequencies; Arrangements for analysing frequency spectra
- G01R23/16—Spectrum analysis; Fourier analysis
- G01R23/18—Spectrum analysis; Fourier analysis with provision for recording frequency spectrum
-
- G—PHYSICS
- G01—MEASURING; TESTING
- G01R—MEASURING ELECTRIC VARIABLES; MEASURING MAGNETIC VARIABLES
- G01R23/00—Arrangements for measuring frequencies; Arrangements for analysing frequency spectra
- G01R23/16—Spectrum analysis; Fourier analysis
- G01R23/165—Spectrum analysis; Fourier analysis using filters
Definitions
- This invention relates to a spectrum analyser.
- a control processor 1 tunes the bandpass filter 2 such that it passes only a selected range of the frequencies present in input signal 3.
- the power of this signal is detected by power detector 4.
- the basic output of the power detector 4 is then processed by processor 5, where the signal may be averaged to reduce noise, peak detected, and converted to a logarithmic representation, before being displayed on a display device 6.
- the control processor 1 will organise the display such that a graph is drawn of power versus frequency.
- DE-A-195 42247 discloses a spectrum analysen having an image frequency eliminating device.
- An RF spectrum analyser of this simple form is impractical, certainly if intended as a general purpose test instrument.
- the problem lies in the implementation of the tunable filter 2. It is impractical to make a filter that has a bandwidth which is selectably wide or narrow (e.g. 3MHz to 10Hz) that will tune over a large RF frequency range (e.g. 10kHz to IOGHz).
- An interesting contrast to this is the optical spectrum analyser, where a cavity resonator and/or a diffraction grating can be tuned over the full range of interest, and the heterodyne techniques described to follow are not practical.
- FIG. 1 A solution to the implementation problem is found with a frequency converting front end to the spectrum analyser.
- Figure 2 of the accompanying drawings shows the use of such a device.
- the control processor 1 sets the frequency of a frequency synthesiser 7, which provides a frequency reference to a frequency converter 8.
- the function of the frequency converter 8 is to take a block of frequencies, which frequencies are related to the reference frequency, and to convert them, maintaining their relative power, into a block of frequencies with the same range, but a much lower centre frequency.
- This block of frequencies is passed to a fixed bandpass filter 9, where one narrow range is selected and passed on for power detection by the power detector 4.
- the frequency conversion stage 8, combined with the reference synthesiser 7 and the fixed bandpass filter 9 emulates the bandpass filter 2 of Figure 1 , but frequency shifted up in frequency by an amount related to the frequency reference. As it is implemented at a fixed and low frequency, the bandpass filter 9 of Figure 2 is possible to realise.
- An ideal frequency conversion stage for use in this type of spectrum analyser has one important property, which will be called the 1:1 property: whenever signal power emerges from the frequency converter, there is always exactly one input signal at a specific frequency difference and power difference on the input signal that has caused it.
- the specific power difference allows the controller 1 to correctly estimate the input power that it has detected.
- the specific frequency difference allows the controller 1 to correctly estimate the frequency of the signal that it has detected.
- the simplest type uses a fundamental mixer 10.
- the frequency mixer 10 will output two signals of frequencies 2.01GHz, and 10MHz.
- the bandpass filter 9 following the mixer 10 will reject the 2.01GHz signal, and pass the 10MHz signal.
- the first and most obvious is an input signal of 1.02GHz, which being different from the reference by 10MHz, will cause a 10MHz output signal.
- non-idealities in the mixer 10 will cause input signals such as 3.02GHz, which is 10MHz different from the third harmonic of the reference, to cause an output of 10MHz.
- a modulation analyser is one such instrument.
- the assumption is made that in normal operation of the instrument, the only input signal is the modulation under test.
- the simple RF front end is capable of creating images and spurious signals, these are known to be absent under normal use, and so are ignored.
- a spectrum analyser cannot make the assumption of a single input signal.
- a measurement that is often made with a spectrum analyser is a search for signals.
- any signal seen on the display must be able to be interpreted as a genuine input signal, and not ignored as an artefact of the frequency converter.
- a more ideal frequency converter can be built with multiple mixers and filters.
- a low pass filter 11 passes only signals below some cut-off frequency, for instance 2GHz. Therefore signals only in the range DC to 2GHz are present on the mixer input.
- the reference synthesiser 7 generates frequencies higher than this range, for instance 3GHz to 5GHz, and the bandpass filter 12 is tuned to 3GHz. This ensures that when the reference synthesiser 7 is set to a frequency of 4GHz, only input signals with a frequency of 1GHz will appear in the bandpass filter 12.
- the input lowpass filter 11 ensures that there will not be images caused by a 7GHz input mixing with the 4GHz reference to create a mixer output frequency also of 3GHz.
- a second reference source 13 is used together with a second mixer 21. If the reference is chosen to be 3.01 GHz, then the output frequency in the final bandpass filter 9 will be 10MHz. However, there are practical problems with these particular frequencies. If bandpass filter 12 contains a signal at 3.02GHz, it too will mix down to an output of 10MHz. It is not easy to make the bandpass filter 12 have a passband centred on 3GHz, and also to provide adequate rejection of signals at 3.02GHz. Without adequate rejection of these image frequencies, the complete frequency converter will violate the important 1:1 property, even though the first mixing stage does not. The best that can be routinely obtained from a typical filter at 3GHz is to reject signals 300MHz away from the passband. The second reference 13 must be offset more from 3GHz, perhaps to 3160MHz, such that the following bandpass filter 9 is centred on 160MHz.
- This final output frequency may still be too high to build narrow resolution filters. However, it is now low enough to build a filter which will discriminate against images at 10MHz away. A further stage of mixing and filtering can now be employed to bring the final output frequency down to 10MHz, while retaining the 1:1 property.
- filter 9 is switch selectable between several resolution bandwidths, perhaps 100Hz to 1MHz, and defines the resolution bandwidth of the instrument.
- the power in this filter is detected by power detector 4, and represents the amount of power present at the tuned frequency.
- the frequency reference 7 to the frequency converter 8 is stepped or swept across a range of frequencies in order to build up a picture of power versus frequency on the display 6.
- bandpass filter 9 serves not to define the resolution bandwidth of the instrument, but only to define the set of frequencies coming from the frequency converter 8, and entering the low frequency spectrum analyser 14.
- the low frequency spectrum analyser 14 will be implemented as a high speed analogue to digital converter, followed by a digital signal processor (DSP) which implements a discrete Fourier transform (DFT). While all analogue spectrum analysers still have an advantage on absolute dynamic range performance (typically >80dB), the digital back end is becoming more popular, especially due to its speed when implementing narrow resolution bandwidths (typically ⁇ 10kHz).
- the result of the DFT is power readings for a range of frequencies. If this range is not sufficient, the frequency reference may be stepped and a fresh set of readings made. The blocks of readings are then 'stitched' together to make a contiguous display.
- said means for converting comprises: a frequency synthesiser for synthesising the frequencies of said frequency settings; and a harmonic mixer for mixing each synthesised frequency with the received radio frequency signal, the nominal received radio frequency signals corresponding to each intermediate frequency signal thereby equalling N.F ref ⁇ IF, where N ranges over a number of integers, F ref is the synthesised frequency, and IF the intermediate frequency.
- said means for converting comprises: a frequency synthesiser for synthesising the frequencies of said frequency settings; and a fundamental mixer for mixing each synthesised frequency with the received radio frequency signal, the nominal received radio frequency signals corresponding to each intermediate frequency signal thereby equalling F ref ⁇ IF, where F ref is the synthesised frequency, and IF the intermediate frequency.
- said means for converting further comprises: a low pass filter for filtering the received radio frequency signal before it is passed to said mixer, said low pass filter thereby defining the upper frequency limit of the spectrum analyser; and a band pass filter for filtering the output of said mixer to provide said intermediate frequency signal, said band pass filter thereby defining the range of frequencies supplied to said means for carrying out a frequency analysis.
- said means for carrying out a frequency analysis comprises: means for digitising each intermediate frequency signal; and Fourier transform means for Fourier transforming each digitised intermediate frequency signal to provide its power spectrum.
- said means for carrying out a frequency analysis comprises one or more band pass filters, and a power detector following the or each band pass filter.
- said assessing means performs an initial frequency conversion of each said intermediate frequency signal.
- the following characteristics of said frequency converting means are selectably adjustable: the absolute times at which said frequency settings are adopted by said frequency converting means; the length of time for which said frequency converting means remains at a said frequency setting; the frequency difference between adjacent said frequency settings; and the order in which said frequency settings are adopted by said frequency converting means.
- the present invention provides a spectrum analyser that can use simple RF front ends which do not meet the 1:1 property, for instance a fundamental mixer, a downconversion front end that converts to the final frequency in a single stage, or a harmonic mixer (sampling gate).
- a fundamental mixer for instance a fundamental mixer
- a downconversion front end that converts to the final frequency in a single stage
- a harmonic mixer sampling gate
- an input signal 3 enters via a low pass filter 11.
- the low pass filter 11 serves to determine the upper frequency limit of the spectrum analyser, as the frequency conversion stage 8 may have a poorly determined frequency response going to very high frequencies, for instance if it is a sampling gate.
- Analyser 14 is preferably implemented as a fast sampling analogue to digital converter (ADC), followed by a DSP which implements a windowed DFT via a fast Fourier transform (FFT) algorithm.
- ADC analogue to digital converter
- DSP digital signal processor
- the window, sample rate and FFT length together define the effective resolution bandwidth of the spectrum analyser.
- the output from the low frequency spectrum analyser would be ready to be displayed, with no more than an appropriate display frequency shift, to ensure that the measured spectrum at the IF corresponded to the actual spectrum at the signal input.
- the variance of the power estimate from a single DFT is too large to accurately read the power of noisy signals, and so the power results from several DFTs would be averaged together to reduce the variance of the final answer.
- the frequency conversion stage does not have the 1:1 property, then the low frequency spectrum cannot be displayed as an accurate estimate of the spectrum of the input signal.
- the frequency converter is a fundamental mixer. Consider a frequency reference of 1GHz to the frequency converter, and an output frequency of 10MHz. This could be caused by an input signal of either 990MHz or 1.01GHz, and the control processor 1 has no way of knowing which.
- the frequency converter is a sampling gate (harmonic mixer) with a reference frequency of 200MHz, and again there is an output frequency of 10MHz.
- the controller 1 has a similar problem as with the fundamental mixer, but on a larger scale.
- the present invention provides a means of resolving the many ambiguities that are created by front end hardware that does not have the 1:1 property.
- a large table is held in a memory 15. This is organised to have as many columns are there are discrete frequencies to be resolved, labelled with the input frequency that corresponds to them. It is organised to have as many rows as there are individual measurements which comprise the total reading, labelled 0 to M-1 for M measurements. Note that the frequencies to be resolved do not necessarily have to correspond 1:1 with the resolution of the low frequency spectrum analyser.
- the frequency converter 8 be a sampling gate, driven at a frequency of approximately 50MHz.
- the choice of frequencies for the sampling gate drive is somewhat arbitrary, though there must be enough different frequencies covering sufficient range that all parts of the candidate spectrum table (see below) have a sufficient number of entries.
- the output spectrum display is required to go from 320MHz to 420MHz.
- the low frequericy spectrum analyser can measure signals only in the range 3MHz to 20MHz.
- fixed band pass filter 9 is chosen to have this range.
- Measurement number 0 is made with an LO (synthesiser 7) frequency of 49MHz. This converts the 360MHz signal to an IF of 17MHz, and the 390MHz signal into an IF of 2MHz. Due to the IF low frequency limit, the 2MHz IF signal is not recorded by the LF spectrum analyser.
- LO synthesiser 7
- the first row of the candidate table is now filled in, with the measured power levels being entered at all possible frequency positions that could have caused the IF signal, that is all frequencies of the form N.49MHz +/- IF.
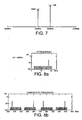
- Figure 8a shows the IF spectrum
- Figure 8b shows a graph of the entries in the candidate table after the level measurements have been filled in. It is apparent that not all frequencies in the table have had power levels entered, these are frequencies which do not correspond to any IF frequency. If the table is used in this relatively inefficient fashion, using one row per LO frequency, then the entries in these cells will be a token indicating that there is no valid power for this frequency.
- the principal strong signal has been entered at N.49MHz +/- 17MHz, or frequencies of 326MHz, 360MHz, 375MHz and 409MHz.
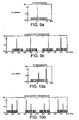
- Measurement number 1 is made with an LO frequency of 50MHz. This happens to mix both signals down to an IF of 10MHz.
- the power spectrum in the IF consists of a single line at 10MHz, with a power of about 0dBm.
- the second row in the candidate table is filled in as for the first one.
- the IF spectrum for an LO of 50MHz is shown in Figure 9a, Figure 9b shows the candidate RF spectrum that is entered in the table.
- Measurement number 2 is made with an LO frequency of 53MHz.
- the 360MHz signal now produces an IF of 11MHz at 0dBm, the 390MHz input signal an IF of 19MHz at -30dBm.
- These signals are now entered into the table at N.53MHz +/- IF. This is the first LO frequency for which both of the input signals have produced mixing products in the valid IF range.
- the IF spectrum, and candidate RF spectrum are shown in Figures 10a and 10b .
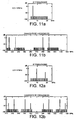
- Measurement numbers 3 to 6 are now made at LO frequencies of 55MHz, 57MHz, 58MHz and 61 MHz.
- the IFs produced are again entered into the table as candidate RF spectra. These are shown in Figures 11, 12 , 13 and 14 .
- Each IF spectrum is stored in memory table 15.
- control processor 1 addresses memory table 15, and, using the LO frequency which it has set, calculates which of frequency intervals of the RF spectrum could have given rise to the presence of the power levels present in the IF spectrum.
- Control processor 1 then stores in memory table 15 corresponding power levels at the calculated frequency intervals thereby creating the corresponding candidate RF spectrum.
- each column is examined to determine the power of the input signal present at that frequency.
- the noise level in the IF is assumed to be -80dB, and the token that indicates that no power could be assigned to that RF frequency for that measurement is -100dB .
- the 360MHz column shows one entry of 0dB, 5 entries of -30dB and one 'no entry' token.
- the 0dB entry can be identified as a spurious signal, with the input corresponding level being -30dB.
- the 370MHz column shows only 3 valid entries, and 4 entries that did not produce a valid IF frequency.
- 3 valid readings happens to be enough to produce a correct result, and would also have done so had one spurious signal occurred in this frequency range.
- 3 valid readings would not be sufficient to give good confidence that all spurious signals had been rejected.
- the number of LO frequencies and the frequencies themselves needs to be chosen to ensure that all frequencies in the output range do get a sufficient number of valid entries.
- the 'filtering' operation that needs to be applied to the columns is not the mean.
- One possible operation is the minimum valid signal. This will reject all spurious signals, though will not take advantage of the averaging that is possible with the multiple readings.
- Another is the median of all valid signals. This also rejects spurious signals (as long as too many spurious entries do not occur at this frequency) and reduces the variance of the final reading. The median also performs very nearly as well as the best algorithm now to be described.
- the best algorithm for dealing with the entries in each frequency column is a multipass process which first identifies spurious signals, as being a small number of large entries, and then eliminates these from further operations. The remaining valid entries are averaged to make a first estimate of the correct answer. The mean absolute difference, MAD, is then calculated for all of the entries. A new weighted mean is then calculated, giving a large weight to values close to the mean, and a zero weight to entries which are more than several MAD away from the mean. This process is iterated several times, until the weighted mean stops varying. This has the effect of eliminating from the average, spurious signals which cannot be safely recognised in the first pass of this process.
- This method for estimating the true value of several measurements is one example of so called 'robust' estimators, which allow for data contaminated with non- Gaussian noise.
- the contamination caused by the occurrence of spurious entries, and from moving, intermittent, modulated or noisy signals is non-Gaussian.
- control processor 1 controls the algorithm used by control processor 1, by addressing memory table 15 where the candidate RF spectra are stored.
- Control processor 1 stores the resulting final RF power spectrum in memory 15. It is displayed on display device 16.
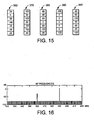
- Figure 16 shows the resulting Final RF spectrum where a simple median filter has been applied to all valid entries in each frequency column.
- the two inputs signals at 360MHz and 390MHz are clearly identified, and all spurious copies of them have been eliminated.
- the IF noise level of -80dB is shown.
- the LO frequency step resolution, the low frequency spectrum analyser resolution and the candidate table frequency resolution in the above example were all 1MHz. In practice, there is no need for these three frequency resolutions to be equal, or even rationally related.
- the low frequency spectrum analyser resolves an input signal that has only a line spectrum, the power of this signal will fall into several adjacent resolution bins. These bins can be mapped to the closest bins in the candidate RF table, or can be mapped by interpolation of the frequency.
- the algorithms above work where the RF environment is known to be stationary, i.e. sources are not hopping, pulsed, frequency modulated over a range wider than the resolution of the IF spectrum analyser, or otherwise time-varying. Note that if a source is frequency modulated over a deviation of less than a resolution bandwidth, the signal power will appear at all times at its nominal frequency. If the RF input is known or suspected to be non-stationary, then the analysis has to be more sophisticated. A conventional spectrum analyser may not show hopped signals at all, and may show artefacts when displaying FM signals or pulsed signals, depending on the details of its sweep synchronisation with the signal.
- the first is where non-stationary signals are present in the input frequency range of the instrument, but outside the desired display range.
- the second case is where the non-stationary signals are required to be displayed.
- a test for time-varying input signals in the display range is to choose a small set of LO frequencies that gives complete cover over the desired display frequency range, and repeat this set of frequencies several times. If rows of the candidate RF table do not match for corresponding LO frequencies, at a level which allows for the normal noise variance of readings, then displayable time varying signals are indicated.
- the spurious IF frequencies caused by out of display range signals are rejected in the final processing exactly as before, however pulsed signals should cause less likelihood of false decisions than for stationary signals as they are present for less of the time.
- Hopped and frequency modulated signals should be no worse than for stationary spurious signals, assuming no unfortunate correlation between the signals and the set of LO frequencies.
- the example above used a monotonically increasing set of LO frequencies.
- a pseudo-random order for LO frequencies will minimise the possibility of the signal frequency correlating with the LO movement and causing errors by spuriously appearing at one possible output frequency too many times.
- the LO signal is made to dwell at each frequency setting for a relatively long period of time, while statistics are collected of the signal behaviour in the IF. If a signal is present for every measurement, then it is a stationary signal. If it appears regularly, then it is likely to be a pulsed or a regularly frequency modulated signal. If it appears irregularly, it is likely to be hopped or an irregularly modulated signal. The analyser dwells on this frequency long enough to observe several cycles of the lowest period of signal variation that it expects to find. Obviously a completely unknown signal may have a very long period, but this signal would in any case not be observable on a conventional spectrum analyser. Generally, time varying signals of importance to RF measurement have short periods, such as pulsed and hopped GSM signals, or FM broadcast signals carrying audio modulation.
- signals that appear in the IF only occasionally have been tentatively identified as such, they are entered into the candidate RF table as before, as an RF level or level range, together with a tag that identifies their possible type.
- a new LO frequency is chosen and the process is repeated. After a sufficient number of LO frequencies have been used, the candidate RF table is analysed as before.
Landscapes
- Physics & Mathematics (AREA)
- Mathematical Physics (AREA)
- General Physics & Mathematics (AREA)
- Monitoring And Testing Of Transmission In General (AREA)
- Superheterodyne Receivers (AREA)
- Radar Systems Or Details Thereof (AREA)
- Measuring Frequencies, Analyzing Spectra (AREA)
Applications Claiming Priority (3)
| Application Number | Priority Date | Filing Date | Title |
|---|---|---|---|
| GB9713305 | 1997-06-25 | ||
| GB9713305A GB2326724B (en) | 1997-06-25 | 1997-06-25 | A spectrum analyser |
| PCT/GB1998/001868 WO1998059252A1 (en) | 1997-06-25 | 1998-06-24 | A spectrum analyser |
Publications (2)
| Publication Number | Publication Date |
|---|---|
| EP0991951A1 EP0991951A1 (en) | 2000-04-12 |
| EP0991951B1 true EP0991951B1 (en) | 2011-08-10 |
Family
ID=10814841
Family Applications (1)
| Application Number | Title | Priority Date | Filing Date |
|---|---|---|---|
| EP98932291A Expired - Lifetime EP0991951B1 (en) | 1997-06-25 | 1998-06-24 | A spectrum analyser |
Country Status (5)
| Country | Link |
|---|---|
| US (1) | US6392397B1 (ko) |
| EP (1) | EP0991951B1 (ko) |
| JP (1) | JP4762382B2 (ko) |
| GB (1) | GB2326724B (ko) |
| WO (1) | WO1998059252A1 (ko) |
Families Citing this family (23)
| Publication number | Priority date | Publication date | Assignee | Title |
|---|---|---|---|---|
| US6512788B1 (en) * | 1998-11-02 | 2003-01-28 | Agilent Technologies, Inc. | RF output spectrum measurement analyzer and method |
| US7199818B1 (en) * | 2000-08-07 | 2007-04-03 | Tektronix, Inc. | Status ribbon for display for multiple channels/codes |
| US6888342B2 (en) * | 2000-09-01 | 2005-05-03 | Anritsu Company | Spectrum analyzer and vector network analyzer combined into a single handheld unit |
| WO2002029426A1 (fr) * | 2000-10-02 | 2002-04-11 | Advantest Corporation | Procede de mesure a balayage a conversion de frequence |
| DE10136626A1 (de) * | 2001-07-26 | 2003-02-20 | Siemens Ag | Verfahren und Vorrichtung zum Bestimmen des spektralen Verlaufs von elektromagnetischen Signalen innerhalb eines vorgegebenen Frequenzbereichs |
| US7373119B2 (en) | 2002-03-07 | 2008-05-13 | Telefonaktiebolaget Lm Ericsson (Publ) | Method and apparatus for analog-to-digital conversion |
| US7346101B2 (en) * | 2003-12-01 | 2008-03-18 | D-Link Corporation | Spectrum measurement system comprising PC and power meter |
| US7061220B1 (en) | 2004-06-24 | 2006-06-13 | The United States Of America As Represented By The Secretary Of The Army | Passive radio frequency power spectrum analyzer |
| JP4826747B2 (ja) * | 2006-02-24 | 2011-11-30 | 横河電機株式会社 | ブリルアン散乱光の周波数シフトの測定方法及びこれを用いた装置 |
| US20080020726A1 (en) * | 2006-07-14 | 2008-01-24 | Blackham David V | N-port signal separation apparatus with improved frequency selectivity and dynamic range |
| US20080052335A1 (en) * | 2006-08-01 | 2008-02-28 | Gee Edward C | Systems and methods for time domain to frequency domain conversion using frequency shifting |
| US8130880B1 (en) | 2007-05-23 | 2012-03-06 | Hypress, Inc. | Wideband digital spectrometer |
| EP2203799A4 (en) | 2007-10-22 | 2017-05-17 | Mobileaccess Networks Ltd. | Communication system using low bandwidth wires |
| EP2533069A1 (en) * | 2011-06-10 | 2012-12-12 | Sony Corporation | Signal processing unit and method |
| DE102011079086A1 (de) | 2011-06-14 | 2012-12-20 | Rohde & Schwarz Gmbh & Co. Kg | Verfahren und Messgerät zur Unterdrückung von Störsignalen |
| EP2829152A2 (en) | 2012-03-23 | 2015-01-28 | Corning Optical Communications Wireless Ltd. | Radio-frequency integrated circuit (rfic) chip(s) for providing distributed antenna system functionalities, and related components, systems, and methods |
| US20140293894A1 (en) * | 2013-03-28 | 2014-10-02 | Coming Optical Communications Wireless, Ltd. | Distributing dynamically frequency-shifted intermediate frequency (if) radio frequency (rf) communications signals in distributed antenna systems (dass), and related components, systems, and methods |
| US11265118B2 (en) * | 2013-06-26 | 2022-03-01 | Maxlinear Asia Singapore Private Limited | Spectrum analyzer integrated in a point-to-point outdoor unit |
| FR3014205B1 (fr) * | 2013-12-04 | 2016-01-01 | Thales Sa | Analyseur de spectre analogique |
| US9184960B1 (en) | 2014-09-25 | 2015-11-10 | Corning Optical Communications Wireless Ltd | Frequency shifting a communications signal(s) in a multi-frequency distributed antenna system (DAS) to avoid or reduce frequency interference |
| US11148832B2 (en) * | 2017-06-16 | 2021-10-19 | Iris Technology Corporation | Systems and methods for vibration control |
| CN112505408B (zh) * | 2020-11-19 | 2022-02-08 | 中国电子科技集团公司第三十研究所 | 一种微波光子测频装置与方法 |
| CN113589242B (zh) * | 2021-07-30 | 2024-04-30 | 米传科技(上海)有限公司 | 一种毫米波雷达接收回路频谱特性测量系统及方法 |
Family Cites Families (7)
| Publication number | Priority date | Publication date | Assignee | Title |
|---|---|---|---|---|
| NO831718L (no) * | 1983-05-13 | 1984-11-14 | Vingmed As | Fremgangsmaate og apparat ved blodstroem-hastighetsmaaling med ultralyd for dannelse av todimensjonal avbildning av blodets hastighet |
| GB2178535B (en) * | 1985-07-27 | 1988-11-09 | Rolls Royce | Digital noise generator |
| US4791577A (en) * | 1985-10-03 | 1988-12-13 | Trw Inc. | Frequency shift for removing spurious spectral components from spectrum analyzer output |
| US4918382A (en) * | 1989-03-20 | 1990-04-17 | Tektronix, Inc. | Method for distinguishing between real and spurious responses in a spectrum analyzer |
| CA2010830C (en) * | 1990-02-23 | 1996-06-25 | Jean-Pierre Adoul | Dynamic codebook for efficient speech coding based on algebraic codes |
| US5736845A (en) * | 1994-11-11 | 1998-04-07 | Advantest Corp. | Spectrum analyzer having image frequency eliminating device |
| US5629703A (en) * | 1995-08-09 | 1997-05-13 | Tektronix, Inc. | Method for reducing harmonic distortion in an analog-to-digital converter system |
-
1997
- 1997-06-25 GB GB9713305A patent/GB2326724B/en not_active Expired - Lifetime
-
1998
- 1998-06-24 EP EP98932291A patent/EP0991951B1/en not_active Expired - Lifetime
- 1998-06-24 WO PCT/GB1998/001868 patent/WO1998059252A1/en active Application Filing
- 1998-06-24 US US09/446,514 patent/US6392397B1/en not_active Expired - Lifetime
- 1998-06-24 JP JP50401799A patent/JP4762382B2/ja not_active Expired - Fee Related
Non-Patent Citations (1)
| Title |
|---|
| None * |
Also Published As
| Publication number | Publication date |
|---|---|
| GB2326724A (en) | 1998-12-30 |
| JP4762382B2 (ja) | 2011-08-31 |
| WO1998059252A1 (en) | 1998-12-30 |
| GB9713305D0 (en) | 1997-08-27 |
| GB2326724B (en) | 2002-01-09 |
| EP0991951A1 (en) | 2000-04-12 |
| JP2002506525A (ja) | 2002-02-26 |
| US6392397B1 (en) | 2002-05-21 |
Similar Documents
| Publication | Publication Date | Title |
|---|---|---|
| EP0991951B1 (en) | A spectrum analyser | |
| JP2002506525A5 (ko) | ||
| US5805460A (en) | Method for measuring RF pulse rise time, fall time and pulse width | |
| EP0660124B1 (en) | Phase noise measurement system and method | |
| US7957940B2 (en) | Method and system for the detection and/or removal of sinusoidal interference signals in a noise signal | |
| JPH08248070A (ja) | 周波数スペクトル分析装置 | |
| US7099417B2 (en) | Trace video filtering using wavelet de-noising techniques | |
| US6785527B2 (en) | Conversion spur avoidance in a multi-conversion radio frequency receiver | |
| JP2975410B2 (ja) | 電子測定装置及び周波数推定方法 | |
| US9450598B2 (en) | Two-stage digital down-conversion of RF pulses | |
| JP2005233932A (ja) | 広帯域不規則信号を解析する装置、広帯域信号を分解し表す装置、2つの広帯域不規則信号の間の偏移を確定する装置、物体検出装置、および解析装置の分離手段を作成する方法 | |
| CN111337746A (zh) | 一种射频信号检测定位方法 | |
| US20040057040A1 (en) | Method and device for identifying chemical substances | |
| US5099200A (en) | I.f. calibration system | |
| JP4408967B2 (ja) | スペクトル分析器 | |
| US7885421B2 (en) | Method and system for noise measurement with combinable subroutines for the measurement, identification and removal of sinusoidal interference signals in a noise signal | |
| US7010443B2 (en) | Noise measurement system and method | |
| US8718590B2 (en) | Downconversion of comb spectrum | |
| De Waele et al. | A time domain error measure for resampled irregular data | |
| CN100565224C (zh) | 用于频谱分析仪的频率转换器中实际谱线和影像谱线区分 | |
| US4982165A (en) | Set-on oscillator | |
| US10003419B1 (en) | Method and system of preventing interference caused by images | |
| Cummins | Light beating spectroscopy | |
| EP1657558A1 (en) | Image cancellation in frequency converters for spectrum analysers | |
| EP3565146A1 (en) | Detection of rf signal frequency |
Legal Events
| Date | Code | Title | Description |
|---|---|---|---|
| PUAI | Public reference made under article 153(3) epc to a published international application that has entered the european phase |
Free format text: ORIGINAL CODE: 0009012 |
|
| 17P | Request for examination filed |
Effective date: 20000113 |
|
| AK | Designated contracting states |
Kind code of ref document: A1 Designated state(s): DE FR |
|
| 17Q | First examination report despatched |
Effective date: 20001103 |
|
| APBN | Date of receipt of notice of appeal recorded |
Free format text: ORIGINAL CODE: EPIDOSNNOA2E |
|
| APBR | Date of receipt of statement of grounds of appeal recorded |
Free format text: ORIGINAL CODE: EPIDOSNNOA3E |
|
| APAF | Appeal reference modified |
Free format text: ORIGINAL CODE: EPIDOSCREFNE |
|
| RAP1 | Party data changed (applicant data changed or rights of an application transferred) |
Owner name: AEROFLEX INTERNATIONAL LIMITED |
|
| APBT | Appeal procedure closed |
Free format text: ORIGINAL CODE: EPIDOSNNOA9E |
|
| GRAP | Despatch of communication of intention to grant a patent |
Free format text: ORIGINAL CODE: EPIDOSNIGR1 |
|
| GRAS | Grant fee paid |
Free format text: ORIGINAL CODE: EPIDOSNIGR3 |
|
| GRAA | (expected) grant |
Free format text: ORIGINAL CODE: 0009210 |
|
| AK | Designated contracting states |
Kind code of ref document: B1 Designated state(s): DE FR |
|
| REG | Reference to a national code |
Ref country code: DE Ref legal event code: R096 Ref document number: 69842363 Country of ref document: DE Effective date: 20111020 |
|
| PLBE | No opposition filed within time limit |
Free format text: ORIGINAL CODE: 0009261 |
|
| STAA | Information on the status of an ep patent application or granted ep patent |
Free format text: STATUS: NO OPPOSITION FILED WITHIN TIME LIMIT |
|
| 26N | No opposition filed |
Effective date: 20120511 |
|
| REG | Reference to a national code |
Ref country code: DE Ref legal event code: R097 Ref document number: 69842363 Country of ref document: DE Effective date: 20120511 |
|
| REG | Reference to a national code |
Ref country code: FR Ref legal event code: CD Owner name: AEROFLEX LIMITED, GB Effective date: 20131230 |
|
| REG | Reference to a national code |
Ref country code: FR Ref legal event code: PLFP Year of fee payment: 19 |
|
| PGFP | Annual fee paid to national office [announced via postgrant information from national office to epo] |
Ref country code: DE Payment date: 20160621 Year of fee payment: 19 |
|
| PGFP | Annual fee paid to national office [announced via postgrant information from national office to epo] |
Ref country code: FR Payment date: 20160627 Year of fee payment: 19 |
|
| REG | Reference to a national code |
Ref country code: DE Ref legal event code: R119 Ref document number: 69842363 Country of ref document: DE |
|
| REG | Reference to a national code |
Ref country code: FR Ref legal event code: ST Effective date: 20180228 |
|
| PG25 | Lapsed in a contracting state [announced via postgrant information from national office to epo] |
Ref country code: DE Free format text: LAPSE BECAUSE OF NON-PAYMENT OF DUE FEES Effective date: 20180103 |
|
| PG25 | Lapsed in a contracting state [announced via postgrant information from national office to epo] |
Ref country code: FR Free format text: LAPSE BECAUSE OF NON-PAYMENT OF DUE FEES Effective date: 20170630 |
|
| REG | Reference to a national code |
Ref country code: DE Ref legal event code: R082 Ref document number: 69842363 Country of ref document: DE Representative=s name: MURGITROYD & COMPANY, DE Ref country code: DE Ref legal event code: R081 Ref document number: 69842363 Country of ref document: DE Owner name: VIAVI SOLUTIONS UK LIMITED, NEWBURY, GB Free format text: FORMER OWNER: AEROFLEX LIMITED, STEVENAGE, HERTFORDSHIRE, GB Ref country code: DE Ref legal event code: R082 Ref document number: 69842363 Country of ref document: DE Representative=s name: MURGITROYD GERMANY PATENTANWALTSGESELLSCHAFT M, DE |