EP0627616A2 - Verfahren zur Schwebungfrekwenzbestimmung eines FOVM-Fühler - Google Patents
Verfahren zur Schwebungfrekwenzbestimmung eines FOVM-Fühler Download PDFInfo
- Publication number
- EP0627616A2 EP0627616A2 EP94303943A EP94303943A EP0627616A2 EP 0627616 A2 EP0627616 A2 EP 0627616A2 EP 94303943 A EP94303943 A EP 94303943A EP 94303943 A EP94303943 A EP 94303943A EP 0627616 A2 EP0627616 A2 EP 0627616A2
- Authority
- EP
- European Patent Office
- Prior art keywords
- block
- vibration
- time interval
- extrema
- vibration signal
- Prior art date
- Legal status (The legal status is an assumption and is not a legal conclusion. Google has not performed a legal analysis and makes no representation as to the accuracy of the status listed.)
- Withdrawn
Links
Images


Classifications
-
- H—ELECTRICITY
- H02—GENERATION; CONVERSION OR DISTRIBUTION OF ELECTRIC POWER
- H02K—DYNAMO-ELECTRIC MACHINES
- H02K11/00—Structural association of dynamo-electric machines with electric components or with devices for shielding, monitoring or protection
-
- G—PHYSICS
- G01—MEASURING; TESTING
- G01H—MEASUREMENT OF MECHANICAL VIBRATIONS OR ULTRASONIC, SONIC OR INFRASONIC WAVES
- G01H1/00—Measuring characteristics of vibrations in solids by using direct conduction to the detector
- G01H1/12—Measuring characteristics of vibrations in solids by using direct conduction to the detector of longitudinal or not specified vibrations
- G01H1/14—Frequency
Definitions
- the present invention relates generally to electrical generators, and more particularly to a system for monitoring the vibration of an electrical generator.
- U.S. Patent No. 5,146,776, September 15, 1992, titled Method for Continuously Calibrating an Optical Vibration Sensor discloses a system for automatically calibrating a fiber optic vibration monitor (FOVM) employing a cantilever-mounted grid attached to a generator.
- the grid interrupts a light beam at a frequency directly proportional to the sensor's vibrational amplitude at a singular driving frequency (i.e., 120Hz).
- the patent teaches how troublesome conditions of the generator can be detected at an early stage by measuring the vibration amplitude of a generator end-winding. This allows maintenance to be scheduled to avoid damage to the generator and minimize down time.
- the system employs the amplitude of the signal at the "extrema" to determine the beat frequency.
- the extrema are the furthest points in the grid's motion as it oscillates about its equilibrium position.
- the largest wavelengths in the frequency modulated output signal i.e., the points in the waveform where the zero crossings are spread apart the most) correspond to the extrema, since the extrema are where the grid comes momentarily to rest before reversing direction.
- the present invention addresses the problem that occurs when the beat amplitude becomes large enough to cause a fold-over, distorting the beat frequency. This problem also occurs in connection with a small beat amplitude when the signal at the extrema occurs near the peak signal values. When fold-overs occur, they distort the beat signal determined from the extrema such that it becomes extremely difficult to determine the beat frequency, making it practically impossible to accurately determine the resonant frequency of the sensor. Moreover, the resonant frequency drifts (changes) with temperature and with age of the sensor. Therefore, one cannot assume that the resonant frequency of the sensor is whatever it was designed to be. It must be measured in the field, while the generator is operating.
- the present invention resides in a method for determining a beat frequency in a vibration sensing system attached to equipment characterized by the steps of generating a vibration signal indicative of a vibrational frequency and amplitude of the equipment; and obtaining a beat frequency from the vibration signal by storing and processing time interval data representing the time intervals between zero crossings of the vibration signal.
- the present invention provides a method for use in an FOVM system for measuring the motion of the grid at the extrema.
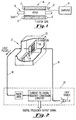
- the system utilizing the method described hereinafter is illustrated in Figure 1.
- a generator 10, optical vibration sensor 12, and computer 14 constitute the vibration sensing system 16.
- the optical vibration sensor 12 is mounted directly to an end-winding 17 of the generator 10.
- the massive exciter-end and turbine-end end-turns of the generator are consolidated into semi-ridged baskets to prevent damaging effects of the 120Hz vibration coupled into the system from the rotor field.
- the sensor monitors the end-turn vibration to provide warning signals when destructive levels of vibration exist or when the vibration level is increasing.
- the vibration may then be controlled through load management or change in coolant gas temperature until an outage can be scheduled for the generator.
- FIG. 2 illustrates the optical vibration sensor 12 in more detail.
- the optical vibration sensor 12 receives light from an optical fiber cable 18.
- the sensor includes a housing 20 and an optical-to-digital conversion unit 22.
- the housing 20 includes an internal reed 24 and a grid assembly 26.
- the internal reed 24 and the grid assembly 26 are designed to have a natural resonant frequency above 120Hz.
- the resonant frequency is approximately 132Hz for a 60Hz generator application.
- the grid assembly 26 moves up and down, causing light pulses to be produced.
- the number of light pulses produced in a given time interval is proportional to the amplitude of the 120Hz (100Hz in Europe) vibration being measured.
- the grid assembly 26 has evenly spaced grid openings separated by 10 mils.
- the light pulses are output from the casing 20 through the optical fiber cable 18 to the optical-to-electrical conversion unit 22.
- the optical-to-electrical conversion unit 22 converts the light pulses into a digital signal according to a conventional method.
- a photodiode can be utilized to convert the light pulses to an electrical signal which can then be converted into a digital frequency output signal.
- the output signal waveform takes the form of a frequency modulated sine wave.
- the signal is, furthermore, slightly frequency-modulated by the mixing of the 120Hz excitation with the resonant frequency of the sensor.
- the system employs curve fitting of the beat signal peaks to a trigonometric function of the form sin(2 ⁇ f B t) to determine the beat frequency f B .
- the beat frequency is then used to calibrate the system.
- the resonant frequency f0 of the optical vibration sensor determines the amplification factor M0.
- the measured amplitude i.e., as determined by the light pulse signal
- the measured amplitude must be divided by the amplification factor.
- the system employs the amplitude of the signal at the "extrema" to determine the beat frequency.
- the extrema are the furthest points in the grid's motion as it oscillates about its equilibrium position.
- the largest wavelengths in the frequency modulated output signal i.e., the points in the waveform where the zero crossings are spread apart the most) correspond to the extrema, since the extrema are where the grid comes momentarily to rest before reversing direction.
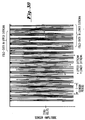
- FIG. 3B An illustration of a small fold-over phenomenon is shown in Figure 3B. Very large fold-overs often occur in the field. However, the waveform extrema for such large fold-overs are difficult to visulalize and thus are not depicted.
- the amplification factor M0 To determine the actual displacement of the generator due to vibration at 120Hz, the amplification factor M0 must be determined. To determine the amplification factor, the resonant frequency of the sensor (f0 + f B ) must be accurately determined.
- Figure 3C depicts an exemplary sensor waveform (voltage amplitude over two cycles).
- the extremum intervals for an upper extremum and a lower extremum are also shown.
- the upper extremum is represented by the "x" (position extremum) or the line “A” (time interval extremum) and the lower extremum interval is represented by the "o” or the line “B.”
- the upper extrema can be represented equally well by the distance X (i.e., the distance from 0 to x) or the time interval A in Figure 3C.
- the lower extrema can be represented by the distance O or the time interval B.
- the time interval representation will be used herein for the following reason.
- X tends to "hang-up" at P as the beat amplitude is increased. This is caused by the full intensity of light being received by the optical sensor for positions of the grid around the position at which light passes through. At a lower extremum, this occurs for the stop between two adjacent slits, i.e., the stop can move but it still blocks light for a certain small swing of the grid.
- this time interval changes in a manner analogous to the change in amplitude of the signal at the extremum.
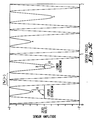
- a fold-over occurs when the beat amplitude or vibrational amplitude causes the sensor signal (i.e., waveform) to cut the zero amplitude axis and thereby define a new extremum time interval in a discontinuous manner.
- the same discontinuity occurs in the method disclosed in U.S. Patent No. 5,146,776 when the signal experiences fold-over at upper and lower peaks.
- Figure 3D illustrates a discontinuous change in the extremum time interval as the upper extrema pass from interval A to interval B.
- Preferred embodiments of the present invention collect and process only signal zero crossing times and do not digitize the complete sensor signal. This greatly reduces data acquisition requirements and permits a highly accurate measurement.
- An existing Blade Vibration Monitor (BVM) 32MHz card zero crossing card
- the BVM card is able to determine the signal zero crossing times to within 30 billionths of a second, permitting a very accurate measurement of the beat frequency.
- Data files are typically 12,000 entries long. To achieve the same accuracy, the direct digitization procedure disclosed in the patent would require a 320,000 entry data file. Most of this data would be discarded. However, considerable time and expensive hardware are required to accomplish this. Therefore, the present invention minimizes the required data and reduces hardware cost and computer processing time.
- the algorithm described below determines the beat frequency in the FOVM sensor when a high beat frequency amplitude causes one or more additional grid slits to pass light. This phenomenon causes fold-over.
- Two types of extrema, upper and lower, are generated in the sensor signal each sensor cycle.
- An extremum time interval is determined by the signal zero crossings on either side of each extremum. The upper extremum interval occurs when the grid momentarily comes to rest at the very top of its path. Likewise, the lower extremum interval occurs when the grid momentarily comes to rest at the bottom of its path.
- the beat causes a small modulation in the extremum time intervals.
- a plot of lower extremum intervals vs. sensor cycles results in a sinewave with a frequency equal to that of the beat.
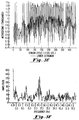
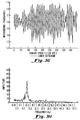
- Figure 3E depicts the extremum time interval, referred to herein as "DELTA()," at the lower extrema occurring once each sensor cycle for 450 sensor cycles. This highly chaotic and discontinuous waveform shows no harmonic beat signal.
- Figure 3F depicts a Fourier Transform of this data. The beat frequency expected at 12.6Hz is lost in the noise generated by the fold-overs (added zero crossings) at the extrema.
- the extremum interval DELTA() is expanded by summing over the appropriate number of adjacent intervals to account for beat amplitude increase or decrease when fold-over occurs.
- the algorithm described below determines when a fold-over has occurred and extends the measured time interval DELTA() by adding to that interval at the extrema the correct number of intervals on either side of the extremum interval.
- the algorithm may be implemented with computer software written, e.g., in the QUICK BASIS (by Microsoft) programming language.
- DELTA() at a minimum is one center time interval but may be that center time interval plus one, two, three, or more time intervals on either side of the center time interval. Determining how many intervals about the extremum interval to sum over is complicated by the following:
- the odd DELTA() are the correct expanded time intervals for each upper extremum and the even DELTA() are the correct expanded time intervals for each lower extremum.
- Figure 3G depicts a plot of DELTA() for the lower extrema for the same data used in Figure 3E. Unlike Figure 3E, however, the extrema intervals DELTA() are expanded by the addition of the correct number of adjacent time intervals. The beat is clearly and unambiguously seen.
- a zero crossing I/O card produces a one-dimensional data array Z() (e.g., with approximately 10,000 entries) representing the absolute time (clock count) at which the FOVM sensor voltage crossed the zero volt level.
- Z() is therefore an array of monotonically increasing numbers representing zero crossing times as clock counts. There are 10,000 storage locations in the Z() array in one exemplary embodiment of the invention.
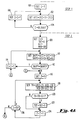
- steps 1-5 perform the following functions: Step-1 calculates time intervals (clock counts) between consecutive zero crossing. The respective clock counts are stored in the X() array. Step-2 finds positions of extrema time intervals in the X() array (K of them), finds the number of intervals that occur between adjacent extrema (represented by J%()), and finds the minimum number of intervals that occur between any two neighboring extrema. This minimum number is represented by the variable MIN. As the beat amplitude increases, more time intervals about the extrema time interval must be summed.
- Step-3 finds the first point (START) in the series of extrema where the beat amplitude is a minimum and subsequently only one time interval is required to form the corrected time interval data (represented by DELTA()), i.e., there is no fold-over.
- Step-5 comprises a backward chain from K-1 to 0 that determines whether the number of time intervals to be summed over should change based on the number of interval counts J%() between extrema occurring after the last extremum of this type, i.e., upper or lower.
- the variable "I" is set to 1.
- X(I) is set to Z(I + 1) - Z(I).
- I is compared to 10,000. If I is not equal to 10,000, the program branches to block 106; otherwise it proceeds to block 108.
- I is set to I + 1.
- I is set to 5
- TOT is set to 0
- K is set to 1
- MIN is set to 100.
- "SKIP1" is set to X(I) + X(I+1)
- SKIP2 is set to X(I + 3) + X(I + 4).
- SKIP1 is compared to SKIP2. If SKIP1 is less than SKIP2, the program proceeds to block 114; otherwise it proceeds to block 116.
- I is set to I + 1 and the program branches back to block 110.
- blocks 110-114 look ahead to ensure that the time intervals are increasing in length. This ensures that the symmetric point in the time interval array X() that occurs between extrema is not detected.
- T1 is set to the absolute value of (X(I+J) - X(I-J)) divided by the quantity (X(I+J) + X(I-J)).
- T1 is compared to a trigger variable "TR," which in preferred embodiments is equal to 0.1. If T1 is less than TR, the program branches to block 122; otherwise it proceeds to block 124.
- TOT is set to TOT + 1.
- J is set to J + 1.
- J is compared to the number 5. If J is less than 5, the program branches back to block 118; otherwise it proceeds to block 128.
- TOT is compared with the number 3.
- the program branches back to block 114 (Fig. 4A); otherwise it proceeds to block 130.
- the variable EX(K) is set to I.
- J%(K) is set to EXT(K) - EXT(K-1) - 1.
- J%(K) is compared to MIN. If J%(K) is less than MIN, the program branches to block 136; otherwise it proceeds to block 138.
- MIN is set to J%(K).
- the index I is set to the integer value of (I + J%(K)/2 + 2). The program then branches back to block 116 (Fig. 4A), i.e., if I is less than 10,000 (the test to determine whether I is less that 10,000 is not depicted in the drawings).
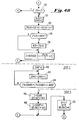
- Block 118 calculates a symmetry parameter T1.
- decision block 120 corresponding time intervals on either side of the Ith interval are judged symmetric.
- block 122 the program counts the number of corresponding time intervals about the Ith interval that are symmetric.
- block 126 the program tests four corresponding time intervals about the Ith time interval for symmetry.
- block 128, the program assures that three of four corresponding interval are judged symmetric for the Ith time interval to be judged in extremum.
- the program identifies the location of the extremum just found (i.e., the Kth extremum) in the time interval array X(). This is called the upper extrema.
- the program determines the minimum number of time intervals that occur between extremum K and the previous extremum K - 1.
- the program records the number of time intervals that has been measured between the extremum. This number is assigned to the variable MIN.
- the index I is incremented to skip over the next symmetric time interval that occurs between extrema.
- the position EXT(K) of all K extrema in the time interval array X(I) have been found.
- the odd K are arbitrarily identified as upper extrema and even K are identified as lower extrema.
- the number of time intervals that occur between extrema is also calculated and stored in the variable array J%(K).
- the minimum value stored in the J%() array is stored in the variable MIN.
- Step-3 begins at block 140 by setting START to 0.
- START is set to START + 1.
- J%(START), J%(START + 1), and MIN are compared. If the three are not equal to one another, the program branches back to block 142; otherwise it proceeds to block 146. In this manner, the program finds the first time that two adjacent extrema equals MIN.
- the index I is set to START and DELTA(I) is set to X(I).
- I is set to START + 1 and DELTA(I) is set to X(I).
- the first two corrected time intervals (DELTA()) have a sum index S1() equal to 0.
- the program is only required to sum over the center interval for these two extrema.
- I is set to I + 1, Q is set to 0, and DELTA(I) is set to 0.
- J%(I - 1) is compared to J%(I). If the former is greater than the latter, the program branches to block 154; otherwise it proceeds to block 156.
- the sum index S1(I) is set to S1(I - 2) - 1.
- J%(I - 1) is compared to J%(I). If the former is less than the latter, the program branches to block 158; otherwise it proceeds to block 160.
- S1(I) is set equal to S1(I - 2) + 1.
- the sum index S1(I) is set to S1(I-2).
- Block 154 decrements the sum index S(1) by 1 if the interval count J%() decreases.
- Block 158 increments the sum index S1() by 1 if the interval count J%() increases.
- Block 160 leaves the sum index S1() unchanged, i.e., if the interval count neither decreases nor increases.
- S1(I) is compared to 0. If it is equal to 0, the program branches to block 172; otherwise it proceeds to block 166.
- the variable Q is set equal to Q + 1.
- DELTA(I) is set equal DELTA(I) + X(I+Q) + X(I-Q).
- Q is compared with S1(I). If the two are equal, the program proceeds to block 172; otherwise it branches back to block 166. Therefore, blocks 164-170 sum up the two S1() time intervals on either side of the center time interval (this may be done more than once for a multiple fold-over).
- DELTA(I) is set equal to DELTA(I) + X(I). Block 172 adds in the center time interval.
- I is compared with K. If I is less than K, the program branches back to block 150 (Fig. 4B); otherwise it proceeds to block 176 (Fig. 4D). Thus, the program returns to the start for analysis of the next higher extremum if I is less than K; otherwise it exits to begin the backward chain.
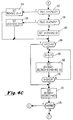
- the program at block 176 sets the index I to START.
- I is set to I - 1
- Q is set to 0, and DELTA(I) is set to 0.
- J%(I + 2) is compared with J%(I + 1). If the former is greater than the latter, the program branches to block 182; otherwise it proceeds to block 184.
- S1(I) is set equal to S1(I + 2) - 1.
- J%(I + 2) is compared with J%(I + 1). If the former is less than the latter, the program branches to block 186; otherwise it proceeds to block 188.
- S1(I) is set equal to S1(I + 2) + 1.
- blocks 180-188 determine whether the number of time intervals to be summed over should change based on the number of interval counts between extrema occurring after the last extremum of this type, i.e., upper or lower.
- the program decrements the sum index S1() if the interval count J%() increases.
- the program increments the sum index S1() if the interval count J%() decreases.
- the sum index S1() is unchanged, i.e., if the interval count neither increases nor decreases.
- S1(I) is compared with 0. If it is equal to 0, the program proceeds to block 192; otherwise it branches to block 194.
- DELTA(I) is set equal to DELTA(I) + X(I).
- Q is set equal to Q + 1.
- DELTA(I) is set equal to DELTA(I) + X(I + Q) + X(I - Q).
- Q is compared with S1(I). If the two are equal, the program branches to block 192; otherwise it loops back to block 194.
- blocks 190-198 sum up the two S1(I) time intervals on either side of the center time interval I, and repeats this process if a multiple fold-over exists.
- Block 192 adds in the center time interval I.
- the dependent variable DELTA(2I), I 1-512, has the units of time. However, this is not important, since only the variation in time (frequency) of this signal is used.
- the variable 2I is therefore also representative of time.
- a Fourier Transform or FFT on DELTA(2I) and then on DELTA(2I -1) will yield identical sensor beat frequency F B with a resolution of 0.117Hz.
- the sensor natural frequency F N equals 120Hz + F B .
Landscapes
- Physics & Mathematics (AREA)
- General Physics & Mathematics (AREA)
- Engineering & Computer Science (AREA)
- Power Engineering (AREA)
- Measurement Of Mechanical Vibrations Or Ultrasonic Waves (AREA)
- Testing Of Devices, Machine Parts, Or Other Structures Thereof (AREA)
Applications Claiming Priority (2)
| Application Number | Priority Date | Filing Date | Title |
|---|---|---|---|
| US69495 | 1987-07-02 | ||
| US08/069,495 US5469745A (en) | 1993-06-01 | 1993-06-01 | System for determining FOVM sensor beat frequency |
Publications (2)
| Publication Number | Publication Date |
|---|---|
| EP0627616A2 true EP0627616A2 (de) | 1994-12-07 |
| EP0627616A3 EP0627616A3 (de) | 1997-07-09 |
Family
ID=22089375
Family Applications (1)
| Application Number | Title | Priority Date | Filing Date |
|---|---|---|---|
| EP94303943A Withdrawn EP0627616A3 (de) | 1993-06-01 | 1994-06-01 | Verfahren zur Schwebungfrekwenzbestimmung eines FOVM-Fühler. |
Country Status (8)
| Country | Link |
|---|---|
| US (1) | US5469745A (de) |
| EP (1) | EP0627616A3 (de) |
| JP (1) | JP3404129B2 (de) |
| KR (1) | KR100317014B1 (de) |
| CN (1) | CN1043588C (de) |
| CA (1) | CA2124761A1 (de) |
| MX (1) | MX9404100A (de) |
| SI (1) | SI9400245A (de) |
Cited By (2)
| Publication number | Priority date | Publication date | Assignee | Title |
|---|---|---|---|---|
| US6046602A (en) * | 1997-02-17 | 2000-04-04 | Asea Brown Boveri Ag | Method for determining the state of strength of winding overhangs of electric machines, and arrangement for carrying out the method |
| US9939458B2 (en) | 2015-08-27 | 2018-04-10 | General Electric Company | Insulated accelerometer assembly for high voltage environment |
Families Citing this family (17)
| Publication number | Priority date | Publication date | Assignee | Title |
|---|---|---|---|---|
| NL9401949A (nl) * | 1994-11-22 | 1996-07-01 | Skf Ind Trading & Dev | Werkwijze voor het analyseren van regelmatig geëxciteerde mechanische trillingen. |
| KR100477504B1 (ko) * | 2002-12-09 | 2005-03-17 | 한국전기연구원 | 에프에프티를 이용한 실시간 전력계통 진동 감시장치 |
| US20040212353A1 (en) * | 2003-04-25 | 2004-10-28 | Siemens Westinghouse Power Corporation | Use of a closing impedance to minimize the adverse impact of out-of-phase generator synchronization |
| DE10323063A1 (de) * | 2003-05-20 | 2004-12-09 | Endress + Hauser Gmbh + Co. Kg | Verfahren zur Füllstandsmessung |
| US7533572B2 (en) * | 2006-08-15 | 2009-05-19 | Siemens Energy, Inc. | High bandwidth fiber optic vibration sensor |
| KR100883394B1 (ko) * | 2007-04-03 | 2009-02-11 | 주식회사 대웅컨설턴트 | 계측 관리형 진동현의 고유 주파수 측정 방법 |
| CN101299635B (zh) * | 2008-05-09 | 2010-09-15 | 东南大学 | 宽域全光纤扰动信号前-后判别装置及方法 |
| US20110018483A1 (en) * | 2009-07-21 | 2011-01-27 | General Electric Company | Stator end-winding component monitoring system |
| US8379225B2 (en) * | 2010-03-31 | 2013-02-19 | General Electric Company | System for monitoring a relative displacement of components |
| EP2634898A1 (de) * | 2012-03-01 | 2013-09-04 | Siemens Aktiengesellschaft | Verfahren zum Betreiben einer elektrischen Maschine |
| US10254773B2 (en) * | 2012-09-25 | 2019-04-09 | Lord Corporation | Devices, systems, and methods for balancing closely coupled rotating machinery |
| CN103558008B (zh) * | 2013-11-20 | 2017-02-08 | 无锡波汇光电科技有限公司 | 一种风洞试验中光纤传感振动信号的采集装置 |
| US9551598B2 (en) | 2014-05-12 | 2017-01-24 | Siemens Energy, Inc. | Fiber optic sensing apparatus with an improved fiber-affixing device |
| US11709244B2 (en) * | 2019-10-21 | 2023-07-25 | Banner Engineering Corp. | Near range radar |
| CN111397877B (zh) * | 2020-04-02 | 2021-07-27 | 西安建筑科技大学 | 一种旋转机械拍振故障检测与诊断方法 |
| CN113091879B (zh) * | 2021-04-01 | 2022-09-06 | 陕西电力建设集团有限公司 | 一种高压输电线路导线风振检测装置 |
| CN119469366B (zh) * | 2024-11-06 | 2025-11-21 | 国网江西省电力有限公司九江供电分公司 | 一种光纤周界振动监测方法及系统 |
Family Cites Families (10)
| Publication number | Priority date | Publication date | Assignee | Title |
|---|---|---|---|---|
| US4283634A (en) * | 1971-06-23 | 1981-08-11 | Westinghouse Electric Corp. | System and method for monitoring and controlling operation of industrial gas turbine apparatus and gas turbine electric power plants preferably with a digital computer control system |
| US4321464A (en) * | 1978-06-08 | 1982-03-23 | Westinghouse Electric Corp. | Device for measuring vibration phase and amplitude |
| US4218614A (en) * | 1978-06-08 | 1980-08-19 | Westinghouse Electric Corp. | Device for measuring vibration amplitude |
| DE3112188A1 (de) * | 1980-03-31 | 1982-01-14 | Hitachi, Ltd., Tokyo | Verfahren und vorrichtung zur ueberwachung der schwingung einer sich drehenden welle |
| US4429609A (en) * | 1981-12-14 | 1984-02-07 | Warrender David J | Pitch analyzer |
| JPS61207195A (ja) * | 1985-03-08 | 1986-09-13 | Mitsubishi Electric Corp | モ−タ制御装置 |
| JPH0364294A (ja) * | 1989-08-02 | 1991-03-19 | Nec Corp | 周波数検出回路 |
| US5109700A (en) * | 1990-07-13 | 1992-05-05 | Life Systems, Inc. | Method and apparatus for analyzing rotating machines |
| US5069071A (en) * | 1990-08-27 | 1991-12-03 | United Technologies Corporation | Vibration monitoring in the frequency domain with a capacitive accelerometer |
| US5146776A (en) * | 1990-11-26 | 1992-09-15 | Westinghouse Electric Corp. | Method for continuously calibrating an optical vibration sensor |
-
1993
- 1993-06-01 US US08/069,495 patent/US5469745A/en not_active Expired - Lifetime
-
1994
- 1994-05-30 CN CN94106304A patent/CN1043588C/zh not_active Expired - Fee Related
- 1994-05-31 KR KR1019940012086A patent/KR100317014B1/ko not_active Expired - Lifetime
- 1994-05-31 CA CA002124761A patent/CA2124761A1/en not_active Abandoned
- 1994-06-01 MX MX9404100A patent/MX9404100A/es not_active IP Right Cessation
- 1994-06-01 EP EP94303943A patent/EP0627616A3/de not_active Withdrawn
- 1994-06-01 JP JP14397994A patent/JP3404129B2/ja not_active Expired - Lifetime
- 1994-06-01 SI SI9400245A patent/SI9400245A/sl unknown
Cited By (2)
| Publication number | Priority date | Publication date | Assignee | Title |
|---|---|---|---|---|
| US6046602A (en) * | 1997-02-17 | 2000-04-04 | Asea Brown Boveri Ag | Method for determining the state of strength of winding overhangs of electric machines, and arrangement for carrying out the method |
| US9939458B2 (en) | 2015-08-27 | 2018-04-10 | General Electric Company | Insulated accelerometer assembly for high voltage environment |
Also Published As
| Publication number | Publication date |
|---|---|
| SI9400245A (en) | 1994-12-31 |
| EP0627616A3 (de) | 1997-07-09 |
| MX9404100A (es) | 1995-01-31 |
| US5469745A (en) | 1995-11-28 |
| KR950002171A (ko) | 1995-01-04 |
| JPH06347318A (ja) | 1994-12-22 |
| JP3404129B2 (ja) | 2003-05-06 |
| CA2124761A1 (en) | 1994-12-02 |
| CN1097872A (zh) | 1995-01-25 |
| CN1043588C (zh) | 1999-06-09 |
| KR100317014B1 (ko) | 2002-02-28 |
Similar Documents
| Publication | Publication Date | Title |
|---|---|---|
| US5469745A (en) | System for determining FOVM sensor beat frequency | |
| JPH0612296B2 (ja) | 振動センサの較正方法及び振動検知装置 | |
| EP2111535B1 (de) | Drahtvibrationssensor mit spektralanaylse | |
| EP0790484B1 (de) | Korrekturmechanismus für den horizontalen Positionsfehler in einem elektronischen Nivelliergerät | |
| CN114354112B (zh) | 一种叶片多阶耦合振动疲劳分析方法 | |
| US6934649B2 (en) | Waveform detection system and state-monitoring system | |
| AU2010271044A1 (en) | Determining the resonance parameters for mechanical oscillators | |
| US7134344B2 (en) | Control method and apparatus | |
| CN119944421A (zh) | 一种拉曼激光载波边带比反馈控制系统及其控制方法 | |
| JPH07198471A (ja) | 振動源位置検出器及び振動源位置検出装置 | |
| EP0300265B1 (de) | Verfahren für digitale Ton-Erkennung | |
| KR100772840B1 (ko) | 아날로그/디지털 변환기의 선형특성 테스트장치 및 그 방법 | |
| JPH06308167A (ja) | 実効値等の測定装置 | |
| JPH11287859A (ja) | レーザ距離計 | |
| RU2101686C1 (ru) | Способ измерения периодического закона движения вибрирующей поверхности | |
| JP2005214932A5 (de) | ||
| RU236709U1 (ru) | Устройство дистанционного измерения коэффициента преобразования пьезоэлектрического акселерометра на работающем оборудовании | |
| JP2006313160A (ja) | ジッタ測定装置、及びジッタ測定方法 | |
| RU124411U1 (ru) | Система обработки и анализа данных цифровых регистраторов для мониторинга переходных режимов в энергообъединении | |
| JPH0781909B2 (ja) | 光ビームが有する電磁界の強度分布の横モーメントを測定するための方法と装置 | |
| SU1000896A1 (ru) | Электромагнитное многочастотное устройство дл неразрушающего контрол | |
| RU2047835C1 (ru) | Способ определения угла наклона | |
| JPH02263126A (ja) | レーザ出力光監視装置 | |
| JPH0883265A (ja) | 振動信号解析装置 | |
| JP2505287B2 (ja) | ディジタル型フィルタ装置 |
Legal Events
| Date | Code | Title | Description |
|---|---|---|---|
| PUAI | Public reference made under article 153(3) epc to a published international application that has entered the european phase |
Free format text: ORIGINAL CODE: 0009012 |
|
| AK | Designated contracting states |
Kind code of ref document: A2 Designated state(s): BE ES FR IT |
|
| PUAL | Search report despatched |
Free format text: ORIGINAL CODE: 0009013 |
|
| AK | Designated contracting states |
Kind code of ref document: A3 Designated state(s): BE ES FR IT |
|
| 17P | Request for examination filed |
Effective date: 19980108 |
|
| 17Q | First examination report despatched |
Effective date: 19980401 |
|
| STAA | Information on the status of an ep patent application or granted ep patent |
Free format text: STATUS: THE APPLICATION HAS BEEN WITHDRAWN |
|
| 18W | Application withdrawn |
Withdrawal date: 19980520 |