EP0448322A2 - Automatische Bestimmung von Impulsparametern von Vielwert-Funktionen - Google Patents
Automatische Bestimmung von Impulsparametern von Vielwert-Funktionen Download PDFInfo
- Publication number
- EP0448322A2 EP0448322A2 EP91302303A EP91302303A EP0448322A2 EP 0448322 A2 EP0448322 A2 EP 0448322A2 EP 91302303 A EP91302303 A EP 91302303A EP 91302303 A EP91302303 A EP 91302303A EP 0448322 A2 EP0448322 A2 EP 0448322A2
- Authority
- EP
- European Patent Office
- Prior art keywords
- summing
- signal
- values
- amplitude
- address
- Prior art date
- Legal status (The legal status is an assumption and is not a legal conclusion. Google has not performed a legal analysis and makes no representation as to the accuracy of the status listed.)
- Withdrawn
Links
Images


Classifications
-
- G—PHYSICS
- G01—MEASURING; TESTING
- G01R—MEASURING ELECTRIC VARIABLES; MEASURING MAGNETIC VARIABLES
- G01R13/00—Arrangements for displaying electric variables or waveforms
- G01R13/20—Cathode-ray oscilloscopes
- G01R13/22—Circuits therefor
- G01R13/32—Circuits for displaying non-recurrent functions such as transients; Circuits for triggering; Circuits for synchronisation; Circuits for time-base expansion
- G01R13/325—Circuits for displaying non-recurrent functions such as transients; Circuits for triggering; Circuits for synchronisation; Circuits for time-base expansion for displaying non-recurrent functions such as transients
Definitions
- the present invention relates generally to signal testing, and particularly to performance characterization of multi-valued functions, such as digital communication signals.
- Periodic signals are easily evaluated on, for example, an oscilloscope where the oscilloscope triggers a display sweep relative to a voltage level of the signal under test, or relative to a trigger signal in phase with the signal under test. Because the signal is cyclic and each display screen begins at the same point in the signal cycle, the same display pattern, i.e., the same portion of the signal cycle, appears on the oscilloscope for each display sweep. The display pattern thereby presents for analysis a stable image of the signal cycle.
- a digital communication signal is not so easily evaluated on an oscilloscope.
- a digital communication signal is typically a bi-state signal, but is not cyclic. The signal changes state in accordance with the stream of data it carries, and for purposes of analysis might just as well be a random pattern of state transitions.
- Such a signal When applied to an oscilloscope, such a signal will not produce a single-valved wave form, i.e., such as a clock signal which has a single valid voltage for each time ordinate. Therefore, traditional waveform analysis cannot be applied thereto.
- Each display sweep presents a different portion of essentially a random pattern of state transitions.
- the display image, repeating display sweeps of different portions of the signal provides a multi-valued picture of the signal and provides what is called "eye pattern".
- the high and low states of the signal appear as substantially horizontal traces across the oscilloscope screen. State transitions are not completely random. Each transition potentially occurs relative to a conversion clock signal. Thus, if a state transition occurs, it happens at a known time relative to the conversion clock signal.
- the state transitions of the communication signal appear at substantially the same locations on the oscilloscope display.
- the resulting pattern is an open area, the eye, bounded on the top and bottom by the high and low state levels, respectively, and on each side by state transition traces.
- the state transitions on each side of the opening generally cross and form an "X" shape on each side of the eye.
- One component of each "X" shape corresponds to high-to-low transitions and the other component corresponds to low-to-high transitions.
- the distance between the high and low states, the slope of the state transition, overall size of the open area, and other similar measurements aid in characterizing the communication signal producing the eye pattern.
- a manual method of characterizing an eye pattern is known. According to this method, one generates an eye pattern on the oscilloscope screen, marks the screen with a grease pencil to identify certain portions of the eye pattern, and visually measures relative positions of the identified portions. While such information provides a basis for characterizing the signal, it must be gathered manually and, therefore, comes with the expense of human labor and the possibility of human error.
- an object of the present invention to automatically evaluate an eye pattern to avoid the cost of human labor and risk of human error.
- Automatic characterization of a communication signal provides immediate feedback to an operator of test equipment. The effects of signal adjustment, as received or as transmitted, are readily available without an intermediate manual computation.
- signal amplitude is sampled during a sample period to generate a sequence of data value pairs, a first value of each data value pair corresponding to a signal amplitude and a second value of each data value pair corresponding to a time interval of the sampling period.
- the data value pairs correspond to address value pairs for addressing an accumulator data structure.
- the accumulator data structure is first initialized and the signal is sampled for a given number of sample periods. For each data value pair obtained, the corresponding accumulator is incremented. The signal is then characterized by the total held in each accumulator.
- the high and low states of the signal are determined by summing accumulators in rows corresponding to common signal amplitudes through the sample periods. Two groupings or bands of adjacent accumulator rows will show summation peaks and thereby indicate the high and low states for the signal.
- transition states are identified and characterized.
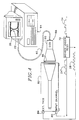
- FIG. 1 illustrates the generation of an eye pattern 20 on an oscilloscope screen 22.
- a digital communication signal 24 is applied to the oscilloscope (not shown in FIG. 1) to produce the eye pattern 20.
- Each display sweep of the oscilloscope begins at a trigger point 26 relative to a clock signal 28.
- a corresponding portion 30 of signal 24 is traced across the oscilloscope display 22.
- the eye pattern 20 may be visualized by overlaying each of the portions 30 of signal 24.
- the eye pattern 20 includes transition states 32 occurring at substantially fixed locations within the oscilloscope display 22. Such transition states may be high-to-low or low-to-high transitions between a high state 34 and a low state 36.
- the eye pattern 20 includes open regions, or eyes 38, bounded on each side by transition states 32 and bounded above and below by high and low states 34 and 36, respectively.
- the communication signal 24 represents a broad range of random or pseudo-random data streams.
- the signal 24 could be trans-oceanic telephone data, as well as communication between components of a digital circuit.
- Communication signal 24 may be an optical signal, in which case references herein to signal amplitude are meant to include reference to similar characteristics, e.g., wattage for optical signals.
- signal 24 carries data and, for purposes of analysis, is substantially random in nature. Because such signals are substantially random in nature, a typical display image obtained is an eye pattern. The subject matter of the present invention concerns automatic analysis and characterization of such eye patterns.
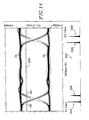
- FIG. 2 illustrates oscilloscope display 22 presenting eye pattern 20.
- the eye pattern 20 includes an eye 38 bounded above by high state 34 of signal 24, and below by low state 36 of signal 24.
- a transition state region 32 preceding eye 38 includes a high-to-low transition path 40 and a low-to-high transition path 42.
- a similar transition state region 32 following the eye 38 includes a high-to-low transition path 44 and a low-to-high transition path 46. It will be appreciated that for any given trigger 26 taken from clock signal 28, a substantially arbitrary portion 30 (FIG. 1) of signal 24 is traced across the oscilloscope display 22.
- the oscilloscope may trace a signal across high state 34, across low state 36, or through one of the transition paths 40, 42, 44, or 46. The nature of the trace depends on the condition of signal 24 in the sample period just following the trigger 26. As multiple triggers 26 are received by the oscilloscope and corresponding portions of signal 24 are traced across the display 22, the resulting eye pattern 20 is obtained.
- first distal point 48 lies along transition path 40 at approximately 80 percent of the potential of state 34 relative to state 36.
- a second distal point 50 lies along transition point 42 at approximately 80 percent of the potential of state 34 relative to state 36.
- a first proximal point 52 lies along transition path 42 at approximately 20 percent of the potential of state 34 relative to state 36.
- a second proximal point 54 lies along transition path 40 at approximately 20 percent of the potential of state 34 relative to state 36.
- a first mesial point 56 lies at 50 percent of the potential of state 34 relative to state 36, and is generally at the intersection, or cross-over point, of transition paths 40 and 42.
- a second mesial point 58 also lies at approximately 50 percent of the potential of state 34 relative to state 36, and at the cross-over point of paths 44 and 46.
- the mesial points 56 and 58 may not lie at the cross-over points of paths 40 and 42 and paths 44 and 46, respectively.
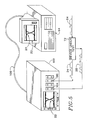
- FIGS. 3-5 illustrate several examples of hardware configurations suitable for use in accordance with the present invention.
- communication signal 24 is received and an eye pattern 20 is generated and analyzed in order to characterize the communication signal.
- the process is accomplished automatically without the risk of human error or labor cost.
- a communication signal analyzer 70 produces an eye pattern 20 on a screen 22 in response to a trigger or conversion clock signal 28 and the communication signal 24. More particularly, the communication signal 24 is applied to a device 72 under test. The function of device 72 is to replicate the signal 24, and this replicated signal 24 is applied to signal analyzer 70 to determine the quality of the replicated signal 24. Device 72 also analyzes the signal 24 and generates a recovered conversion clock signal 28 used to trigger analyzer 70. Alternatively, the signal 24 itself may be used as a trigger source in place of clock signal 28.
- Communication signal analyzer 70 is a programmable device including processor and memory elements for manipulating and storing data relative to signals presented on display 22. More particularly, display 22 includes an array of pixels for image display. For each trace of a portion 30 of signal 24, a corresponding set of such pixels are illuminated.
- the communication signal analyzer 70 monitors each display trace and maintains a database corresponding to the pixel array of display 22. Because the display progresses from left to right in increments one pixel at a time, each trace of signal 24 across display 22 may be represented by an ordered sequence of data hits corresponding to the path of pixels illuminated on each display trace pass. As will be described in greater detail hereafter, communication signal analyzer 70 maintains, in accordance with the present invention, an eye pattern database which accumulates such data hits for a given number of traces of signal 24.
- FIG. 4 illustrates a second hardware configuration example.
- the device 72 under test receives the communication signal 24 and produces the replicated signal 24 and the recovered clock signal 28, as described in connection with FIG. 3.
- the replicated communication signal 24 is applied to an input channel 80 of an analog oscilloscope 82.
- the clock signal 28 is applied to an external trigger input 84 of oscilloscope 82.
- an eye pattern (not shown) is produced on the display screen 86 of oscilloscope 82.
- a digitizing camera system 88 is positioned in front of the oscilloscope screen 86 for capturing the image of the eye pattern. More particularly, a CCD camera 90 is positioned to capture the image of screen 86 as a grey scaled image. The grey scaled image is then transferred by way of video cable 92 to a controller card (not shown) of a computer 94. As will be described in greater detail hereafter, the grey scaled image, as taken from the CCD camera 90, is used to build a database representing the eye pattern 22, which may be displayed on the display 20 of computer 94.
- FIG. 5 illustrates a third hardware configuration.
- the device 72 again produces the recovered clock signal 28 and the replicated communication signal 24, as previously described.
- the replicated communication signal 24 is applied to an input 100 of a digitizer 102 while the clock signal 28 is applied to a trigger input 104 thereof.
- the digitizer 102 may be connected, e.g., by RS-232 communication link 106, to a controller card (not shown) of computer 94, whereby a digitized form of the eye pattern 22 may be provided on display 20 of computer 94.
- FIG. 6 illustrates a database suitable for storing the digitized eye pattern 20.
- the database includes a two-dimensional accumulator array 120 having individual accumulator cells 122 corresponding to each data point or pixel of a display 22.
- the rows in array 120 correspond to different amplitudes, or gains, of the signal 24 while the columns correspond to time during individual sample periods.
- a gain address value in combination with a time address value specify one of the accumulator cells 122 in array 120.
- Each accumulator cell 122 of array 120 thereby corresponds to a pixel of display 22.
- the accumulator cells 122 corresponding to pixel elements illuminated during that trace are incremented to account for the trace.
- a database representing the eye pattern is obtained.
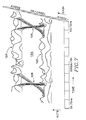
- FIG. 7 illustrates a three-dimensional view of the array 120 in a state representing an eye pattern 20.
- the substantially horizontal dimensions of TIME and GAIN correspond to the time and gain address fields of array 120, while the substantially vertical dimension HITS represents the value held in each accumulator cell 122.
- an eye pattern may be displayed.
- the high and low states 34 and 36, respectively are represented as ridges 124 and 125, respectively, extending from left to right.
- Transition paths 40-46 are similarly represented as crossing ridges 128 which interconnect the ridges 124 and 125 in a manner similar to that shown for paths 40-46, interconnecting states 34 and 36 in FIG. 2.
- a valley region 130 bounded above and below by the ridges 124 and 125, respectively, and on the left and right sides by crossing ridges 128 corresponds to the eye 38 (FIG. 1).
- FIG. 8 is a flow chart illustrating a method, in accordance with the present invention, for characterizing communication signal 24.
- processing begins in housekeeping block 200 where, as further illustrated in FIG. 9, system parameters are established.
- time related parameters such as time base and time position, respectively, are provided.
- Similar gain related parameters i.e., vertical gain and vertical position, are specified in blocks 206 and 208, respectively. These time and gain parameters establish the necessary settings for the display device to properly present an eye pattern.
- sufficient memory is allocated as a database for storing an eye pattern representation.
- processing then continues to data acquisition block 216 where a communication signal is applied to a device, e.g., one of the hardware configurations shown in FIGS. 3-5, for collecting display data relative to each display trace of signal 24.
- a device e.g., one of the hardware configurations shown in FIGS. 3-5
- the database reflects the nature of the eye pattern associated with signal 24.
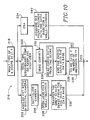
- FIG. 10 illustrates data acquisition from each of the hardware configurations shown in FIGS. 3-5. However, it will be understood that the present invention may be practiced on many hardware configurations and those illustrated and described herein are for the purpose of illustration.
- processing begins in block 218, where the type of data acquisition device is determined. Processing branches to one of blocks 220, 222 or 224, depending on whether the configuration of FIG. 4, 5 or 3, respectively, is being used.
- the grey scaled eye pattern image available from CCD camera 90 is transferred to the accumulator array 120 (FIG. 6) in block 230.
- a corresponding accumulator cell 122 is reserved for each grey scaled pixel taken from CCD camera 90.
- the grey scale intensity value for each CCD pixel is converted to a number of hits value as follows.
- the intensity of each portion of screen 86 is proportional to the number of signal traces passing through it, and this information is reflected in the grey scaling of the corresponding portion of the eye pattern image taken from camera 90.
- the corresponding accumulator cells 122 hold a relatively high number of hits value.
- the corresponding accumulator cells 122 hold a relatively low number of hits value.
- the number of hits value corresponds to the number of signal 24 display traces passing through the associated portion of display 86.
- processing branches from block 218 of FIG. 10 to block 222 to acquire eye pattern data from a real time, equivalent time or sampling digitizer, as represented by the device 102.
- a sequence of numbers corresponding to signal 24 amplitudes at discrete points during the corresponding sample period are obtained.
- the position of each amplitude value in the sequence corresponds to the time or horizontal base of device 102.
- the amplitude value sequence referred to as a curve in FIG. 10, represents one trace across the display 22 of device 102.
- processing continues from block 222 to block 232, where computer 94 waits for device 102 to provide a curve, i.e., a sequence of amplitude values.
- the curve data is taken from device 102 and then applied, in block 236, to the eye pattern database.
- the position of each amplitude value in the sequence corresponds to the time address field of array 120, while the numeric value of each amplitude value corresponds to the gain address field.
- a corresponding accumulator cell 122 may be addressed.
- each corresponding addressed accumulator cell 122 is incremented by one.
- the array 120 acquires data from many display traces and thereby collects within the eye pattern database a representation of the eye pattern associated with signal 24.
- the number of curves incorporated into array 120 is tested against a given total desired number of traces, i.e., a number sufficient to adequately represent an eye pattern. If a sufficient number of curves have not yet been received, processing then returns to block 232 where computer 94 waits for device 102 to deliver the next curve for incorporation into the eye pattern database. When sufficient number of curves have been incorporated into the eye pattern database, processing branches from block 238 and continues to block 250 of FIG. 8.
- processing branches from block 218 to block 224 to acquire eye pattern data from the communication signal analyzer 70.
- the communication signal analyzer 70 includes means for digitizing the signal 24 in response to each trigger 26, as provided by clock signal 28.
- communication signal analyzer 70 provides a sequence of data points corresponding to the portion 30 (FIG. 1) of signal 24 displayed following the trigger 26. More particularly, the sequence of data points correspond to pixels of display 22 illuminated during the display trace. The points are ordered according to the time axis and, therefore, are similar to the curve data described in connection with the device of FIG. 5. Thus, for each display trace provided by analyzer 70, an ordered sequence of amplitude values are obtained.
- This sequence of amplitude values address the accumulator array 120 by using the position of the amplitude value as the time address field and the magnitude of the amplitude value as the gain address field.
- the cells 122 addressed by a given amplitude value sequence are each incremented. Processing such amplitude value sequences continues in block 240 for a given time until a sufficient number of such amplitude value sequences have been applied to the accumulator array 120.
- each cell 122 of array 120 contains a number of hits value corresponding to the number of display traces passing through a given portion of display 22.
- an eye pattern database develops which may be used to characterize the eye pattern of signal 24.
- the eye pattern database therefore, contains a statistical image of the eye pattern appearing on display 22 with regions of high hit values corresponding to the ridges 124, 125 and 128 (FIG. 7), and low or zero hit values corresponding to, for example, the valley 130 (FIG. 7).
- processing continues to block 250 where the amplitude values for high and low states 34 and 36, respectively, are determined.
- the amplitude values of the states 34 and 36 can float within a range of discrepancy due to transmission related effects. But, to distinguish between the states 34 and 36, i.e., to obtain the information carried by signal 24, it is necessary to know the values of states 34 and 36. In accordance with the present invention, such determination of the values for states 34 and 36 may be automated by use of the eye pattern database held in array 120.
- selected portions of the accumulator array 120 are summed to obtain values for states 34 and 36. More particularly, the values in each row of accumulator cells 122, i.e., for a set of cells 122 having the same gain address value, are summed. Histograms based on such summation values are then constructed to derive the amplitude values for states 34 and 36. As shown in FIG. 11, such a histogram 260 is obtained relative to the eye pattern 22. Two substantially bell-shaped structures 262 and 264 of histogram 260 are apparent and indicate the values of states 34 and 36. An area 266 between bell-shaped structures 262 and 264 having relatively smaller values indicates a region of signal 24 amplitudes having relatively fewer data hits.
- the area 268 above bell-shaped structure 260 and the area 270 below bell-shaped structure 262, having virtually all zero hit values, indicate regions of signal 24 amplitude not traversed by signal 24, i.e., amplitude regions where the display trace does not pass.
- inspecting the histogram 260 to locate the bell-shaped structures 262 and 264 may be accomplished by many methods.
- the histogram 260 may be stored in a one-dimensional array of values with each value corresponding to a given gain address, i.e., to a given absolute amplitude of signal 24. By passing through such a one-dimensional array and monitoring peak values and peak value positions, the center points of bell-shaped structures 262 and 264 may be obtained. Once the bell-shaped strutures 260 and 262 are located, the values for states 34 and 36 may be set.
- the top and base lines, i.e., the values for states 34 and 36 are thereby obtained in block 250.
- the proximal, mesial and distal gain values of the signal 24 are determined by reference to the values for states 34 and 36. More particularly, given the values for states 34 and 36, the amplitude of state 34 relative to state 36 is known. The gain values at 20 percent, 50 percent, and 80 percent of the amplitude of state 34 relative to state 36, therefore, may be obtained. It will be understood, however, that any given percentage may be used. Processing then continues to block 282 where timing histograms are constructed for determining the time axis or horizontal position of the proximal, mesial and distal points of eye pattern 20.
- FIG. 12 illustrates the block 282 (FIG. 8) method of obtaining the first and second proximal points 52 and 54 (FIG. 2), respectively.
- an accumulator band 284 is established relative to states 34 and 36.
- the accumulator band 284 is a group of adjacent accumulator cell 122 rows corresponding to range of signal 24 values. Band 284 may, therefore, correspond to any desired range of gain values.
- the band 284 can be as few as one row of cells or up to seven or more rows, as needed.
- Band 284 is centered relative the gain value calculated in block 280 as a percentage of the amplitude of state 34 relative to that of state 36. As shown in FIG. 12, band 284 is centered at a gain corresponding to 20 percent of the amplitude of state 34 relative to state 36.
- a histogram 286 is then obtained by summing selected ones of the accumulator cells 122 of band 284. More particularly, for each vertical column of cells 122 in band 284, those having common time address fields, the number of hits values are summed. As shown in FIG. 12, four substantially bell-shaped structures 288, 290, 292 and 294 are found in histogram 286. Again, it will be understood that many methods for inspecting histogram 286 for the position and shape of structures 288, 290, 292 and 294 should be apparent.
- the first bell-shaped structure 288 corresponds to the position of the first proximal point 52 (FIG. 2).
- the center line of structure 288 provides the time position of point 52 relative to, e.g., the clock 28.
- the amplitude position of point 52 is known from block 280.
- the time position and gain position fully specify the position of point 52.
- the second proximal point 54 is obtained in a similar manner by reference to bell-shaped structure 290.
- the bell-shaped structures 292 and 294 correspond to similar proximal points on the other side of the eye 38, but which may not be essential to characterization of signal 24.
- FIG. 13 illustrates the block 282 (FIG. 8) method of obtaining the first and second mesial points 56 and 58, respectively.
- a band 300 of a selected gain or amplitude range, is positioned between states 34 and 36 as calculated in block 280. Band 300 is centered around 50 percent of the amplitude of state 34 relative to state 36.
- a histogram 302 is generated by summing accumulator cells of band 30 having common time address values, i.e., vertical columns within band 300. Histogram 302 yields a first bell-shaped structure 304 corresponding to the first mesial point 56, and a second bell-shaped structure 306 corresponding to the second mesial point 58.
- cross-over points of transition paths 40 and 42 and of paths 44 and 46 are substantially at 50 percent of the amplitude of state 34 relative to state 36, as illustrated in FIG. 13, band 300 passes through such cross-over points and only two bell-shaped structures emerge. However, if additional bell-shaped structures are found in histogram 302, it is known that such cross-over points are not at 50 percent of the amplitude of state 34 relative to state 36. In the event that histogram 302 includes more than two bell-shaped structures, the cross-over points for paths 40 and 42 and of paths 44 and 46 may be determined, as described more fully hereafter, by further summing of selected portions of array 120.
- FIG. 14 illustrates the block 282 (FIG. 8) method of obtaining the first and second distal points 48 and 50, respectively.
- An accumulator band 320 similar to bands 300 and 284 previously described, is centered, in accordance with the calculations of block 280, at a gain corresponding to 80 percent of the amplitude of state 34 relative to state 36.
- a histogram 322 is then obtained by summing selected ones of the accumulator cells 122 of band 320. More particularly, for each vertical column of cells 122 in band 320, those having common time address fields, the number of hits values are summed.
- Four substantially bell-shaped structures 324, 326, 328, 330 emerge.
- bell-shaped structure 324 corresponds to the first distal point 48 and bell-shaped structure 326 corresponds to the second distal point 50.
- each such bell-shaped structure can be stored as a vector of numbers, each such stored number corresponding to a summation of selected cell 122 values. Processing then continues to block 343 where each bell-shaped structure is further analyzed to extract the width, mean and standard deviation thereof. Given the width, mean and standard deviation of each bell-shaped structure, processing advances to block 344 where, timing measurements for each bell-shaped structure are computed.
- Determining the values for states 34 and 36, the positions of the proximal, mesial and distal points, and further timing measurements relative to the eye pattern 20 comprise the basic analysis performed by the algorithm of FIG. 8. Additional measurements may be optionally accomplished as determined at branch block 346. If such additional measurements are not desired, processing branches at block 346 to block 348 where the measurement results and calculations of signal characteristics relative to eye pattern 20 are displayed. If additional processing, e.g., analysis of a second eye pattern, is not desired, processing branches at block 350 to exit block 352. Otherwise, the eye pattern database may be optionally cleared in block 354. If the database is to be cleared, processing proceeds through block 356 to data acquisition block 216, otherwise, processing branches directly from block 354 to data acquisition block 216. Upon reaching data acquisition block 216, additional eye pattern data is applied to array 120 and processing continues as previously described.
- block 358 several additional measurements are performed. First, processing in block 358 analyzes the overshoot, undershoot and settling characteristics of signal 24. Additionally, the cross-over points between transition paths 40 and 42 and between 44 and 46 are identified.
- FIG. 15 illustrates the block 358 method of characterizing signal 24 overshoot and undershoot.
- overshoot occurs when a signal 24 trace following transition path 42 goes above state 34 in an overshoot region 400.
- undershoot region 402 where a signal 24 trace following transition path 40 goes below state 36.
- the signal 24 exhibits a sinusoidal ringing behavior, the first portion of which is termed overshoot and undershoot.
- a vertical band 406 of cells 122 encompasses the full range of gain address values for array 120, but a selected range of time address values corresponding to the overshoot and undershoot regions 400 and 402, respectively.
- Band 406 may be positioned relative to, for example, proximal and distal points 40 and 50, respectively.
- the overshoot and undershoot characteristics of eye pattern 20 are determined. More particularly, by summing each row, i.e., cells 122 having common gain address values, a histogram 408 is obtained.
- the histogram 408 will include two bell-shaped structures 410 and 412.
- the bell-shaped structure 410 corresponds to the overshoot of transition path 50 and the bell-shaped structure 412 corresponds to the undershoot of transition path 40.
- the overshoot and undershoot characteristics of signal 24 are determined.
- FIG. 16 illustrates a similar block 358 method of characterizing the settling or ringing portion of signal 24.
- a vertical band 420 similar to band 408 but positioned in a ringing region 422 just following the overshoot and undershoot regions 400 and 402.
- Histogram 424 is constructed by summing rows of accumulators 122 within band 420, i.e, accumulators having common gain address fields.
- Histogram 424 includes two bell-shaped structures 426 and 428 which correspond to ringing at states 34 and 36, respectively, of signal 24 in the region 422. The width of bell-shaped structures 426 and 428 generally characterize such ringing.
- FIG. 17 illustrates the block 358 method of determining the cross-over point 430 for transition paths 40 and 42.
- a horizontal band 432 encompasses the full range of gain address values for array 120, but does not extend as high or as low as the state levels 34 and 36, respectively. Thus, band 432 may be centered between states 34 and 36 of signal 24.
- a vertical band 434 is first centered over mesial point 56, which may or may not coincide with the cross-over point 430 for paths 40 and 42. By summing selected ones of the cells 122 within both band 432 and band 434, the position of cross-over point 430 is determined. More particularly, rows of cells within bands 432 and 434, i.e., having common gain address values, are summed to build histogram 436.
- Histogram 436 includes a single bell-shaped structure 438 when band 434 passes substantially through cross-over point 430. However, it may be appreciated that as band 434 is positioned, the true cross-over point can be determined. Thus, it may be assumed to be at 50 percent, but may migrate 10 to 40 percent from the expected gain value.
- FIG. 18 illustrates an eye pattern 500 obtained from a communication signal known as a digital radio signal, a communication signal carried on a multi-valued function.
- a communication signal known as a digital radio signal
- multiple horizontal state levels 502, 504, 506 and 508 are provided and substantially vertical signal transition paths 510 exist, relative to a trigger, between such state levels.
- the eye pattern 500 includes an array of eyes 512, as bounded by state levels 502-508, and transition paths 510.
- the method of characterizing a signal as shown herein is applicable to analysis of the eye pattern 500.
- the histogram 520 is obtained by first applying the eye pattern 500 to the array 120 as described above and summing rows of accumulator cells 122.
- the method provides, by use of a programmable display device, automatic characterization of a communication signal without risk of human error or cost of human labor.
- the method may be applied to automatically characterize a signal through a broad range of variations without human supervision.
- the method of characterizing a signal shown herein has been described in connection with the signal 24 which is a nonreturn-to-zero signal. However, the method is equally applicable to other similar signals, such as return-to-zero and inverted return-to-zero.
- Such signals may be applied to the eye pattern database, as shown herein, by incrementing accumulator cells corresponding to display traces and summing selected portions of the array 120 in order to identify certain signal characteristics, e.g., absolute high and low state amplitudes, proximal, distal and mesial points.
Landscapes
- Physics & Mathematics (AREA)
- General Physics & Mathematics (AREA)
- Dc Digital Transmission (AREA)
Applications Claiming Priority (2)
| Application Number | Priority Date | Filing Date | Title |
|---|---|---|---|
| US49823190A | 1990-03-23 | 1990-03-23 | |
| US498231 | 1990-03-23 |
Publications (2)
| Publication Number | Publication Date |
|---|---|
| EP0448322A2 true EP0448322A2 (de) | 1991-09-25 |
| EP0448322A3 EP0448322A3 (en) | 1992-11-25 |
Family
ID=23980149
Family Applications (1)
| Application Number | Title | Priority Date | Filing Date |
|---|---|---|---|
| EP19910302303 Withdrawn EP0448322A3 (en) | 1990-03-23 | 1991-03-18 | Automatic extraction of pulseparametrics from multi-valued functions |
Country Status (3)
| Country | Link |
|---|---|
| US (1) | US5343405A (de) |
| EP (1) | EP0448322A3 (de) |
| JP (1) | JPH04280142A (de) |
Cited By (6)
| Publication number | Priority date | Publication date | Assignee | Title |
|---|---|---|---|---|
| EP0677746A3 (de) * | 1994-04-13 | 1996-10-23 | Tektronix Inc | Architektur für Digitaloszilloskop zur Signalüberwachung mit verbessertem Arbeitszyklus. |
| EP0869368A3 (de) * | 1997-04-04 | 2000-12-20 | Tektronix, Inc. | Verfahren und Vorrichtung zum digitalen Abtasten eines elektrischen Wellenzuges |
| WO2003054487A1 (de) * | 2001-12-11 | 2003-07-03 | Sz Testsysteme Ag | Verfahren und vorrichtung zum testen eines prüflings |
| EP2097757A2 (de) * | 2006-11-28 | 2009-09-09 | Rohde & Schwarz GmbH & Co. KG | Verfahren und vorrichtung zur triggerung einer aufzeichnung eines mess-signals |
| US11387922B2 (en) | 2020-02-25 | 2022-07-12 | Rohde & Schwarz Gmbh & Co. Kg | Receiver with a power detecting function for a pulsed signal and receiving method |
| CN115407104A (zh) * | 2022-07-22 | 2022-11-29 | 中电科思仪科技股份有限公司 | 一种用于高分辨率示波器的眼图生成系统及方法 |
Families Citing this family (30)
| Publication number | Priority date | Publication date | Assignee | Title |
|---|---|---|---|---|
| US5495168A (en) * | 1994-09-12 | 1996-02-27 | Fluke Corporation | Method of signal analysis employing histograms to establish stable, scaled displays in oscilloscopes |
| US6263290B1 (en) | 1995-02-22 | 2001-07-17 | Michael K. Williams | Process and machine for signal waveform analysis |
| US6728311B1 (en) * | 2000-04-04 | 2004-04-27 | Thomas Eugene Waschura | Apparatus and method for creating eye diagram |
| US6614434B1 (en) * | 2000-06-14 | 2003-09-02 | Tektronix, Inc. | Algorithm for finding the eye crossing level of a multilevel signal |
| US6920407B2 (en) * | 2000-09-18 | 2005-07-19 | Agilent Technologies, Inc. | Method and apparatus for calibrating a multiport test system for measurement of a DUT |
| WO2002023212A1 (en) * | 2000-09-18 | 2002-03-21 | Agilent Technologies, Inc. | Method and apparatus for linear characterization of multiterminal single-ended or balanced devices |
| JP2002162419A (ja) * | 2000-10-11 | 2002-06-07 | Agilent Technol Inc | 信号測定システムで捕捉された信号の各パルス毎に、パルス特性のデータベースを生成するためのシステム及び方法 |
| US6816242B2 (en) * | 2001-04-10 | 2004-11-09 | National Instruments Corporation | System and method for performing time domain reflectometry using Gaussian pulses |
| US6697766B2 (en) * | 2001-04-10 | 2004-02-24 | National Instruments Corporation | System and method for detecting and characterizing gaussian pulses |
| JP3990123B2 (ja) * | 2001-07-17 | 2007-10-10 | 日本電気株式会社 | サンプラーおよび計測方法 |
| AU2002329836A1 (en) * | 2001-08-22 | 2003-06-10 | Wavecrest Corporation | Method and apparatus for measuring a waveform |
| US6810346B2 (en) * | 2002-01-31 | 2004-10-26 | Agilent Technologies, Inc. | Composite eye diagrams |
| US6668235B2 (en) * | 2002-03-28 | 2003-12-23 | Agilent Technologies, Inc. | Identification of channels and associated signal information contributing to a portion of a composite eye diagram |
| US6768703B2 (en) * | 2002-04-25 | 2004-07-27 | Agilent Technologies, Inc. | Eye diagram analyzer with fixed data channel delays and swept clock channel delay |
| US6760676B2 (en) * | 2002-07-31 | 2004-07-06 | Agilent Technologies, Inc. | On-screen tools for eye diagram measurements |
| EP1345136B1 (de) * | 2003-01-15 | 2007-12-19 | Verigy (Singapore) Pte. Ltd. | Modellierung einer elektronischen Vorrichtung |
| US6804633B2 (en) * | 2003-01-31 | 2004-10-12 | Agilent Technologies, Inc. | Fast eye diagram analyzer uses nearest neighbor transverse to quickly discover basic eye diagrams |
| US7216046B2 (en) * | 2003-03-19 | 2007-05-08 | Tektronix, Inc. | Method of generating a variable persistence waveform database |
| US7301325B2 (en) * | 2004-02-02 | 2007-11-27 | Synthesys Research, Inc. | Method and apparatus for creating performance limits from parametric measurements |
| JP4510491B2 (ja) * | 2004-03-26 | 2010-07-21 | リーダー電子株式会社 | ラッチおよびこれを使用した位相同期化回路 |
| US7098839B2 (en) * | 2004-06-03 | 2006-08-29 | Tektronix, Inc. | Flash array digitizer |
| EP1643258B1 (de) * | 2004-09-24 | 2009-12-16 | Tektronic, Inc. | Signalmustererkennung und Bitniveaumessungen an sich wiederholenden Signalmustern |
| US7411999B2 (en) * | 2005-02-24 | 2008-08-12 | Agilent Technologies, Inc. | Method for selecting and extracting an eye diagram opening for subsequent processing |
| JP4761051B2 (ja) * | 2006-02-16 | 2011-08-31 | 横河電機株式会社 | アイパターン測定方法およびその装置 |
| JP4955303B2 (ja) * | 2006-03-23 | 2012-06-20 | テクトロニクス・インコーポレイテッド | デジタル信号分析プログラム及び波形表示装置 |
| US7640463B2 (en) * | 2006-06-30 | 2009-12-29 | Lsi Corporation | On-chip receiver eye finder circuit for high-speed serial link |
| US7698669B1 (en) | 2007-05-11 | 2010-04-13 | Altera Corporation | Method and system to evaluate operational characteristics of an electronic circuit |
| US8024140B2 (en) * | 2007-08-23 | 2011-09-20 | Amherst Systems Associates, Inc. | Waveform anomoly detection and notification systems and methods |
| US20190207830A1 (en) * | 2018-01-02 | 2019-07-04 | Tektronix, Inc. | Network Oscilloscope Using Packet Timestamps |
| US20220334180A1 (en) | 2021-04-20 | 2022-10-20 | Tektronix, Inc. | Real-equivalent-time flash array digitizer oscilloscope architecture |
Family Cites Families (16)
| Publication number | Priority date | Publication date | Assignee | Title |
|---|---|---|---|---|
| GB2078979B (en) * | 1980-06-23 | 1984-08-15 | Solartron Electronic Group | Methods and apparatus for assessing the quality of logic signals |
| US4495585A (en) * | 1981-07-08 | 1985-01-22 | Buckley William H | Method of and apparatus for indicating characteristics of undulating data |
| DE3207556C2 (de) * | 1982-03-03 | 1983-12-22 | Vierling, Oskar, Prof. Dr.Phil.Habil., 8553 Ebermannstadt | Anordnung zum Messen der charakteristischen Zeiten von Impulsen und Impulsserien |
| US4758963A (en) * | 1982-09-14 | 1988-07-19 | Analogic Corporation | Modular computing oscilloscope with high speed signal memory |
| US4876655A (en) * | 1985-12-02 | 1989-10-24 | Tektronix, Inc. | Method and apparatus for evaluating jitter |
| EP0225704A3 (de) * | 1985-12-02 | 1988-08-03 | Tektronix, Inc. | Methode und Einrichtung zur Analyse der Wellenform |
| US4774682A (en) * | 1986-03-27 | 1988-09-27 | Rockwell International Corporation | Nonlinear statistical signal processor |
| US4827259A (en) * | 1986-11-04 | 1989-05-02 | Electric Power Research Institute | Circuit for high-frequency sampling and compression of data for high-frequency electrical transient signals superimposed in a low frequency steady-state signal |
| JPS63259476A (ja) * | 1987-04-16 | 1988-10-26 | Yokogawa Electric Corp | ジツタ測定回路 |
| US4843562A (en) * | 1987-06-24 | 1989-06-27 | Broadcast Data Systems Limited Partnership | Broadcast information classification system and method |
| US4779044A (en) * | 1987-09-08 | 1988-10-18 | Zion Educational Foundation | Voltage, current and frequency measuring of non-standard waveforms |
| DE3744398A1 (de) * | 1987-12-29 | 1989-07-13 | Asea Brown Boveri | Verfahren und vorrichtung zur registrierung von signalkurven |
| GB2214764B (en) * | 1988-01-29 | 1992-01-08 | Tektronix Inc | Pixel intensity modulation in a waveform display |
| EP0362410A4 (en) * | 1988-03-31 | 1991-10-02 | Anritsu Corporation | Transition condition detector and measuring instrument utilizing the same |
| US4940931A (en) * | 1988-06-24 | 1990-07-10 | Anritsu Corporation | Digital waveform measuring apparatus having a shading-tone display function |
| US4985844A (en) * | 1989-05-08 | 1991-01-15 | Tektronix, Inc. | Statistical waveform profiler employing counter/timer |
-
1991
- 1991-03-18 EP EP19910302303 patent/EP0448322A3/en not_active Withdrawn
- 1991-03-22 JP JP3083638A patent/JPH04280142A/ja active Pending
- 1991-11-01 US US07/784,085 patent/US5343405A/en not_active Expired - Lifetime
Cited By (8)
| Publication number | Priority date | Publication date | Assignee | Title |
|---|---|---|---|---|
| EP0677746A3 (de) * | 1994-04-13 | 1996-10-23 | Tektronix Inc | Architektur für Digitaloszilloskop zur Signalüberwachung mit verbessertem Arbeitszyklus. |
| EP1074845A3 (de) * | 1994-04-13 | 2001-02-14 | Tektronix, Inc. | Architektur für Digitaloszilloskop zur Signalüberwachung mit verbessertem Arbeitszyklus |
| EP0869368A3 (de) * | 1997-04-04 | 2000-12-20 | Tektronix, Inc. | Verfahren und Vorrichtung zum digitalen Abtasten eines elektrischen Wellenzuges |
| EP1666892A3 (de) * | 1997-04-04 | 2006-09-06 | Tektronix, Inc. | Verfahren und Vorrichtung zum digitalen Abtasten eines elektrischen Wellenzuges |
| WO2003054487A1 (de) * | 2001-12-11 | 2003-07-03 | Sz Testsysteme Ag | Verfahren und vorrichtung zum testen eines prüflings |
| EP2097757A2 (de) * | 2006-11-28 | 2009-09-09 | Rohde & Schwarz GmbH & Co. KG | Verfahren und vorrichtung zur triggerung einer aufzeichnung eines mess-signals |
| US11387922B2 (en) | 2020-02-25 | 2022-07-12 | Rohde & Schwarz Gmbh & Co. Kg | Receiver with a power detecting function for a pulsed signal and receiving method |
| CN115407104A (zh) * | 2022-07-22 | 2022-11-29 | 中电科思仪科技股份有限公司 | 一种用于高分辨率示波器的眼图生成系统及方法 |
Also Published As
| Publication number | Publication date |
|---|---|
| US5343405A (en) | 1994-08-30 |
| EP0448322A3 (en) | 1992-11-25 |
| JPH04280142A (ja) | 1992-10-06 |
Similar Documents
| Publication | Publication Date | Title |
|---|---|---|
| US5343405A (en) | Automatic extraction of pulse-parametrics from multi-valued functions | |
| EP0822416B1 (de) | Verfahren und Vorrichtung zur Verbesserung zeitabhängiger Bildeinzelheiten auf einer Rasteranzeige | |
| DE69024368T2 (de) | Bildübertragung mittels eines optischen faserkabels | |
| DE69202494T2 (de) | Prüfung von Video-Kodierern/Dekodierern mit dreidimensionalem Prüfsignal. | |
| EP0556030B1 (de) | Räumliche Bandbreitenprüfung für ein digitales, datenkomprimiertes Videosystem | |
| US20030067595A1 (en) | Automatic measurement of the modulation transfer function of an optical system | |
| DE10049405A1 (de) | Verfahren und System zur Diagnose von Fehlern bei bildgebenden Abtasteinrichtungen | |
| Emerson et al. | Identification of complex-cell intensive nonlinearities in a cascade model of cat visual cortex | |
| DE2728717A1 (de) | Verfahren und vorrichtung zur beruehrungsfreien bestimmung von qualitaetsmerkmalen eines pruefobjektes der fleischwaren-kategorie, insbesondere eines schlachttierkoerpers, teilen davon oder eines im wesentlichen daraus bestehenden produktes | |
| US6268738B1 (en) | Method and apparatus for high-speed scanning of electromagnetic emission levels | |
| CN114354394A (zh) | 一种冲击性能的测试方法、设备及介质 | |
| US5731984A (en) | Vector-based waveform acquisition and display | |
| US5739807A (en) | Method for presenting complex number waveforms | |
| JPS63266484A (ja) | 表示特性確認方法 | |
| DE3117073A1 (de) | Einrichtung zum erkennen des lidschlags waehrend der untersuchung eines auges | |
| JPH02165795A (ja) | ビデオカメラの伝達関数決定法 | |
| CH683650A5 (de) | Prozessor für Uebermittlungs-Dateien. | |
| CA2256197C (en) | Method and apparatus for introducing reference impairments into video signals | |
| DE102004008215A1 (de) | Vorrichtung und Verfahren zur Taktwiedergewinnung und Augendiagrammerzeugung | |
| Wrigley et al. | Thematic mapper image quality: Registration, noise, and resolution | |
| DE69430346T2 (de) | Vorrichtung zur bildsondierung mit ultraschallwellen | |
| Wittels et al. | How to select cameras for machine vision | |
| US4172263A (en) | Methods and apparatus for measuring signal-to-noise ratio | |
| WO2002008691A1 (de) | Verfahren und vorrichtung zur ermittlung von ein seegangsfeld in einem wellentank beschreibenden hydrographischen parametern | |
| EP0527321A1 (de) | Verfahren zur automatischen Fehlerdiagnose von elektrischen Baugruppen |
Legal Events
| Date | Code | Title | Description |
|---|---|---|---|
| PUAI | Public reference made under article 153(3) epc to a published international application that has entered the european phase |
Free format text: ORIGINAL CODE: 0009012 |
|
| AK | Designated contracting states |
Kind code of ref document: A2 Designated state(s): DE GB NL |
|
| PUAL | Search report despatched |
Free format text: ORIGINAL CODE: 0009013 |
|
| AK | Designated contracting states |
Kind code of ref document: A3 Designated state(s): DE GB NL |
|
| 17P | Request for examination filed |
Effective date: 19930504 |
|
| 17Q | First examination report despatched |
Effective date: 19941228 |
|
| STAA | Information on the status of an ep patent application or granted ep patent |
Free format text: STATUS: THE APPLICATION IS DEEMED TO BE WITHDRAWN |
|
| 18D | Application deemed to be withdrawn |
Effective date: 19950710 |