EP0422945B1 - Bearbeitung von Ablaufdaten paralleler Verarbeitung - Google Patents
Bearbeitung von Ablaufdaten paralleler Verarbeitung Download PDFInfo
- Publication number
- EP0422945B1 EP0422945B1 EP90311178A EP90311178A EP0422945B1 EP 0422945 B1 EP0422945 B1 EP 0422945B1 EP 90311178 A EP90311178 A EP 90311178A EP 90311178 A EP90311178 A EP 90311178A EP 0422945 B1 EP0422945 B1 EP 0422945B1
- Authority
- EP
- European Patent Office
- Prior art keywords
- parallel
- activity
- data
- trace data
- thread
- Prior art date
- Legal status (The legal status is an assumption and is not a legal conclusion. Google has not performed a legal analysis and makes no representation as to the accuracy of the status listed.)
- Expired - Lifetime
Links
Images




Classifications
-
- G—PHYSICS
- G06—COMPUTING OR CALCULATING; COUNTING
- G06F—ELECTRIC DIGITAL DATA PROCESSING
- G06F11/00—Error detection; Error correction; Monitoring
- G06F11/36—Prevention of errors by analysis, debugging or testing of software
- G06F11/3698—Environments for analysis, debugging or testing of software
-
- G—PHYSICS
- G06—COMPUTING OR CALCULATING; COUNTING
- G06F—ELECTRIC DIGITAL DATA PROCESSING
- G06F11/00—Error detection; Error correction; Monitoring
- G06F11/30—Monitoring
- G06F11/32—Monitoring with visual or acoustical indication of the functioning of the machine
- G06F11/323—Visualisation of programs or trace data
-
- G—PHYSICS
- G06—COMPUTING OR CALCULATING; COUNTING
- G06F—ELECTRIC DIGITAL DATA PROCESSING
- G06F11/00—Error detection; Error correction; Monitoring
- G06F11/30—Monitoring
- G06F11/34—Recording or statistical evaluation of computer activity, e.g. of down time, of input/output operation ; Recording or statistical evaluation of user activity, e.g. usability assessment
- G06F11/3404—Recording or statistical evaluation of computer activity, e.g. of down time, of input/output operation ; Recording or statistical evaluation of user activity, e.g. usability assessment for parallel or distributed programming
-
- G—PHYSICS
- G06—COMPUTING OR CALCULATING; COUNTING
- G06F—ELECTRIC DIGITAL DATA PROCESSING
- G06F11/00—Error detection; Error correction; Monitoring
- G06F11/36—Prevention of errors by analysis, debugging or testing of software
- G06F11/362—Debugging of software
- G06F11/3636—Debugging of software by tracing the execution of the program
-
- G—PHYSICS
- G06—COMPUTING OR CALCULATING; COUNTING
- G06F—ELECTRIC DIGITAL DATA PROCESSING
- G06F11/00—Error detection; Error correction; Monitoring
- G06F11/30—Monitoring
- G06F11/34—Recording or statistical evaluation of computer activity, e.g. of down time, of input/output operation ; Recording or statistical evaluation of user activity, e.g. usability assessment
- G06F11/3409—Recording or statistical evaluation of computer activity, e.g. of down time, of input/output operation ; Recording or statistical evaluation of user activity, e.g. usability assessment for performance assessment
- G06F11/3419—Recording or statistical evaluation of computer activity, e.g. of down time, of input/output operation ; Recording or statistical evaluation of user activity, e.g. usability assessment for performance assessment by assessing time
-
- G—PHYSICS
- G06—COMPUTING OR CALCULATING; COUNTING
- G06F—ELECTRIC DIGITAL DATA PROCESSING
- G06F11/00—Error detection; Error correction; Monitoring
- G06F11/30—Monitoring
- G06F11/34—Recording or statistical evaluation of computer activity, e.g. of down time, of input/output operation ; Recording or statistical evaluation of user activity, e.g. usability assessment
- G06F11/3466—Performance evaluation by tracing or monitoring
-
- G—PHYSICS
- G06—COMPUTING OR CALCULATING; COUNTING
- G06F—ELECTRIC DIGITAL DATA PROCESSING
- G06F11/00—Error detection; Error correction; Monitoring
- G06F11/36—Prevention of errors by analysis, debugging or testing of software
-
- G—PHYSICS
- G06—COMPUTING OR CALCULATING; COUNTING
- G06F—ELECTRIC DIGITAL DATA PROCESSING
- G06F2201/00—Indexing scheme relating to error detection, to error correction, and to monitoring
- G06F2201/86—Event-based monitoring
-
- Y—GENERAL TAGGING OF NEW TECHNOLOGICAL DEVELOPMENTS; GENERAL TAGGING OF CROSS-SECTIONAL TECHNOLOGIES SPANNING OVER SEVERAL SECTIONS OF THE IPC; TECHNICAL SUBJECTS COVERED BY FORMER USPC CROSS-REFERENCE ART COLLECTIONS [XRACs] AND DIGESTS
- Y10—TECHNICAL SUBJECTS COVERED BY FORMER USPC
- Y10S—TECHNICAL SUBJECTS COVERED BY FORMER USPC CROSS-REFERENCE ART COLLECTIONS [XRACs] AND DIGESTS
- Y10S715/00—Data processing: presentation processing of document, operator interface processing, and screen saver display processing
- Y10S715/961—Operator interface with visual structure or function dictated by intended use
- Y10S715/963—Calendar or scheduling
Definitions
- This invention relates to the evaluation of parallel program execution, and more particularly, to transforming discrete functional events recorded in trace data into graphical form for evaluative purposes.
- This invention treats the evaluation of parallel activity. Such processing is more complex than that of processing performed serially. This derives from the likelihood that several objects belonging to a common application and processed by independent virtual processors invariably exhibit unanticipated data dependences and resource scheduling limitations on the processing order.
- the first attribute of interest is whether the parallel processed objects are deterministic or not.
- a system or body of executable code is deterministic where it may be driven to the same state and outcome by repeating the history of events applied to it. However, where changes to availability of resources operate to change relative or absolute ordering of system state changes, then repeating history may not necessarily drive the system to the same state. In this case, the system or body of code is deemed nondeterministic.
- rule-based inferencing and applications executing in parallel computing environments are systems prone to nondeterminism.
- the former is due to the fact that the rule set selected out by the change in the data set for the next execution cycle may be driven to two or more outcomes; and the latter because computations may include noncommutative operations and data dependences sensitive to changes in availability among processors. Consequently, nondeterminism in parallel processing places additional burdens on evaluative mechanisms such as debugging in contrast to mere sequential processing.
- Logs and traces both connote time-ordered series of recorded indicia representing changes to the information and/or control state of a system.
- Log records have been used in connection with transaction-oriented management systems to reestablish a prior state of information consistency in the event of fault, e.g., U.S. Patent 4,498,145.
- Traces have been used for both real time debugging of program sequences and for studies indicative of program and computing environment interaction.
- the trace is used to assist in synchronizing the points in the object code with the counterpart source code structures and to display the synched points in meaningful ways.
- Duisberg U.S. Patent 4,821,220.
- Duisberg U.S. Patent 4,821,220.
- US 4,821,220 uses a trace in the form of an explicit time recorded event ordering (time-ordered messages) to drive state changes among interactive objects in an object-oriented programming system (OOPS) operative as an application model, there being at least one visible manifestation of a state change.
- OOPS object-oriented programming system
- EP-A-359726 uses a two-step method for debugging segments of code for rule-based inferencing embedded in segments of procedural code. Synchronism is established between the display of data objects and the rule conflict set by provision of a pre-fire and a post-fire rule display state, and a flow of control from one rule to another by use of a single step command.
- sequential processes lend themselves to being analyzed by a single sequential output device.
- a sequential program manifests only a single thread of execution. This can accurately be displayed as sequential text.
- parallel processes include multiple threads where the data may be logically as well as physically distributed.
- synchronization relates the thread of one process to the thread of another process. If p is a point in the thread of process P and q is a point in the thread of process Q, then synchronization is used to constrain the order in which P reaches p and Q reaches q, i.e., the exchange of control information between processes.
- processes A and B respectively include steps 'abcde' and 'wxyz' and execute independently on a uniprocessor, then any interleaved order is acceptable as long as the relative order is preserved, i.e., 'abwxcyzde' is as acceptable as 'awbxcydze'.
- 'abwxcyzde' is as acceptable as 'awbxcydze'.
- the interleaved order may be substantially restricted.
- parallel processing connotes an application executing in a multiprocessor environment in which units of work are scheduled/dispatched as a function of virtual processor availability.
- the application may be expressed in a compiled form of a high-level language such as VS FORTRAN extended to include constructs defining the invocation, execution, synchronization, and termination of units of work concurrently executable.
- the extensions include:
- PENN STATE UNIVERSITY, PENNSYLVANIA, DAVID BERSTEIN et al describe a performance monitoring tool for visualizing the execution of parallel programs on a shared memory multiprocessor system, including a tracking routine which collects performance data concerning the use of parallel constructs, and a user interface which analyses the collected data and displays the results to a user in graphical form.
- a trace file is used to store timing information.
- the invention provides a method as defined in the attached claims for converting computer trace data into graphical form, said trace data being obtained from concurrently executing virtual processors, comprising the steps of:
- a traverse of reformatted data could be used to derive and display time process diagrams.
- Such reformatting and linking takes advantage of the fact that the other factors identifying the state of the computations and virtual processors are highly correlated with events evoking parallel activity. The other factors include processor, task ID, and time indicia.
- a traverse or decomposition of the reformatted trace data can be used to create the time process diagrams to depict (1) virtual processor utilization in terms of active, idle/wait or unavailable states; and (2) functional decomposition of elements of an executing hierarchy of parallel tasks.
- the table may allow correlation of time of occurrence, virtual processor, task ID, at least one event initiating parallel activity, and a pointer to a terminating event for the parallel activity initiated by the current event.
- the processor utilization display may be driven by a primary sort on virtual processor ID and a secondary sort on the event trace of the table.
- the executing parallel task hierarchy display may be driven by a primary sort on the task ID and a secondary sort on the linked activity.
- the parallel activity display may be expedited by use of an inverted index into the table by way of a task ID.
- Stone's animation (pages 8-10) is directed to dynamic visualization for improving correctness (debug purposes).
- the method of this invention is an aid to tuning. It exhibits measured or weighted variables such as average processor active, idle, or wait state distribution over discrete points in time. The points occur at designated forks and joins of threads of parallel activity. That is, the method is directed to activity occurring at parallel processing endpoints whose display is synchronized with a traverse of crosslinks embedded within a reformatted trace primarily sorted on either a virtual processor ID or task ID and secondarily sorted on events.
- Figs. 1-3 depict respectively the hierarchic organization of parallel tasks, the relations between virtual processors to parallel tasks and threads, and a parallel thread hierarchy as constructs in an extended FORTRAN language system.
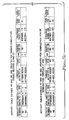
- Fig. 4 shows prototypical trace data and the processing constructs (parallel activity table) derived therefrom according to an embodiment of the invention.
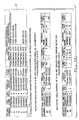
- Fig. 5 provides a snapshot of an actual trace of parallel activity and concomitant parallel activity table entries, the completion pointer entries being derived during trace analysis.
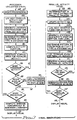
- Fig. 6 depicts the flow of control for the table build according to Fig. 5.
- Fig. 7 sets out the flow of control for mapping the table elements onto a time process graph relating to processor utilization and degree of parallel decomposition or hierarchy according to an embodiment of the invention.
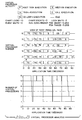
- Figs. 8 and 9 respectively embody the time process display of processor utilization over time and parallel activity task management over time.
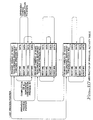
- Fig. 10 is an additional abstract view of the parallel activity table of the type depicted in Fig 4.
- a FORTRAN language extended for parallel execution typically contains constructs which permit a main program or task to originate, invoke, and terminate subtasks. It is anticipated that tasks are originated and terminated relatively rarely. However, once originated, tasks are invoked repeatedly. The invocation may be in a form which requires the calling task subsequently explicitly to wait for the subtask to complete. Alternatively, it may be in a form in which the subtask is enabled to complete execution with no explicit wait by the calling task.
- FORTRAN programs typically involve the creation, manipulation, and finally deletion of subordinate tasks. Each task is independent. Except for data shared between a calling and a called task, and except for files manipulated jointly by two tasks, the execution of one task is ideally independent of and cannot affect the execution of another task.
- the FORTRAN language extensions are used both to support the task hierarchy shown in Fig. 1, the parallel thread hierarchy shown in Fig. 3, and to secure selective parallel operations as found, for example, in the IBM FORTRAN Version 2 Release 5 language system.
- the constructs are defined as:
- a PARALLEL PROGRAM is an executable object (program) including one or more of the language extensions, an object compiled for automatic parallelization, or a program using lock or event service routines.
- a PARALLEL LOOP (equivalent of DO) includes a set of statements executed as long as a specified condition exists. Each iteration of the loop can be executed concurrently with other iterations of the loop. Valid operation requires computational independence or controlled access to modified shared data areas. In contrast, the permutative order of iteration for a serially processed loop is generally limited or predefined.
- a parallel loop is explicitly created either by a PARALLEL DO statement, or is generated by automatically parallelized DO loops.
- Each iteration of the loop can be a parallel thread executed by a virtual processor.
- groups of iterations are combinable into a single thread executed on a virtual processor.
- the number of virtual processors concurrently participating in parallel loop execution depends on the amount of other parallel work to be executed. For example, a parallel group of 10000 iterations could be partitioned into four groups of 2500 iterations. These iterations could be executed on two virtual processors. In this regard, one virtual processor might execute three groups while the other processor could execute one group.
- a PARALLEL SECTION is a group of sequentially executed statements. Each section can be executed concurrently with other sections in the parallel section.
- a PARALLEL TASK is an abstract data type in which PARALLEL THREADS are completely specified for execution including data storage.
- a ROOT task designates the point where program execution starts. Additional parallel tasks are created with ORIGINATE statements and are managed by SCHEDULE, WAIT FOR, and TERMINATE statements.
- Fig. 1 there is shown multiple levels of parallel tasks 1-13.
- a hierarchical ownership structure is established. Originated tasks 7, 9, 11 are "owned” by the counterpart parallel tasks 3, 5 in which a task ORIGINATE statement was specified.
- task 9 is the parent of task 13.
- the root task 1 is the highest level of the parallel task structure.
- a PARALLEL THREAD is a unit of work eligible for concurrent execution.
- a parallel thread can be a subroutine, loop iteration, or section of code. For each of these, the thread contains the functions invoked within them, and the subroutines invoked within the with the CALL statement.
- Parallel processing is achieved by execution of multiple threads simultaneously.
- the parallel language statements mey dispatch one or more additional parallel threads for concurrent execution. Such a dispatched or child parallel thread is not considered to be part of the parent thread but a separately executable entity.
- a PARALLEL PROGRAM when a PARALLEL PROGRAM is executed, it begins with the primary parallel thread thereof.
- Parallel threads execute in the same task in which they were dispatched when they are bounded by parallel DO, SECTION, or CALL statements. Also, they can execute in different parallel tasks from the one within which they were dispatched when the SCHEDULE construct is used.
- Fig. 3 there is depicted the inherent nondeterminism or parallel processing. This derives from two sources; namely, the concurrency/wait relations among tasks, and the availability of virtual processors.
- a parallel thread hierarchy is expressed as three correlated vertical timelines with time increasing from top to bottom.
- a parallel DO is set out. This may be manifest in the form of many hundreds of threads. Where the parallel DO originated from a parent task, nominally the parent would be suspended until the threads of the parallel DO were executed.
- the next two rows depict an originating task and its time overlap or concurrency relationships with either child tasks or independently originated tasks.
- the threads of an originating task can either be suspended or continue in overlapped relations.
- the WAIT FOR construct is used to control the point where an originating task will suspend itself in relation to child tasks and even the root task thereof.
- the middle row depicts where the WAIT FOR ALL construct was executed at the beginning of the invocation of the invoked tasks, whereas in the bottom row the WAIT FOR caused the root task to be suspended well into the execution of hierarchically subordinate tasks.
- FIG. 2 there is shown the operative relationships among virtual processors 15-19, parallel tasks 21-23, attendant threads, and local environments 25-29.
- Each of the virtual processors is a logical processor upon which a primary parallel thread is executed. As the execution proceeds, other parallel threads are dispatched by the parallel language constructs in the manner of Fig. 2.
- FORTRANas a compiled language system specifies the execution or runtime (local environment) environment including the number and management of the virtual processors. However, the binding of virtual to real processors is controlled by an operating system such as MVS and not the compiled parallel FORTRAN based application.
- parallel threads When a parallel program executes with one virtual processor, parallel threads do not execute concurrently. Rather, they execute in a quasi-serial manner. Part of a thread may be executed, and then execution may be suspended due to synchronization requirements so that another parallel thread may be executed. The original parallel thread can resume after the second thread completes. Recall that in such processing it is necessary to preserve the relative order of events or steps within a thread. This process, which occurs when there are not enough virtual processors to maintain a one-to-one correspondence between parallel threads that have begun execution and the processors, is called "redispatching".
- Trace 31 is a timestamp sorted log of attributes associated with parallel processing events.
- the event types include FORK and JOIN.
- FORK In the older literature, (Holt et al., "Structured Concurrent Programming With Operating Systems Applications", copyright 1978 by Addison-Wesley Publishing Company, pp. 18 and 31) FORK denoted branching to concurrent processing tasks and JOIN was a point of termination.
- the recorded attributes include the virtual processor ID, event type, task ID, etc.
- One step is to reformat and reprocess the trace.
- the resultant constructs 33, 35 are termed a parallel activity and a parallel process table. Each reformatted entry for a trace event in the activity table 33 includes a unique activity number and a pointer 34 to the terminating event for the parallel activity started with the current event.
- the parallel process table 35 is derived from the activity table 33. It constitutes a mix of an inverted index into the activity table and a store for computations of selected concurrency variables.
- the significant use of table 35 is with respect to expediting generation of the display of the executing hierarchy of parallel tasks. This latter is accomplished by including a pointer to the first task in the activity table 33 at the start of a process and then following the pointers.
- FIGs. 5 and 6 there are respectively depicted an actual trace 31′ and activity table 33′ and a flow of control for executing the activity table build.
- the object is to reformat trace 31′, and add to it appropriate control numbers and pointers in order to appear in form similar to that of 33′.
- trace 31′ comprises records 7-13 of which records 7-9 relate to a parallel DO, records 10-11 pertain to a thread initiation, and records 12-13 concern thread termination.
- activity table 33′ is commented to correlate the trace records and activity table entries.
- the trace records of the parallel DO are transformed into activity table entries 45 and 46.
- the start of table build involves the scanning the trace records for the purposes of locating the beginning of a requested parallel process. This is accomplished (step 41) by recognition of those functional events associated with starting parallel activities i.e. FORK or INIT (termed PDFORK and KNIT in Fig. 5).
- step 41 by recognition of those functional events associated with starting parallel activities i.e. FORK or INIT (termed PDFORK and KNIT in Fig. 5).
- step 43 begins the step 43 of creating a table entry for the parallel process. This includes saving the name of the application, statement number, parallel activity type, pointer-to-activity task table, start time of process, and parameters and initialization data.
- the system recognizes the appropriate functional event termination trace records for each parallel activity (step 47). Next, using the task ID from the termination record, the last parallel activity started for the task is located and its activity status is set to open "completed".
- the system also creates a completion entry in the parallel activity table to save the completion time, statement number, case labels, and completion reason.
- a pointer to the completion entry is added to the started entry for each parallel activity (step 51). If the task completed has "more" status, the system looks for more functional events for the process (steps 53, 54, 45). This task is completed with a synchronization post, and the label identifier is stored in the activity completion entry before scanning for more events (steps 56, 57). For a nested "post", a new parallel activity using the parent task name is generated and the start time is assumed to be the post time (step 55). For a terminal post at a next level of zero, the parallel process is considered complete and the parallel activity and parallel tables are updated with appropriate time and completion data (steps 59, 61, 65).
- Time process displays are generated using the starting statement of each activity as the ordinate access label and elapsed time within the parallel process as the abcissa label. Ending statement numbers and synchronization labels are added at the end of each time process displayed.
- the time process display of virtual processor utilization is generated using the virtual processor number as the ordinate access and the application time gyration for one or more parallel processes as the abcissa.
- FIG. 10 there is shown an abstraction of the parallel activity table as depicted in Fig. 4.
- the abstraction shows the chaining within each table and the linkage between the primary thread activity and the dependent thread activity.
- Fig. 10 there is a new entry in the activity table each time the root parallel task primary thread creates dependent threads.
- each primary thread process has a pointer to the completion of all dependent threads, thereby returning control to one virtual processor.
- each process entry has a pointer in the parallel activity table to a previous process. This can be used for backward scrolling.
- each virtual processor used for a primary thread process has an activity table entry for both the first dependent thread and the last dependent thread that the processor executes.
- each first thread entry has a pointer to the last thread entry for a given processor.
- the pointer to the last thread entry operates as the completion pointer for a group of dependent threads executed by a single processor.
- the recorded time for the first thread executed by each processor also serves as the startime of that thread's execution.
- the recorded time for the last thread executed by the processor is the completion time of that thread's execution, or the completion time of that processor.
- Figs. 5 and 7 there are respectively set out selected portions of an activity table 31′ and the flow of control used to recursively decompose and graphically map the table elements onto a display.
- steps 67-93 in Fig. 7 relate to the generation of a time process display of virtual processor utilization
- steps 99-119 in Fig. 7 pertain to the time process display of an executing hierarchy of parallel tasks.
- Fig. 8 sets out a timeline of utilization. It also displays counterpart bar charts color coded with references to the processor activity state.
- a processor concurrency variable is defined as the number of virtual processors being used at any instant in time for task execution.
- An average concurrency variable is computed by integrating the processor concurrency as a function of time and dividing by the process time to get the effective number of processors.
- a processor utilization value is computed by averaging the processor concurrency value over the time of the process and converting to a percentage of the number of virtual processors used for the process.
- this display permits review of how much work switching between virtual processors has occurred. It also permits ascertaining how the parallel tasks are allocated among the processors, their order of execution, etc.
- the time process diagram depicting virtual processor utilization is created by processing the parallel activity table once for each virtual processor ID.
- the beginning and end times for each primary thread process are compared to the time range of the selected view (Tmin, Tmax) to determine that one or more dependent thread activities is visible in the diagram time range.
- a standard clipping method is used to display the visible portion of the activity.
- Tmin and Tmax diagram range variables have corresponding process beginning and ending numbers for display eligibility.
- the system returns to graph the next processor utilization.
- the method of the invention as displayed on an interactive system, permits an operator to choose to zoom or scroll forvard or backward to obtain a processor utilization diagram with a new time range (Nmin,Nmax).
- Nmin,Nmax a new time range
- three views or displays can be most advantageously utilized. These include zoom, forward, and backward view.
- Tmin and Tmax variables are set with the Nmin and Nmax values respectively, and corresponding new process beginning and ending numbers for display eligibility are determined.
- root parallel task primary thread execution is active on a single virtual processor from the completion time of each process number to the next process start time, i.e, the time between the last processor execution of a dependent thread and the next primary thread generation of new dependent threads.
- a Virtual Processor Concurrency diagram is easily created by plotting the total number of processors active at each activity time between the time range of a requested chart. The numbers used were computed from the number of active processors entered in the activity table at each new entry to the activity table.
- the parallel activity diagram is created by selecting an individual primary thread (process number) from the activity table to produce time process display.
- the beginning and end times for the process number become the Tmin and Tmax for the diagram time range.
- Beginning and end time of dependent thread execution on each virtual processor is then graphically generated.
- the sequence of generation is based on the hierarchy number found in the activity table (H#), i.e, activities with the same number are plotted on the same vertical axis value, beginning and completion of virtual processor activity on dependent threads being one example of this.
- the starting data is placed in column format at the left of the activity plot, and the completion data is placed at the end of activity as notes.
- Temporary barriers such as variable locks are another example. Parenthetically, zooming of the time range of the parallel hierarchy of a primary thread works in a manner similar to zooming on a Virtual Processor Utilization diagram.
- FIG. 9 there is depicted the parallel task activity in terms of hierarchical execution of a parallel program. Any application must specify nested parallelism by using parallel constructs within a parallel task environment. The multiple levels of parallelism are specified by using task management constructs indicative that other parallel tasks may execute concurrently for both nested parallelism and multiple levels of parallelism. There is shown a hierarchy defined between the parallel threads that execute at runtime. The time process diagram of parallel task activity shown in Fig. 9 permits one to ascertain for each parallel thread when it was scheduled for execution, when it was executed on a virtual processor, when it was suspended, when it was waiting, and when it completed its execution.
- a graphical data display manager can be invoked for "coloring" a display as correlated with one or more entries in the activity tables 33 or 33' as the table is traversed with selective table elements onto the display (GDDM is a trade mark of International Business Machines Corporation).
- GDDM provides a physical interface to display terminals and plotters and is required to show the charts defined in this invention.
- the interactive features utilize GDDM handling of interrupts invoked by keyboard/keystroke activation of operator requests, e.g., operator selection of new, beginning, and ending time of a Virtual Processor Utilization diagram for a zoom view.
- At least the preferred embodiment provides a computer- implemented system for evaluating resource utilization and parallelism with respect to computations executing concurrently on one or more virtual processors.
- the system also provides for analyzing the functional events occurring during parallel execution to derive parallel process summary variables, parallel activity duration, and concurrency variables, the functional events being recorded in real time and not virtual time.
- the system depicts resource utilization and parallelism as an aid to (1) improving the performance of parallel applications by load balancing and the like, (2) verifying parallel execution paths such as whether a parallel loop is executed in parallel or serially, and (3) debugging such as by identifying execution time data and resource dependences.
Landscapes
- Engineering & Computer Science (AREA)
- Theoretical Computer Science (AREA)
- General Engineering & Computer Science (AREA)
- Quality & Reliability (AREA)
- Physics & Mathematics (AREA)
- General Physics & Mathematics (AREA)
- Computer Hardware Design (AREA)
- Data Mining & Analysis (AREA)
- Debugging And Monitoring (AREA)
Claims (7)
- Ein Verfahren für das Umwandeln von Computerablaufdaten in eine graphische Form, wobei die Ablaufdaten (31) aus der gleichzeitigen Ausführung virtueller Prozessoren (15, 17) gewonnen werden, wobei die Ablaufdaten eine Auflistung von Ereignissen mit den zugehörigen Kennungen der virtuellen Prozessoren und Aufgaben umfassen, und wobei das Verfahren die Schritte umfaßt zum:(a) Umformatieren der Ablaufdaten (31) zu einer Tabelle der parallelen Aktivitäten (34), indem die Ablaufdaten durchsucht werden und für jede parallele Aktivität die Ereignisse lokalisiert werden, die die parallele Aktivität einleiten und beenden, wobei jeder umformatierte Eintrag in der Tabelle der parallelen Aktivitäten eine eindeutige Aktivitätennummer und eine Verbindung zum Beendigungsereignisse für die betreffende Aktivität aufweist;(b) Extrahieren von Daten aus der Tabelle der parallelen Aktivitäten gemäß der Indexierung durch die Kennung des virtuellen Prozessors oder der Aufgabe für jede parallele Aktivität; und(c) graphischen Abbilden der extrahierten Daten auf einer Bildschirmanzeige.
- Das Verfahren nach Anspruch 1, bei dem die graphisch abgebildeten extrahierten Daten (1) vom virtuellen Prozessor und der parallelen Aktivität indexiert werden, um die Prozessorauslastung anzuzeigen, und/oder (ii) von der Aufgabenkennung und der parallelen Aktivität indexiert werden, um die Ausführungshierarchie paralleler Aufgaben anzuzeigen.
- Das Verfahren nach Anspruch 2, das des weiteren die Schritte umfaßt zum Ableiten einer Konkordanztabelle (35), die die Aufgabenkennung und die parallelen Aktivitäten, die nach der Aufgabenkennung sortiert sind, in Beziehung zueinander setzt, und zum Verwenden der Konkordanztabelle, um auf die Tabelle der parallelen Aktivitäten zuzugreifen, um die Ausführungshierarchie paralleler Aufgaben anzuzeigen.
- Das Verfahren nach Anspruch 2 oder 3, wobei der Schritt des graphischen Abbildens der aus der Tabelle extrahierten Daten auf der Anzeige das Aufrufen eines Graphikdaten-Anzeigedienstprogramms umfaßt, um die Anzeige, die vom ausgewählten Prozessor, von der Aufgabenkennung und der parallelen Aktivität indexiert ist, mit Farben zu versehen.
- Das Verfahren nach einem der Ansprüche 2, 3 oder 4, wobei die graphische Abbildung der Prozessorauslastung ein Zeitprozeßdiagramm umfaßt und jedes Zeitprozeßdiagramm einer Zoom-, einer Vorwärts- und einer Rückwärtssicht ausgesetzt werden kann, die als Zeitbereich oder Intervall ausgedrückt wird, und wobei der Abbildungsschritt des weiteren die Schritte umfaßt zum Ausdrücken der parallelen Aktivität in Form primärer und sekundärer Threads, wobei ein paralleler Thread eine für die gleichzeitige Ausführung auswählbare Arbeitseinheit ist, zum Vergleichen der Anfangs- und Endzeiten für jeden primären Thread mit dem Zeitbereich der ausgewählten Sicht und zum selektiven Anpassen der Sicht, um die Thread-Aktivität auf den Diagramm-Zeitbereich abzustimmen und die Sichtbarkeit zu verbessern.
- Das Verfahren nach einem der vorangehenden Ansprüche, bei dem die Ablaufdaten generiert werden, indem Funktionen abgefertigt werden, die entweder in ein Anwendungsprogramm oder in ein Betriebssystem eingebettet sind, das auf den virtuellen Prozessoren ausgeführt wird.
- Ein Datenverarbeitungssystem mit einer Einrichtung für das Umwandeln von Computerablaufdaten in eine graphische Form, wobei die Ablaufdaten (31) aus der gleichzeitigen Ausführung virtueller Prozessoren (15, 17) gewonnen werden, wobei die Ablaufdaten eine Auflistung von Ereignissen mit den zugehörigen Kennungen der virtuellen Prozessoren und der Aufgaben umfassen, und wobei die Umwandlungseinrichtung folgendes umfaßt:(a) eine Einrichtung für das Umformatieren der Ablaufdaten (31) zu einer Tabelle der parallelen Aktivitäten (34), indem die Ablaufdaten durchsucht werden und für jede parallele Aktivität die Ereignisse lokalisiert werden, die die parallele Aktivität einleiten und beenden, wobei jeder umformatierte Eintrag in der Tabelle der parallelen Aktivitäten eine eindeutige Aktivitätennummer und eine Verbindung zum Beendigungsereignis für die betreffende Aktivität aufweist;(b) eine Einrichtung für das Extrahieren von Daten aus der Tabelle der parallelen Aktivitäten gemäß der Indexierung durch die Kennung des virtuellen Prozessors oder der Aufgabe für jede parallele Aktivität; und(c) eine Einrichtung für das graphische Abbilden der extrahierten Daten auf einer Bildschirmanzeige.
Applications Claiming Priority (2)
| Application Number | Priority Date | Filing Date | Title |
|---|---|---|---|
| US420845 | 1989-10-13 | ||
| US07/420,845 US5168554A (en) | 1989-10-13 | 1989-10-13 | Converting trace data from processors executing in parallel into graphical form |
Publications (3)
| Publication Number | Publication Date |
|---|---|
| EP0422945A2 EP0422945A2 (de) | 1991-04-17 |
| EP0422945A3 EP0422945A3 (en) | 1992-03-04 |
| EP0422945B1 true EP0422945B1 (de) | 1996-08-14 |
Family
ID=23668069
Family Applications (1)
| Application Number | Title | Priority Date | Filing Date |
|---|---|---|---|
| EP90311178A Expired - Lifetime EP0422945B1 (de) | 1989-10-13 | 1990-10-11 | Bearbeitung von Ablaufdaten paralleler Verarbeitung |
Country Status (4)
| Country | Link |
|---|---|
| US (1) | US5168554A (de) |
| EP (1) | EP0422945B1 (de) |
| JP (1) | JPH03127236A (de) |
| DE (1) | DE69028061T2 (de) |
Families Citing this family (78)
| Publication number | Priority date | Publication date | Assignee | Title |
|---|---|---|---|---|
| US5610828A (en) * | 1986-04-14 | 1997-03-11 | National Instruments Corporation | Graphical system for modelling a process and associated method |
| EP0396833A1 (de) * | 1989-05-12 | 1990-11-14 | International Business Machines Corporation | Anordnung zur Ablaufverfolgung in einer Mehrprozessbetriebsumgebung |
| US5367677A (en) * | 1990-05-11 | 1994-11-22 | Thinking Machines Corporation | System for iterated generation from an array of records of a posting file with row segments based on column entry value ranges |
| US5321804A (en) * | 1990-07-05 | 1994-06-14 | Fijitsu Limited | Chemical data handling system |
| US5335339A (en) * | 1990-11-22 | 1994-08-02 | Hitachi, Ltd. | Equipment and method for interactive testing and simulating of a specification of a network system |
| JPH0774984B2 (ja) * | 1991-06-10 | 1995-08-09 | インターナショナル・ビジネス・マシーンズ・コーポレイション | システム資源利用率測定方法とデータ処理システム |
| JPH05181631A (ja) * | 1991-06-10 | 1993-07-23 | Internatl Business Mach Corp <Ibm> | ダイナミックな変数更新及び自動境界用サポートを有するデータ処理装置のリアルタイム装置リソースモニタ |
| JP2622219B2 (ja) * | 1991-12-26 | 1997-06-18 | 富士通株式会社 | 並列計算機の性能評価方法及びその装置 |
| JPH0683404A (ja) * | 1992-01-20 | 1994-03-25 | Internatl Business Mach Corp <Ibm> | スケジュール表示のカストマイズ装置および方法 |
| US5852449A (en) * | 1992-01-27 | 1998-12-22 | Scientific And Engineering Software | Apparatus for and method of displaying running of modeled system designs |
| US5634022A (en) * | 1992-03-06 | 1997-05-27 | International Business Machines Corporation | Multi-media computer diagnostic system |
| US5553305A (en) * | 1992-04-14 | 1996-09-03 | International Business Machines Corporation | System for synchronizing execution by a processing element of threads within a process using a state indicator |
| JP3372563B2 (ja) * | 1992-04-30 | 2003-02-04 | 新日鉄ソリューションズ株式会社 | 木構造表示編集装置 |
| US5877764A (en) * | 1992-10-23 | 1999-03-02 | International Business Machines Corporation | Graphical user interface for managing text i/o between a user and a parallel program |
| US5455899A (en) * | 1992-12-31 | 1995-10-03 | International Business Machines Corporation | High speed image data processing circuit |
| JP2634137B2 (ja) * | 1993-01-27 | 1997-07-23 | インターナショナル・ビジネス・マシーンズ・コーポレイション | ユーザ・インターフェースシステム及び方法 |
| EP0610581A3 (de) * | 1993-01-29 | 1994-12-28 | Ibm | Verfahren zur Darstellung von Ablaufdaten, hergestellt durch einen Parallelverarbeitungsrechner. |
| CA2159468C (en) * | 1993-03-31 | 2002-09-10 | Object Technology Licensing Corporation | Time-based script sequences |
| JP2762893B2 (ja) * | 1993-04-02 | 1998-06-04 | 三菱電機株式会社 | プログラマブルコントローラ及びそのプログラマブルコントローラを用いたsfcプログラム実行方法 |
| US5442740A (en) * | 1993-07-13 | 1995-08-15 | International Business Machines Corporation | Method and apparatus for visual display of program performance trace data |
| US5692193A (en) * | 1994-03-31 | 1997-11-25 | Nec Research Institute, Inc. | Software architecture for control of highly parallel computer systems |
| US5649085A (en) * | 1994-12-09 | 1997-07-15 | International Business Machines Corporation | Method and system for storing and displaying system operation traces with asynchronous event-pairs |
| US5732269A (en) * | 1995-04-21 | 1998-03-24 | International Business Machines Corporation | Data adapter transparent to application I/O path |
| US5838976A (en) | 1995-11-28 | 1998-11-17 | Hewlett-Packard Co. | System and method for profiling code on symmetric multiprocessor architectures |
| US6057839A (en) * | 1996-11-26 | 2000-05-02 | International Business Machines Corporation | Visualization tool for graphically displaying trace data produced by a parallel processing computer |
| US5862381A (en) * | 1996-11-26 | 1999-01-19 | International Business Machines Corporation | Visualization tool for graphically displaying trace data |
| US5924098A (en) * | 1997-06-30 | 1999-07-13 | Sun Microsystems, Inc. | Method and apparatus for managing a linked-list data structure |
| US6286130B1 (en) * | 1997-08-05 | 2001-09-04 | Intel Corporation | Software implemented method for automatically validating the correctness of parallel computer programs |
| US6332212B1 (en) * | 1997-10-02 | 2001-12-18 | Ltx Corporation | Capturing and displaying computer program execution timing |
| US6553564B1 (en) * | 1997-12-12 | 2003-04-22 | International Business Machines Corporation | Process and system for merging trace data for primarily interpreted methods |
| US6314471B1 (en) | 1998-11-13 | 2001-11-06 | Cray Inc. | Techniques for an interrupt free operating system |
| US6862635B1 (en) * | 1998-11-13 | 2005-03-01 | Cray Inc. | Synchronization techniques in a multithreaded environment |
| US6480818B1 (en) | 1998-11-13 | 2002-11-12 | Cray Inc. | Debugging techniques in a multithreaded environment |
| US6952827B1 (en) * | 1998-11-13 | 2005-10-04 | Cray Inc. | User program and operating system interface in a multithreaded environment |
| US6665688B1 (en) | 1998-12-23 | 2003-12-16 | Cray Inc. | Method and system for automatically regenerating data on-demand |
| US6415433B1 (en) | 1998-12-23 | 2002-07-02 | Cray Inc. | Method and system for identifying locations to move portions of the computer program |
| US6321379B1 (en) | 1998-12-23 | 2001-11-20 | Cray Inc. | Method and system for target register allocation |
| US6230313B1 (en) * | 1998-12-23 | 2001-05-08 | Cray Inc. | Parallelism performance analysis based on execution trace information |
| US6353829B1 (en) | 1998-12-23 | 2002-03-05 | Cray Inc. | Method and system for memory allocation in a multiprocessing environment |
| US6430676B1 (en) | 1998-12-23 | 2002-08-06 | Cray Inc. | Method and system for calculating instruction lookahead |
| US6836894B1 (en) * | 1999-07-27 | 2004-12-28 | International Business Machines Corporation | Systems and methods for exploratory analysis of data for event management |
| US6611276B1 (en) * | 1999-08-31 | 2003-08-26 | Intel Corporation | Graphical user interface that displays operation of processor threads over time |
| US6986137B1 (en) * | 1999-09-28 | 2006-01-10 | International Business Machines Corporation | Method, system and program products for managing logical processors of a computing environment |
| US20030005407A1 (en) * | 2000-06-23 | 2003-01-02 | Hines Kenneth J. | System and method for coordination-centric design of software systems |
| US7478368B2 (en) * | 2001-04-24 | 2009-01-13 | International Business Machines Corporation | Organization and visualization of performance data in selected display modes |
| US7043669B2 (en) * | 2002-04-03 | 2006-05-09 | International Business Machines Corporation | Simple scenario builder |
| US7694164B2 (en) | 2002-09-20 | 2010-04-06 | Intel Corporation | Operating system-independent method and system of determining CPU utilization |
| US7131113B2 (en) * | 2002-12-12 | 2006-10-31 | International Business Machines Corporation | System and method on generating multi-dimensional trace files and visualizing them using multiple Gantt charts |
| US20050050310A1 (en) * | 2003-07-15 | 2005-03-03 | Bailey Daniel W. | Method, system, and apparatus for improving multi-core processor performance |
| US7328429B2 (en) * | 2003-11-13 | 2008-02-05 | Intel Corporation | Instruction operand tracing for software debug |
| US7617488B2 (en) * | 2003-12-30 | 2009-11-10 | Intel Corporation | Method and apparatus and determining processor utilization |
| US7496729B2 (en) * | 2004-05-13 | 2009-02-24 | International Business Machines Corporation | Method and apparatus to eliminate interpartition covert storage channel and partition analysis |
| US7343521B2 (en) * | 2004-05-28 | 2008-03-11 | International Business Machines Corporation | Method and apparatus to preserve trace data |
| DE102004046878A1 (de) * | 2004-09-28 | 2006-04-13 | Robert Bosch Gmbh | Verfahren und Vorrichtung zum Bestimmen einer Systemlast eines Prozessorsystems |
| US7555549B1 (en) * | 2004-11-07 | 2009-06-30 | Qlogic, Corporation | Clustered computing model and display |
| US7698686B2 (en) * | 2005-04-15 | 2010-04-13 | Microsoft Corporation | Method and apparatus for performance analysis on a software program |
| US20070136232A1 (en) * | 2005-12-12 | 2007-06-14 | Kazuo Nemoto | Displaying tags to provide overall view of computing device activity as recorded within log of records |
| JP5040136B2 (ja) * | 2006-03-27 | 2012-10-03 | 富士通セミコンダクター株式会社 | チューニング支援装置、チューニング支援プログラム、チューニング支援プログラムを記録したコンピュータ読み取り可能な記録媒体およびチューニング支援方法 |
| CN101154291B (zh) * | 2006-09-29 | 2010-05-12 | 国际商业机器公司 | 图像数据压缩方法、图像显示方法及其相应装置 |
| US7853928B2 (en) * | 2007-04-19 | 2010-12-14 | International Business Machines Corporation | Creating a physical trace from a virtual trace |
| US20080270658A1 (en) * | 2007-04-27 | 2008-10-30 | Matsushita Electric Industrial Co., Ltd. | Processor system, bus controlling method, and semiconductor device |
| US8819643B1 (en) * | 2007-09-25 | 2014-08-26 | The Mathworks, Inc. | Parallel program profiler |
| US8434076B2 (en) * | 2007-12-12 | 2013-04-30 | Oracle International Corporation | Efficient compilation and execution of imperative-query languages |
| US9594656B2 (en) * | 2009-10-26 | 2017-03-14 | Microsoft Technology Licensing, Llc | Analysis and visualization of application concurrency and processor resource utilization |
| US9430353B2 (en) | 2009-10-26 | 2016-08-30 | Microsoft Technology Licensing, Llc | Analysis and visualization of concurrent thread execution on processor cores |
| US20110179160A1 (en) * | 2010-01-21 | 2011-07-21 | Microsoft Corporation | Activity Graph for Parallel Programs in Distributed System Environment |
| US9846628B2 (en) | 2010-06-15 | 2017-12-19 | Microsoft Technology Licensing, Llc | Indicating parallel operations with user-visible events |
| US8762783B2 (en) * | 2010-06-24 | 2014-06-24 | International Business Machines Corporation | Error identification |
| US8990551B2 (en) | 2010-09-16 | 2015-03-24 | Microsoft Technology Licensing, Llc | Analysis and visualization of cluster resource utilization |
| US8538897B2 (en) * | 2010-12-03 | 2013-09-17 | Microsoft Corporation | Cross-trace scalable issue detection and clustering |
| US9003371B2 (en) * | 2010-12-30 | 2015-04-07 | International Business Machines Corporation | Recursive method call representation in a plot view of method execution performance |
| US9549030B2 (en) * | 2011-02-04 | 2017-01-17 | Riverbed Technology, Inc. | Correlating input and output requests between client and server components in a multi-tier application |
| US9691171B2 (en) * | 2012-08-03 | 2017-06-27 | Dreamworks Animation Llc | Visualization tool for parallel dependency graph evaluation |
| US9311221B2 (en) * | 2013-03-15 | 2016-04-12 | Ab Initio Technology Llc | Recording program execution |
| US9996354B2 (en) * | 2015-01-09 | 2018-06-12 | International Business Machines Corporation | Instruction stream tracing of multi-threaded processors |
| US10802852B1 (en) * | 2015-07-07 | 2020-10-13 | Cadence Design Systems, Inc. | Method for interactive embedded software debugging through the control of simulation tracing components |
| US10552408B2 (en) * | 2016-11-02 | 2020-02-04 | Oracle International Corporation | Automatic linearizability checking of operations on concurrent data structures |
| FR3101459A1 (fr) * | 2019-09-27 | 2021-04-02 | Logpickr | Procédé et système de traitement de processus mis en œuvre par un système informatique par l’exécution de tâches séquentielles ou concurrentes |
Family Cites Families (4)
| Publication number | Priority date | Publication date | Assignee | Title |
|---|---|---|---|---|
| US4574354A (en) * | 1982-11-19 | 1986-03-04 | Tektronix, Inc. | Method and apparatus for time-aligning data |
| JPS63268045A (ja) * | 1987-04-24 | 1988-11-04 | Nec Corp | ジヨブ実行状態の表示方式 |
| US4855936A (en) * | 1987-09-25 | 1989-08-08 | International Business Machines Corp. | Full-screen input/output application program interface |
| US4953106A (en) * | 1989-05-23 | 1990-08-28 | At&T Bell Laboratories | Technique for drawing directed graphs |
-
1989
- 1989-10-13 US US07/420,845 patent/US5168554A/en not_active Expired - Fee Related
-
1990
- 1990-09-10 JP JP2239774A patent/JPH03127236A/ja active Pending
- 1990-10-11 DE DE69028061T patent/DE69028061T2/de not_active Expired - Fee Related
- 1990-10-11 EP EP90311178A patent/EP0422945B1/de not_active Expired - Lifetime
Also Published As
| Publication number | Publication date |
|---|---|
| US5168554A (en) | 1992-12-01 |
| EP0422945A3 (en) | 1992-03-04 |
| JPH03127236A (ja) | 1991-05-30 |
| DE69028061D1 (de) | 1996-09-19 |
| EP0422945A2 (de) | 1991-04-17 |
| DE69028061T2 (de) | 1997-02-06 |
Similar Documents
| Publication | Publication Date | Title |
|---|---|---|
| US5168554A (en) | Converting trace data from processors executing in parallel into graphical form | |
| Glatard et al. | Flexible and efficient workflow deployment of data-intensive applications on grids with MOTEUR | |
| US6593940B1 (en) | Method for finding errors in multithreaded applications | |
| US7143392B2 (en) | Hyperbolic tree space display of computer system monitoring and analysis data | |
| CA1302578C (en) | Device for managing software configurations in parallel in a network | |
| US9256485B1 (en) | System and method for generating message sequence diagrams from graphical programs | |
| Bohnet et al. | Visual exploration of function call graphs for feature location in complex software systems | |
| Alt et al. | Cosy compiler phase embedding with the cosy compiler model | |
| Paternò et al. | Developing task models from informal scenarios | |
| Atwood et al. | Steering programs via time travel | |
| Karavanic et al. | Integrated visualization of parallel program performance data | |
| Cantrill et al. | Threadmon: a tool for monitoring multithreaded program performance | |
| Black et al. | Linking Specifications, Abstraction, and Debugging | |
| Yan et al. | The automated instrumentation and monitoring system (AIMS) reference manual | |
| Soparkar et al. | Databases with deadline and contingency constraints | |
| Kramlich et al. | Program visualization: Graphics support for software development | |
| Ellershaw et al. | Program visualization-the state of the art | |
| Taylor | Debugging real-time software in a host-target environment | |
| Zhang et al. | Visputer—A Graphical Visualization Tool for Parallel Programming | |
| Bemmerl et al. | Visualization of message passing parallel programs | |
| Ancilotti et al. | Design and programming tools for time critical applications | |
| Erbacher | Visual debugging of data and operations for concurrent programs | |
| Anderson et al. | Graph models of computer systems: Application to performance evaluation of an operating system | |
| Kazman et al. | Software Architectures for Human-Computer Interaction: Analysis and Construction | |
| Prestwich et al. | High-level visualisation of parallel logic program execution |
Legal Events
| Date | Code | Title | Description |
|---|---|---|---|
| PUAI | Public reference made under article 153(3) epc to a published international application that has entered the european phase |
Free format text: ORIGINAL CODE: 0009012 |
|
| 17P | Request for examination filed |
Effective date: 19901213 |
|
| AK | Designated contracting states |
Kind code of ref document: A2 Designated state(s): DE FR GB |
|
| PUAL | Search report despatched |
Free format text: ORIGINAL CODE: 0009013 |
|
| AK | Designated contracting states |
Kind code of ref document: A3 Designated state(s): DE FR GB |
|
| 17Q | First examination report despatched |
Effective date: 19950222 |
|
| GRAH | Despatch of communication of intention to grant a patent |
Free format text: ORIGINAL CODE: EPIDOS IGRA |
|
| GRAH | Despatch of communication of intention to grant a patent |
Free format text: ORIGINAL CODE: EPIDOS IGRA |
|
| GRAA | (expected) grant |
Free format text: ORIGINAL CODE: 0009210 |
|
| AK | Designated contracting states |
Kind code of ref document: B1 Designated state(s): DE FR GB |
|
| REF | Corresponds to: |
Ref document number: 69028061 Country of ref document: DE Date of ref document: 19960919 |
|
| ET | Fr: translation filed | ||
| PLBE | No opposition filed within time limit |
Free format text: ORIGINAL CODE: 0009261 |
|
| STAA | Information on the status of an ep patent application or granted ep patent |
Free format text: STATUS: NO OPPOSITION FILED WITHIN TIME LIMIT |
|
| 26N | No opposition filed | ||
| PGFP | Annual fee paid to national office [announced via postgrant information from national office to epo] |
Ref country code: DE Payment date: 19981019 Year of fee payment: 9 |
|
| PG25 | Lapsed in a contracting state [announced via postgrant information from national office to epo] |
Ref country code: DE Free format text: LAPSE BECAUSE OF NON-PAYMENT OF DUE FEES Effective date: 20000801 |
|
| PGFP | Annual fee paid to national office [announced via postgrant information from national office to epo] |
Ref country code: FR Payment date: 20011017 Year of fee payment: 12 |
|
| REG | Reference to a national code |
Ref country code: GB Ref legal event code: IF02 |
|
| PGFP | Annual fee paid to national office [announced via postgrant information from national office to epo] |
Ref country code: GB Payment date: 20021001 Year of fee payment: 13 |
|
| PG25 | Lapsed in a contracting state [announced via postgrant information from national office to epo] |
Ref country code: FR Free format text: LAPSE BECAUSE OF NON-PAYMENT OF DUE FEES Effective date: 20030630 |
|
| REG | Reference to a national code |
Ref country code: FR Ref legal event code: ST |
|
| PG25 | Lapsed in a contracting state [announced via postgrant information from national office to epo] |
Ref country code: GB Free format text: LAPSE BECAUSE OF NON-PAYMENT OF DUE FEES Effective date: 20031011 |
|
| GBPC | Gb: european patent ceased through non-payment of renewal fee |
Effective date: 20031011 |