EP0335729B1 - Verfahren und Anordnung zur Unterstützung des manuellen Einstellens eines Instrumentes bei der Darstellung von Schätzungen von zukünftigen Messergebnissen - Google Patents
Verfahren und Anordnung zur Unterstützung des manuellen Einstellens eines Instrumentes bei der Darstellung von Schätzungen von zukünftigen Messergebnissen Download PDFInfo
- Publication number
- EP0335729B1 EP0335729B1 EP89303193A EP89303193A EP0335729B1 EP 0335729 B1 EP0335729 B1 EP 0335729B1 EP 89303193 A EP89303193 A EP 89303193A EP 89303193 A EP89303193 A EP 89303193A EP 0335729 B1 EP0335729 B1 EP 0335729B1
- Authority
- EP
- European Patent Office
- Prior art keywords
- estimate
- trace
- measurement
- control setting
- display
- Prior art date
- Legal status (The legal status is an assumption and is not a legal conclusion. Google has not performed a legal analysis and makes no representation as to the accuracy of the status listed.)
- Expired - Lifetime
Links
- 238000005259 measurement Methods 0.000 title claims description 94
- 238000000034 method Methods 0.000 title claims description 42
- 238000012360 testing method Methods 0.000 claims description 26
- 238000004091 panning Methods 0.000 claims description 18
- 230000008859 change Effects 0.000 claims description 10
- 239000002243 precursor Substances 0.000 claims description 4
- 238000005070 sampling Methods 0.000 claims description 2
- 230000000994 depressogenic effect Effects 0.000 claims 1
- 238000001228 spectrum Methods 0.000 description 34
- 230000008569 process Effects 0.000 description 16
- 238000010586 diagram Methods 0.000 description 6
- 230000004044 response Effects 0.000 description 5
- 238000012545 processing Methods 0.000 description 3
- CXVGEDCSTKKODG-UHFFFAOYSA-N sulisobenzone Chemical compound C1=C(S(O)(=O)=O)C(OC)=CC(O)=C1C(=O)C1=CC=CC=C1 CXVGEDCSTKKODG-UHFFFAOYSA-N 0.000 description 3
- 238000001514 detection method Methods 0.000 description 2
- 230000006870 function Effects 0.000 description 2
- 238000012986 modification Methods 0.000 description 2
- 230000004048 modification Effects 0.000 description 2
- 238000004891 communication Methods 0.000 description 1
- 230000003111 delayed effect Effects 0.000 description 1
- 230000000881 depressing effect Effects 0.000 description 1
- 230000000694 effects Effects 0.000 description 1
- 230000002708 enhancing effect Effects 0.000 description 1
- 238000000605 extraction Methods 0.000 description 1
- 238000000691 measurement method Methods 0.000 description 1
- 238000002044 microwave spectrum Methods 0.000 description 1
- 230000003287 optical effect Effects 0.000 description 1
- 230000000007 visual effect Effects 0.000 description 1
Images






Classifications
-
- G—PHYSICS
- G01—MEASURING; TESTING
- G01R—MEASURING ELECTRIC VARIABLES; MEASURING MAGNETIC VARIABLES
- G01R23/00—Arrangements for measuring frequencies; Arrangements for analysing frequency spectra
- G01R23/16—Spectrum analysis; Fourier analysis
- G01R23/173—Wobbulating devices similar to swept panoramic receivers
-
- G—PHYSICS
- G01—MEASURING; TESTING
- G01R—MEASURING ELECTRIC VARIABLES; MEASURING MAGNETIC VARIABLES
- G01R15/00—Details of measuring arrangements of the types provided for in groups G01R17/00 - G01R29/00, G01R33/00 - G01R33/26 or G01R35/00
- G01R15/08—Circuits for altering the measuring range
-
- G—PHYSICS
- G01—MEASURING; TESTING
- G01R—MEASURING ELECTRIC VARIABLES; MEASURING MAGNETIC VARIABLES
- G01R27/00—Arrangements for measuring resistance, reactance, impedance, or electric characteristics derived therefrom
- G01R27/28—Measuring attenuation, gain, phase shift or derived characteristics of electric four pole networks, i.e. two-port networks; Measuring transient response
Definitions
- This invention relates to high-frequency electrical test instruments and, more particularly, to test instrumentation operable over a wide range of frequencies of interest.
- the invention is directed to adjustment of manual control settings used in broadband test instruments and provides, in one embodiment, a radio-frequency (RF) and microwave spectrum analyzer whose frequency measurement settings for displaying measured data can be adjusted and in which previously measured data can be recast based on the adjustments and displayed as a precursor or estimate prior to or while a new measurement is being performed, thereby improving user efficiency and enhancing overall measurement throughput.
- RF radio-frequency
- Signal analysis is the extraction of information from an electromagnetic signal, whether performed in the frequency or time domain.
- the most common time domain signal analyzer is the oscilloscope.
- the signal analyzer is the network analyzer or spectrum analyzer. These analyzers typically display the raw, unprocessed signal information, that is, voltage, power, period, waveshape, sidebands, and frequency.
- the spectrum analyzer is widely accepted as a general purpose test instrument capable of performing a broad range of measurements in the frequency domain.
- Examples of such spectrum analyzers are the HP8568 and HP8566 spectrum analyzers and HP71000A Modular Spectrum Analyzer available from Hewlett-Packard Company, Signal Analysis Division, Rohnert Park, California.
- the swept-tuned technique can be either a tuned filter or a heterodyned receiver. Swept spectrum analyzers are used to measure a variety of characteristics of signals. There are many measurements which can be performed with a spectrum analyzer in response to a transmitted or received signal, where measurement of frequency, power, distortion, gain, and noise characterize a transmitter or receiver system.
- Fig. 1 shows a generalized superheterodyne swept-tuned spectrum analyzer.
- An incoming signal mixes with a local oscillator (LO) signal, and when a mixing product equals the intermediate frequency (IF), this signal passes through to a peak detector.
- the peak detector output is amplified to cause a vertical deflection on a CRT display.
- the synchronism between the horizontal frequency axis of the CRT display and the tuning of the local oscillator is provided by a sweep generator which both drives the horizontal CRT deflection and tunes the LO.
- Test instruments with graphic displays such as oscilloscopes, network analyzers, and spectrum analyzers, typically have user controls to adjust the parameters of the measurement being taken.
- the graphic display provides the result of the last measurement taken.
- a control setting by means of a knob or button
- a new measurement is taken and the graphic display is updated to reflect the new measured data.
- An example of this is shown in US-A- 4 244 024.
- a consideration in narrowing resolution bandwidths for better resolution is the time required to sweep through the filters. Since these filters are bandwidth limited, they require a finite time to respond fully. How much time they are given depends upon how far and how fast the spectrum analyzer is tuned, that is, the effective rate of the analyzer is a function of frequency span and sweep time. For a given frequency span, the sweep time is inversely proportional to the square of the IF bandwidth (or the product of the IF and video bandwidths). Many spectrum analyzers have the capability of setting the sweep time automatically based on the span and bandwidth settings.
- the sweep rate is typically variable, and can require considerable time, for example, a minute, to perform a swept measurement.
- changes in control settings are restricted to periods between measurements. For example, in the HP71000A Modular Spectrum Analyzer, requesting a change of the center frequency of the displayed spectrum has previously resulted in a delay for the analyzer to retune and perform another data sweep before displayed data is affected by the adjustment of center frequency.
- Fig. 2 illustrates the traditional method of how present signal analyzers respond to adjustments to measured data. For example, when a control setting of a swept spectrum analyzer is changed, the feedback on the graphic display is delayed until the signal is swept again. Currently available spectrum analyzers either do not address the problem, or they restart the sweep to reduce the delay. It would be highly desirable to enable adjustments in control settings prior to or during a subsequent measurement (sweep) after data from an initial measurement is observed by the user.
- a swept-tuned test instrument comprising: an input for receiving an incoming signal, a swept local oscillator for producing a local oscillator signal, a frequency mixer connected to the input and to the local oscillator for mixing the incoming signal with the local oscillator signal, an IF filter connected to the mixer for passing a mixing product when the frequency of the mixing products equals a predetermined IF, a peak detector connected to the filter to detect the passed signal, a digitiser connected to the peak detector for sampling and storing the detected signal to form trace data, a display device connected to the digitiser and responsive to the trace data to cause a vertical deflection on the display device, a measure control circuit connected to the local oscillator and the display device for driving the horizontal deflection of the display device and for tuning the local oscillator over a measurement range to enable a full set of trace data to be stored for the measurement range, and means connected to the measure control circuit for adjusting a control setting of a measurement parameter for measurement of the incoming
- a method for facilitating adjustment of control settings of a test instrument by displaying an estimate before performing a time consuming measurement comprising the steps of: determining whether or not a user is adjusting a control setting of a measurement parameter; calculating an estimate of how newly measured data will appear, if a new measurement which is subsequently made is in accordance with that particular adjusted said control setting, the estimate being based on the adjusted control setting and previously measured data to the extent that the previously measured data are available in respect of that particular adjustment of said control setting, if the user adjusts a control setting; displaying the estimate as a full or less than full trace across a display device; performing said subsequent new measurement; and displaying the newly measured data as a full trace across the display device with the display updated to incorporate any adjustments in the control settings and fully replacing whatever said previously measured data were displayed as a full trace on the display device prior to display of the estimate and replacing the display of the estimate.
- One embodiment of the present invention provides a method and apparatus for trace panning and spanning or repositioning based on previously measured data. Since human interfaces to computers can respond quickly to provide a user feedback on how an adjustment in a control setting is affecting a measurement, it is helpful to have a test instrument update the display device quickly, even if it is just an approximation. This allows better hand-eye coordination in making adjustments to the control settings of test instruments and allows immediate feedback to the display device independent of analyzer sweep time to speed the measurement process.
- the current data (taken before the change is effected) is manipulated by recalculating the trace data in light of any adjustment that is entered by the user. This represents an estimate of the effect of the adjustment in the control setting, and this estimate is redrawn on the display device. This provides immediate feedback to the user so that adjustments can be effected without slowing the measurement process.
- an old image is modified to reflect an approximation of how a new measurement will appear in light of the change.
- This modified image is preferably displayed before the real new image is ready to be displayed.
- the change is calculated using old measured data to provide an approximation or prediction of how new measured data will appear.
- Various embodiments in accordance with the invention provide panning or repositioning the trace left and right while changing the x-axis center frequency; stretching or compressing the trace (spanning) while changing the frequency span; or using a combination for adjustments to only the start or stop frequency. For example, if a new center frequency is within the currently displayed span, the image can be panned or repositioned by: current_center_freq - new_center_freq span x num_buckets pixels.
- the general concept is to be displaying an approximation of a future measurement while the user is changing measurement settings.
- the time needed to calculate the approximation is typically quicker than taking a real measurement.
- the estimate can be displayed only after the user has committed to having a new measurement performed.
- estimates can be displayed continuously while the user is making adjustments and before the user has committed to performing a new measurement.
- Having a test instrument display to the user an estimate of a future measurement while adjusting the control settings of the instrument in order to aid knob and button settings facilitates making adjustments visually during measurements which take longer than a fraction of a second. Often a spectrum analyzer takes many seconds to complete a sweep. By having an immediate response on the display device, the user is not required to make blind changes.
- the invention will be described in connection with a superheterodyne swept-tuned spectrum analyzer, because such an analyzer provides wide input frequency coverage while permitting signal processing to be performed at a single intermediate frequency (IF).
- IF intermediate frequency
- Fig. 3 shows a superheterodyne swept-tuned spectrum analyzer, generally indicated by the numeral 10, in accordance with the invention, which incorporates adjustment of control settings and display of revised trace data in light of the adjustments as a precursor to future measurements.
- An incoming signal appears at an RF input 12. This signal mixes in a frequency mixer 14 with a signal produced by a swept local oscillator (LO) 16.
- LO swept local oscillator
- this signal passes through an IF filter 18 to a peak detector 20.
- the peak detector output is fed to a digitizer 22 which samples and stores the detected input signal data.
- This trace data can be amplified to cause a vertical deflection on a graphic display device or CRT display 24.
- the synchronism between the horizontal frequency axis of the display device 24 and the tuning of the local oscillator 16 is provided by a sweep generator incorporated in a measure control circuit 26, which both drives the horizontal deflection of the display device 24 and tunes the local oscillator.
- the analyzer 10 displays an approximation of a future measurement while the user is adjusting control settings by turning a knob or depressing a button 28 incorporated into the analyzer. This yields a test instrument which provides the user an estimate of a new measurement in order to aid knob or button control settings.
- control settings can also preferably be remotely adjusted via an interface 30.
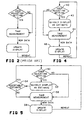
- Fig. 4 shows the addition of displaying a quick estimate before performing a time consuming measurement.
- an estimate is displayed only after the user commits to having a new measurement performed.
- the analyzer 10 determines whether or not the user is adjusting control settings by means of the knob or button 28, as indicated by the numeral 40. If the user adjusts a control setting, as determined by the step 40, the analyzer 10 calculates how measured data might appear based on the new control settings and previously measured data, and the result is displayed as an estimate on the display device 24, as indicated by the numeral 42. After the estimate is displayed, as indicated by the step 42, or if no adjustment is made, as determined by the step 40, a new measurement is performed by the analyzer 10, as indicated by the numeral 44. The newly measured data is then displayed on the display device 24 with the display updated to incorporate any adjustments in the control settings, as indicated by the numeral 46. This process is then repeated for each subsequent measurement.
- FIG. 5 shows holding up the measurement until either the user has stopped changing parameters or an acceptable estimate cannot be accomplished from the last measured data.
- an estimate is continuously displayed while the user is making adjustments and before the user has committed to performing a new measurement.
- the analyzer 10 initially determines whether or not the user is adjusting control settings by means of the knob or button 28, as indicated by the numeral 50. If the user adjusts a control setting, as determined by the step 50, the analyzer 10 calculates how measured data might appear based on the new control settings and previously measured data, and the result is displayed as an estimate on the display device 24, as indicated by the numeral 52. After the estimate is calculated, as indicated by the step 52, the analyzer 10 checks whether or not the adjustment produces a result within a predetermined range of previously measured data, as indicated by the numeral 54. For example, trace scaling can limit a sweep when the frequency span is less than 1/10 or greater than 10 times the magnitude of the change.
- a new measurement is performed by the analyzer 10, as indicated by the numeral 56. If the estimate exceeds limits, as determined by the step 54, a new measurement is performed by the analyzer 10, as indicated by the step 56.
- the newly measured data is then displayed on the display device 24 with the display updated to incorporate any adjustments in the control settings, as indicated by the numeral 58. This process is then repeated for each subsequent measurement.
- Examples are panning the trace left and right while changing the x-axis center frequency; stretching or compressing the trace (spanning) while changing the frequency span; or using a combination for adjustments to only the start or stop frequency.
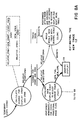
- Fig. 3 is the highest level drawing. This level shows all external input/output.
- the "bubble” labelled “1" in Fig. 3 is shown “exploded” in Fig. 6.
- the bubbles labelled "1.1” and “1.2” in Fig. 6 are shown exploded in Figs. 7 and 8, respectively.
- These data flow diagrams illustrate operation of the analyzer 10 to provide estimates of future measurements based on old measured data in response to adjustments of control settings.
- the firmware which controls the HP71000A Modular Spectrum Analyzer can be modified to incorporate panning and spanning to aid user adjustments of test instrument control settings. While making measurement adjustments, the user is presented with an approximation of how the new measurement results will appear. This is accomplished quickly enough to provide the user immediate and reliable feedback on the adjustments.
- the HP71000A Modular Spectrum Analyzer includes a graphical display, such as an HP70205A Graphic Display, that displays frequency on the horizontal axis and power on the vertical axis. This display includes a command to pan any displayed item along the x-axis.
- the display language particulars, along with the techniques previously used to send trace data from the HP71000A Modular Spectrum Analyzer to this display, requires synchronization of the pen placement to avoid spurious marks on the screen, as will be described in more detail later.
- HP71000A Modular Spectrum Analyzer involves adjustments to the center frequency of the display. The earlier this is accomplished, the better the feedback to the user. For convenience, in the HP71000A Modular Spectrum Analyzer, this is performed as the first part of a set_cf subroutine. This subroutine performs other functions, such as calculating and setting a new start frequency for the sweep, recording the change, and updating the digital readouts on the display.
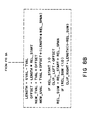
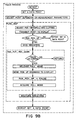
- FIG. 9 illustrates panning and spanning in terms of the source code specific to the HP71000A Modular Spectrum Analyzer.
- the firmware controlling the HP71000A Modular Spectrum Analyzer is written in HP Pascal and Motorola 68000 Assembly Language.
- the Pascal source is compiled (translated) into Motorola 68000 Assembly Language.
- the parsing processes execute the subroutine set_cf when the center frequency of the analyzer is adjusted. Adjusting the center frequency changes the measurement to analyze a different portion of the frequency spectrum, thus changing what is displayed. If the change on the screen is small enough to appear to accommodate repositioning, then trace panning is enabled.
- the set center frequency panning subroutine (set_cf) is called, for example, by. an exec_cf routine.
- the code executed when the user requests a center frequency adjustment in the case of the method for facilitating adjustment of control settings shown in Fig. 4 is as follows.
- the set_cf subroutine is coded in Pascal as:
- the pan_trace subroutine calculates whether or not the current trace on the display screen can be panned or repositioned to bring it in line with the new center frequency request. If so, it then calculates how much the trace must be relocated and instructs the display to do the panning.
- the HP70205A Graphic Display draws lines by connecting points. This display draws a line from the previous point to the current point. When drawing traces, amplitude values are sent, and the display supplies the correct horizontal coordinate and connects a line from the previous amplitude value to the current amplitude value. If a trace is panned such that the next amplitude point sent to the display now follows a point which previously was off the display screen, a line is drawn from amplitude zero to the new amplitude. This causes an unwanted "glitch" in the display.
- the unwanted glitch is removed by raising the pen off the display screen until after the first amplitude point is plotted following a pan. This removes the glitch. Unfortunately, the next point is also not drawn. But, the pen is set down on the display screen, and a line is drawn from this previous "undrawn" point to the new point. Since this line comes from the undrawn point, it is insignificant that the point itself is not visible.
- pan_pen_up is used to inform the trace process that a pan has taken place so it can handle the pen correctly.
- pan_trace subroutine is coded in Pascal as:
- a similar code is executed when the user requests panning the trace left and right while changing the x-axis center frequency; stretching or compressing the trace (spanning) while changing the frequency span; or using a combination for adjustments to only the start or stop frequency in the case of the modified method for facilitating adjustment of control settings shown in Fig. 5.
- the trace process handles sending trace data to the display as it is being processed. This is written primarily in Motorola 68000 Assembly Language due to the high speed desired in processing an enormous quantity of data on a continuous basis. This code is rather complex and most of it has nothing to do with trace panning. The following list describes the area which installing trace panning affected in the HP71000A Modular Spectrum Analyzer firmware:
- Fig. 10 illustrates three examples, showing how the display screen appears at critical times during adjustments and measurements.
- Fig. 10A in the top left hand corner shows a display for the analyzer based on an arbitrary original setting for each of the three examples.
- the middle column shows the intermediate estimates which are performed very quickly as the user adjusts the control settings.
- Fig. 10B shows an estimate based on adjustment of the center frequency to a higher center frequency.
- Fig. 10D shows an estimate based on adjustment of the frequency span to a broader frequency range.
- Fig. 10F shows an estimate based on adjustment of the stop. frequency. Note that in the traditional measurement method, these estimates do not occur, and the display screen is left showing the original setting until a new measurement has been performed.
- Figs. 10C, 10E, and 10G in the right hand column show the results of the final measurements following the adjustments which produced the estimates shown in Figs. 10B, 10D, and 10F, respectively.
- the rows of images show the results of three different adjustments that can be made by the user.
- the top row (Figs. 10A, 10B, and 10C) shows the user changing the center frequency.
- the estimate shown in Fig. 10B is calculated by panning the old image in the appropriate direction the appropriate distance.
- the gap on the right hand side in Fig. 10B is due to the lack of data from the previous measurement.
- the second row (Figs. 10A, 10D, and 10E) shows the user setting a wider frequency span.
- the estimate shown in Fig. 10D is calculated by reducing the image horizontally. Again the gaps are caused by the lack of data from the previous measurement.
- Figs. 10A, 10F, and 10G shows the user setting a lower right hand side frequency, the stop frequency.
- the estimate shown in Fig. 10F is calculated by expanding the image. The wide spacing between the points is again due to the lack of data from the previous measurement.
Landscapes
- Physics & Mathematics (AREA)
- General Physics & Mathematics (AREA)
- Mathematical Physics (AREA)
- Measurement Of Resistance Or Impedance (AREA)
- Controls And Circuits For Display Device (AREA)
- User Interface Of Digital Computer (AREA)
Claims (14)
- Ein gewobbeltes abgestimmtes Testgerät (10), das folgende Merkmale umfaßt:einen Eingang (12) zum Empfangen eines ankommenden Signals (RF);einen gewobbelten Lokaloszillator (16) zum Erzeugen eines Lokaloszillatorsignals (LO);einen Frequenzmischer (14), der mit dem Eingang (12) und dem lokalen Oszillator (16) verbunden ist, zum Mischen des ankommenden Signals (RF) mit dem Lokaloszillatorsignal (LO);ein HF-Filter (18), das mit dem Mischer (14) verbunden ist, zum Durchlassen eines Mischprodukts (MISCHERPRODUKTE), wenn die Frequenz der Mischprodukte (MISCHERPRODUKTE) gleich einer vorbestimmten Zwischenfrequenz ist;einen Spitzendetektor (20), der mit dem Filter (18) verbunden ist, um das durchgelassene Signal (IF) zu erfassen;einen Digitalisierer (22), der mit dem Spitzendetektor (20) verbunden ist, zum Abtasten und Speichern des erfaßten Signals (VIDEO), um Spurdaten zu bilden;eine Anzeigevorrichtung (24), die mit dem Digitalisierer (22) verbunden ist und auf die Spurdaten anspricht, um eine vertikale Ablenkung auf der Anzeigevorrichtung (24) zu bewirken;eine Meßsteuerschaltung (26), die mit dem Lokaloszillator (16) und der Anzeigevorrichtung (24) verbunden ist, zum Treiben der horizontalen Ablenkung der Anzeigevorrichtung (24) und zum Abstimmen des Lokaloszillators (16) über einen Meßbereich, um zu ermöglichen, daß ein vollständiger Satz von Spurdaten für den Meßbereich gespeichert wird; undeine Einrichtung (28, 30), die mit der Meßsteuerschaltung (26) verbunden ist, zum Einstellen einer Steuereinstellung eines Meßparameters für die Messung des ankommenden Signals (RF), die dadurch gekennzeichnet ist, daßdie Meßsteuerschaltung (26) auf die Einstellung der Steuereinstellung eines Meßparameters durch die Einrichtung (28, 30) zum Einstellen der Steuereinstellung (ZUSTANDSÄNDERUNGEN) für eine neue Messung, die durchgeführt werden soll, und auf die gespeicherten Spurdaten (DATEN FÜR SCHÄTZUNG) von einer vorher durchgeführten Messung anspricht, um eine Annäherung der neuen Messung (SPURSCHÄTZUNG), die die Einstellung der Steuereinstellung umfaßt, zu berechnen und zu bewirken, daß die Anzeigevorrichtung (24) überarbeitete Spurdaten anzeigt, die bezüglich der Einstellung als eine Vorstufe zu der neuen Messung verarbeitet werden, wobei die überarbeiteten Spurdaten eine vollständige oder weniger als vollständige Anzeige über die Anzeigevorrichtung (24) bis zu dem Ausmaß, daß die gespeicherten Spurdaten (DATEN FÜR SCHÄTZUNG) bezüglich der speziellen Einstellung der Steuereinstellung verfügbar sind, liefern, unddie Meßsteuerschaltung (26) ermöglicht, daß ein vollständiger Satz von Spurdaten ansprechend auf einen vollständigen Bereich einer neuen Messung gemäß einer eingestellten Steuereinstellung gespeichert und als ein vollständiger Ersatz jedweder Daten angezeigt wird, die als eine vollständige Spur von der vorhergehenden Messung angezeigt wurden, vor der Anzeige der überarbeiteten Spurdaten gemäß der berechneten Annäherung, und als ein Ersatz der angezeigten überarbeiteten Spurdaten.
- Das Testgerät (10) gemäß Anspruch 1, das ferner einen Verstärker (VIDEOVERSTÄRKER) zum Verstärken der Spurdaten umfaßt, der zwischen den Digitalisierer (22) und die Anzeigevorrichtung (24) geschaltet ist, um eine vertikale Ablenkung auf der Anzeigevorrichtung (24) zu bewirken.
- Das Testgerät (10) gemäß Anspruch 1, bei dem die Anzeigevorrichtung (24) eine Kathodenstrahlröhrenanzeige ist.
- Das Testgerät (10) gemäß Anspruch 2, bei dem die Anzeigevorrichtung (24) eine Kathodenstrahlröhrenanzeige ist.
- Das Testgerät (10) gemäß Anspruch 1, bei dem die Einrichtung (28, 30) zum Einstellen einer Steuereinstellung ein Knopf (28) ist, der durch einen Benutzer gedreht werden kann.
- Das Testgerät (10) gemäß Anspruch 1, bei dem die Einrichtung (28, 30) zum Einstellen einer Steuereinstellung ein Knopf (28) ist, der durch einen Benutzer gedrückt werden kann.
- Das Testgerät (10) gemäß Anspruch 1, bei dem die Einrichtung (28, 30) zum Einstellen einer Steuereinstellung eine Schnittstelle (30) zum entfernten Einstellen der Steuereinstellungen ist.
- Ein Verfahren (Fig. 4, Fig. 5) zum Erleichtern der Einstellung von Steuereinstellungen eines Testgeräts (10) durch Anzeigen einer Schätzung, bevor eine zeitraubende Messung durchgeführt wird, wobei das Verfahren folgende Schritte umfaßt:Bestimmen (40, 50), ob ein Benutzer eine Steuereinstellung eines Meßparameters einstellt oder nicht;Berechnen einer Schätzung darüber, wie neu gemessene Daten erscheinen werden, falls eine neue Messung, die nachfolgend durchgeführt wird, gemäß dieser speziellen, eingestellten Steuereinstellung durchgeführt wird, wobei die Schätzung auf der eingestellten Steuereinstellung und vorher gemessenen Daten zu dem Ausmaß, da die vorher gemessenen Daten bezüglich dieser speziellen Einstellung der Steuereinstellung verfügbar sind, basiert, falls der Benutzer eine Steuereinstellung einstellt;Anzeigen (42, 52) der Schätzung als eine vollständige oder weniger als vollständige Spur über eine Anzeigevorrichtung (24);Durchführen (44, 56) der nachfolgenden neuen Messung; undAnzeigen (46, 58) der neu gemessenen Daten als eine vollständige Spur über die Anzeigevorrichtung (24), wobei die Anzeige aktualisiert wird, um alle Einstellungen bei den Steuereinstellungen zu umfassen, und vollständiges Ersetzen der vorher gemessenen Daten, die vor der Anzeige der Schätzung als vollständige Spur auf der Anzeigevorrichtung angezeigt wurden, und Ersetzen der Anzeige der Schätzung.
- Das Verfahren gemäß Anspruch 8, bei dem (Fig. 4):die nachfolgende neue Messung durchgeführt wird (44), nachdem die Schätzung angezeigt wird, oder falls durch den Benutzer keine Einstellung durchgeführt wird;wodurch eine Schätzung nur angezeigt wird, nachdem sich der Benutzer dafür entschieden hat, daß eine neue Messung durchgeführt werden soll.
- Das Verfahren gemäß Anspruch 8, das ferner (Fig. 5) folgende Schritte umfaßt:Prüfen (54), ob die angezeigte Schätzung eine annehmbare Schätzung ist, die innerhalb eines vorbestimmten Bereichs von vorher gemessenen Daten erzeugt wird, oder nicht; underneutes Bestimmen (50), falls die angezeigte Schätzung eine annehmbare Schätzung ist, ob ein Benutzer eine Steuereinstellung eines Meßparameters weiter einstellt oder nicht;wobei die nachfolgende neue Messung durchgeführt wird (56), falls keine Einstellung durchgeführt wird, oder falls die Schätzung keine annehmbare Schätzung ist;wodurch die neue Messung aufrechterhalten wird, bis entweder der Benutzer aufgehört hat, Parameter zu ändern, oder von den vorher gemessenen Daten keine annehmbare Schätzung erreicht werden kann.
- Das Verfahren gemäß Anspruch 8, 9 oder 10, bei dem der Benutzer eine Mittenfrequenzsteuereinstellung einstellt, um einen Schwenk der Spur links und rechts zu bewirken, während die x-Achsen-Mittenfrequenz geändert wird.
- Das Verfahren gemäß Anspruch 8, 9 oder 10, bei dem der Benutzer eine Frequenzspannesteuereinstellung einstellt, um das Ausdehnen oder Komprimieren der Spur zu bewirken, während die Frequenzspanne geändert wird.
- Das Verfahren gemäß Anspruch 8, 9 oder 10, bei dem der Benutzer eine Start- und Stoppfrequenzsteuereinstellung unter Verwendung einer Kombination für Einstellungen für die Start- oder Stoppfrequenz einstellt.
- Das Verfahren gemäß Anspruch 11, bei dem das Einstellen der Mittenfrequenzsteuereinstellung folgende Schritte umfaßt:1) falls die neue angeforderte Mittenfrequenz bereits irgendwo auf der Anzeigevorrichtung (24) angezeigt ist, in anderen Worten, falls dieselbe innerhalb der aktuellen Frequenzspanne liegt, Fortschreiten mit Spurschwenken, da einige alte, gemessene Daten, nämlich die letzte Spur, verfügbar sind, um die Erscheinung der nachfolgenden neuen Messung zu schätzen;2) Berechnen, um wieviel das Bild horizontal neu positioniert werden muß, durch Berechnen von:3) Multiplizieren des obigen Bruchs mit einer Konstante (num_buckets), die sich auf die Anzahl von verfügbaren Anzeigepunkten bezieht, um die Änderung in Bildschirmkoordinaten zu übersetzen; und4) Anzeigen des alten Bildes, das um das obige Ergebnis versetzt ist.
Applications Claiming Priority (2)
| Application Number | Priority Date | Filing Date | Title |
|---|---|---|---|
| US07/176,472 US4890236A (en) | 1988-04-01 | 1988-04-01 | Method and apparatus for aiding manual instrument settings by displaying estimates of future measurement results |
| US176472 | 1988-04-01 |
Publications (3)
| Publication Number | Publication Date |
|---|---|
| EP0335729A2 EP0335729A2 (de) | 1989-10-04 |
| EP0335729A3 EP0335729A3 (de) | 1991-04-10 |
| EP0335729B1 true EP0335729B1 (de) | 2003-02-05 |
Family
ID=22644495
Family Applications (1)
| Application Number | Title | Priority Date | Filing Date |
|---|---|---|---|
| EP89303193A Expired - Lifetime EP0335729B1 (de) | 1988-04-01 | 1989-03-31 | Verfahren und Anordnung zur Unterstützung des manuellen Einstellens eines Instrumentes bei der Darstellung von Schätzungen von zukünftigen Messergebnissen |
Country Status (4)
| Country | Link |
|---|---|
| US (1) | US4890236A (de) |
| EP (1) | EP0335729B1 (de) |
| JP (1) | JP2807709B2 (de) |
| DE (1) | DE68929454T2 (de) |
Families Citing this family (5)
| Publication number | Priority date | Publication date | Assignee | Title |
|---|---|---|---|---|
| JP2891497B2 (ja) * | 1990-01-25 | 1999-05-17 | アンリツ株式会社 | スペクトラムアナライザ |
| US5542039A (en) * | 1993-03-05 | 1996-07-30 | International Business Machines Corporation | Control for scaled parameters |
| JP2002014124A (ja) * | 2000-06-29 | 2002-01-18 | Ando Electric Co Ltd | 掃引同調試験装置及びその最適制御設定値シミュレーション方法。 |
| CN103487653B (zh) * | 2013-09-18 | 2015-09-23 | 中国电子科技集团公司第四十一研究所 | 一种用于实时频谱轨迹处理的装置及方法 |
| CN105445687B (zh) * | 2015-10-27 | 2019-01-18 | 中国电子科技集团公司第四十一研究所 | 一种频谱分析仪实时性能评价系统及评价方法 |
Family Cites Families (6)
| Publication number | Priority date | Publication date | Assignee | Title |
|---|---|---|---|---|
| US4118666A (en) * | 1977-03-04 | 1978-10-03 | The United States Of America As Represented By The Administrator Of The National Aeronautics And Space Administration | Automatic communication signal monitoring system |
| US4244024A (en) * | 1978-08-10 | 1981-01-06 | Hewlett-Packard Company | Spectrum analyzer having enterable offsets and automatic display zoom |
| US4476462A (en) * | 1981-11-16 | 1984-10-09 | The United States Of America As Represented By The Department Of Health And Human Services | Use of context to simplify two-dimensional computer input |
| US4764915A (en) * | 1982-01-12 | 1988-08-16 | Discovision Associates | Method and apparatus for recording a multiplexed signal on a record medium |
| JPS59157574A (ja) * | 1983-02-27 | 1984-09-06 | Anritsu Corp | スペクトラムアナライザ |
| US4652816A (en) * | 1984-12-07 | 1987-03-24 | Hughes Aircraft Company | Calibrated radio frequency analog spectrum analyzer |
-
1988
- 1988-04-01 US US07/176,472 patent/US4890236A/en not_active Expired - Lifetime
-
1989
- 1989-03-31 DE DE68929454T patent/DE68929454T2/de not_active Expired - Fee Related
- 1989-03-31 JP JP1083862A patent/JP2807709B2/ja not_active Expired - Fee Related
- 1989-03-31 EP EP89303193A patent/EP0335729B1/de not_active Expired - Lifetime
Also Published As
| Publication number | Publication date |
|---|---|
| DE68929454D1 (de) | 2003-03-13 |
| US4890236A (en) | 1989-12-26 |
| JPH01311287A (ja) | 1989-12-15 |
| JP2807709B2 (ja) | 1998-10-08 |
| DE68929454T2 (de) | 2003-12-04 |
| EP0335729A3 (de) | 1991-04-10 |
| EP0335729A2 (de) | 1989-10-04 |
Similar Documents
| Publication | Publication Date | Title |
|---|---|---|
| KR100536931B1 (ko) | 측정 습득 및 표시 장치 | |
| EP0701138B1 (de) | Signalanalyseverfahren mit Hilfe von Histogrammen | |
| US4257104A (en) | Apparatus for spectrum analysis of an electrical signal | |
| WO2008062875A1 (en) | Signal analyzer and its data generation method | |
| JPH0236364A (ja) | マーカ表示方法及び装置 | |
| US4264958A (en) | Video processor for a spectrum analyzer | |
| JPS63212874A (ja) | ベクトルアナライザ | |
| US4890236A (en) | Method and apparatus for aiding manual instrument settings by displaying estimates of future measurement results | |
| US5072168A (en) | Automatic scaling for display of modulation domain measurements | |
| CN110007991B (zh) | 一种基于pxi平台软件无线电分布式同步数据采集方法 | |
| US7916926B2 (en) | Semiconductor inspection apparatus | |
| US6798444B2 (en) | Television-set adjusting system | |
| US8860400B2 (en) | Systems and methods for providing signal analysis data | |
| JPH07209352A (ja) | スペクトラム・アナライザ | |
| Arthur et al. | ROSE: A high performance oblique ionosonde providing new opportunities for ionospheric research | |
| JP2001223666A (ja) | Ofdm波の遅延プロファイル測定装置 | |
| JPH1020020A (ja) | 高周波信号の遅延装置、電波高度計の地上試験装置 | |
| US6646428B2 (en) | Sweep synchronization testing | |
| EP0150409A1 (de) | Bedienungsfeld für einen RF-(Radiofrequenz)-Netzwerk-Analysator | |
| KR20010045464A (ko) | 스펙트럼 분석장치 및 방법 | |
| JP2001281277A (ja) | 信号分析装置 | |
| Arthur et al. | ROSE-300: a flexible architecture for a high performance oblique ionosonde | |
| CA1192955A (en) | Spectrum analyser especially for teaching purposes | |
| JPH04236506A (ja) | 誘電体共振器を用いたバンドパスフィルタ特性評価装置 | |
| JPH0771048B2 (ja) | 周波数シフト量測定方法およびその装置並びに受信装置 |
Legal Events
| Date | Code | Title | Description |
|---|---|---|---|
| PUAI | Public reference made under article 153(3) epc to a published international application that has entered the european phase |
Free format text: ORIGINAL CODE: 0009012 |
|
| AK | Designated contracting states |
Kind code of ref document: A2 Designated state(s): DE FR GB |
|
| RHK1 | Main classification (correction) |
Ipc: G01R 23/16 |
|
| PUAL | Search report despatched |
Free format text: ORIGINAL CODE: 0009013 |
|
| AK | Designated contracting states |
Kind code of ref document: A3 Designated state(s): DE FR GB |
|
| 17P | Request for examination filed |
Effective date: 19910930 |
|
| 17Q | First examination report despatched |
Effective date: 19921130 |
|
| APAB | Appeal dossier modified |
Free format text: ORIGINAL CODE: EPIDOS NOAPE |
|
| APAD | Appeal reference recorded |
Free format text: ORIGINAL CODE: EPIDOS REFNE |
|
| APCB | Communication from the board of appeal sent |
Free format text: ORIGINAL CODE: EPIDOS OBAPE |
|
| APCB | Communication from the board of appeal sent |
Free format text: ORIGINAL CODE: EPIDOS OBAPE |
|
| APAB | Appeal dossier modified |
Free format text: ORIGINAL CODE: EPIDOS NOAPE |
|
| RAP1 | Party data changed (applicant data changed or rights of an application transferred) |
Owner name: HEWLETT-PACKARD COMPANY, A DELAWARE CORPORATION |
|
| RAP1 | Party data changed (applicant data changed or rights of an application transferred) |
Owner name: AGILENT TECHNOLOGIES, INC. |
|
| RAP1 | Party data changed (applicant data changed or rights of an application transferred) |
Owner name: AGILENT TECHNOLOGIES INC. |
|
| RTI1 | Title (correction) |
Free format text: METHOD AND APPARATUS FOR AIDING MANUAL INSTRUMENT SETTINGS OF AN INSTRUMENT BY DISPLAYING ESTIMATES OF FUTURE MEASUREMENT RESULTS |
|
| RAP1 | Party data changed (applicant data changed or rights of an application transferred) |
Owner name: AGILENT TECHNOLOGIES INC. A DELAWARE CORPORATION |
|
| RAP1 | Party data changed (applicant data changed or rights of an application transferred) |
Owner name: AGILENT TECHNOLOGIES, INC. (A DELAWARE CORPORATION |
|
| RTI1 | Title (correction) |
Free format text: METHOD AND APPARATUS FOR AIDING MANUAL INSTRUMENT SETTINGS OF AN INSTRUMENT BY DISPLAYING ESTIMATES OF FUTURE MEASUREMENT RESULTS |
|
| RTI1 | Title (correction) |
Free format text: METHOD AND APPARATUS FOR AIDING MANUAL INSTRUMENT SETTINGS OF AN INSTRUMENT BY DISPLAYING ESTIMATES OF FUTURE MEASUREMENT RESULTS |
|
| GRAG | Despatch of communication of intention to grant |
Free format text: ORIGINAL CODE: EPIDOS AGRA |
|
| GRAG | Despatch of communication of intention to grant |
Free format text: ORIGINAL CODE: EPIDOS AGRA |
|
| GRAH | Despatch of communication of intention to grant a patent |
Free format text: ORIGINAL CODE: EPIDOS IGRA |
|
| GRAH | Despatch of communication of intention to grant a patent |
Free format text: ORIGINAL CODE: EPIDOS IGRA |
|
| GRAA | (expected) grant |
Free format text: ORIGINAL CODE: 0009210 |
|
| AK | Designated contracting states |
Designated state(s): DE FR GB |
|
| REG | Reference to a national code |
Ref country code: GB Ref legal event code: FG4D |
|
| REF | Corresponds to: |
Ref document number: 68929454 Country of ref document: DE Date of ref document: 20030313 Kind code of ref document: P |
|
| ET | Fr: translation filed | ||
| PLBE | No opposition filed within time limit |
Free format text: ORIGINAL CODE: 0009261 |
|
| STAA | Information on the status of an ep patent application or granted ep patent |
Free format text: STATUS: NO OPPOSITION FILED WITHIN TIME LIMIT |
|
| 26N | No opposition filed |
Effective date: 20031106 |
|
| PGFP | Annual fee paid to national office [announced via postgrant information from national office to epo] |
Ref country code: FR Payment date: 20040318 Year of fee payment: 16 |
|
| APAH | Appeal reference modified |
Free format text: ORIGINAL CODE: EPIDOSCREFNO |
|
| PG25 | Lapsed in a contracting state [announced via postgrant information from national office to epo] |
Ref country code: FR Free format text: LAPSE BECAUSE OF NON-PAYMENT OF DUE FEES Effective date: 20051130 |
|
| REG | Reference to a national code |
Ref country code: FR Ref legal event code: ST Effective date: 20051130 |
|
| PGFP | Annual fee paid to national office [announced via postgrant information from national office to epo] |
Ref country code: GB Payment date: 20060329 Year of fee payment: 18 |
|
| PGFP | Annual fee paid to national office [announced via postgrant information from national office to epo] |
Ref country code: DE Payment date: 20060502 Year of fee payment: 18 |
|
| GBPC | Gb: european patent ceased through non-payment of renewal fee |
Effective date: 20070331 |
|
| PG25 | Lapsed in a contracting state [announced via postgrant information from national office to epo] |
Ref country code: DE Free format text: LAPSE BECAUSE OF NON-PAYMENT OF DUE FEES Effective date: 20071002 |
|
| PG25 | Lapsed in a contracting state [announced via postgrant information from national office to epo] |
Ref country code: GB Free format text: LAPSE BECAUSE OF NON-PAYMENT OF DUE FEES Effective date: 20070331 |