WO2024262007A1 - 車両の劣化予測システム及び車両の劣化予測方法 - Google Patents
車両の劣化予測システム及び車両の劣化予測方法 Download PDFInfo
- Publication number
- WO2024262007A1 WO2024262007A1 PCT/JP2023/023333 JP2023023333W WO2024262007A1 WO 2024262007 A1 WO2024262007 A1 WO 2024262007A1 JP 2023023333 W JP2023023333 W JP 2023023333W WO 2024262007 A1 WO2024262007 A1 WO 2024262007A1
- Authority
- WO
- WIPO (PCT)
- Prior art keywords
- vehicle
- deterioration prediction
- information
- vehicles
- unit
- Prior art date
- Legal status (The legal status is an assumption and is not a legal conclusion. Google has not performed a legal analysis and makes no representation as to the accuracy of the status listed.)
- Ceased
Links
Images


Classifications
-
- G—PHYSICS
- G01—MEASURING; TESTING
- G01M—TESTING STATIC OR DYNAMIC BALANCE OF MACHINES OR STRUCTURES; TESTING OF STRUCTURES OR APPARATUS, NOT OTHERWISE PROVIDED FOR
- G01M17/00—Testing of vehicles
- G01M17/007—Wheeled or endless-tracked vehicles
-
- G—PHYSICS
- G06—COMPUTING OR CALCULATING; COUNTING
- G06Q—INFORMATION AND COMMUNICATION TECHNOLOGY [ICT] SPECIALLY ADAPTED FOR ADMINISTRATIVE, COMMERCIAL, FINANCIAL, MANAGERIAL OR SUPERVISORY PURPOSES; SYSTEMS OR METHODS SPECIALLY ADAPTED FOR ADMINISTRATIVE, COMMERCIAL, FINANCIAL, MANAGERIAL OR SUPERVISORY PURPOSES, NOT OTHERWISE PROVIDED FOR
- G06Q10/00—Administration; Management
- G06Q10/06—Resources, workflows, human or project management; Enterprise or organisation planning; Enterprise or organisation modelling
- G06Q10/063—Operations research, analysis or management
- G06Q10/0639—Performance analysis of employees; Performance analysis of enterprise or organisation operations
- G06Q10/06395—Quality analysis or management
-
- G—PHYSICS
- G06—COMPUTING OR CALCULATING; COUNTING
- G06Q—INFORMATION AND COMMUNICATION TECHNOLOGY [ICT] SPECIALLY ADAPTED FOR ADMINISTRATIVE, COMMERCIAL, FINANCIAL, MANAGERIAL OR SUPERVISORY PURPOSES; SYSTEMS OR METHODS SPECIALLY ADAPTED FOR ADMINISTRATIVE, COMMERCIAL, FINANCIAL, MANAGERIAL OR SUPERVISORY PURPOSES, NOT OTHERWISE PROVIDED FOR
- G06Q10/00—Administration; Management
- G06Q10/20—Administration of product repair or maintenance
-
- G—PHYSICS
- G06—COMPUTING OR CALCULATING; COUNTING
- G06Q—INFORMATION AND COMMUNICATION TECHNOLOGY [ICT] SPECIALLY ADAPTED FOR ADMINISTRATIVE, COMMERCIAL, FINANCIAL, MANAGERIAL OR SUPERVISORY PURPOSES; SYSTEMS OR METHODS SPECIALLY ADAPTED FOR ADMINISTRATIVE, COMMERCIAL, FINANCIAL, MANAGERIAL OR SUPERVISORY PURPOSES, NOT OTHERWISE PROVIDED FOR
- G06Q30/00—Commerce
- G06Q30/01—Customer relationship services
- G06Q30/012—Providing warranty services
-
- G—PHYSICS
- G06—COMPUTING OR CALCULATING; COUNTING
- G06Q—INFORMATION AND COMMUNICATION TECHNOLOGY [ICT] SPECIALLY ADAPTED FOR ADMINISTRATIVE, COMMERCIAL, FINANCIAL, MANAGERIAL OR SUPERVISORY PURPOSES; SYSTEMS OR METHODS SPECIALLY ADAPTED FOR ADMINISTRATIVE, COMMERCIAL, FINANCIAL, MANAGERIAL OR SUPERVISORY PURPOSES, NOT OTHERWISE PROVIDED FOR
- G06Q30/00—Commerce
- G06Q30/01—Customer relationship services
- G06Q30/014—Providing recall services for goods or products
-
- G—PHYSICS
- G06—COMPUTING OR CALCULATING; COUNTING
- G06Q—INFORMATION AND COMMUNICATION TECHNOLOGY [ICT] SPECIALLY ADAPTED FOR ADMINISTRATIVE, COMMERCIAL, FINANCIAL, MANAGERIAL OR SUPERVISORY PURPOSES; SYSTEMS OR METHODS SPECIALLY ADAPTED FOR ADMINISTRATIVE, COMMERCIAL, FINANCIAL, MANAGERIAL OR SUPERVISORY PURPOSES, NOT OTHERWISE PROVIDED FOR
- G06Q50/00—Information and communication technology [ICT] specially adapted for implementation of business processes of specific business sectors, e.g. utilities or tourism
- G06Q50/40—Business processes related to the transportation industry
Definitions
- the present invention relates to a vehicle deterioration prediction system and a vehicle deterioration prediction method.
- the way a vehicle is used varies from user to user, and the mileage before a breakdown also varies from vehicle to vehicle, making it difficult to know the likelihood of a breakdown for each individual vehicle.
- the mileage before a breakdown also varies from vehicle to vehicle, making it difficult to know the likelihood of a breakdown for each individual vehicle.
- replacement after a certain mileage is recommended, but in the case of on-board devices such as electronic components, replacement is generally only performed after they break down, making it difficult to predict breakdowns in advance.
- Patent Document 1 describes a technology that collects data on the driving conditions of vehicles, groups them, and when a vehicle malfunction occurs, extracts vehicles that belong to the same group as the malfunctioning vehicle as vehicles that are showing signs of a malfunction.
- vehicles are grouped based on data regarding the vehicle's driving conditions, and when a breakdown occurs in one vehicle in a particular group, the other vehicles in the same group can also be regarded as vehicles that are showing signs of an impending breakdown.
- the technology described in Patent Document 1 if a breakdown occurs in any one vehicle in a group, all vehicles in the same group are classified as vehicles that are showing signs of a breakdown, and therefore it cannot be said that the technology properly predicts the lifespan of vehicles.
- the present invention aims to provide a vehicle deterioration prediction system and a vehicle deterioration prediction method that are capable of highly accurate deterioration prediction.
- the present application includes multiple means for solving the above-mentioned problems, and one example is a vehicle deterioration prediction system including a grouping unit that uses data regarding the driving conditions of multiple vehicles as input and performs grouping, a group belonging determination unit that determines which group the vehicle to be diagnosed belongs to, a deterioration prediction information creation unit that creates deterioration prediction information using data on multiple vehicles that belong to the group determined by the group belonging determination unit, and a failure determination unit that determines whether the vehicle to be diagnosed has a failure by inputting the vehicle conditions of the vehicle to be diagnosed into the deterioration prediction information.
- a vehicle deterioration prediction system including a grouping unit that uses data regarding the driving conditions of multiple vehicles as input and performs grouping, a group belonging determination unit that determines which group the vehicle to be diagnosed belongs to, a deterioration prediction information creation unit that creates deterioration prediction information using data on multiple vehicles that belong to the group determined by the group belonging determination unit, and a failure determination unit that determines whether the vehicle to
- deterioration prediction is performed using data on a plurality of vehicles belonging to a determined group, so that it is possible to improve the accuracy of diagnosis as to whether or not a vehicle to be diagnosed has a malfunction.
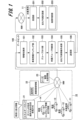
- 1 is a diagram showing an example of the overall configuration of a vehicle deterioration prediction system according to an embodiment of the present invention
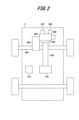
- 1 is a configuration diagram showing an example of a vehicle to which a diagnosis by a deterioration prediction system according to an embodiment of the present invention is applied
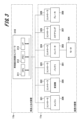
- 1 is a block diagram showing an example of a detailed configuration of a vehicle deterioration prediction system according to an embodiment of the present invention
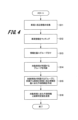
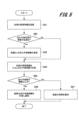
- 4 is a flowchart showing an example of a flow of deterioration prediction at a data center by a vehicle deterioration prediction system according to an embodiment of the present invention.
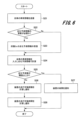
- 4 is a flowchart showing an example of processing within a target vehicle when deterioration is predicted by a vehicle deterioration prediction system according to an embodiment of the present invention.
- FIG. 5 is a flowchart illustrating an example of a notification process performed by the vehicle deterioration prediction system according to an embodiment of the present invention.
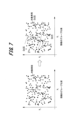
- FIG. 2 is a diagram showing an example of grouping by a vehicle deterioration prediction system according to an embodiment of the present invention. 2 is a diagram showing an example of processing performed by a deterioration prediction unit of a vehicle deterioration prediction system according to an embodiment of the present invention;
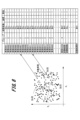
- FIG. 3 is a diagram showing an example of specific processed data by a deterioration prediction unit of a vehicle deterioration prediction system according to an embodiment of the present invention;
- FIG. 3 is a diagram showing an example of specific processed data by a deterioration prediction unit of
- FIG. 2 is a diagram showing an example of the relationship between a deterioration prediction value and a mileage by a vehicle deterioration prediction system according to an embodiment of the present invention
- FIG. 2 is a diagram showing an example of the relationship between time and a deterioration prediction value obtained by a vehicle deterioration prediction system according to an embodiment of the present invention
- FIG. 1 is a diagram showing an example of a histogram of history from a vehicle deterioration prediction system according to an embodiment of the present invention
- FIG. 2 is a diagram showing an example of the properties of fuel according to an embodiment of the present invention.
- FIG. 11 is a block diagram showing a modified example (an example of selecting the minimum value of the device) of the vehicle deterioration prediction system according to an embodiment of the present invention.
- FIG. 11 is a block diagram showing a modified example (an example of selecting the minimum value of a part) of the vehicle deterioration prediction system according to an embodiment of the present invention.
- FIG. 11 is a diagram showing a modified example of the vehicle deterioration prediction system according to an embodiment of the present invention (an example using information from a vehicle that has undergone a reliability test).
- FIG. 11 is a diagram showing a modified example of the vehicle deterioration prediction system according to an embodiment of the present invention (an example using information on a vehicle with a malfunction).
- FIG. 13 is a diagram showing a modified example of the vehicle deterioration prediction system according to an embodiment of the present invention (an example using information on vehicles that have undergone reliability testing and information on vehicles with a malfunction).
- this embodiment a vehicle deterioration prediction system and a vehicle deterioration prediction method according to one embodiment of the present invention (hereinafter referred to as “this embodiment") will be described with reference to the attached drawings.
- FIG. 1 shows an example of the overall configuration of a vehicle deterioration prediction system according to this embodiment.
- the vehicle deterioration prediction system of this example includes a data center 100.
- the data center 100 collects information on a plurality of vehicles 11, 12, 13, 14, ... from a real environment 10 via a network NW1.
- the data center 100 also collects information from an energy station 21, information from a base station 22, and information from a manufacturer 23 (vehicle manufacturer, equipment manufacturer) via the network NW1.
- a manufacturer 23 vehicle manufacturer, equipment manufacturer
- the data center 100 collects from each of the vehicles 11 to 14 detailed information on components that indicate what on-board devices are installed, sensor information on those components, and driving information that is information on the driving conditions. Furthermore, the data center 100 collects information about energy, such as the properties of gasoline and diesel, the properties of fuel hydrogen, and the electricity supply method, from the energy station 21 . The data center 100 also collects surrounding environment information from the base station 22 and collects device production information and the like from the manufacturer 23 .
- the data center 100 includes an information collecting unit 101 , a vehicle information matching unit 102 , a grouping unit 103 , a group belonging determining unit 104 , a deterioration prediction information creating unit 105 , and a transmitting unit 106 .
- the information collection unit 101 collects information on components (on-board devices), sensor information, driving information, etc. of each vehicle 11, 12, 13, 14, ... from the real environment 10.
- the information collection unit 101 also collects information from an energy stand 21, a base station 22, and a manufacturer 23.
- the vehicle information matching unit 102 matches vehicle information based on individual information of each vehicle 11, 12, . . ., the serial number of the in-vehicle device, the surrounding environment, the mileage, the energy acquisition situation, and the like.
- the grouping unit 103 groups the vehicles 11, 12, . . . based on the matching information in the vehicle information matching unit 102.
- the group judging unit 104 performs a judgment process to judge the group to which the target vehicle (here, vehicle 11) belongs.
- the deterioration prediction information creating unit 105 creates deterioration prediction information based on information related to vehicles belonging to the group to which the target vehicle 11 belongs.
- the deterioration prediction information creating unit 105 may acquire a failure determination value based on the created deterioration prediction information.
- the transmission unit 106 transmits the deterioration prediction information of the target vehicle 11 created by the deterioration prediction information creation unit 105 to the target vehicle 11. In addition, when the transmission unit 106 obtains a malfunction determination value, it transmits the malfunction determination value to the target vehicle 11.
- the target vehicle 11 includes a receiving unit 201 , a deterioration prediction calculation unit 202 , and a failure determination unit 203 .
- the receiving unit 201 receives deterioration prediction information from the data center 100. Furthermore, in the case where a failure determination value is transmitted, the receiving unit 201 receives the transmitted failure determination value.
- the deterioration prediction calculation unit 202 substitutes information about the vehicle 11 into the received deterioration prediction information to calculate a deterioration prediction value.
- the failure determination unit 203 compares the deterioration prediction value calculated by the deterioration prediction calculation unit 202 with a predetermined threshold value, and determines the possibility of a failure based on the comparison result.
- the result determined by the failure determination unit 203 is notified by display on a display unit (not shown) in the target vehicle 11, or the like.
- the failure determination result may be transmitted to the data center 100 or the manufacturer.
- the target vehicle 11 also has a configuration for transmitting information required for deterioration prediction and information required for grouping to the data center 100 .
- FIG. 2 shows an example of the configuration of the vehicle 11.
- the vehicle 11 supplies power from a battery 301 to an inverter 303 via a power cable 302, and supplies the power converted by the inverter 303 to a motor 304.
- the motor 304 is driven by this power supply, and rotates a drive shaft 306 via a transmission 305.
- the vehicle 11 is also provided with an engine 309 , which is capable of rotating a drive shaft 306 via a transmission 305 .
- the vehicle 11 is provided with a steering system 307 and a brake 308 .
- each part of the vehicle 11 is controlled by an in-vehicle device 310.
- the vehicle 11 includes a plurality of controllers. That is, the vehicle 11 includes a vehicle integrated control controller 310, and controllers 321 to 326 for each device that are connected to the vehicle integrated control controller 310 via an internal vehicle network so as to be able to communicate with each other.
- the vehicle integrated controller 310 is configured as a computer including, for example, a CPU (Central Processing Unit) 311 , a memory 312 , and an interface 313 .
- the CPU 311 is a processor that executes a program stored in the memory 312 to configure a processing function unit in a work area of the memory 312 and executes vehicle control processing.
- the receiving unit 201, the deterioration prediction calculation unit 202, and the failure determination unit 203 described in FIG. 1 are also configured in the work area of the memory 312 under the control of the CPU 311.
- the interface 313 exchanges information with other controllers 321 to 326 in the vehicle.
- the interface 313 also exchanges information with the data center 100 via the network NW2 shown in FIG.
- the controller 321 controls the engine 306.
- the controller 322 controls the transmission 305.
- the controller 323 controls the battery 301.
- the controller 324 controls the inverter 303 and the motor 304.
- the controller 325 controls the steering 307.
- the controller 326 controls the brake 308.
- these controllers 321 to 326 are configured as computers equipped with a CPU, memory, and an interface. Each of the controllers 321 to 326 controls a device connected to each of the controllers 321 to 326 based on a command from the vehicle integrated control controller 310. Each of the controllers 321 to 326 also transmits information on the state of each device to the vehicle integrated control controller 310.
- the vehicle integrated controller 310 performs calculation processing of the driving distance of the in-vehicle device. Alternatively, the controllers 321 to 326 that control each device perform calculation processing of the driving distance of the connected device.
- the vehicle integrated control controller 310 and each of the controllers 321 to 326 are configured to perform arithmetic processing based on a program implemented therein, but this is merely an example, and other configurations may be used.
- a part or the whole of the vehicle integrated control controller 310 may be realized by dedicated hardware such as a field programmable gate array (FPGA) or an application specific integrated circuit (ASIC).
- FPGA field programmable gate array
- ASIC application specific integrated circuit
- the data center 100 shown in FIG. 1 is also configured with a computer similar to the vehicle integrated controller 310 or other dedicated hardware.
- FIG. 4 is a flowchart showing an example of the flow of a degradation prediction process in the data center 100 constituting the degradation prediction system of this example.
- the information collecting unit 101 of the data center 100 performs a process of collecting information related to the vehicle (step S11).
- the vehicle matching unit 102 performs a matching process of the vehicle information (step S12).
- the vehicle matching unit 102 performs a one-to-one matching process of the vehicle individual and the device mounted on the vehicle.
- the vehicle matching unit 102 uses the vehicle serial number or the device serial number to search for the shipping inspection results obtained from the vehicle manufacturer or the device manufacturer when the device was manufactured, and associates it with the vehicle.
- the vehicle matching unit 102 also uses the location information (including history) of the individual vehicle to determine the environment (outside air, humidity, air pressure) in which the individual vehicle is being used. This information on the surrounding environment is obtained, for example, from the base station 22.
- the grouping unit 103 performs a process of grouping the vehicles based on the matching information obtained by the matching process in the vehicle information matching unit 102 (step S13). Thereafter, the group judging unit 104 judges the group to which the target vehicle (here, the vehicle 11 shown in FIG. 1) belongs (step S14). When the group judging unit 104 judges the group of the target vehicle in step S14, the deterioration prediction information creating unit 105 performs a deterioration prediction information creating process based on information related to the vehicles belonging to the group to which the target vehicle 11 belongs (step S15).
- the deterioration prediction information is information necessary for calculating a deterioration prediction for the target vehicle 11.
- the deterioration prediction information creating unit 105 may acquire a failure judgment value by calculation based on the created deterioration prediction information.
- the transmission unit 106 transmits the deterioration prediction information created by the deterioration prediction information creation unit 105 to the target vehicle 11 (step S16). If the deterioration prediction information creation unit 105 obtains a malfunction judgment value, the transmission unit 106 also transmits the malfunction judgment value to the target vehicle 11.
- FIG. 5 is a flowchart showing an example of the flow of processing in the target vehicle 11 constituting the deterioration prediction system of this embodiment.
- the target vehicle 11 transmits vehicle information required for grouping the vehicles to the data center 100 (step S21).
- the target vehicle 11 determines whether or not the deterioration prediction information of the subject vehicle needs to be updated (step S22).
- step S22 If it is determined in step S22 that the deterioration prediction information of the own vehicle needs to be updated (Yes in step S22), the receiving unit 201 receives the deterioration prediction information of the group to which the own vehicle belongs from the data center 100 (step S23). Then, after receiving the deterioration prediction information in step S23, or if there is no need to update the deterioration prediction information of the vehicle in step S22 (No in step S22), the deterioration prediction calculation unit 202 inputs the vehicle information of the vehicle into the deterioration prediction information and calculates the deterioration prediction value (step S24).
- the deterioration prediction calculation unit 202 judges whether the obtained deterioration prediction value is equal to or greater than a predetermined threshold value (step S25).
- the deterioration threshold value is set in advance based on the design information in the development stage. If the deterioration prediction value is equal to or greater than the threshold value in step S25 (Yes in step S25), the malfunction determination unit 203 determines that the device mounted on the vehicle is malfunctioning, and notifies the user of the malfunction of the device (step S27).
- the malfunction determination unit 203 calculates the distance the vehicle can travel before it malfunctions, and notifies the user of the calculated distance (step S26).
- the notification in steps S26 and S27 is performed, for example, by display on a display unit mounted on the vehicle or by audio output. Alternatively, the notification may be performed by sending a message to a mobile terminal carried by the user of the vehicle 11. In addition, the calculation result may be transmitted to the data center 100.
- the failure determination unit 203 calculates the distance the vehicle can travel before it breaks down, and notifies the user of the calculated distance.
- the failure determination unit 203 may calculate the time that the vehicle can travel until it breaks down in step S28, and notify the remaining travel time (number of days that the vehicle can travel).
- the remaining travel time can be calculated here by converting the remaining travel distance into the remaining travel time, for example, using a moving average value of the travel distance of the target vehicle 11 for each fixed period (for example, 30 days).
- the other steps in Fig. 6 are the same as those in the flowchart of Fig. 5. By notifying the user in this way based on time, it becomes possible to provide the user with a notification that is easy to understand.
- FIG. 7 is a diagram showing an example of grouping by the grouping unit 103. As shown in FIG. FIG. 7 is a distribution diagram of vehicle information x 1 to x n acquired by the data center 100, taken along the cross section x i and x j .
- the distribution diagram on the left side of Fig. 7 is an example before grouping, and the distribution diagram on the right side of Fig. 7 is an example after grouping.
- the characteristics indicated by marks O indicate the characteristics of the target vehicle 11
- the distribution characteristics indicated by marks ⁇ indicate the distribution characteristics of vehicles equipped with the same on-board device as the target vehicle 11.
- the distribution characteristics indicated by marks ⁇ indicate the distribution characteristics of vehicles that have experienced a failure among the distribution characteristics of vehicles equipped with the same on-board device as the target vehicle 11.
- the vehicles indicated by the distribution characteristics here may include vehicles that have already been scrapped and vehicles whose on-board devices have been replaced.
- the vehicle information x 1 to x n has the following information as variables: - Sensor information (voltage, current, etc.) from on-board devices installed in the vehicle - Driving history (location, distance traveled, etc.) ⁇ Surrounding environment information (temperature, humidity, air pressure, road conditions, altitude, etc.) ⁇ Energy station information (charger type, power supply, gasoline properties, hydrogen fuel properties, etc.)
- the grouping unit 103 performs grouping based on the values of such vehicle information x 1 to x n .
- Fig. 7 shows an example of grouping into three groups, group Gr. 01 to group Gr. 03. Note that Fig. 7 shows grouping viewed from a cross section of two pieces of information x i and x j among a large number of pieces of vehicle information x 1 to x n , but in reality, the grouping unit 103 performs grouping taking into account all pieces of information x 1 to x n .
- the grouping unit 103 may perform grouping using unsupervised machine learning or the like.
- FIG. 8 shows an example of a process for creating deterioration prediction information in the deterioration prediction information creating unit 105.
- the deterioration prediction information creation unit 105 obtains the distribution shown on the left side of Fig. 8 (the same distribution as in Fig. 7), it investigates devices and parts installed in vehicles that have experienced a breakdown among the vehicles in the same group as the target vehicle 11, and obtains deterioration prediction information dp using the information x 1 to x n of the vehicle that has experienced a breakdown.
- information x 1 to x n of the vehicle that has experienced a breakdown is just one example, and information x 1 to x n of other vehicles in the same group as the target vehicle 11 may also be used.
- vehicle information x 1 to x n will be described in the next Fig. 9.
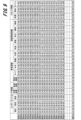
- FIG. 9 shows an example of the relationship between the deterioration prediction information dp and each of the variables x 1 to x n .
- 9 are variables x 1 to x n .
- the variables x 1 to x n include device (component) sensor information such as voltage, current, temperature, number of charging attempts, and number of quick charging attempts.
- the variables x 1 to x n include vehicle information, such as product inspection results (equipment variation: high, medium, low performance), vehicle type, year, mileage, and location.
- variables x 1 to x n include ambient environment information such as temperature, humidity, air pressure, altitude, and road surface conditions.
- the variables x 1 to x n include the energy station information, such as the type of charger, the power supply method, the gasoline properties, and the properties of the fuel hydrogen.
- design information and durability test information are also included, although not shown in Fig. 9.
- not only broken-down vehicles but also scrapped vehicles' usage history information may be used.
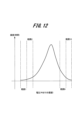
- the information obtained here can be used as a histogram of time history information, for example, as shown in Fig. 12, and the time and number of times within a certain range can be used as variables. That is, the example in Fig. 12 shows the voltage history up to now (horizontal axis) and the frequency (vertical axis). As shown in Fig. 12, the voltage history can be divided into levels 1 to 10, and the frequency (time) values and information x1 to xn for each of the ranges 1 to 10 can be used.
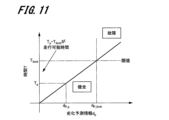
- 10 and 11 show examples in which the deterioration prediction calculation unit 202 of the vehicle 11 calculates the remaining driving distance and remaining driving time.
- 10 shows the relationship between the travel distance Dd (vertical axis) and the deterioration prediction information dp (horizontal axis) of the vehicle 11.
- the deterioration prediction calculation unit 202 determines that a malfunction has occurred when the deterioration prediction information dp increases in proportion to the travel distance Dd and is equal to or greater than a threshold value dp -limit .
- the deterioration prediction calculation unit 202 judges that the vehicle is healthy.
- the malfunction judgment unit 203 judges that the target vehicle 11 is malfunctioning.
- the deterioration prediction calculation unit 202 can calculate the possible driving distance before a breakdown by calculating [current distance Dd p - threshold driving distance Dd -limit ].
- the failure determination unit 203 determines that a failure has occurred when the deterioration prediction information dp increases in proportion to the time Td and is equal to or greater than a threshold value dp -limit of the deterioration prediction information dp.
- the deterioration prediction calculation unit 202 judges that the target vehicle 11 is healthy.
- the time Tp is equal to or greater than the time Tlimit corresponding to the threshold value dp -limit
- the malfunction judgment unit 203 judges that the target vehicle 11 is malfunctioning.
- the deterioration prediction calculation unit 202 can calculate the remaining driving distance time until a breakdown occurs by calculating [current time Tp-threshold time T limit ].
- the remaining driving time T can be calculated by dividing the remaining driving distance Dd of the target vehicle 11 by the driving distance within a certain period of time. 10 and 11, the degradation prediction value dp increases linearly, but this linear increase is merely an example and is not limited to this. However, the degradation prediction value dp may be expressed as a monotonic increase or a monotonic phenomenon.
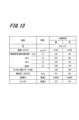
- FIG. 13 shows examples of gasoline properties used as variables x 1 to x n .
- Gasoline properties indicate characteristics such as color, density, distillation properties, octane number, vapor pressure, sulfur content, benzene content, etc.
- the deterioration prediction information creation unit 105 acquires information on these gasoline properties based on the gasoline manufacturer, the time (season) when the gasoline was used, etc., and uses this information as variables x 1 to x n .
- the degree of corrosion of the plastic and metal parts of the hoses may differ, which may result in different deterioration prediction values.
- deterioration prediction is performed using data of a plurality of vehicles belonging to a determined group, so that it is possible to diagnose whether or not a target vehicle has a breakdown.
- the grouping unit 103 collects various information of the vehicles as variables x1 to xn , so that the deterioration prediction information creation unit 105 can greatly improve the accuracy of the diagnosis.
- the deterioration prediction information creation unit 105 can also diagnose the mileage and time required for a breakdown.
- the deterioration prediction information generating unit 105 can perform a more accurate diagnosis by using only information on broken-down vehicles.
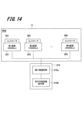
- FIG. 14 is a block diagram showing a modified example of the vehicle deterioration prediction system (an example in which the minimum value of the device is selected).
- the target vehicle 11 is equipped with a first in-vehicle device 351, a second in-vehicle device 352, . . . , an N-th in-vehicle device 359 (N is an integer of 2 or more), each of which is provided with controllers 361 to 369.
- the minimum value selection unit 310a of the vehicle integrated controller 310 selects the minimum value of the remaining driving distance calculated by each controller 361 to 369 (here, 50,000 km for the first vehicle-mounted device 351).
- the remaining driving distance presentation unit 310b then presents the minimum value of the remaining driving distance.
- the remaining driving distance presentation unit 310b may also present information regarding which device has the minimum value.
- the driving range presentation unit 310b calculates the driving range of each device (inverter, motor, battery, etc.) and displays the device selected as the smallest value, allowing the relevant device to be repaired or replaced or the vehicle to be changed (purchased) before the vehicle becomes unable to be driven.
- the remaining driving distance calculated by each of the controllers 361 to 369 shown in FIG. 14 is reset to its initial state when the device corresponding to each of the controllers 361 to 369 is replaced. This ensures that the remaining driving distance will be an accurate value even if a part of the device inside the vehicle is replaced.
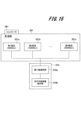
- FIG. 15 is a block diagram showing a modified example of the vehicle deterioration prediction system (an example in which the minimum value of a part is selected).
- the first device 351 of the target vehicle 11 is equipped with a first part 351a, a second part 351b, ..., an Nth part 351n (N is an integer greater than or equal to 2), and controllers 361 to 369 of the first device 351 manage the travel distance of each of the parts 351a to 351n.
- the minimum value selection unit 310a of the vehicle integrated controller 310 selects the minimum value of the remaining driving distance of each part calculated by each controller 361 (here, 50,000 km for the first part 351a). Then, the remaining driving distance presentation unit 310b presents the minimum value of the remaining driving distance. When presenting the minimum value of the remaining driving distance, the remaining driving distance presentation unit 310b may also present information about which part has the minimum value.
- the deterioration prediction information creating unit 105 may add information on a vehicle reliability test conducted in advance as well as information on a vehicle that is actually running. That is, as shown in Fig. 16, the deterioration prediction information creating unit 105 adds a plurality of pieces of reliability test result information, such as test result 1, test result 2, ..., test result W, to the information for obtaining the deterioration prediction information. Furthermore, in the reliability test conducted in the development stage, the deterioration prediction information creating unit 105 obtains information on the mileage at which the vehicle and on-board devices will break down.
- the deterioration prediction information creation unit 105 adds reliability test result information, so that a correlation between a causative parameter and the progress of deterioration leading up to a failure can be obtained even in a situation where there are few failures.
- the deterioration prediction information creation unit 105 obtains deterioration prediction information from information on group Gp.3 to which the target vehicle 11 described in Fig. 8 belongs and reliability test result information. This improves the approximation accuracy of the deterioration prediction information, and improves the prediction accuracy of the deterioration prediction value dp.
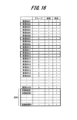
- the deterioration prediction information creating unit 105 may extract only the information of the vehicle in which a breakdown has occurred, and obtain the deterioration prediction information only from the information of the vehicle in which a breakdown has occurred. That is, as shown in Fig. 17, the deterioration prediction information creating unit 105 extracts information of devices such as vehicles with breakdowns in group 3 as information for obtaining the deterioration prediction information. For example, in the example of Fig. 17, the deterioration prediction information creating unit 105 extracts information of vehicles 0010 and 0012 to obtain the deterioration prediction information.
- the information on the broken-down vehicle may include not only information on the broken-down vehicle, but also information on the vehicle being scrapped, repaired, or parts replaced.
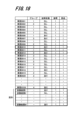
- the deterioration prediction information creation unit 105 may obtain deterioration prediction information using information on the vehicle that underwent the reliability test described in FIG. 16 and information on the vehicle in which a failure has occurred described in FIG. 17 . That is, as shown in FIG. 18, the deterioration prediction information creation unit 105 obtains deterioration prediction information using information on vehicles 0010 and 0012, which are vehicles in the same group as the target vehicle 11 and in which a breakdown has occurred, and information on test results 1 to W.
- the information on the broken-down vehicle may include not only the information on the broken-down vehicle but also information on the vehicle being scrapped, repaired, or parts replaced.
- the embodiment described above has been described in detail to make the present invention easier to understand, and is not necessarily limited to having all of the configurations described.
- the deterioration prediction value calculation unit 202 is provided on the vehicle 11 side.
- the data center 100 may acquire information from the vehicle 11 and perform the calculation process of the deterioration prediction value.
- an application program that performs the calculation process of the deterioration prediction value may be implemented in a terminal device, such as a smartphone, carried by a user who owns the vehicle 11, and the deterioration prediction value may be calculated on the terminal device.
- the data center 100 may be provided with a processing unit equivalent to the deterioration prediction value calculation unit 202, and the vehicle 11 may obtain and notify the deterioration prediction value obtained by calculation in the data center 100.
- the calculation of the driving range within the vehicle is performed by a controller connected to each device, or by the vehicle integrated controller 310 within the vehicle.
- information may be transferred from the controller of the device that contains the part for which deterioration prediction is performed to a controller of another device connected to the network within the vehicle for calculation. This allows the controller within the vehicle to be used more effectively.
- vehicle integrated controller 310 and the other controllers 321 to 326 are shown as examples in which each processing unit is configured on a computer by executing a program, but in this case the program may be stored on a recording medium such as an external memory, IC card, SD card, or optical disk and transferred to the computer.
- a recording medium such as an external memory, IC card, SD card, or optical disk and transferred to the computer.
Landscapes
- Business, Economics & Management (AREA)
- Engineering & Computer Science (AREA)
- Human Resources & Organizations (AREA)
- General Physics & Mathematics (AREA)
- Economics (AREA)
- Strategic Management (AREA)
- Physics & Mathematics (AREA)
- Theoretical Computer Science (AREA)
- General Business, Economics & Management (AREA)
- Marketing (AREA)
- Development Economics (AREA)
- Tourism & Hospitality (AREA)
- Entrepreneurship & Innovation (AREA)
- Operations Research (AREA)
- Quality & Reliability (AREA)
- Educational Administration (AREA)
- Accounting & Taxation (AREA)
- Finance (AREA)
- Game Theory and Decision Science (AREA)
- Health & Medical Sciences (AREA)
- General Health & Medical Sciences (AREA)
- Primary Health Care (AREA)
- Traffic Control Systems (AREA)
- Vehicle Cleaning, Maintenance, Repair, Refitting, And Outriggers (AREA)
Abstract
Description
しかしながら、特許文献1に記載された技術は、グループ内のいずれか1台に故障が発生すると、同じグループ内の車両は全て故障発生の予兆がある車両に分類されてしまうので、車両の寿命予測を適切に行っているとは言えない。
本願は、上記課題を解決する手段を複数含んでいるが、その一例を挙げるならば、車両の劣化予測システムとして、複数の車両の走行状況に関するデータを入力としてグループ化を実行するグループ分け部と、診断対象の車両がどのグループに該当するかを判定する所属グループ判定部と、所属グループ判定部により判定されたグループに属する複数の車両のデータを用いて劣化予測情報を作成する劣化予測情報作成部と、診断対象の車両状況を劣化予測情報に入力することで診断車両が故障か否か判断する故障判断部と、を備える。
上記した以外の課題、構成および効果は、以下の実施形態の説明により明らかにされる。
図1は、本例の車両の劣化予測システムの全体構成例を示す。
本例の車両の劣化予測システムは、データセンタ100を備える。データセンタ100は、実環境10から複数の車両11,12,13,14,・・・の情報を、ネットワークNW1を介して収集する。また、データセンタ100は、エネルギースタンド21からの情報と、基地局22からの情報と、メーカ23(車両メーカ、装置メーカ)からの情報も、ネットワークNW1を介して収集する。
なお、図1においては、複数の車両11~14の内の1台の車両11を劣化予想する対象車両としている。
また、データセンタ100は、エネルギースタンド21から、エネルギーに関する情報である、ガソリンや軽油の性状、燃料水素の性状、電気の給電方式などを収集する。
また、データセンタ100は、基地局22から周囲環境情報を収集し、メーカ23から装置の生産情報などを収集する。
情報収集部101は、実環境10から各車両11,12,13,14,・・・の構成要素(車載装置)の情報やセンサ情報、走行情報などを収集する。また、情報収集部101は、エネルギースタンド21、基地局22、メーカ23からも情報を収集する。
グループ分け部103は、車両情報マッチング部102におけるマッチング情報に基づいて、各車両11,12,・・・をグループ化する。
所属グループ判断部104は、対象車両(ここでは車両11)が所属するグループを判断する判断処理を行う。
送信部106は、劣化予測情報作成部105が作成した対象車両11の劣化予測情報を、対象車両11に送信する。また、送信部106は、故障判定値を得た場合には、故障判定値を対象車両11に送信する。
受信部201は、データセンタ100からの劣化予測情報を受信する。また、故障判定値が送信される場合には、受信部201は、送信された故障判定値を受信する。
劣化予測計算部202は、受信した劣化予測情報に、当該車両11の情報を代入して劣化予測値を計算する。
なお、対象車両11は、データセンタ100に対して劣化予測に必要な情報やグループ分けに必要な情報を送信するための構成も備える。
図2は、車両11の構成例を示す。
車両11は、バッテリ301からの電源を、パワーケーブル302を介してインバータ303に供給し、インバータ303で変換された電源をモータ304に供給する。この電源の供給によりモータ304が駆動され、変速機305を介してドライブシャフト306を回転させる。
また、車両11にはエンジン309が設置され、エンジン309の駆動で、変速機305を介してドライブシャフト306を回転させることできる。
さらに、車両11には、ステアリング307及びブレーキ308が設置されている。
また、これらの車両11の各部は、車載装置310により制御される。
車両11は、複数のコントローラを備える。すなわち、車両11は、車両統合制御コントローラ310を備え、その車両統合制御コントローラ310と車両内部ネットワークで相互に通信可能に接続された、機器ごとのコントローラ321~326を備える。
CPU311は、メモリ312に記憶されたプログラムを実行することで、メモリ312のワークエリアに処理機能部を構成して、車両の制御処理を実行するプロセッサである。図1で説明した受信部201、劣化予測計算部202、故障判断部203も、CPU311の制御でメモリ312のワークエリアに構成される。
インターフェース313は、車両内の他のコントローラ321~326と情報のやり取りを行う。また、インターフェース313は、図1に示したネットワークNW2を経由してデータセンタ100とも情報のやり取りを行う。
車両統合制御コントローラ310は、車載装置の走行可能距離の演算処理を行う。あるいは、各装置を制御するコントローラ321~326が、接続された装置の走行可能距離の演算処理を行う。
また、図1に示すデータセンタ100についても、車両統合制御コントローラ310と同様のコンピュータ又はその他の専用のハードウェアで構成される。
図4は、本例の劣化予測システムを構成するデータセンタ100における劣化予測処理の流れの例を示すフローチャートである。
まず、データセンタ100の情報収集部101は、車両に係る情報の収集処理を行う(ステップS11)。
次に、車両マッチング部102は、車両情報のマッチング処理を行う(ステップS12)。ここでは、車両マッチング部102は、車両個体と車両に搭載されている装置の1対1対応のマッチング処理を行う。例えば、車両マッチング部102は、車両製造番号や装置の製造番号を用いて、車両メーカや装置メーカから取得した、装置が製造されたときの出荷検査結果等を検索し車両との対応付けを行う。
その後、所属グループ判断部104は、対象車両(ここでは図1に示す車両11)が所属するグループを判断する(ステップS14)。
ステップS14で、所属グループ判断部104が対象車両のグループを判断すると、劣化予測情報作成部105は、対象車両11が所属するグループに所属する車両に係る情報を基に、劣化予測情報作成処理を行う(ステップS15)。劣化予測情報は、対象車両11の劣化予測を計算するために必要な情報である。ここで、劣化予測情報作成部105は、作成した劣化予測情報に基づいた演算により、故障判定値を取得するようにしてもよい。
図5は、本例の劣化予測システムを構成する対象車両11における処理の流れの例を示すフローチャートである。
まず、対象車両11は、車両をグループ分けするために必要な車両情報をデータセンタ100へ送信する(ステップS21)。
次に、対象車両11は、自車両の劣化予測情報の更新が必要か不要かの判断をする(ステップS22)。
そして、ステップS23で劣化予測情報を受信した後、あるいはステップS22で自車両の劣化予測情報の更新が必要ない場合(ステップS22のNo)、劣化予測計算部202は、自車両の車両情報を劣化予測情報に入力して、劣化予測値の計算を行う(ステップS24)。
ステップS25で劣化予測値が閾値以上の場合(ステップS25のYes)、故障判断部203は、車両に搭載された装置が故障していると判断し、装置の故障を利用者に通知する(ステップS27)。
ステップS26及びS27における通知は、例えば車両に搭載された表示部による表示、又は音声出力により行われる。あるいは、車両11の利用者が所持した携帯端末へメッセージ送信を行うことで通知してもよい。また、データセンタ100側に計算結果を送信するようにしてもよい。
これに対して、図6のフローチャートに示すように、ステップS26で車両が故障するまでの走行可能距離を計算した後、ステップS28で故障判断部203により車両が故障するまで走行可能時間を計算して、走行可能時間(走行可能日数)を通知してもよい。ここでの走行可能時間の算出は、例えば対象車両11の一定期間ごと(例えば30日間)の走行距離の移動平均値を使って、走行可能距離を走行可能時間に変換することで算出することができる。図6のその他のステップは、図5のフローチャートと同様である。
このように時間で通知することで、利用者に分かりやすい通知が可能になる。
図7は、グループ分け部103によるグループ化の例を示す図である。
図7は、データセンタ100が取得した車両の情報x1~xnを、xiとxjの断面を取った際の分布図である。
図7の左側の分布図がグループ化前の例であり、図7の右側がグループ化した例である。図7において、○の印で示す特性は、対象車両11の特性を示し、●の印で示す分布特性は、対象車両11と同一の車載装置を搭載した車両の分布特性を示す。さらに、△の印で示す分布特性は、対象車両11と同一の車載装置を搭載した車両の分布特性の内で、故障を経験した車両の分布特性を示す。なお、ここでの分布特性で示す各車両には、既に廃車になった車両や、車載装置を交換した車両を含むようにしてもよい。
・自車に搭載された車載装置のセンサ情報(電圧、電流など)
・走行履歴(走行位置、走行距離など)
・周囲環境情報(気温、湿度、気圧、路面状況、標高など)
・エネルギースタンド情報(充電器の種類、供給電力、ガソリン性状、燃料水素の性状など)
グループ分け部103がグループ化する際には、例えばルールベースで分類を行う。あるいは、グループ分け部103は、教師なしの機械学習などを使ってグループ化してもよい。
図8は、劣化予測情報作成部105における劣化予測情報の作成処理の例を示す。
劣化予測情報作成部105は、図8の左側に示す分布(図7と同じ分布)を取得したとき、対象車両11と同じグループ内の車両のうちで、故障を経験した車両に搭載された装置や部品を調査し、故障を経験した車両の情報x1~xnを用いて劣化予測情報dpを得る。但し、故障を経験した車両の情報x1~xnを用いるのは一例であり、対象車両11と同じグループ内のその他の車両の情報x1~xnを用いてもよい。車両の情報x1~xnの具体的な例については、次の図9で説明する。
図9の表に示す各情報が、変数x1~xnである。例えば、変数x1~xnには、装置(コンポーネント)センサ情報である、電圧、電流、温度、充電回数、急速充電回数が含まれる。
また、変数x1~xnには、車両情報である、製品検査結果(装置ばらつき:性能の上中下)、車両タイプ、年式、走行距離、位置が含まれる。
また、変数x1~xnには、エネルギースタンド情報である、充電器の種類、給電方式、ガソリン性状、燃料水素の性状が含まれる。
さらに、図9には示さないが、設計の情報、耐久試験の情報も含める。また、故障した車両だけでなく、廃車になった車両の使用履歴情報も使用してもよい。
図10及び図11は、車両11の劣化予測計算部202が走行可能距離及び走行可能時間を算出する例を示す。
図10は、車両11の走行距離Dd(縦軸)と劣化予測情報dp(横軸)との関係を示す。ここで、劣化予測計算部202は、劣化予測情報dpが走行距離Ddに比例して増加する場合であり、劣化予測情報dpが閾値dp-limit以上のとき、故障であると判断する。
また、健全と判断した場合において、劣化予測計算部202は、[現在の距離Ddp-閾値の走行距離Dd-limit]の計算を行うことで、故障までの走行可能距離を算出することができる。
また、健全と判断した場合において、劣化予測計算部202は、[現在の時間Tp-閾値の時間Tlimit]の計算を行うことで、故障までの走行可能距離時間を算出することができる。
また、図10及び図11の例では、劣化予測値dpは直線的に増加する例を示したが、この直線的な増加は一例であり、これに限定されない。但し、劣化予測値dpは単調増加か単調現象で示すことができる。
図13は、変数x1~xnとして使用されるガソリン性状の例を示す。
ガソリン性状は、色、密度、蒸留性状、オクタン価、蒸気圧、硫黄分、ベンゼン量などの特性を示したものである。劣化予測情報作成部105は、ガソリンの製造メーカ、ガソリンを使用した時期(季節)などにより、これらのガソリン性状の情報を取得して、変数x1~xnとして使用する。
これらのガソリン性状などの燃料の成分によって、ホース類の樹脂部品や金属部品の腐食具合が相違し、劣化予測値が相違する可能性がある。
さらに、劣化予測情報dpを得る際には、故障した車両の情報だけを使うことで、劣化予測情報作成部105は、より精度の高い診断を行うことができる。
なお、1つの車両に搭載された複数の装置ごとに個別に走行可能距離を算出した場合には、それぞれの走行可能距離を、算出した走行可能距離とすればよい。
図14は、車両の劣化予測システムの変形例(装置の最小値を選択する例)を示すブロック図である。
対象車両11には、第1車載装置351、第2車載装置352、・・・・、第N車載装置359(Nは2以上の整数)が搭載され、それぞれにコントローラ361~369が設置されている。
また、走行可能距離提示部310bは、各装置(インバータ、モータ、バッテリなど)の走行可能距離を計算して、最小値として選んだ装置を示すことで、車両が走行不能になる前に、該当する装置の修理、交換や車両の乗換(買換え)ができるようになる。
この場合、いずれの装置が故障や交換が必要かは、車両に搭載された交換可能な装置(部品)の単位で走行可能距離を計算して、通知を行うのが好ましい。
車両に搭載された交換可能な装置(部品)の単位で走行可能距離を計算して、通知することで、装置や部品の交換を適切に行えるようになる。
図14の例では、1つの車両に搭載された複数の装置ごとに個別に走行可能距離を算出したが、1つの車両に搭載された複数の装置ではなく、複数の部品ごとに個別に走行可能距離を算出するようにしてもよい。
図15は、車両の劣化予測システムの変形例(部品の最小値を選択する例)を示すブロック図である。
対象車両11の第1装置351には、第1部品351a、第2部品351b、・・・・、第N部品351n(Nは2以上の整数)が搭載され、第1装置351のコントローラ361~369は、各部品351a~351nの走行可能距離を管理している。
劣化予測情報作成部105が劣化予測情報を得る際には、実際に走行している車両の情報だけでなく、車両の信頼性試験などを事前に行った情報を追加してもよい。すなわち、図16に示すように、劣化予測情報作成部105は、劣化予測情報を得るための情報に、試験結果1、試験結果2、・・・、試験結果Wの複数の信頼性試験結果情報を加えるようにする。また、劣化予測情報作成部105は、開発段階で行われる信頼性試験では、車両や車載装置がいずれの走行距離で故障するのかの情報を取得する。
これにより、劣化予測情報の近似精度が向上し、劣化予測値dpの予測精度が向上する。
また、劣化予測情報作成部105が劣化予測情報を得る際には、故障が発生した車両の情報だけを抽出して、故障が発生した車両の情報だけから劣化予測情報を得るようにしてもよい。すなわち、図17に示すように、劣化予測情報作成部105は、劣化予測情報を得るための情報として、グループ3で、故障あり車両などの装置の情報を抽出する。例えば、図17の例では、劣化予測情報作成部105は、車両0010の情報と、車両0012の情報を抽出して、劣化予測情報を得るようにする。
なお、故障した車両の情報については、故障した車両の情報だけでなく、廃車、修理、部品交換した情報を加えてもよい。
さらに、劣化予測情報作成部105は、図16で説明した信頼性試験を行った車両の情報と、図17で説明した故障が発生した車両の情報とを使って、劣化予測情報を得るようにしてもよい。
すなわち、図18に示すように、劣化予測情報作成部105は、対象の車両11と同じグループ内で故障が発生した車両である、車両0010と車両0012の情報と、試験結果1~試験結果Wの情報とを使って、劣化予測情報を得るようにする。
なお、この図18の例の場合にも、故障した車両の情報については、故障した車両の情報だけでなく、廃車、修理、部品交換した情報を加えるようにしてもよい。
なお、ここまで説明した実施の形態例は、本発明を分かりやすく説明するために詳細に説明したものであり、必ずしも説明した全ての構成を備えるものに限定されるものではない。例えば、上述した実施の形態例では、劣化予測値計算部202は、車両11側に設けるようにした。
Claims (11)
- 複数の車両の走行状況に関するデータを入力としてグループ化を実行するグループ分け部と、
診断対象の車両がどのグループに該当するかを判断する所属グループ判断部と、
前記所属グループ判断部により判断されたグループに属する複数の車両のデータを用いて、劣化予測情報を作成する劣化予測情報作成部と、
前記診断対象の車両状況を前記劣化予測情報に入力することで前記診断対象の車両が故障か否か判断する故障判断部と、を備える
車両の劣化予測システム。 - 1つの車両に搭載された複数の装置に対して走行可能距離の予測を行い、走行距離が一番短い装置の走行可能距離を用いて車両の走行可能距離として、前記故障判断部が判断する
請求項1に記載の車両の劣化予測システム。 - 車両に搭載された1つの装置内の複数部品に対して、走行可能距離の予測を行い、そのうち走行距離が一番短い部品の走行可能距離を用いて装置の走行可能距離として、前記故障判断部が判断する
請求項1に記載の車両の劣化予測システム。 - 車両に搭載された交換可能な装置の単位で、前記故障判断部が走行可能距離を通知する
請求項1に記載の車両の劣化予測システム。 - 車両に搭載された交換された装置に関する走行可能距離は、初期状態にリセットして、前記故障判断部が判断する
請求項1に記載の車両の劣化予測システム。 - 前記劣化予測情報作成部は、対象車両を含むグループ中の複数車両の情報と、信頼性試験を行った車両と装置の情報に基づいて劣化予測情報を作成する
請求項1に記載の車両の劣化予測システム。 - 前記劣化予測情報は、対象車両が所属するグループ内の故障した車両の情報を抽出して作成される
請求項1に記載の車両の劣化予測システム。 - 前記劣化予測情報は、対象車両が所属するグループ内の故障した車両の情報と、信頼性試験を行った車両と装置の情報に基づいて作成される
請求項1に記載の車両の劣化予測システム。 - 前記劣化予測情報は、劣化予測を行う部品を含む装置のコントローラから、車両内のネットワークに接続された他の装置のコントローラに情報を転送して演算する
請求項1に記載の車両の劣化予測システム。 - 前記故障判断部は、走行可能時間を提示する
請求項1に記載の車両の劣化予測システム。 - 複数の車両の走行状況に関するデータを入力としてグループ化を実行するグループ化処理と、
診断対象の車両がどのグループに該当するかを判断する判断処理と、
前記判断処理により判定されたグループに属する複数の車両のデータを用いて劣化予測情報を作成する劣化予測情報作成処理と、
前記診断対象の車両の状況を前記劣化予測情報に入力することで前記診断対象の車両が故障か否か判断する診断処理と、を含む
車両の劣化予測方法。
Priority Applications (4)
| Application Number | Priority Date | Filing Date | Title |
|---|---|---|---|
| PCT/JP2023/023333 WO2024262007A1 (ja) | 2023-06-23 | 2023-06-23 | 車両の劣化予測システム及び車両の劣化予測方法 |
| CN202380091711.1A CN120548464A (zh) | 2023-06-23 | 2023-06-23 | 车辆劣化预测系统及车辆劣化预测方法 |
| JP2025527384A JPWO2024262007A1 (ja) | 2023-06-23 | 2023-06-23 | |
| DE112023005058.9T DE112023005058T5 (de) | 2023-06-23 | 2023-06-23 | Fahrzeugverschlechterungs-vorhersagesystem und fahrzeugverschlechterungs-vorhersageverfahren |
Applications Claiming Priority (1)
| Application Number | Priority Date | Filing Date | Title |
|---|---|---|---|
| PCT/JP2023/023333 WO2024262007A1 (ja) | 2023-06-23 | 2023-06-23 | 車両の劣化予測システム及び車両の劣化予測方法 |
Publications (1)
| Publication Number | Publication Date |
|---|---|
| WO2024262007A1 true WO2024262007A1 (ja) | 2024-12-26 |
Family
ID=93935031
Family Applications (1)
| Application Number | Title | Priority Date | Filing Date |
|---|---|---|---|
| PCT/JP2023/023333 Ceased WO2024262007A1 (ja) | 2023-06-23 | 2023-06-23 | 車両の劣化予測システム及び車両の劣化予測方法 |
Country Status (4)
| Country | Link |
|---|---|
| JP (1) | JPWO2024262007A1 (ja) |
| CN (1) | CN120548464A (ja) |
| DE (1) | DE112023005058T5 (ja) |
| WO (1) | WO2024262007A1 (ja) |
Citations (11)
| Publication number | Priority date | Publication date | Assignee | Title |
|---|---|---|---|---|
| JP2006053016A (ja) * | 2004-08-11 | 2006-02-23 | Hitachi Ltd | 車両故障診断装置および車載端末 |
| JP2007284027A (ja) * | 2006-04-20 | 2007-11-01 | Hino Motors Ltd | 車載故障診断制御装置 |
| JP2008308075A (ja) * | 2007-06-15 | 2008-12-25 | Honda Motor Co Ltd | メンテナンス時期報知装置 |
| JP2009012705A (ja) * | 2007-07-09 | 2009-01-22 | Denso Corp | 車両用機能異常対応装置および車両用機能異常対応装置用のプログラム |
| JP4338652B2 (ja) * | 2005-01-21 | 2009-10-07 | 三菱電機インフォメーションシステムズ株式会社 | 車両管理装置 |
| JP4685731B2 (ja) * | 2006-08-28 | 2011-05-18 | 日立オートモティブシステムズ株式会社 | 移動体の診断装置、移動体の診断端末、およびインバータ装置 |
| JP4928532B2 (ja) * | 2008-12-10 | 2012-05-09 | 本田技研工業株式会社 | 車両の故障診断装置 |
| JP6369485B2 (ja) * | 2016-02-22 | 2018-08-08 | マツダ株式会社 | 車両の表示装置 |
| KR101889049B1 (ko) * | 2017-08-11 | 2018-08-21 | (주)다이매틱스 | 딥러닝 기반의 인공지능을 이용한 자동차 진단 방법 및 장치 |
| JP7234898B2 (ja) * | 2019-10-25 | 2023-03-08 | トヨタ自動車株式会社 | 車両部品の残存寿命予測装置 |
| JP7279695B2 (ja) * | 2020-09-23 | 2023-05-23 | いすゞ自動車株式会社 | 寿命予測装置及び寿命予測方法 |
-
2023
- 2023-06-23 JP JP2025527384A patent/JPWO2024262007A1/ja active Pending
- 2023-06-23 CN CN202380091711.1A patent/CN120548464A/zh active Pending
- 2023-06-23 WO PCT/JP2023/023333 patent/WO2024262007A1/ja not_active Ceased
- 2023-06-23 DE DE112023005058.9T patent/DE112023005058T5/de active Pending
Patent Citations (11)
| Publication number | Priority date | Publication date | Assignee | Title |
|---|---|---|---|---|
| JP2006053016A (ja) * | 2004-08-11 | 2006-02-23 | Hitachi Ltd | 車両故障診断装置および車載端末 |
| JP4338652B2 (ja) * | 2005-01-21 | 2009-10-07 | 三菱電機インフォメーションシステムズ株式会社 | 車両管理装置 |
| JP2007284027A (ja) * | 2006-04-20 | 2007-11-01 | Hino Motors Ltd | 車載故障診断制御装置 |
| JP4685731B2 (ja) * | 2006-08-28 | 2011-05-18 | 日立オートモティブシステムズ株式会社 | 移動体の診断装置、移動体の診断端末、およびインバータ装置 |
| JP2008308075A (ja) * | 2007-06-15 | 2008-12-25 | Honda Motor Co Ltd | メンテナンス時期報知装置 |
| JP2009012705A (ja) * | 2007-07-09 | 2009-01-22 | Denso Corp | 車両用機能異常対応装置および車両用機能異常対応装置用のプログラム |
| JP4928532B2 (ja) * | 2008-12-10 | 2012-05-09 | 本田技研工業株式会社 | 車両の故障診断装置 |
| JP6369485B2 (ja) * | 2016-02-22 | 2018-08-08 | マツダ株式会社 | 車両の表示装置 |
| KR101889049B1 (ko) * | 2017-08-11 | 2018-08-21 | (주)다이매틱스 | 딥러닝 기반의 인공지능을 이용한 자동차 진단 방법 및 장치 |
| JP7234898B2 (ja) * | 2019-10-25 | 2023-03-08 | トヨタ自動車株式会社 | 車両部品の残存寿命予測装置 |
| JP7279695B2 (ja) * | 2020-09-23 | 2023-05-23 | いすゞ自動車株式会社 | 寿命予測装置及び寿命予測方法 |
Also Published As
| Publication number | Publication date |
|---|---|
| DE112023005058T5 (de) | 2025-10-09 |
| JPWO2024262007A1 (ja) | 2024-12-26 |
| CN120548464A (zh) | 2025-08-26 |
Similar Documents
| Publication | Publication Date | Title |
|---|---|---|
| CN106406273B (zh) | 车辆中故障原因的确定 | |
| US8612079B2 (en) | Optimizing system performance using state of health information | |
| CN109699186B (zh) | 用于提供和应用诊断筛选列表的方法和系统 | |
| CN116415154B (zh) | 一种基于gpt的车辆故障解决方案生成方法及装置 | |
| KR20200104362A (ko) | 차량 고장 경고 시스템 및 대응하는 차량 고장 경고 방법 | |
| US20190217867A1 (en) | Method for operating an electrical system of a motor vehicle | |
| CN107776408B (zh) | 车辆系统、电池系统和电池系统的控制方法 | |
| KR102255599B1 (ko) | 차량 고장 진단 서비스 제공 시스템 및 방법 | |
| CN111284426A (zh) | 车辆故障根本原因诊断 | |
| CN118485421A (zh) | 预测用于一队车辆的维护维修 | |
| JP2022513149A (ja) | 搭載電源網内のエネルギ蓄積器を監視する方法 | |
| CN105762427A (zh) | 用于控制车辆中高压电池的装置和方法 | |
| JP7468778B2 (ja) | 車両異常検出装置及び車両異常検出方法 | |
| US20250045660A1 (en) | Equipment repair system and method | |
| CN116897379B (zh) | 用于确定底盘组件状态的方法和车辆系统 | |
| GB2501291A (en) | Diagnostic system with predicted problem cause feedback | |
| JP2019533416A (ja) | 車載電源システムを動作させる方法 | |
| CN119310459A (zh) | 用于预测设备电池组错误的方法及装置 | |
| CN112446979B (zh) | 利用车辆设备的数值数据的故障原因分析系统及方法 | |
| CN115113601A (zh) | 车辆管理装置、车辆管理方法和计算机可读存储介质 | |
| CN114616561A (zh) | 确定技术设备的系统行为与标准值范围的不允许偏差的方法 | |
| CN120548464A (zh) | 车辆劣化预测系统及车辆劣化预测方法 | |
| Shivakarthik et al. | Maintenance of automobiles by predicting system fault severity using machine learning | |
| Raffik et al. | Artificial Intelligence-Based Predictive Maintenance Approaches for Vehicle Condition Monitoring and On-Board Diagnostic Systems to Enhance Automotive Industries | |
| KR20240087314A (ko) | 차량고장 예측 방법 및 시스템 |
Legal Events
| Date | Code | Title | Description |
|---|---|---|---|
| 121 | Ep: the epo has been informed by wipo that ep was designated in this application |
Ref document number: 23942438 Country of ref document: EP Kind code of ref document: A1 |
|
| WWE | Wipo information: entry into national phase |
Ref document number: 2025527384 Country of ref document: JP |
|
| WWE | Wipo information: entry into national phase |
Ref document number: 202380091711.1 Country of ref document: CN |
|
| WWE | Wipo information: entry into national phase |
Ref document number: 112023005058 Country of ref document: DE |
|
| WWP | Wipo information: published in national office |
Ref document number: 202380091711.1 Country of ref document: CN |
|
| WWP | Wipo information: published in national office |
Ref document number: 112023005058 Country of ref document: DE |
|
| 122 | Ep: pct application non-entry in european phase |
Ref document number: 23942438 Country of ref document: EP Kind code of ref document: A1 |