WO2024257511A1 - 集配中継地点決定装置および集配中継地点決定方法 - Google Patents
集配中継地点決定装置および集配中継地点決定方法 Download PDFInfo
- Publication number
- WO2024257511A1 WO2024257511A1 PCT/JP2024/017232 JP2024017232W WO2024257511A1 WO 2024257511 A1 WO2024257511 A1 WO 2024257511A1 JP 2024017232 W JP2024017232 W JP 2024017232W WO 2024257511 A1 WO2024257511 A1 WO 2024257511A1
- Authority
- WO
- WIPO (PCT)
- Prior art keywords
- collection
- delivery
- relay point
- relay
- determination device
- Prior art date
- Legal status (The legal status is an assumption and is not a legal conclusion. Google has not performed a legal analysis and makes no representation as to the accuracy of the status listed.)
- Ceased
Links
Images








Classifications
-
- B—PERFORMING OPERATIONS; TRANSPORTING
- B65—CONVEYING; PACKING; STORING; HANDLING THIN OR FILAMENTARY MATERIAL
- B65G—TRANSPORT OR STORAGE DEVICES, e.g. CONVEYORS FOR LOADING OR TIPPING, SHOP CONVEYOR SYSTEMS OR PNEUMATIC TUBE CONVEYORS
- B65G61/00—Use of pick-up or transfer devices or of manipulators for stacking or de-stacking articles not otherwise provided for
-
- G—PHYSICS
- G06—COMPUTING OR CALCULATING; COUNTING
- G06Q—INFORMATION AND COMMUNICATION TECHNOLOGY [ICT] SPECIALLY ADAPTED FOR ADMINISTRATIVE, COMMERCIAL, FINANCIAL, MANAGERIAL OR SUPERVISORY PURPOSES; SYSTEMS OR METHODS SPECIALLY ADAPTED FOR ADMINISTRATIVE, COMMERCIAL, FINANCIAL, MANAGERIAL OR SUPERVISORY PURPOSES, NOT OTHERWISE PROVIDED FOR
- G06Q10/00—Administration; Management
- G06Q10/08—Logistics, e.g. warehousing, loading or distribution; Inventory or stock management
- G06Q10/083—Shipping
Definitions
- the present invention relates to a collection and delivery relay point determination device and a collection and delivery relay point determination method.
- Patent Document 1 In recent years, drones and other flying objects have been put to practical use in logistics, and one example is described in Patent Document 1.
- Patent Document 1 discloses a parcel delivery system that includes a receiving point setting unit that sets a point on the route taken by a parcel recipient who is away from a delivery destination, where an aircraft flying in the air can land, as the receiving point, and an estimated arrival time acquisition unit that acquires the estimated arrival time at which the recipient will arrive at the receiving point, and an operation plan creation unit that creates an operation plan for the aircraft holding the parcel so that the aircraft will arrive at the receiving point at the estimated arrival time.
- Some areas requiring collection and delivery services have low population density, are located far from collection and delivery centers, and are connected by narrow roads.
- the low population density means that the distances between collection and delivery centers are long, which in turn means that the distances between collection and delivery centers and collection and delivery points are also long.
- roads are often not well maintained, making it necessary to transport goods long distances via narrow roads.
- the only means of transportation that can pass through narrow roads are small vehicles with low load capacity (weight). In other words, collection and delivery requires repeated round trips between collection and delivery centers and collection and delivery points, which is an obstacle to reducing costs.
- the present invention has been made in consideration of the above, and aims to provide a collection and delivery relay point determination device and a collection and delivery relay point determination method that can reduce the cost of collection and delivery operations.
- the present application includes multiple means for solving the above problem, but one example is a collection and delivery relay point determination device that determines relay points in a collection and delivery area where collection and delivery means and relay transport means transfer items for collection and delivery, and includes a processor, which reads relay point candidates, a collection and delivery area population density indicating the population density of the collection and delivery area including the collection and delivery destination, and a handling occurrence rate, calculates relay point intervals using the collection and delivery area population density and the handling occurrence rate, divides the collection and delivery area based on the relay point intervals, sets multiple collection and delivery sections, sets the positions of relay points from among the relay point candidates for each collection and delivery section, and outputs the positions of the relay points.
- the present invention makes it possible to reduce the costs of collection and delivery operations.
- FIG. 1 is a diagram showing a basic collection and delivery process.
- FIG. 13 is a diagram showing the relationship between the total weight handled in a collection and delivery area, the handling means, and the load capacity.
- 1 is a diagram illustrating a collection and delivery relay point determination device in a collection and delivery system together with related configuration.
- FIG. 11 is a diagram showing an example of a process for determining a relay point.
- FIG. 13 is a diagram showing a case where an equilateral triangle is used as a regular polygon capable of regular plane tessellation.
- FIG. 13 is a diagram showing a case where a square is used as a regular polygon capable of regular tessellation.
- FIG. 13 is a diagram showing a case where a regular hexagon is used as a regular polygon capable of regular plane tessellation.
- 10 is a flowchart showing the process of relay point determination processing for determining relay points by a collection and delivery relay point determination device;
- FIG. 13 is a diagram showing an example of setting a collection and delivery area by filling a regular plane with squares and setting relay points.
- FIG. 10 is a diagram showing a case where collection and delivery sections (meshes) and relay points are set when the population density is 1/4 compared to the case of FIG. 9 .
- FIG. 11 is a diagram showing an example of the relationship between the population density of a collection and delivery area and the installation density of relay points.
- FIG. 13 is a diagram showing an example of differences in usage status of relay points when demand for collection and delivery varies from day to day.
- FIG. 13 is a diagram showing an example of differences in usage status of relay points when demand for collection and delivery varies from day to day.
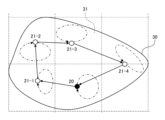
- FIG. 13 is a diagram showing an example of a case where some or all of a plurality of relay points are visited multiple times on a day of high demand to transship items.
- FIG. 13 is a diagram showing an example of the arrangement of relay points when the width of a collection and delivery area is less than the interval between relay points.
- FIG. 13 is a diagram showing an example of the placement of relay points when the width of a collection and delivery area is less than the interval between relay points, and when additional relay points are used on days of high demand.
- FIG. 13 is a diagram showing an example of differences in usage status of relay points when demand for collection and delivery varies from day to day.
- FIG. 13 is a diagram showing an example of differences in usage status of relay points when demand for collection and delivery
- FIG. 13 is a diagram showing an example of a case where the same relay point is visited multiple times on a day of high demand to transship items.
- FIG. 13 is a diagram showing the change in the load of a collection and delivery vehicle over time during delivery, and shows the state during normal demand.
- FIG. 13 is a diagram showing the change in the load of a collection and delivery vehicle over time during delivery, and shows the state during times of high demand.
- FIG. 13 is a diagram showing the change in the load of a collection/delivery vehicle over time during collection, and shows the state during normal demand.
- FIG. 13 is a diagram showing the change in the load of a collection/delivery vehicle over time during collection, and shows the state during times of high demand.
- Figure 1 shows the basic collection and delivery process for this embodiment.
- a collection and delivery base 20 (logistics base) that serves as the base for collection and delivery of items
- a collection and delivery means 10 that travels to multiple (m locations) collection and delivery destinations 22-1 to 22-m (m is a positive integer) to collect and deliver the items
- at least one (n locations) relay point 21-1 to 21-n (n is a positive integer) where the collection and delivery means 10 is incorporated into a collection and delivery route that travels to multiple collection and delivery destinations 22-1 to 22-m and relays items transported between the collection and delivery base 20, and relay transport means 11-1 to 11-n (n is a positive integer) that transport the items between each of the relay points 21-1 to 21-n and the collection and delivery base 20.
- selection includes both “collection” of collecting and storing items from the collection and delivery destination, and “delivery” of delivering items to the collection and delivery destination, and can refer to either collection or delivery, or both. Note that in this embodiment, for simplicity, the explanation is sometimes limited to the case of delivery, but the present invention can also be applied to the case of collection or both collection and delivery.
- the collection and delivery means 10 leaves the collection and delivery base 20, then travels around the relay points 21-1 to 21-n and collection and delivery destinations 22-1 to 22-m within the collection and delivery area 30 before returning to the collection and delivery base 20.
- the relay transport means 11-1 to 11-n transport the items between the collection and delivery base 20 and the relay points 21-1 to 21-n, respectively, and transfer the items between the collection and delivery means 10 at the relay points 21-1 to 21-n.
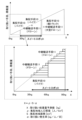
- Figure 2 shows the relationship between the total weight handled in the collection and delivery area and the handling means and load capacity, with the horizontal axis showing the total weight handled X and the vertical axis showing the handling means and their load capacity.
- the collection and delivery means 10 is a motorbike with a maximum load capacity of 30 kg
- the total handling weight X in the collection and delivery area 30 is less than 30 kg, which is the maximum load capacity of the collection and delivery means 10 (motorcycle)
- collection and delivery in the collection and delivery area 30 can be performed by just one collection and delivery means 10 (motorcycle).
- load capacity can also be rephrased as "load weight.”
- the collection and delivery means 10 is a motorcycle with a maximum load capacity of 30 kg
- the relay transport means 11 is an air vehicle such as a drone
- the relay transport means 11 transports the items between the collection and delivery base 20 and relay points 21-1 to 21-n, and the items are transferred between the collection and delivery means 10 (motorcycle) and the relay transport means 11 (drone).
- the collection and delivery system eliminates the need to make multiple round trips between the collection and delivery base 20 and the collection and delivery area 30 with the collection and delivery means 10 (motorcycle) or to prepare multiple collection and delivery means 10 (motorcycles), thereby improving the efficiency of collection and delivery.
- FIG. 2 an example is shown in which a motorcycle with a maximum load capacity of 30 kg is used as the collection and delivery means 10, and a drone with a maximum load capacity of 5 kg is used as the relay transport means 11.
- this is not limited to this, and it is also possible to use a light truck with a maximum load capacity of 350 kg as the collection and delivery means 10, or a large drone with a maximum load capacity of 30 kg or more as the relay transport means 11.
- FIG. 3 is a diagram showing the collection and delivery relay point determination device and related configuration in the collection and delivery system according to this embodiment.
- the collection and delivery relay point determination device 220 determines the number and locations of relay points 21-1 to 21-n to improve the efficiency of collection and delivery in the collection and delivery area 30.
- the collection and delivery system's collection and delivery relay point determination device 220 is configured to include collection and delivery map information 110 having information such as relay point candidate data, topographical data, and collection and delivery section area s, a population density database 120 having population density ⁇ data, and handling record information 130 having handling occurrence rate ⁇ data.
- the collection and delivery relay point determination device 220 uses the relay point candidate and collection and delivery section area s information from the collection and delivery map information 110, the population density ⁇ data from the population density database 120, and the handling occurrence rate ⁇ information from the handling record information 130 to determine the number and locations of relay points 21-1 to 21-n, and outputs this as relay point data 420.
- relay point data 420 may also be optimal output data.
- the method of dividing the collection and delivery area 30 and calculating its area should be the same as the method of calculating the area that is the denominator when calculating the population density ⁇ .
- population density is calculated using the population and area of each administrative division, such as prefecture, state, province, district, county, municipality, city, town, village, etc., so the area of the collection and delivery area 30 should also be calculated based on the area on a map in units of town names or block codes that make up the collection and delivery area.
- the area of each administrative division is calculated without taking into account the presence or absence of houses, so the area of the collection and delivery area 30 should also be calculated without taking into account the presence or absence of houses.
- the area of the collection and delivery area 30 is calculated taking into account the presence or absence of houses, the area will be smaller than when the population density ⁇ is calculated, and the predicted values for the population and handling volume will be smaller. Even if street addresses are used to display addresses, it is easier to calculate the area by dividing the collection and delivery area 30 according to block addresses.
- Figure 4 shows an example of the process for determining relay points.
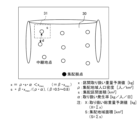
- the collection and delivery area 30 is divided into collection and delivery sections 31 of equal area, and relay point candidates are selected for each collection and delivery section while taking into consideration geographical constraints, etc. Furthermore, it is possible to determine optimal relay points by optimizing the area of each collection and delivery section 31.
- x is the predicted weight handled in the section [kg]
- ⁇ is the population density of the collection and delivery area [people/km 2 ]
- s is the area of the collection and delivery section [km 2 ]
- ⁇ is the handling occurrence rate [kg/person/day].
- One method of dividing a plane is to use tessellation, in which a finite number of plane figures are used to cover the entire plane without gaps.
- tessellation it is preferable to use a regular tessellation, in which a single type of regular polygon is used to fill the plane, from the standpoint of isotropy and uniformity of area.
- Figure 5 shows the case where equilateral triangles are used as regular polygons that can be used for regular plane tessellation
- Figure 6 shows the case where squares are used
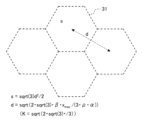
- Figure 7 shows the case where regular hexagons are used.
- the relay point interval d which is the distance between midpoints, can be generalized by the following (Equation 4) using the coefficient K, the margin coefficient ⁇ , the collection and delivery area population density ⁇ , and the handling occurrence rate ⁇ .
- Equation 4 K ⁇ sqrt( ⁇ xmax/( ⁇ )) (Formula 4)
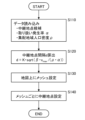
- FIG. 8 is a flowchart showing the process of determining relay points by the collection and delivery relay point determination device.
- the collection and delivery relay point determination device 220 first reads relay point candidates from the collection and delivery map information 110, data on the collection and delivery area population density ⁇ from the population density database 120, and the handling occurrence rate ⁇ from the handling record information 130 (step S110).
- the relay point interval d is calculated using the above formula (4) (step S120).
- the value of the coefficient K applied to formula (4) is determined by the type of regular polygon used for the regular plane tessellation (equilateral triangle, square, regular hexagon).
- a mesh (collection and delivery area) of a regular plane filling pattern using the selected regular polygons is set on the map (step S130).
- relay points are set from the relay point candidates for each mesh (collection and delivery area) set in step S130 (step S140). Note that it is desirable for the relay points to be as close as possible to the center of gravity of the mesh (collection and delivery area), but it is better to select a point as close as possible to the center of gravity while taking into consideration geographical conditions such as not being surrounded by natural barriers such as mountains or rivers, facing a road of a certain width, being away from residential areas, etc.
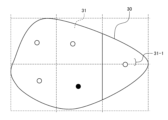
- Figure 9 shows an example of how to set up a collection and delivery area (mesh) using squares to fill a regular plane ( Figure 6) and set relay points.
- the collection and delivery sections 31-1 to 31-5 which are made up of meshes with odd areas, are made up of two adjacent meshes whose total area is roughly the same as that of one mesh, and relay points are placed near the focal points of each collection and delivery section.
- Figure 10 shows a case where collection and delivery areas (meshes) and relay points are set when the population density is, for example, 1/4 compared to the case in Figure 9.
- the collection and delivery section 31-1 which is made up of a mesh with an odd area, is made up of two adjacent meshes whose total area is almost that of one mesh, and relay points are placed near the focal points of the collection and delivery section.
- Fig. 11 is a diagram showing an example of the relationship between the population density of a collection and delivery area and the installation density of relay points in this embodiment.
- the horizontal axis shows the population density [people/ km2 ]
- the vertical axis shows the installation density of relay points [locations/ km2 ].
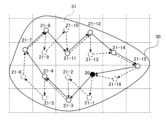
- Figures 12 and 13 show an example of the difference in the usage status of relay points when the demand for collection and delivery varies from day to day.
- the demand for collection and delivery may be higher after the holidays than on weekdays.
- the demand for collection and delivery of ski equipment may increase during the ski season, and the demand for collection and delivery of golf equipment may increase on holidays, and it may be necessary to introduce larger collection and delivery means 10 and relay transport means 11 that can transport cargo the size of such equipment.
- all relay points 21-1 to 21-16 may be used, and on days when there is normal demand, some of the relay points 21-1, 21-2, 21-5, 21-6, 21-9, 21-10, 21-13, and 21-16 may not be used.
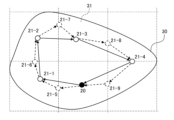
- relay points 21-1 to 21-4 can be set on days with normal demand, and additional relay points 21-5 to 21-9 can be used on days with high demand.
- Figure 15 shows an example of the placement of relay points when the width of the collection and delivery area is less than the interval between relay points.
- the collection and delivery area is narrow and blocked by natural barriers such as mountains, rivers, or the sea, and the width is less than the interval between relay points, first draw a smooth curve (e.g., a spline curve) passing through the relay points on the map, and calculate the area of the collection and delivery area divided by the perpendicular lines of the obtained smooth curve as the collection and delivery section area s.
- the relay points are set so that the load capacity (section handling weight prediction value x) of the collection and delivery means 10 at each relay point obtained from the calculated collection and delivery section area s does not exceed the maximum load capacity of the collection and delivery means 10, i.e., so as to satisfy the condition in (Equation 2) above. Note that when prediction errors and daily fluctuations in the section handling weight are taken into consideration, a margin is added to the condition expressed in (Equation 2) above, and the condition expressed in (Equation 3) above is used.
- FIG. 16 is a diagram showing an example of the placement of relay points when the width of the collection and delivery area is less than the interval between relay points as shown in FIG. 15, and additional relay points are used on days of high demand.
- FIG. 17 is a diagram showing an example of the case where the same relay point is visited multiple times on days of high demand to transfer items for collection and delivery.
- Figures 18 and 19 show the change in the load of a collection and delivery vehicle over time during delivery, with Figure 18 showing a time of normal demand and Figure 19 showing a time of high demand.
- the horizontal axis shows time (in other words, distance traveled) and the vertical axis shows the load.
- the relay points 21-1 and 21-3 are skipped, and only the relay points 21-2 and 21-4 are passed through.
- the collection and delivery means 10 leaves the collection and delivery base 20, it is loaded with an amount close to the maximum load, and the load decreases as the delivery proceeds.
- the relay points 21-2 and 21-4 are reached with the remaining load. This is because if the relay points 21-2 and 21-4 were always approached after the load reached 0 (zero), there would be no room for the collection and delivery means 10 to select the order of the collection and delivery points and relay points.
- FIG. 19 for example, in the case of high demand (e.g., the day after a holiday), all relay points 21-1 to 21-4 are passed through. Note that the relay points to be skipped may be changed depending on the demand for each day.
- Figures 20 and 21 show the change in the load of a collection/delivery vehicle over time during collection, with Figure 20 showing a time of normal demand and Figure 21 showing a time of high demand.
- the horizontal axis shows time (in other words, distance traveled) and the vertical axis shows the load.
- the relay points 21-1 and 21-3 are skipped, and only the relay points 21-2 and 21-4 are passed through.
- the load of the collection and delivery means 10 is almost 0 (zero) when the collection and delivery base 20 is departed, and the load increases as collection and delivery progresses.
- the relay points 21-2 and 21-4 are reached with a margin up to the maximum load.
- the collection and delivery means is incorporated into a collection and delivery route, which is a route along which items are collected and delivered to one or more collection and delivery destinations, and the number and location of at least one relay point where items are relayed and transported by a relay transport means between the collection and delivery base, which is the base for the collection and delivery of the items, is determined so that the predicted section handling volume of items in each section divided by the relay points on the collection and delivery route does not exceed the maximum load capacity of the collection and delivery means, and the number and location of the relay points are output, thereby reducing the costs of collection and delivery operations.
- adding a relay transport means to one light vehicle and collection and delivery worker can reduce the need for repeated round trips between the collection and delivery base and collection and delivery points, making collection and delivery operations more efficient. Also, by determining the installation intervals of relay points so that the predicted section handling volume on the route between the collection and delivery destinations of the collection and delivery means between relay points does not exceed the maximum load capacity of the collection and delivery means, it is possible to continue collection and delivery by the collection and delivery means while utilizing relay transport by the relay transport means, while ensuring that the weight of the items to be collected and delivered does not exceed the maximum load capacity.
- the present invention is not limited to the above-described embodiment, and includes various modifications and combinations within the scope of the gist of the present invention.
- the present invention is not limited to those having all the configurations described in the above-described embodiment, and includes those in which some of the configurations are deleted.
- Each of the configurations and functions described in the present embodiment may be realized by designing a part or all of them, for example, in an integrated circuit.
- Each of the configurations and functions described above may be realized by software, in which a processor interprets and executes a program that realizes each function.
Landscapes
- Business, Economics & Management (AREA)
- Engineering & Computer Science (AREA)
- Economics (AREA)
- Quality & Reliability (AREA)
- Entrepreneurship & Innovation (AREA)
- Human Resources & Organizations (AREA)
- Marketing (AREA)
- Operations Research (AREA)
- Development Economics (AREA)
- Strategic Management (AREA)
- Tourism & Hospitality (AREA)
- Physics & Mathematics (AREA)
- General Business, Economics & Management (AREA)
- General Physics & Mathematics (AREA)
- Theoretical Computer Science (AREA)
- Management, Administration, Business Operations System, And Electronic Commerce (AREA)
Abstract
集配地域における、集配手段と中継輸送手段とが集配物の積替えを行う中継地点を決定する集配中継地点決定装置であって、プロセッサーを備え、プロセッサーは、中継地点候補と、集配先を含む集配地域の人口密度を示す集配地域人口密度と、取り扱い発生率を読み込み、集配地域人口密度と取り扱い発生率とを用いて、中継地点間隔を算出し、中継地点間隔に基づいて、集配地域を分割し、複数の集配区間を設定し、集配区間ごとに、中継地点候補の中から中継地点の位置を設定し、中継地点の位置を出力する。これにより、集配業務のコストダウンを図ることができる。
Description
本発明は、集配中継地点決定装置および集配中継地点決定方法に関する。
近年、ドローンなどの飛行体による物流の実用化が進められており、例えば、特許文献1に記載のものが知られている。
特許文献1には、空中を飛行する飛行体が降下可能な地点であって、配達先から外出している荷物の受取人が前記配達先へと向かう経路上の地点を受取地点として設定する受取地点設定部と、前記受取人が前記受取地点に到着する到着予定時刻を取得する到着予定時刻取得部と、前記荷物を保持している前記飛行体が前記到着予定時刻に前記受取地点に到着するように前記飛行体の運行計画を作成する運行計画作成部と、を備える荷物配達システムが開示されている。
しかしながら、上記従来技術においては、スケールメリットによるコスト対効果から都市部を対象とすることが多い。
一方、物流に求められるユニバーサルサービスとしての役割を考えると、全国規模での利便性を担保しつつ、スケールメリットによるコスト対効果を見込むことが困難である地方での集配業務のコストダウンを図ることが望ましい。
集配業務を必要とする地域には、人口密度が低く、集配拠点から遠隔地にあり、狭隘道路により結ばれているような地域もある。このような場合、人口密度が低いために集配拠点間の距離も長くなり、それに伴って集配拠点と集配地点間の距離も長くなることがとなる。また道路の整備も行き届いていないことも多いため狭隘道路を経由しての長距離にわたる運搬が必要になる。さらには狭隘道路を通過することができる運搬手段として積載量(重量)の小さな小型車両に限られている。すなわち、集配のためには集配拠点と集配地点間を繰り返し往復して運搬を行うことが必要となり、コストダウンの妨げとなっている。
ユニバーサルサービスのためのコストは地方に限らず都市部の利用者も含めて利用者があまねく負担する場合が多いため、地方での集配業務のコストダウンは、ひいては都市部の利用者も含めてユニバーサルサービスのためのコスト負担の削減につながる。
本発明は上記に鑑みてなされたものであり、集配業務のコストダウンを図ることができる集配中継地点決定装置及び集配中継地点決定方法を提供することを目的とする。
本願は上記課題を解決する手段を複数含んでいるが、その一例を挙げるならば、集配地域における、集配手段と中継輸送手段とが集配物の積替えを行う中継地点を決定する集配中継地点決定装置であって、プロセッサーを備え、前記プロセッサーは、中継地点候補と、集配先を含む集配地域の人口密度を示す集配地域人口密度と、取り扱い発生率を読み込み、前記集配地域人口密度と前記取り扱い発生率とを用いて、中継地点間隔を算出し、前記中継地点間隔に基づいて、集配地域を分割し、複数の集配区間を設定し、前記集配区間ごとに、前記中継地点候補の中から中継地点の位置を設定し、前記中継地点の位置を出力するものとする。
本発明によれば、集配業務のコストダウンを図ることができる。
以下、本発明の実施の形態について図面を参照しつつ説明する。
図1は、本実施の形態に係る基本的な集配の様子を示す図である。
図1に示すように、本実施の形態に係る集配システムを適用した集配の対象となる集配地域30には、集配物の集配の拠点となる集配拠点20(物流拠点)と、複数(m箇所)の集配先22-1~22-m(mは正の整数)を巡って集配物の集配を行う集配手段10と、集配手段10が複数の集配先22-1~22-mを巡る集配経路に組み込まれ、集配拠点20との間で輸送される集配物の中継を行う少なくとも1つ(n箇所)の中継地点21-1~21-n(nは正の整数)と、中継地点21-1~21-nのそれぞれと集配拠点20との間で集配物を輸送する中継輸送手段11-1~11-n(nは正の整数)とが配置される。
ここで、「集配」とは、集配先から集配物を回収して預かる「集荷」と、集配先に集配物を届ける「配達」の両者を含むものであり、集荷と配達の何れか一方、或いは、両方を示している。なお、本実施の形態においては、説明の簡単のために、配達の場合に限定して説明する場合もあるが、集荷の場合や集荷と配達と両方の場合においても本願発明を適用することが可能である。
集配地域30において、集配手段10は集配拠点20を出庫後、集配地域30内の中継地点21-1~21-n、集配先22-1~22-mを巡回して集配拠点20に帰庫する。この間、中継輸送手段11-1~11-nは集配拠点20と中継地点21-1~21-nのそれぞれ間で集配物を運搬し、中継地点21-1~21-nにおいて集配手段10との間で集配物の積替えを行う。
図2は、集配地域の取り扱い総重量と取り扱い手段及び積載量との関係を示す図であり、横軸には取り扱い総重量Xを、縦軸に取り扱い手段とその積載量をそれぞれ示している。
図2に示すように、例えば、集配手段10が最大積載量30kgのバイクであるとすると、集配地域30の取り扱い総重量Xが集配手段10(バイク)の最大積載量である30kg未満の時には、1台の集配手段10(バイク)だけで集配地域30の集配を行うことができる。なお、「積載量」は「積載重量」と言い換えることもできる。
また、例えば、集配手段10が最大積載量30kgのバイク、中継輸送手段11がドローンなどの飛行体であるとすると、集配地域30の取り扱い総重量Xが集配手段10(バイク)の最大積載量である30kgを超える場合には、中継輸送手段11(ドローン)により集配拠点20と中継地点21-1~21-nの間で集配物を運搬し、集配手段10(バイク)と中継輸送手段11(ドローン)との間で集配物の積替えを行う。以上のように、本実施の形態に係る集配システムよれば、集配拠点20と集配地域30の間を集配手段10(バイク)で何度も往復したり、複数台の集配手段10(バイク)を用意したりする必要がなくなり、集配の効率化を図ることができる。
なお、図2においては、集配手段10として最大積載量30kgのバイクを、中継輸送手段11として最大積載量5kgのドローンを使用する場合を例示して説明しているが、これに限られず、集配手段10として最大積載量350kgの軽トラックを使用したり、中継輸送手段11として最大積載量30kg以上の大型ドローンを使用したりすることも考えられる。
図3は、本実施の形態に係る集配システムにおける集配中継地点決定装置を関連構成とともに抜き出して示す図である。
集配中継地点決定装置220は、集配地域30に対して集配の効率化のために中継地点21-1~21-nの設置数及び設置位置を決定するものである。
図3に示すように、集配システムの集配中継地点決定装置220に係る構成は、中継地点候補のデータ、地形データ、集配区間面積sなどの情報を有する集配地図情報110と、人口密度ρのデータを有する人口密度データベース120と、取り扱い発生率αのデータを有する取り扱い実績情報130とを備えている。集配中継地点決定装置220は、集配地図情報110からの中継地点候補および集配区間面積sの情報と、人口密度データベース120からの人口密度ρのデータと、取り扱い実績情報130からの取り扱い発生率αの情報とを用いて、中継地点21-1~21-nの設置数及び設置位置を決定し、中継地点データ420として出力する。なお、中継地点データ420を最適な出力データとしても良い。
なお、集配地域30の区分決定及び面積の算出方法は人口密度ρを算出する際の分母となる面積の算出方法に合わせるのが良い。通常の場合、人口密度は都道府県(prefecture)、州(state, province)、郡(district, county)、市町村(municipalitycity, town, village)等の行政区画ごとの人口と面積を用いて算出しているため、集配地域30の面積もこれに合わせて集配地域の範囲となる町名または街区符号単位で地図上の面積によるのが良い。通常、行政区画ごとの面積は家の有無を考慮して算出していないため、集配地域30の面積も家の有無を考慮せずに算出したほうが良い。もし家の有無を考慮して集配地域30の面積を算出すると、人口密度ρの算出時よりも面積が小さくなり、人口及び取扱量の予測値はより小さな値となる。住所の表示に道路標示(street address)を用いている場合も街区標示(block address)に従って集配地域30を区分決定したほうが面積の算出が容易である。
図4は、中継地点の決定工程の一例を示す図である。
図4に示すように、中継地点の決定に際しては、集配地域30を均等な面積をもつ集配区間31に分割し、それぞれの集配区間ごとに中継地点候補から地理的制約などを考慮しながら選定し、さらに、それぞれの集配区間31の面積を最適化することで、最適な中継地点を決定することも可能である。
まず、それぞれの集配区間の面積sの最適化にあたり、まず面積sが満たすべき条件を設定する。各中継地点に属する配達区間における区間取り扱い重量予測値xは、下記の(式1)により算出される。
x=ρ・s・α ・・・(式1)
x=ρ・s・α ・・・(式1)
ここで、xは区間取り扱い重量予測値[kg]、ρは集配地域人口密度[人/km2]、sは集配区間面積[km2]、αは取り扱い発生率[kg/人/日]である。
なお、図2において挙げた取り扱い総重量予測値X[kg]及び集配地域面積S[km2]は、それぞれ、区間取り扱い重量予測値x[kg]及び集配区間面積s[km2]に対して、X=Σx、S=Σsという関係にある。
ここで、集配手段10に中継輸送手段11を併用した集配方法が成立するためには、各中継地点における集配手段10の積載量(区間取り扱い重量予測値x)が集配手段10の最大積載量を超えないことが必要、すなわち、下記の(式2)で表される条件を満たすことが必要である。
x=ρ・s・α<xmax ・・・(式2)
x=ρ・s・α<xmax ・・・(式2)
また、区間取り扱い重量の予測誤差や日々の変動を考えた場合には、上記の(式2)で表される条件に余裕を持たせて、下記の(式3)で表される条件を用いる。
x=ρ・s・α=β・xmax ・・・(式3)
x=ρ・s・α=β・xmax ・・・(式3)
ここで、βは余裕係数(β=0.5~0.8)である。
続いて、集配地域30を集配区間31に分割する方法について説明する。
平面を分割する方法としては、平面内を有限種類の平面図形で隙間なく敷き詰める平面充填が考えられる。また、平面充填を用いる場合には、等方性、面積の均等性の観点から、1種類の正多角形で充填する正平面充填が望ましい。
図5は、正平面充填が可能な正多角形として正三角形を用いる場合を、図6は正方形を用いる場合を、図7は正六角形を用いる場合をそれぞれ示す図である。
正三角形による正平面充填(図5)、正方形による性平面充填(図6)、及び、正六角形による正平面充填(図7)のそれぞれの場合について、中間点同士の間隔である中継地点間隔dは、係数K、余裕係数β、集配地域人口密度ρ、取り扱い発生率αを用いて、下記の(式4)により一般化することができる。
d=K・sqrt(β・xmax/(ρ・α)) ・・・(式4)
d=K・sqrt(β・xmax/(ρ・α)) ・・・(式4)
図5に示す正三角形による正平面充填の場合には、集配区間面積sは下記の(式5)により求められる。
s=3・sqrt(3)d2/4 ・・・(式5)
s=3・sqrt(3)d2/4 ・・・(式5)
したがって、中継地点間隔dは、上記の(式4)と(式5)とから得られる下記の(式6)により求められる。
d=2・sqrt(sqrt(3)・β・xmax/(ρ・α))/3 ・・・(式6)
d=2・sqrt(sqrt(3)・β・xmax/(ρ・α))/3 ・・・(式6)
このとき、係数K=2・sqrt(sqrt(3))/3である。
図6に示す正方形による正平面充填の場合には、集配区間面積sは下記の(式7)により求められる。
s=d2 ・・・(式7)
s=d2 ・・・(式7)
したがって、中継地点間隔dは、上記の(式4)と(式7)とから得られる下記の(式8)により求められる。
d=sqrt(β・xmax/(ρ・α)) ・・・(式8)
d=sqrt(β・xmax/(ρ・α)) ・・・(式8)
このとき、係数K=1である。
図7に示す正六角形による正平面充填の場合には、集配区間面積sは下記の(式9)により求められる。
s=sqrt(3)d2/2 ・・・(式9)
s=sqrt(3)d2/2 ・・・(式9)
したがって、中継地点間隔dは、上記の(式4)と(式9)とから得られる下記の(式10)により求められる。
d=sqrt(2・sqrt(3)・β・xmax/(3・ρ・α)) ・・・(式10)
d=sqrt(2・sqrt(3)・β・xmax/(3・ρ・α)) ・・・(式10)
このとき、係数K=sqrt(2・sqrt(3)・/3)である。
図8は、集配中継地点決定装置により中継地点を決定する中継地点決定処理の処理内容を示すフローチャートである。
図8において、集配中継地点決定装置220は、まず、集配地図情報110からの中継地点候補、人口密度データベース120からの集配地域人口密度ρのデータ、及び、取り扱い実績情報130からの取り扱い発生率αを読み込む(ステップS110)。
続いて、中継地点間隔dを上記の(式4)により算出する(ステップS120)。なお、(式4)に適用する係数Kの値は、正平面充填に用いる正多角形の種類(正三角形、正方形、正六角形)により定まる。
続いて、ステップS130で算出した中継地点間隔dに基づいて、選択した正多角形による正平面充填パターンのメッシュ(集配区間)を地図上に設定する(ステップS130)。
続いて、ステップS130で設定したメッシュ(集配区間)ごとに中継地点候補の中から中継地点を設定する(ステップS140)。なお、中継地点はメッシュ(集配区間)の重心に出来るだけ近い方が望ましいが、例えば、山や川などの自然の障壁に囲まれていない、ある程度の広さの道路に面している、住宅地から離れている等の地理的条件などを考慮しながら、重心に出来るだけ近い地点を選択するのが良い。
図9は、正方形による正平面充填(図6)で集配区間(メッシュ)を設定し、中継地点の設定を行う場合の一例を示す図である。
図9に示すように、中途半端な面積のメッシュから構成されている集配区間31-1~31-5は、面積の合計がほぼメッシュ1つ分の面積となるように隣接する2つのメッシュから構成し、各集配区間の重点近くにそれぞれ中継地点を配置する。
図10は、図9の場合と比較して、例えば、人口密度が1/4である場合に、集配区間(メッシュ)及び中継地点を設定した場合を示す図である。
図10に示すように、図9の場合に比べて人口密度が1/4の場合には、メッシュの面積sは1/4に、中継地点間隔dは1/2になる。なお、この場合にも、中途半端な面積のメッシュから構成されている集配区間31-1は、面積の合計がほぼメッシュ1つ分となるように隣接する2つのメッシュから構成し、集配区間の重点近くに中継地点を配置する。
なお、正三角形による正平面充填(図5)や正六角形による正平面充填(図7)で集配区間(メッシュ)を設定する場合も同様である。
図11は、本実施の形態における集配地域の人口密度と中継地点の設置密度との関係の一例を示す図である。図11においては、横軸に人口密度[人/km2]を、縦軸に中継地点の設置密度[箇所/km2]をそれぞれ示している。
図11に示すように、本実施の形態における集配システムの集配中継地点決定装置220によれば、中継地点の設置密度と集配地域の人口密度との間に相関をみることができる。
図12及び図13は、集配の需要が日によって異なる場合の中継地点の使用状態の違いの一例を示す図である。
例えば、日々の集配量がほぼ一定であっても、休日には集配が休みである場合には、休日明けに平日よりも集配の需要が高まることが考えられる。また、集配地域にスキー場やゴルフ場がある場合には、スキーシーズンはスキー用具を集配する需要が高まり、休日にはゴルフ用具を集配する需要が高まることもあり、これらの用具の寸法の貨物を運搬できるより大型の集配手段10及び中継輸送手段11を投入することも考えられる。
図12に示すように、例えば、集配の需要が高い日(高需要の日)には、全ての中継地点21-1~21-16を使用し、通常需要の日には一部の中継地点21-1,21-2,21-5,21-6,21-9,21-10,21-13,21-16を使用しないことが考えられる。
また、図13に示すように、例えば、通常需要の日を想定して中継地点21-1~21-4を設定しておき、高需要の日には追加で設定した中継地点21-5~21-9も使用することが考えられる。
また、図14に示すように、例えば、高需要の日には、複数の中継地点21-1~21-4(集配拠点20を含む)のうちの一部または全部を複数回訪れて集配物を積み替えることが考えられる。
図15は、集配地域の幅が中継地点間隔未満である場合の中継地点の配置の一例を示す図である。
図15に示すように、集配地域が山や川、海等の自然障壁に阻まれて狭隘で、幅が中継地点間隔未満である場合には、まず、中継地点を通る平滑曲線(例えばスプライン曲線)を地図上に引き、得られた平滑曲線の垂線により分割される集集配地域の面積を集配区間面積sとして算出し、算出した集配区間面積sから得られる各中継地点における集配手段10の積載量(区間取り扱い重量予測値x)が集配手段10の最大積載量を超えないように、すなわち、上記の(式2)の条件を満たすように中継地点を設定する。なお、区間取り扱い重量の予測誤差や日々の変動を考えた場合には、上記の(式2)で表される条件に余裕を持たせて、上記の(式3)で表される条件を用いる。
図16は、図15で示した、集配地域の幅が中継地点間隔未満である場合の中継地点の配置について、高需要の日には追加で設定した中継地点も使用する場合の一例を示す図である。また、図17は、高需要の日に同じ中継地点を複数回訪れて集配物を積み替える場合の一例を示す図である。
図18及び図19は、配達時における集配手段の積載量の経過時間に対する変化を示す図であり、図18は通常需要時を、図19は高需要時をそれぞれ示している。図18及び図19においては、横軸に時刻(言い換えると、走行距離)を、縦軸に積載量をそれぞれ示している。
図18に示すように、例えば、通常需要(例えば、平日)においては、中継地点21-1,21-3はスキップし、中継地点21-2,21-4のみを経由する。この場合には、集配拠点20の出庫時には集配手段10は最大積載量に近い量を積載し、配達するにしたがって積載量が減少していく。集配地点と中継地点の順番、経路の自由度(最適化のための余地)を確保するため中継地点21-2,21-4へは積載量を残したまま到着する。これは、常に積載量が0(ゼロ)になってから中継地点21-2,21-4に寄るようにすると、集配手段10により集配地点と中継地点の順番を選択できる余地がなくなるためである。また、図19に示すように、例えば、高需要(例えば、休日の翌日)においては、全ての中継地点21-1~21-4を経由する。なお、日ごとの需要に応じてスキップする中継地点を変えても良い。
図20及び図21は、集荷時における集配手段の積載量の経過時間に対する変化を示す図であり、図20は通常需要時を、図21は高需要時をそれぞれ示している。図20及び図21においては、横軸に時刻(言い換えると、走行距離)を、縦軸に積載量をそれぞれ示している。
図20に示すように、例えば、通常需要(例えば、平日)においては、中継地点21-1,21-3はスキップし、中継地点21-2,21-4のみを経由する。この場合には、集配拠点20の出庫時には集配手段10の積載量はほとんど0(ゼロ)であり、集荷が進むにしたがって積載量が増加していく。集配地点と中継地点の順番、経路の自由度(最適化のための余地)を確保するため中継地点21-2,21-4へは最大積載量までの余裕を残したまま到着する。これは、常に積載量が最大積載量になってから中継地点21-2,21-4に到着するようにすると、集配手段10により集配地点と中継地点の順番を選択できる余地がなくなるためである。また、図21に示すように、例えば、高需要(例えば、休日の翌日)においては、全ての中継地点21-1~21-4を経由する。なお、日ごとの需要に応じてスキップする中継地点を変えても良い。また、集荷と配達を同時に実施しても良い。
以上のように構成した本実施の形態における作用効果を説明する。
物流のユニバーサルサービスのためのコストは地方に限らず都市部の利用者も含めて利用者があまねく負担する場合が多いため、地方での集配業務のコストダウンは、ひいては都市部の利用者も含めてユニバーサルサービスのためのコスト負担の削減につながる。
本実施の形態においては、集配手段が1つ以上の集配先に集配物を集配する際の経路である集配経路に組み込まれ、集配物の集配の拠点となる集配拠点との間で中継輸送手段により輸送される、集配物の中継を行う少なくとも1つの中継地点の設置数及び設置位置を、集配経路における中継地点を区切りとする各区間での集配物の区間取り扱い量予測値が集配手段の最大積載量を超えないように決定し、中継地点の設置数及び設置位置を出力するように構成したので、集配業務のコストダウンを図ることができる。
例えば、軽車両1台分以上の取扱量の集配地域において、1台の軽車両及び集配達作業員に中継輸送手段を加えることにより、集配拠点と集配地点間を繰り返し往復して運搬する必要長くなり集配業務の効率化を図ることができる。また、中継地点の設置間隔を中継地点間の集配手段の集配先を巡る経路での区間取り扱い量予測値が集配手段の最大積載量を超えないように決定することにより、集配物の重量が最大積載量を超えないようにしながら中継輸送手段による中継輸送を活用しながら集配手段による集配を続けることが可能となる。
<付記>
なお、本発明は上記の実施の形態に限定されるものではなく、その要旨を逸脱しない範囲内の様々な変形例や組み合わせが含まれる。また、本発明は、上記の実施の形態で説明した全ての構成を備えるものに限定されず、その構成の一部を削除したものも含まれる。また、本実施の形態で説明した各構成、機能等は、それらの一部又は全部を、例えば集積回路で設計する等により実現してもよい。また、上記の各構成、機能等は、プロセッサーがそれぞれの機能を実現するプログラムを解釈し、実行することによりソフトウェアで実現してもよい。
なお、本発明は上記の実施の形態に限定されるものではなく、その要旨を逸脱しない範囲内の様々な変形例や組み合わせが含まれる。また、本発明は、上記の実施の形態で説明した全ての構成を備えるものに限定されず、その構成の一部を削除したものも含まれる。また、本実施の形態で説明した各構成、機能等は、それらの一部又は全部を、例えば集積回路で設計する等により実現してもよい。また、上記の各構成、機能等は、プロセッサーがそれぞれの機能を実現するプログラムを解釈し、実行することによりソフトウェアで実現してもよい。
1…軽車両、10…集配手段、11…中継輸送手段、20…集配拠点、21…中継地点、22…集配先、30…集配地域、31…集配区間、110…集配地図情報、120…人口密度データベース、130…取り扱い実績情報、220…集配中継地点決定装置、420…中継地点データ
Claims (10)
- 集配地域における、集配手段と中継輸送手段とが集配物の積替えを行う中継地点を決定する集配中継地点決定装置であって、
プロセッサーを備え、
前記プロセッサーは、
中継地点候補と、集配先を含む集配地域の人口密度を示す集配地域人口密度と、取り扱い発生率を読み込み、
前記集配地域人口密度と前記取り扱い発生率とを用いて、中継地点間隔を算出し、
前記中継地点間隔に基づいて、集配地域を分割し、複数の集配区間を設定し、
前記集配区間ごとに、前記中継地点候補の中から中継地点の位置を設定し、
前記中継地点の位置を出力することを特徴とする集配中継地点決定装置。 - 請求項1に記載の集配中継地点決定装置において、
前記プロセッサーは、前記集配地域人口密度、集配地域の面積、及び前記取り扱い発生率を用いて区間取り扱い重量予測値を算出し、算出した前記区間取り扱い重量予測値が集配手段の最大積載量を超えないように中継地点間隔を算出することを特徴とする集配中継地点決定装置。 - 請求項2に記載の集配中継地点決定装置において、
前記中継輸送手段は、集配拠点と前記中継地点との間で集配物を運搬する手段であることを特徴とする集配中継地点決定装置。 - 請求項1に記載の集配中継地点決定装置において、
前記プロセッサーは、各集配区間の重点近くにそれぞれ中継地点を設定することを特徴とする集配中継地点決定装置。 - 請求項1に記載の集配中継地点決定装置において、
前記集配物の区間取り扱い量予測値は、前記中継輸送手段により輸送される輸送物の量の予測値を含むことを特徴とする集配中継地点決定装置。 - 請求項2に記載の集配中継地点決定装置において、
前記プロセッサーは、
前記集配手段の最大積載量に対して、余裕係数を掛け合わせることを特徴とする集配中継地点決定装置。 - 請求項1に記載の集配中継地点決定装置において、
前記プロセッサーは、
各集配区間を、平面内を有限種類の平面図形で隙間なく敷き詰める平面充填により区切ることを特徴とする集配中継地点決定装置。 - 請求項7に記載の集配中継地点決定装置において、
前記プロセッサーは、
前記集配区間を、1種類の正多角形で充填する正平面充填により区切ることを特徴とする集配中継地点決定装置。 - 請求項1記載の集配中継地点決定装置において、
前記中継輸送手段は、飛行体であることを特徴とする集配中継地点決定装置。 - 集配地域における、集配手段と中継輸送手段とが集配物の積替えを行う中継地点を決定する集配中継地点決定方法であって、
中継地点候補と、集配先を含む集配地域の人口密度を示す集配地域人口密度と、取り扱い発生率を読み込む手順と、
前記集配地域人口密度と前記取り扱い発生率とを用いて、中継地点間隔(d)を算出する手順と、
前記中継地点間隔(d)に基づいて、集配地域を分割し、複数の集配区間(S)を設定する手順と、
前記集配区間ごとに、前記中継地点候補の中から中継地点の位置を設定する手順と、
前記中継地点の位置を出力する手順とを有することを特徴とする集配中継地点決定方法。
Applications Claiming Priority (2)
| Application Number | Priority Date | Filing Date | Title |
|---|---|---|---|
| JP2023-097945 | 2023-06-14 | ||
| JP2023097945A JP7624477B2 (ja) | 2023-06-14 | 2023-06-14 | 集配中継地点決定装置および集配中継地点決定方法 |
Publications (1)
| Publication Number | Publication Date |
|---|---|
| WO2024257511A1 true WO2024257511A1 (ja) | 2024-12-19 |
Family
ID=93851932
Family Applications (1)
| Application Number | Title | Priority Date | Filing Date |
|---|---|---|---|
| PCT/JP2024/017232 Ceased WO2024257511A1 (ja) | 2023-06-14 | 2024-05-09 | 集配中継地点決定装置および集配中継地点決定方法 |
Country Status (2)
| Country | Link |
|---|---|
| JP (1) | JP7624477B2 (ja) |
| WO (1) | WO2024257511A1 (ja) |
Citations (4)
| Publication number | Priority date | Publication date | Assignee | Title |
|---|---|---|---|---|
| JP2000276688A (ja) * | 1999-03-29 | 2000-10-06 | Hitachi Software Eng Co Ltd | 輸送計画作成方法及びシステム |
| JP2020004181A (ja) * | 2018-06-29 | 2020-01-09 | 株式会社日立製作所 | 配送計画装置、配送計画システムおよび配送計画方法 |
| CN113554372A (zh) * | 2020-04-23 | 2021-10-26 | 深圳顺丰泰森控股(集团)有限公司 | 路由生成方法、装置、设备及存储介质 |
| JP2022138271A (ja) * | 2021-03-10 | 2022-09-26 | 本田技研工業株式会社 | 配送管理装置 |
Family Cites Families (1)
| Publication number | Priority date | Publication date | Assignee | Title |
|---|---|---|---|---|
| JP7786676B2 (ja) | 2020-11-26 | 2025-12-16 | 公立大学法人 滋賀県立大学 | 輸送経路決定方法、輸送経路決定装置、及びコンピュータプログラム |
-
2023
- 2023-06-14 JP JP2023097945A patent/JP7624477B2/ja active Active
-
2024
- 2024-05-09 WO PCT/JP2024/017232 patent/WO2024257511A1/ja not_active Ceased
Patent Citations (4)
| Publication number | Priority date | Publication date | Assignee | Title |
|---|---|---|---|---|
| JP2000276688A (ja) * | 1999-03-29 | 2000-10-06 | Hitachi Software Eng Co Ltd | 輸送計画作成方法及びシステム |
| JP2020004181A (ja) * | 2018-06-29 | 2020-01-09 | 株式会社日立製作所 | 配送計画装置、配送計画システムおよび配送計画方法 |
| CN113554372A (zh) * | 2020-04-23 | 2021-10-26 | 深圳顺丰泰森控股(集团)有限公司 | 路由生成方法、装置、设备及存储介质 |
| JP2022138271A (ja) * | 2021-03-10 | 2022-09-26 | 本田技研工業株式会社 | 配送管理装置 |
Also Published As
| Publication number | Publication date |
|---|---|
| JP2024179245A (ja) | 2024-12-26 |
| JP7624477B2 (ja) | 2025-01-30 |
Similar Documents
| Publication | Publication Date | Title |
|---|---|---|
| US20170053531A1 (en) | Dynamic routing of transit vehicles | |
| JP2016091563A (ja) | スマートな乗客および貨物輸送のためのシステムおよび方法 | |
| JP7115924B2 (ja) | 運行管理装置、運行管理システム、運行管理方法、及びプログラム | |
| CN103154981A (zh) | 路线规划的方法和装置 | |
| JP3148747B1 (ja) | 地図情報入力装置及び該装置を用いた物流支援装置並びにこれらの制御プログラムを記録した記憶媒体 | |
| CN110619431B (zh) | 一种救灾中防汛救援物资的车辆运输调度方法 | |
| CN118396514B (zh) | 一种国际物流路径优化方法 | |
| CN102346042A (zh) | 基于实时路况的路线规划方法及其服务设备 | |
| CN110503229B (zh) | 用于车辆路径优化的方法、装置和计算设备 | |
| Stodick et al. | Sustainable parcel delivery in urban areas with micro de-pots | |
| JP7624477B2 (ja) | 集配中継地点決定装置および集配中継地点決定方法 | |
| JP3516606B2 (ja) | 輸送計画作成方法及びシステム | |
| JP2004185398A (ja) | 輸送システム用サーバ | |
| CN116562486A (zh) | 城市生活垃圾运输路线的优化方法及装置 | |
| US20030208313A1 (en) | System for computing speeds and estimated arrival times for moving vehicles | |
| JP7557014B1 (ja) | 中継要否決定装置および中継要否決定方法 | |
| JP2001014296A (ja) | 配車配送計画方法、配車配送計画プログラムを記録したコンピューター読み取り可能な記録媒体及び配車配送計画装置。 | |
| Hashi et al. | A heuristic solution of the Vehicle Routing Problem to optimize the office bus routing and scheduling using Clarke & Wright's savings algorithm | |
| JP2010127716A (ja) | 情報処理装置、コンピュータプログラム及び交通路誘導システム | |
| CN112365032A (zh) | 垃圾清运的路径优化系统与方法 | |
| Łukasiewicz et al. | Differences between the traffic model and the actual road traffic and its structure | |
| Lee et al. | Performances in Last-Mile Deliveries involving Cyclic Services of Shuttles and Cargo Bikes | |
| CN117236473A (zh) | 枢纽疏散场景下乘客同乘车辆的路径分配方法及系统 | |
| Häll et al. | Evaluation of an integrated public transport system: a simulation approach | |
| JP7649347B2 (ja) | 集配管理システムおよび集配管理方法 |
Legal Events
| Date | Code | Title | Description |
|---|---|---|---|
| 121 | Ep: the epo has been informed by wipo that ep was designated in this application |
Ref document number: 24823133 Country of ref document: EP Kind code of ref document: A1 |
|
| NENP | Non-entry into the national phase |
Ref country code: DE |