WO2024166282A1 - 表示装置 - Google Patents
表示装置 Download PDFInfo
- Publication number
- WO2024166282A1 WO2024166282A1 PCT/JP2023/004338 JP2023004338W WO2024166282A1 WO 2024166282 A1 WO2024166282 A1 WO 2024166282A1 JP 2023004338 W JP2023004338 W JP 2023004338W WO 2024166282 A1 WO2024166282 A1 WO 2024166282A1
- Authority
- WO
- WIPO (PCT)
- Prior art keywords
- graph
- axis
- information
- displayed
- altitude
- Prior art date
- Legal status (The legal status is an assumption and is not a legal conclusion. Google has not performed a legal analysis and makes no representation as to the accuracy of the status listed.)
- Ceased
Links
Images




Classifications
-
- B—PERFORMING OPERATIONS; TRANSPORTING
- B60—VEHICLES IN GENERAL
- B60K—ARRANGEMENT OR MOUNTING OF PROPULSION UNITS OR OF TRANSMISSIONS IN VEHICLES; ARRANGEMENT OR MOUNTING OF PLURAL DIVERSE PRIME-MOVERS IN VEHICLES; AUXILIARY DRIVES FOR VEHICLES; INSTRUMENTATION OR DASHBOARDS FOR VEHICLES; ARRANGEMENTS IN CONNECTION WITH COOLING, AIR INTAKE, GAS EXHAUST OR FUEL SUPPLY OF PROPULSION UNITS IN VEHICLES
- B60K35/00—Instruments specially adapted for vehicles; Arrangement of instruments in or on vehicles
Definitions
- This case concerns a display device installed in a vehicle.
- a display device that uses a satellite positioning system to record the relationship between the vehicle's latitude, longitude, and altitude, and displays the route traveled in three dimensions.
- display devices that can simultaneously display a graph showing altitude changes over a short period of time and a graph showing altitude changes over a long period of time (see Patent Documents 1 to 3).
- One of the objectives of this case was devised in light of the above-mentioned problems, and is to provide a display device that can improve the user experience. However, this objective is not the only objective. Another objective of this case is to achieve effects that cannot be obtained with conventional technology, which are derived from the configurations shown in the "Mode for carrying out the invention" described below.
- the disclosed display device can be realized as the aspects (application examples) disclosed below, which solve at least part of the above problems.
- Each of the aspects from aspect 2 onwards is an aspect that can be selected additionally as appropriate, and each of the aspects can be omitted. None of the aspects from aspect 2 onwards discloses an essential aspect or configuration for the present case.
- the disclosed display device is mounted on a vehicle and displays adjacent to each other a first graph showing a change in first information related to the height position of the vehicle and a second graph showing a change in second information related to the outside air of the vehicle.
- the first graph is a graph drawn in a first coordinate system having a first main axis representing the first information and a first secondary axis representing the travel distance or time of the vehicle.
- the second graph is a graph drawn in a second coordinate system having a second main axis representing the second information and a second secondary axis representing the travel distance or time of the vehicle.
- Aspect 2 In the above aspect 1, it is preferable that the parameter represented on the first sub-axis and the parameter represented on the second sub-axis are the same. Aspect 3. In the above aspect 1 or 2, it is preferable that an extension direction of the first main axis and an extension direction of the second main axis are parallel to each other, and the first graph and the second graph are displayed adjacent to each other in the first main axis direction.
- Aspect 4 In any of Aspects 1 to 3 above, it is preferable that an image corresponding to the vehicle is displayed near the first graph, and a display angle of the image is controlled so as to correspond to a gradient of a portion of the first graph that corresponds to a current value.
- Aspect 6 In any of aspects 1 to 5 above, it is preferable that the scale of the first secondary axis is changeable and that the scale of the second secondary axis is changed to correspond to the scale of the first secondary axis.
- the range in the first minor axis direction in which the first graph is displayed is defined as a first minor axis range
- the range in the second minor axis direction in which the second graph is displayed is defined as a second minor axis range
- the scale of the first major axis is automatically adjusted so that a first maximum value and a first minimum value within the first minor axis range are displayed
- the scale of the second major axis is automatically adjusted so that a second maximum value and a second minimum value within the second minor axis range are displayed.
- Aspect 8 it is preferable to define the range in the first main axis direction in which the first graph is displayed as a first main axis range, define the range in the second main axis direction in which the second graph is displayed as a second main axis range, and automatically adjust the scale or display position of the first main axis and the scale or display position of the second main axis so that the first main axis range and the second main axis range partially overlap.
- Aspect 9 In any of aspects 1 to 8 above, it is preferable that the dimensions of the display areas of the first graph and the second graph in the first sub-axis direction and the second sub-axis direction are changeable, and when the dimensions of the first sub-axis direction and the second sub-axis direction are changed, the first graph and the second graph are displayed by expanding or contracting according to the changed dimensions.
- Aspect 10 In the above aspect 9, when the dimension after the change is equal to or smaller than a predetermined dimension, it is preferable to make the first graph and the second graph non-displayed and display a current value of the first information and a current value of the second information. Aspect 11. In any of Aspects 1 to 10 above, it is preferable that the first information is altitude information, and the second information is outside air temperature information.
- the disclosed display device can clearly show the correlation between first information (e.g., altitude) and second information (e.g., outside temperature) while the vehicle is traveling, and can inform the user of the correlation in an easy-to-understand manner.
- first information e.g., altitude
- second information e.g., outside temperature
- the parameter of the secondary axis in the first graph and the second graph to "travel distance or time”
- the history of the first information and second information can be clearly displayed. This can improve the user experience.
- FIG. 1 is a block diagram showing a configuration of a display device according to an embodiment of the present invention.
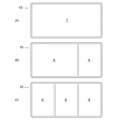
- 13A to 13C are diagrams for explaining the display size.
- 1A to 1C are diagrams showing examples of full-screen size displays.
- 13A and 13B are diagrams showing display examples of a two-thirds split screen size and a one-third split screen size.
- FIG. 13 is a diagram showing a modified example of the display screen.
- 13A and 13B are diagrams showing modified examples of the display screen.
- 13A and 13B are diagrams showing modified examples of the display screen.
- FIG. 1 is a block diagram showing the configuration of a display device 1 according to an embodiment.
- the display device 1 is mounted on a vehicle and displays various information related to the vehicle and on-board devices.
- the various information displayed on the display device 1 includes, for example, output information and content information of the vehicle.
- the output information is information related to the output (power) of the drive source of the vehicle
- the content information is information other than the output information, such as information indicating the running state of the vehicle, the running environment, and the operating state of on-board devices.
- output information include engine rotation speed, engine torque, engine horsepower (power), driving motor rotation speed, driving motor torque, driving motor horsepower (power), power consumption of the driving motor, power supply of the drive battery, vehicle speed, and wheel speed.
- the output information is generated by various ECUs, such as the vehicle ECU (Electronic Control Unit) and powertrain ECU, and transmitted to the display device 1.
- vehicle ECU Electronic Control Unit
- powertrain ECU Powertrain ECU
- content information examples include environmental information such as the altitude of the route the vehicle has traveled, outside temperature, air pressure, humidity, and weather, as well as information such as the shift position, gear ratio of the transmission, name of the driving mode, driving distance, estimated remaining driving distance, fuel efficiency, power consumption, remaining battery capacity, yaw rate, roll rate, pitch rate, longitudinal acceleration, lateral acceleration, road surface inclination angle, tire pressure, powertrain energy flow, driving direction (azimuth), and road surface friction coefficient.
- environmental information such as the altitude of the route the vehicle has traveled, outside temperature, air pressure, humidity, and weather
- information such as the shift position, gear ratio of the transmission, name of the driving mode, driving distance, estimated remaining driving distance, fuel efficiency, power consumption, remaining battery capacity, yaw rate, roll rate, pitch rate, longitudinal acceleration, lateral acceleration, road surface inclination angle, tire pressure, powertrain energy flow, driving direction (azimuth), and road surface friction coefficient.
- the content information may include audio information, car navigation information, lighting status information, cruise control related information, vehicle distance information, various websites, etc. This information is generated or acquired by, for example, various ECUs, various in-vehicle devices, various sensors, etc., and transmitted to the display device 1.
- the content information may be generated or calculated by the display device 1 based on signals generated or acquired by various ECUs, various in-vehicle devices, various sensors, etc.
- the display device 1 includes an electronic control device 2 and an output device 3.
- the electronic control device 2 is a computer for controlling the content displayed on the output device 3, and includes a processor (arithmetic processing unit) and a memory (storage device).
- the processing content (program) of the electronic control device 2 is stored in the memory, and is executed by loading the content into the processor as appropriate.
- the electronic control device 2 may be formed integrally with the output device 3 (built into the output device 3), or may be provided separately from the output device 3.
- the output device 3 is a device that displays information about the vehicle, such as a liquid crystal display, an organic EL (Electro-Luminescence) display, or a projector.
- a liquid crystal display such as a liquid crystal display, an organic EL (Electro-Luminescence) display, or a projector.
- the display or projector screen on which information is displayed will also be referred to as the display screen 10. All information displayed on the display screen 10 is controlled by the electronic control unit 2.
- the shape of the display screen 10 (the shape of the area in which information is displayed) is not particularly limited, but is, for example, rectangular.
- the output device 3 is placed in a position that is easily visible to the driver, such as in front of the driver (in front of the steering wheel) or in the front center of the vehicle interior (in front of the driver's seat and passenger seat).
- An input device that accepts input operations for the contents of the display screen 10 may be provided as an auxiliary device of the output device 3.
- Specific examples of input devices include a touch panel device that detects touch operations on the display screen 10, an input device equipped with a keyboard, physical buttons, or a touchpad, a gaze detection device that detects gaze, and a gesture reading device that detects gesture operations.
- a division number changing switch 6 is connected to the display device 1.
- the division number changing switch 6 is a switch for changing the size and number of areas in which information is displayed on the display screen 10.
- the division number changing switch 6 may be composed of a plurality of input devices including, for example, a switch for increasing and a switch for decreasing the number of divisions in the area in which information is displayed.
- the division number changing switch 6 may be composed of a touchpad-like input device capable of detecting swipe operations, pinch-in operations, pinch-out operations, etc.
- the number of divisions change switch 6 By using the number of divisions change switch 6 to reduce the display size of one piece of information, it becomes possible to simultaneously display other pieces of information on the display screen 10. Also, by using the number of divisions change switch 6 to enlarge the display size of one piece of information, it becomes easier to check the details of that information. In this way, the number of divisions change switch 6 is used when the user wants to arbitrarily change the display area of information or the number of pieces of information displayed.
- the number of divisions change switch 6 may be a physical switch provided in the vehicle cabin, or it may be a virtual switch displayed on the display screen 10 or another display. When this switch is a virtual switch, an operation detection means is used in combination to detect a pressing operation or a gesture operation on the virtual switch.
- Figure 2 (A) shows a state in which one type of content information is displayed using the entire display screen 10 of the output device 3. This display size is called full screen size 7.
- Figure 2 (B) shows a state in which a two-thirds split screen size 8 (2/3 split screen size), which corresponds to two areas when the display screen 10 is divided horizontally into thirds, and a one-third split screen size 9 (1/3 split screen size), which corresponds to one area when the display screen 10 is divided into thirds, are displayed simultaneously.
- FIG. 2(C) also shows a state in which three one-third split screen sizes 9 are displayed simultaneously.
- the width dimension of the two-thirds split screen size 8 exceeds a predetermined dimension, and the width dimension of the one-third split screen size 9 is equal to or smaller than the predetermined dimension.
- the predetermined dimension here is a threshold value for determining the width dimensions at which the altitude graph 4 and outside temperature graph 5 described below can be displayed and the width dimensions at which they cannot be displayed. Note that in any of the display screens 10 in FIGS. 2(A) to (C), the displayed content can be changed by scrolling the content of the display screen 10 (for example, by swiping left and right).
- the display device 1 of this embodiment has the function of displaying a first graph showing changes in first information related to the vehicle's height position and a second graph showing changes in second information related to the outside air of the vehicle adjacent to each other on the display screen 10 of the output device 3.
- the first information includes, for example, the vehicle's altitude (vertical distance to a specific ground surface or sea level), elevation (height position based on the mean sea level of a specific area), sea level (height position based on the nearest sea level), ellipsoidal height (height position based on the surface of a virtual ellipsoid equivalent to the earth's surface), GPS height (height position measured by the Global Satellite Positioning System), geoidal height (height position based on the geopotential surface), etc.
- the second information also includes information such as the outside air temperature, outside pressure, humidity, and concentrations of various substances in the outside air (pollen concentration, yellow sand concentration, particulate matter concentration).
- a display device 1 that displays an altitude graph 4 that graphs altitude information and an outside air temperature graph 5 that graphs outside air temperature information on a display screen 10 of an output device 3 will be described in detail.
- the term "altitude” in the following embodiments may be considered to correspond to, for example, the above-mentioned altitude or GPS altitude.
- altitude information and outside air temperature information generated or acquired by various ECUs, various in-vehicle devices, various sensors, etc. are input to the display device 1.
- Altitude information is obtained, for example, by a satellite positioning device (car navigation device) or an altitude sensor, and is input to the display device 1.
- the display device 1 records, for example, the vehicle's latitude, longitude, altitude, and time in association with each other.
- outside air temperature information is obtained by the vehicle body ECU or an outside air temperature sensor, and is input to the display device 1.
- the display device 1 stores, for example, the outside air temperature and time, or the outside air temperature and position (altitude, latitude, longitude), in association with each other.
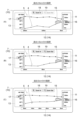
- FIGS. 3(A)-(C) show an altitude graph 4 and an outside temperature graph 5 displayed adjacent to each other on a full screen size 7.
- the altitude graph 4 is a graph drawn in a first coordinate system having a first main axis 11 (vertical axis) representing altitude and a first secondary axis 12 (horizontal axis) representing the distance traveled by the vehicle.
- the first main axis 11 in FIGS. 3(A)-(C) is perpendicular to the first secondary axis 12.
- the first main axis 11 is displayed to extend vertically (lengthwise) on the display screen 10, and the first secondary axis 12 is displayed to extend horizontally (widthwise).
- the outside temperature graph 5 is a graph drawn in a second coordinate system having a second main axis 13 (vertical axis) representing the outside temperature and a second secondary axis 14 (horizontal axis) representing the vehicle's travel distance.
- the second main axis 13 in Figures 3 (A) to (C) is perpendicular to the second secondary axis 14.
- the extension direction of the second main axis 13 is parallel to the extension direction of the first main axis 11.
- the altitude graph 4 and the outside temperature graph 5 may be graphs other than line graphs (for example, bar graphs or curve approximation graphs). Placing the altitude graph 4 and the outside temperature graph 5 adjacent to each other makes it easier to understand the correlation between altitude and outside temperature.
- first sub-axis 12 and the second sub-axis 14 shown in Figures 3(A) to (C) are common. That is, the parameters represented on the first sub-axis 12 and the parameters represented on the second sub-axis 14 are the same.
- both the first sub-axis 12 and the second sub-axis 14 represent the vehicle's travel distance, and the past travel distance (the distance from a past position to the current position) is represented as a negative value.
- altitude graph 4 and outside temperature graph 5 show the history of altitude changes and outside temperature changes over a 20km section traveled in the past.
- the parameter represented on the first sub-axis 12 is distance traveled, and the parameter represented on the second sub-axis 14 is also distance traveled.
- the correlation between altitude and outside temperature via the same parameter (distance traveled) is made clearer. Note that the domains (ranges in the sub-axis directions in which the graphs are drawn) of the altitude graph 4 and the outside temperature graph 5 only need to be roughly the same, and do not need to be perfectly the same.
- the first main axis 11 is placed on one side (e.g., the right side) of the altitude graph 4 and the outside temperature graph 5.
- a number line is displayed on the first main axis 11 to represent the altitude value.
- the number line includes at least a line, scales on the line, and numerical values (reference numerical values) corresponding to each scale.
- multiple scales are placed in a ladder shape between the two lines, and reference numerical values are displayed to the right of them.
- a first label 16 indicating the current altitude value is displayed near the first main axis 11.
- the first label 16 is an arrow-shaped image with a numerical value representing the current altitude value written on it.
- the first label 16 is placed on the number line so that the tip of the arrow points to the current altitude value.
- the second main axis 13 is placed on the other side (e.g., the left side) of the altitude graph 4 and the outside temperature graph 5. Similar to the first main axis 11, the second main axis 13 displays a number line to represent the outside temperature value. In the example shown in Figures 3 (A) to (C), multiple scales are placed in a ladder shape between the two lines, and reference values are displayed to the left of them. In addition, a second label 17 indicating the current outside temperature value is displayed near the second main axis 13. The second label 17 is an arrow-shaped image with a number representing the current outside temperature value written on it. The second label 17 is placed on the number line so that the tip of the arrow points to the current outside temperature value.
- the first secondary axis 12 and the second secondary axis 14 are positioned below the altitude graph 4 and the outside temperature graph 5.
- the first secondary axis 12 and the second secondary axis 14 may display a number line or scale to indicate values corresponding to the distance traveled by the vehicle.
- the number line and scale are omitted, and only numerical values (reference numerical values) corresponding to some of the scales are displayed.
- a tilt display image 15 is displayed near the point on the altitude graph 4 that corresponds to the current value (for example, near the right end of the altitude graph 4).
- the tilt display image 15 is an image (icon) that corresponds to a vehicle.
- the tilt display image 15 is an image that imitates the side of a vehicle, for example, an image that deforms the side view shape of the vehicle on which the display device 1 is mounted.
- the display angle of the tilt display image 15 on the display screen 10 i.e., the pitch angle of the vehicle shown in the tilt display image 15
- the "tilt of the point that corresponds to the current value” means, for example, the tilt of the altitude graph 4 in the most recent specified distance range or the most recent specified time range.
- the display angle of the tilt display image 15 is controlled so that the pitch angle of the vehicle shown in the tilt display image 15 roughly matches the slope of the straight line near the right end of the altitude graph 4. This allows the trend of altitude change to be displayed in an easy-to-understand manner, while also realizing a humorous and endearing presentation of a deformed vehicle plodding along the gradient of the altitude graph 4, as shown in Figures 3(A) to (C).
- the tilt display image 15 may be any image that corresponds to a vehicle, for example an image of the vehicle as seen from above. Furthermore, the tilt display image 15 does not need to be an image of the vehicle itself, but may be an image of an item related to the vehicle (tires, steering wheel, checkered flag, etc.), or a simple geometric figure, symbol, or mark. Furthermore, the display angle of the tilt display image 15 does not need to correspond to the tilt of the altitude graph 4. At the very least, by placing some kind of image near the point corresponding to the current value of the altitude graph 4, it is easy to understand that the vehicle is currently in this position, and the role of an icon is fulfilled.
- the scales of the first secondary axis 12 and the second secondary axis 14 may be a preset fixed scale, but are preferably variable scales. In other words, it is preferable that the scale of the first secondary axis 12 is changeable and that the scale of the second secondary axis 14 is changed to correspond to the scale of the first secondary axis 12.
- a zoom in button 18 and a zoom out button 19 are provided for changing the scale in the secondary axis direction. Operation input to the zoom in button 18 and the zoom out button 19 is detected by a touch panel device that detects touch operations on the display screen 10.
- the zoom button 18 is a button for increasing the scale of the first secondary axis 12 and the second secondary axis 14.
- the distance range displayed on the display screen 10 is narrowed.
- the distance range displayed on the display screen 10 in FIG. 3(A) is 20 km (a range from -20 km to 0 km).
- the ranges that give this distance range are called the first secondary axis range and the second secondary axis range.
- the first secondary axis range corresponds to the range in the direction of the first secondary axis 12 in which the altitude graph 4 is displayed
- the second secondary axis range corresponds to the range in the direction of the second secondary axis 14 in which the outside temperature graph 5 is displayed.
- the display screen 10 transitions to the state shown in FIG. 3(B), and the distance range displayed on the display screen 10 becomes 10 km (range of -10 km to 0 km).
- the first and second secondary axis ranges are narrowed. It is preferable that the displayed distance range (positions of the right and left endpoints of the first and second secondary axis ranges) can be changed by scrolling the altitude graph 4 and the outside temperature graph 5 left and right (swiping left and right).
- the zoom button 18 when the zoom button 18 is touched in this state, the display screen 10 transitions to the state shown in FIG. 3(C), and the distance range displayed on the display screen 10 becomes 5 km (range of -5 km to 0 km). In other words, the first and second secondary axis ranges are narrowed further. In this way, by operating the zoom button 18, the scale becomes larger (the first and second secondary axis ranges narrow), and a portion of the altitude graph 4 and outside temperature graph 5 can be enlarged and checked.
- the zoom out button 19 is a button for reducing the scale of the first secondary axis 12 and the second secondary axis 14. Operating the zoom out button 19 in the state shown in FIG. 3(C) changes the display screen 10 to the state shown in FIG. 3(B), and operating the zoom out button 19 further changes the display screen 10 to the state shown in FIG. 3(A). In this way, operating the zoom out button 19 reduces the scale, allowing an overview of the overall changes in the altitude graph 4 and the outside temperature graph 5.
- the scale of each of the first main axis 11 and the second main axis 13 may be a fixed scale set in advance, or may be a variable scale that changes according to the situation. In the latter case, it is preferable that the scale of the first main axis 11 is automatically adjusted so that the highest altitude (first maximum value) and the lowest altitude (first minimum value) within the first secondary axis range are displayed. In other words, it is preferable that the scale of the first main axis 11 is changed without any user operation. Similarly, it is preferable that the scale of the second main axis 13 is automatically adjusted so that the highest outside air temperature (second maximum value) and the lowest outside air temperature (second minimum value) within the second secondary axis range are displayed.
- the scale of the first main axis 11 may be increased, and the altitude graph 4 may be stretched vertically. Conversely, if the difference between the maximum altitude and the minimum altitude is large, the scale of the first main axis 11 may be decreased, and the altitude graph 4 may be reduced vertically.
- This automatic adjustment makes it possible to display the overall shape of the altitude graph 4 in the first secondary axis range and the overall shape of the outside temperature graph 5 in the second secondary axis range without any omissions.
- FIG. 4(A) shows an altitude graph 4 and an outside temperature graph 5 displayed adjacent to each other in an area of two-thirds split screen size 8.
- the width dimension of the two-thirds split screen size 8 exceeds a predetermined dimension.
- FIG. 4(A) Compared to what is shown in FIG. 3(A), in FIG. 4(A) the shapes of the altitude graph 4 and outside temperature graph 5 are compressed in the secondary axis direction. Meanwhile, the elements displayed on the display screen 10 remain almost unchanged. That is, even in the area of the two-thirds split screen size 8, the altitude graph 4, outside temperature graph 5, first main axis 11, first secondary axis 12, second main axis 13, second secondary axis 14, tilt display image 15, first label 16, second label 17, zoom in button 18, and zoom out button 19 are displayed.
- the shapes of the altitude graph 4 and outside temperature graph 5 are compressed in the secondary axis direction (i.e., the inclination of the altitude graph 4 on the screen has changed slightly), and the display angle of the inclination display image 15 has also changed slightly.
- the display area has been narrowed, the sizes of the zoom in button 18 and zoom out button 19 have been reduced.
- the history of altitude changes and the history of outside temperature changes are displayed simultaneously, and the correlation between altitude and outside temperature is clearly shown.
- the inclination display image 15, first label 16, and second label 17 are displayed, the trend in altitude changes and the current values of altitude and outside temperature are communicated to the user in an easy-to-understand manner.
- FIG. 4(B) shows a state in which the tilt display image 15 and the current altitude and outside temperature values are displayed in the area of the one-third split screen size 9.
- the width dimension of the one-third split screen size 9 is equal to or smaller than a predetermined dimension.
- the altitude graph 4 and the outside temperature graph 5 are omitted.
- the first main axis 11, the second main axis 13, the tilt display image 15, the first label 16, and the second label 17 are displayed.
- the tilt display image 15 may be omitted if the area of the one-third split screen size 9 is insufficient.
- the first main axis 11, second main axis 13, tilt display image 15, first label 16, and second label 17 shown in FIG. 4(B) are almost identical to the first main axis 11, second main axis 13, tilt display image 15, first label 16, and second label 17 shown in FIG. 4(A).
- the tilt display image 15, first label 16, and second label 17 By displaying the tilt display image 15, first label 16, and second label 17 in this way, the trend of change in altitude and the current values of altitude and outside temperature are communicated to the user in an easy-to-understand manner.
- FIG. 5 is a diagram showing a display example in which the first sub-axis 12 and the second sub-axis 14 shown in FIG. 3(A) represent time instead of distance traveled.
- the parameter represented on the first sub-axis 12 is time
- the parameter represented on the second sub-axis 14 is also time. In this way, by making the first sub-axis 12 and the second sub-axis 14 common, the correlation between altitude and outside temperature via the same parameter (time) becomes clearer.
- the shapes of the altitude graph 4 and the outside temperature graph 5 are compressed in the direction of the secondary axis, and in sections where the driving speed is slow, the shapes of the altitude graph 4 and the outside temperature graph 5 are expanded in the direction of the secondary axis.
- the altitude graph 4 can be determined from the relationship between the vehicle's latitude, longitude, altitude, and time.
- the outside temperature graph 5 can be determined from the relationship between the outside temperature and time, or the outside temperature and position (altitude, latitude, longitude).
- the display device 1 of this embodiment is mounted on a vehicle and displays an altitude graph 4 (first graph) showing changes in first information related to the vehicle's height position and an outside air temperature graph 5 (second graph) showing changes in second information related to the air outside the vehicle, adjacent to each other.
- the altitude graph 4 is a graph drawn in a first coordinate system having, for example, a first main axis 11 representing altitude and a first secondary axis 12 representing the vehicle's travel distance (or time).
- the outside air temperature graph 5 is a graph drawn in a second coordinate system having, for example, a second main axis 13 representing the outside air temperature and a second secondary axis 14 representing the vehicle's travel distance (or time).
- the correlation between the altitude (first information) and the outside temperature (second information) becomes easier to understand, and the user can intuitively grasp how changes in altitude have affected the vehicle's driving environment (outside temperature). Furthermore, by setting the parameters of the first sub-axis 12 and the second sub-axis 14 to "distance traveled or time", the history of the altitude (first information) and the outside temperature (second information) can be clearly displayed, and the user can see this history at a glance. This improves the user experience. For example, it is possible to meet the needs of users who want to check the correlation between altitude and outside temperature.
- the parameter represented on the first sub-axis 12 and the parameter represented on the second sub-axis 14 are set to be the same.
- the parameter represented on the first sub-axis 12 and the parameter represented on the second sub-axis 14 are both set to "distance traveled.”
- the parameter represented on the first sub-axis 12 and the parameter represented on the second sub-axis 14 are both set to "time.”
- the extension direction of the first main axis 11 and the extension direction of the second main axis 13 are parallel, and the altitude graph 4 and the outside temperature graph 5 are displayed adjacent to each other in the direction of the first main axis 11.
- This configuration makes the correspondence between altitude and outside temperature clearer, improving the user experience. For example, if one wishes to know the outside temperature at a certain altitude, one can draw a line parallel to the first main axis 11 or the second main axis 13 from a point on the altitude graph 4 corresponding to that altitude, and find the intersection of the parallel line with the outside temperature graph 5.
- the extension direction of the first main axis 11 is perpendicular to the extension direction of the first secondary axis 12, and the extension direction of the second main axis 13 is perpendicular to the extension direction of the second secondary axis 14.
- This configuration allows information to be displayed efficiently within the rectangular display screen 10.
- the first main axis 11 is arranged on one side of the altitude graph 4 and the outside temperature graph 5, and the second main axis 13 is arranged on the other side. This configuration makes it possible to avoid misreading or confusion between the first main axis 11 and the second main axis 13, and makes it easier for users to understand the information.
- a tilt display image 15 which is an image that resembles the side of a vehicle, is displayed near the altitude graph 4.
- the display angle of the tilt display image 15 is controlled so as to correspond to the tilt of the point on the altitude graph 4 that corresponds to the current value.
- a first label 16 indicating the current altitude value is displayed near the first main axis 11.
- a second label 17 indicating the current outside air temperature value is displayed near the second main axis 13.
- the scale of the first secondary axis 12 can be changed, and the scale of the second secondary axis 14 is changed to correspond to the scale of the first secondary axis 12.
- the scale of the first secondary axis 12 and the second secondary axis 14 increases, and the distance width displayed on the display screen 10 changes from 10 km to 5 km.
- the reduce button 19 in the state shown in FIG. 3(B) the scale of the first secondary axis 12 and the second secondary axis 14 decreases, and the distance width displayed on the display screen 10 changes from 10 km to 20 km.
- the scale of the first main axis 11 can be automatically adjusted so that the maximum altitude (first maximum value) and the minimum altitude (first minimum value) within the first secondary axis range are displayed.
- the scale of the second main axis 13 can be automatically adjusted so that the maximum outside temperature (second maximum value) and the minimum outside temperature (second minimum value) within the second secondary axis range are displayed.
- the altitude graph 4 and the outside temperature graph 5 can be displayed without their entire shapes being cut off, without extending beyond the edge of the display screen 10.
- the scale of the first main axis 11 can be increased to stretch the altitude graph 4 in the direction of the first main axis 11, thereby emphasizing the change in altitude. Conversely, if the difference between the maximum altitude and the minimum altitude is large, the scale of the first main axis 11 can be decreased to shrink the altitude graph 4 in the direction of the first main axis 11, thereby allowing an overview of the overall changes.
- the horizontal dimensions (first secondary axis 12 direction and second secondary axis 14 direction) of the display areas of the altitude graph 4 and outside temperature graph 5 can be changed. Furthermore, when the horizontal dimensions are changed, the altitude graph 4 and outside temperature graph 5 can be stretched or contracted according to the changed dimensions. For example, when the horizontal dimensions are changed from the full screen size 7 shown in Fig. 3(A) to the two-thirds split screen size 8 shown in Fig. 4(A), the shapes of the altitude graph 4 and outside temperature graph 5 are compressed in the secondary axis direction.
- the altitude graph 4 and outside temperature graph 5 can be displayed in a reduced size (compressed display) of the same range as before the display area was narrowed, improving convenience. Conversely, if the display area is expanded, the altitude graph 4 and outside temperature graph 5 can be displayed in an enlarged size (expanded display) accordingly, improving the accuracy of details and viewability. This further improves the user experience.
- the first information is altitude information
- the second information is outside temperature information. This allows the user to easily understand the correlation between altitude and outside temperature. In other words, it is possible to meet the needs of users who want to check the correlation between altitude and outside temperature, and to improve the user experience.
- a display device 1 is described in detail that displays an altitude graph 4 as a first graph and an outside air temperature graph 5 as a second graph adjacent to each other on the display screen 10 of the output device 3, but the specific types of information shown in the first graph and the second graph can be changed.
- the first information shown in the first graph may be information related to the height position of the vehicle
- the second information shown in the second graph may be information related to the outside air temperature of the vehicle.
- the parameters represented on the first sub-axis 12 and the parameters represented on the second sub-axis 14 are set to be the same, but they may be different. Also, the type of parameters represented on each of the first sub-axis 12 and the second sub-axis 14 may be selectable by the user. Note that the tilt display image 15, the first label 16, the second label 17, the zoom in button 18, and the zoom out button 19 may be omitted from the display screen 10. By displaying at least the altitude graph 4 and the outside temperature graph 5 adjacent to each other, the correlation and history between the altitude and the outside temperature becomes clear at a glance, improving the user experience.
- the first sub-axis 12 and the second sub-axis 14 may be independent of each other.
- the altitude graph 4, the first main axis 11, and the first sub-axis 12 may be displayed at the bottom of the display screen 10
- the outside temperature graph 5, the second main axis 13, and the second sub-axis 14 may be displayed at the top of the display screen 10.
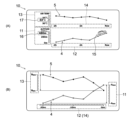
- FIG. 6(B) is a display example in which the altitude graph 4 and the outside air temperature graph 5 are partially overlapped.
- the fluctuation range of the altitude graph 4 displayed on the display screen 10 in FIG. 6(B) is A MIN to A MAX . This range is defined as the first main axis range.
- the fluctuation range of the outside air temperature graph 5 displayed on the display screen 10 in FIG. 6(B) is B MIN to B MAX . This range is defined as the second main axis range.
- the scale or display position of the first main axis 11 and the scale or display position of the second main axis 13 are automatically adjusted so that the first main axis range and the second main axis range partially overlap (overlap in the vertical direction).
- the overlap dimension between the first main axis range and the second main axis range is set appropriately according to the width of the first main axis range and the second main axis range.
- the scale of the first main axis 11 is reduced, the vertical dimension of the first main axis 11 on the display screen 10 is reduced, and the display position is shifted slightly downward.
- the first main axis range is relatively wide, the scale of the first main axis 11 is increased, the vertical dimension of the first main axis 11 on the display screen 10 is extended, and the display position is shifted slightly upward.
- the scale of the second main axis 13 is reduced, the vertical dimension of the second main axis 13 on the display screen 10 is reduced, and the display position is shifted slightly upward.
- the scale of the second main axis 13 is increased, the vertical dimension of the second main axis 13 on the display screen 10 is extended, and the display position is shifted slightly downward.
- the above configuration allows the altitude graph 4 and the outside temperature graph 5 to be displayed with a slight overlap in the vertical direction, allowing the altitude graph 4 and the outside temperature graph 5 to be displayed compactly within the limited display screen 10.
- the larger the overlap dimension between the first main axis range and the second main axis range the greater the overlap between the altitude graph 4 and the outside temperature graph 5, which may make it difficult to distinguish between the graphs. Therefore, the scale and display position of each may be automatically adjusted so that the overlap dimension is equal to or less than a specified percentage of the overall vertical dimension of the display screen 10.
- FIG. 7(A) is an example of a display in which an altitude graph 4 and an outside temperature graph 5 are displayed three-dimensionally.
- the first main axis 11 and the first secondary axis 12 are not necessarily perpendicular to each other
- the second main axis 13 and the second secondary axis 14 are not necessarily perpendicular to each other.
- the specific presentation method (style) of such graphs may be freely set by the user.
- Figure 7 (B) is an example of a display when the shape of the display screen 10 is a vertically long rectangle.
- the first main axis 11 and the second main axis 13 are displayed extending horizontally (horizontally), and the first sub-axis 12 and the second sub-axis 14 are displayed extending vertically (vertically).
- the display positions and orientations of the first main axis 11, first sub-axis 12, second main axis 13, and second sub-axis 14 can be changed as appropriate, and the orientations and adjacent directions of the altitude graph 4 and outside temperature graph 5 can also be changed as appropriate.
- the specific display positions and orientations of such graphs may be freely set by the user.
- This invention can be used in the manufacturing industry of display devices mounted on vehicles, and also in the manufacturing industry of vehicles equipped with such display devices.
Landscapes
- Engineering & Computer Science (AREA)
- Chemical & Material Sciences (AREA)
- Combustion & Propulsion (AREA)
- Transportation (AREA)
- Mechanical Engineering (AREA)
- Indicating Measured Values (AREA)
- Controls And Circuits For Display Device (AREA)
Abstract
Description
態様3.上記の態様1又は2において、前記第一主軸の延在方向と前記第二主軸の延在方向とが平行であり、前記第一グラフと前記第二グラフとを前記第一主軸方向に隣接させて表示することが好ましい。
態様5.上記の態様1~4の何れかにおいて、前記第一主軸の近傍に、前記第一情報の現在値を示す第一ラベルを表示し、前記第二主軸の近傍に、前記第二情報の現在値を示す第二ラベルを表示することが好ましい。
態様11.上記の態様1~10の何れかにおいて、前記第一情報は高度の情報であり、前記第二情報は外気温の情報であることが好ましい。
図1は、実施例としての表示装置1の構成を示すブロック図である。この表示装置1は、車両に搭載されて、車両及び車載装置に関する各種情報を表示する装置である。表示装置1に表示される各種情報には、例えば車両の出力情報やコンテンツ情報が含まれる。出力情報とは、車両の駆動源の出力(仕事率)に関する情報であり、コンテンツ情報とは、出力情報以外の情報であって、車両の走行状態,走行環境,車載機器の作動状態等を表す情報である。
本実施例の表示装置1は、車両の高さ位置に関する第一情報の変化を示す第一グラフと、車両の外気に関する第二情報の変化を示す第二グラフとを隣接させて出力装置3の表示画面10に表示する機能を持つ。
(1)本実施例の表示装置1は、車両に搭載され、車両の高さ位置に関する第一情報の変化を示す高度グラフ4(第一グラフ)と車両の外気に関する第二情報の変化を示す外気温グラフ5(第二グラフ)とを隣接させて表示する。高度グラフ4は、例えば高度を表す第一主軸11と車両の走行距離(又は時間)を表す第一副軸12とを有する第一座標系において描画されるグラフである。また、外気温グラフ5は、例えば外気温を表す第二主軸13と車両の走行距離(又は時間)を表す第二副軸14とを有する第二座標系において描画されるグラフである。
上記の実施例はあくまでも例示に過ぎず、本実施例で明示しない種々の変形や技術の適用を排除する意図はない。本実施例の各構成は、それらの趣旨を逸脱しない範囲で種々変形して実施できる。また、本実施例の各構成は必要に応じて取捨選択でき、あるいは、適宜組み合わせることができる。
2 電子制御装置
3 出力装置
4 高度グラフ(第一グラフ)
5 外気温グラフ(第二グラフ)
6 分割数変更スイッチ
7 フル画面サイズ
8 三分の二分割画面サイズ
9 三分の一分割画面サイズ
10 表示画面
11 第一主軸
12 第一副軸
13 第二主軸
14 第二副軸
15 傾き表示画像
16 第一ラベル
17 第二ラベル
18 拡大ボタン
19 縮小ボタン
Claims (11)
- 車両に搭載され、前記車両の高さ位置に関する第一情報の変化を示す第一グラフと前記車両の外気に関する第二情報の変化を示す第二グラフとを隣接させて表示する表示装置であって、
前記第一グラフが、前記第一情報を表す第一主軸と前記車両の走行距離又は時間を表す第一副軸とを有する第一座標系において描画されるグラフであり、
前記外第二グラフが、前記第二情報を表す第二主軸と前記車両の走行距離又は時間を表す第二副軸とを有する第二座標系において描画されるグラフである
ことを特徴とする、表示装置。 - 前記第一副軸に表されるパラメータと前記第二副軸に表されるパラメータとが同一である
ことを特徴とする、請求項1記載の表示装置。 - 前記第一主軸の延在方向と前記第二主軸の延在方向とが平行であり、
前記第一グラフと前記第二グラフとを前記第一主軸方向に隣接させて表示する
ことを特徴とする、請求項1又は2記載の表示装置。 - 前記第一グラフの近傍に、前記車両に相当する画像を表示するとともに、
前記画像の表示角度が、前記第一グラフにおける現在値に対応する箇所の傾きに対応するように制御される
ことを特徴とする、請求項1~3の何れか一項に記載の表示装置。 - 前記第一主軸の近傍に、前記第一情報の現在値を示す第一ラベルを表示し、
前記第二主軸の近傍に、前記第二情報の現在値を示す第二ラベルを表示する
ことを特徴とする、請求項1~4の何れか一項に記載の表示装置。 - 前記第一副軸の縮尺が変更可能であるとともに、
前記第一副軸の縮尺に対応するように、前記第二副軸の縮尺が変更される
ことを特徴とする、請求項1~5の何れか一項に記載の表示装置。 - 前記第一グラフが表示される前記第一副軸方向の範囲を第一副軸範囲と定義し、前記第二グラフが表示される前記第二副軸方向の範囲を第二副軸範囲と定義して、
前記第一副軸範囲内における第一最高値及び第一最低値が表示されるように前記第一主軸の縮尺が自動調整され、
前記第二副軸範囲内における第二最高値及び第二最低値が表示されるように前記第二主軸の縮尺が自動調整される
ことを特徴とする、請求項1~6の何れか一項に記載の表示装置。 - 前記第一グラフが表示される前記第一主軸方向の範囲を第一主軸範囲と定義し、前記第二グラフが表示される前記第二主軸方向の範囲を第二主軸範囲と定義して、
前記第一主軸範囲と前記第二主軸範囲とが部分的に重なるように、前記第一主軸の縮尺又は表示位置と前記第二主軸の縮尺又は表示位置とが自動調整される
ことを特徴とする、請求項7記載の表示装置。 - 前記第一グラフ及び前記第二グラフの表示領域のうち前記第一副軸方向及び前記第二副軸方向の寸法が変更可能であって、
前記第一副軸方向及び前記第二副軸方向の寸法が変更された場合に、変更後の前記寸法に応じて、前記第一グラフ及び前記第二グラフを伸縮させて表示する
ことを特徴とする、請求項1~8の何れか一項に記載の表示装置。 - 変更後の前記寸法が所定寸法以下である場合に、前記第一グラフ及び前記第二グラフを非表示にして、前記第一情報の現在値及び前記第二情報の現在値を表示する
ことを特徴とする、請求項9記載の表示装置。 - 前記第一情報は高度の情報であり、前記第二情報は外気温の情報である
ことを特徴とする、請求項1~10の何れか一項に記載の表示装置。
Priority Applications (2)
| Application Number | Priority Date | Filing Date | Title |
|---|---|---|---|
| PCT/JP2023/004338 WO2024166282A1 (ja) | 2023-02-09 | 2023-02-09 | 表示装置 |
| JP2023564000A JP7639937B2 (ja) | 2023-02-09 | 2023-02-09 | 表示装置 |
Applications Claiming Priority (1)
| Application Number | Priority Date | Filing Date | Title |
|---|---|---|---|
| PCT/JP2023/004338 WO2024166282A1 (ja) | 2023-02-09 | 2023-02-09 | 表示装置 |
Publications (1)
| Publication Number | Publication Date |
|---|---|
| WO2024166282A1 true WO2024166282A1 (ja) | 2024-08-15 |
Family
ID=92262222
Family Applications (1)
| Application Number | Title | Priority Date | Filing Date |
|---|---|---|---|
| PCT/JP2023/004338 Ceased WO2024166282A1 (ja) | 2023-02-09 | 2023-02-09 | 表示装置 |
Country Status (2)
| Country | Link |
|---|---|
| JP (1) | JP7639937B2 (ja) |
| WO (1) | WO2024166282A1 (ja) |
Citations (3)
| Publication number | Priority date | Publication date | Assignee | Title |
|---|---|---|---|---|
| JP2017181508A (ja) * | 2017-04-11 | 2017-10-05 | 株式会社ユピテル | 車載用電子機器及びプログラム |
| JP2021054403A (ja) * | 2020-11-24 | 2021-04-08 | 株式会社ユピテル | 車両用システム及びプログラム |
| JP2022089197A (ja) * | 2020-10-06 | 2022-06-15 | 株式会社ユピテル | 電子機器及びプログラム |
Family Cites Families (1)
| Publication number | Priority date | Publication date | Assignee | Title |
|---|---|---|---|---|
| JP6759899B2 (ja) | 2016-09-08 | 2020-09-23 | アイシン精機株式会社 | 車両用画像処理装置 |
-
2023
- 2023-02-09 WO PCT/JP2023/004338 patent/WO2024166282A1/ja not_active Ceased
- 2023-02-09 JP JP2023564000A patent/JP7639937B2/ja active Active
Patent Citations (3)
| Publication number | Priority date | Publication date | Assignee | Title |
|---|---|---|---|---|
| JP2017181508A (ja) * | 2017-04-11 | 2017-10-05 | 株式会社ユピテル | 車載用電子機器及びプログラム |
| JP2022089197A (ja) * | 2020-10-06 | 2022-06-15 | 株式会社ユピテル | 電子機器及びプログラム |
| JP2021054403A (ja) * | 2020-11-24 | 2021-04-08 | 株式会社ユピテル | 車両用システム及びプログラム |
Also Published As
| Publication number | Publication date |
|---|---|
| JP7639937B2 (ja) | 2025-03-05 |
| JPWO2024166282A1 (ja) | 2024-08-15 |
Similar Documents
| Publication | Publication Date | Title |
|---|---|---|
| KR101691296B1 (ko) | 차량에서 차량의 작동과 관련된 적어도 하나의 파라미터를 표시하기 위한 방법 및 장치 | |
| CN102596627B (zh) | 车辆用显示装置 | |
| CN103909864B (zh) | 车辆显示装置以及包括车辆显示装置的车辆 | |
| CN113263912B (zh) | 车辆用显示装置 | |
| CN103124943A (zh) | 基于车辆的显示系统和用于操作其的方法 | |
| US20150375620A1 (en) | Display control device and display control program | |
| JP6978469B2 (ja) | 表示ユニット | |
| JP6052865B2 (ja) | 車載表示制御装置および車載表示制御方法 | |
| JP2018197691A (ja) | 情報処理装置 | |
| CN111559245B (zh) | 显示装置 | |
| KR20120020745A (ko) | 자동차용 클러스터의 정보 표시 방법 | |
| ES2728500T3 (es) | Procedimiento y dispositivo para la indicación de un campo de valores crítico de un primer parámetro específico del vehículo en un vehículo | |
| CN107107938A (zh) | 汽车显示系统 | |
| JP7639937B2 (ja) | 表示装置 | |
| JP6385138B2 (ja) | 車載表示制御装置および車載表示制御方法 | |
| JP2020083192A (ja) | 車両用メータユニット | |
| JP4637664B2 (ja) | ナビゲーション装置 | |
| JP2010002263A (ja) | 表示装置、及び、表示装置における表示制御方法 | |
| JP5176994B2 (ja) | 車両用表示装置 | |
| CN105291837A (zh) | 用于在车辆中显示车辆特定参数的方法和装置 | |
| CN116568562A (zh) | 用于车辆的显示器装置 | |
| JP2010107534A (ja) | 車載表示装置 | |
| WO2025032630A1 (ja) | 表示装置 | |
| JP7816560B2 (ja) | 表示装置 | |
| JP2009214681A (ja) | 遠隔操作システム |
Legal Events
| Date | Code | Title | Description |
|---|---|---|---|
| WWE | Wipo information: entry into national phase |
Ref document number: 2023564000 Country of ref document: JP |
|
| 121 | Ep: the epo has been informed by wipo that ep was designated in this application |
Ref document number: 23921113 Country of ref document: EP Kind code of ref document: A1 |
|
| WWE | Wipo information: entry into national phase |
Ref document number: 2501005264 Country of ref document: TH |
|
| NENP | Non-entry into the national phase |
Ref country code: DE |
|
| 122 | Ep: pct application non-entry in european phase |
Ref document number: 23921113 Country of ref document: EP Kind code of ref document: A1 |