WO2024154473A1 - 油脂劣化予測装置、油脂劣化予測システム、および油脂劣化予測方法 - Google Patents
油脂劣化予測装置、油脂劣化予測システム、および油脂劣化予測方法 Download PDFInfo
- Publication number
- WO2024154473A1 WO2024154473A1 PCT/JP2023/044062 JP2023044062W WO2024154473A1 WO 2024154473 A1 WO2024154473 A1 WO 2024154473A1 JP 2023044062 W JP2023044062 W JP 2023044062W WO 2024154473 A1 WO2024154473 A1 WO 2024154473A1
- Authority
- WO
- WIPO (PCT)
- Prior art keywords
- deterioration
- oil
- frying oil
- prediction
- frying
- Prior art date
- Legal status (The legal status is an assumption and is not a legal conclusion. Google has not performed a legal analysis and makes no representation as to the accuracy of the status listed.)
- Ceased
Links
Images








Classifications
-
- G—PHYSICS
- G01—MEASURING; TESTING
- G01N—INVESTIGATING OR ANALYSING MATERIALS BY DETERMINING THEIR CHEMICAL OR PHYSICAL PROPERTIES
- G01N33/00—Investigating or analysing materials by specific methods not covered by groups G01N1/00 - G01N31/00
- G01N33/02—Food
- G01N33/03—Edible oils or edible fats
Definitions
- the present invention relates to an oil deterioration prediction device, an oil deterioration prediction system, and an oil deterioration prediction method for predicting the deterioration of oils and fats.
- Patent Document 1 discloses a method for predicting the remaining lifespan of mineral oil, in which if the difference between the degree of deterioration corresponding to the transmitted light intensity of mineral oil at a certain point in time and the degree of deterioration predicted from the deterioration curve at that point in time is equal to or less than a predetermined value, a first curve is used as a future deterioration curve, and if the difference between the degree of deterioration corresponding to the transmitted light intensity of mineral oil at that point in time and the degree of deterioration predicted from the deterioration curve at that point in time is greater than a predetermined value, a second curve, which deteriorates faster than the first curve, is used as a future deterioration curve.
- the second curve which deteriorates faster than the first curve, is used as the future deterioration curve, making it possible to accurately predict the remaining life of the mineral oil depending on the environment in which it is used.
- the rate of deterioration of the oils and fats targeted for deterioration prediction, particularly edible oils, can change frequently depending on factors such as the type and amount of ingredients being cooked and the number of times cooking is performed. For this reason, updating an edible oil deterioration prediction model (future deterioration curve) using the method described in Patent Document 1 only takes into account the discrepancy between the actual deterioration level at a given point in time and the predicted deterioration level, which is insufficient in terms of the accuracy of deterioration prediction.
- the object of the present invention is to provide an oil deterioration prediction device, an oil deterioration prediction system, and an oil deterioration prediction method that can accurately predict the deterioration of oils and fats in response to changes in the environment and conditions in which the oils and fats are used.
- the present invention is an oil deterioration prediction device for predicting deterioration of oils and fats, and is characterized by including: a storage unit that stores a deterioration characteristic model showing the progress of a deterioration index, which is an index showing the degree of deterioration of the oils and fats, and a deterioration reference value showing a standard for the deterioration index; a data acquisition unit that acquires the measurement values of the deterioration index; a model update unit that updates the deterioration characteristic model stored in the storage unit based on the most recent multiple measurement values acquired by the data acquisition unit; a deterioration prediction unit that predicts deterioration information, which is information related to the deterioration of the oils and fats, based on the latest measurement values acquired by the data acquisition unit, the updated deterioration characteristic model updated by the model update unit, and the deterioration reference value stored in the storage unit; and a result output unit that outputs the prediction result of the deterioration information predicted by the
- the oil is edible oil used when cooking food with a cooking utensil
- the deterioration information includes at least one of the following data: data indicating the remaining time until the edible oil reaches a predetermined point of waste oil, data indicating the timing to remove and insert the edible oil in the cooking utensil to remove a portion of the edible oil and inject another edible oil different from the edible oil, data indicating the timing to filter the edible oil in the cooking utensil, and data indicating the remaining amount of food that can be cooked with the edible oil before it reaches a predetermined degree of deterioration.
- the deterioration characteristic model includes at least one of a model showing a correlation between the heating time of the edible oil and the deterioration index, and a model showing a correlation between the amount of food ingredients that can be cooked with the edible oil and the deterioration index.
- the present invention also provides an oil deterioration prediction system that predicts deterioration of oils and fats and notifies the prediction result, comprising a measurement device that measures a deterioration index that is an index showing the degree of deterioration of the oils and fats, an oil deterioration prediction device that predicts deterioration information that is information related to the deterioration of the oils and fats using the measurement value of the deterioration index measured by the measurement device, and an alarm device that notifies the prediction result of the deterioration information predicted by the oil deterioration prediction device, wherein the oil deterioration prediction device stores a deterioration characteristic model that shows the progress of the deterioration index and a deterioration reference value that shows a standard related to the deterioration index, acquires the measurement value of the deterioration index measured by the measurement device, updates the stored deterioration characteristic model based on the acquired multiple most recent measurement values, predicts the deterioration information based on the acquired latest measurement value, the
- the oil is edible oil used when cooking food with a cooking utensil
- the deterioration information includes at least one of the following data: data indicating the remaining time until the edible oil reaches a predetermined point of waste oil, data indicating the timing to remove and insert the edible oil in the cooking utensil to remove a portion of the edible oil and inject another edible oil different from the edible oil, data indicating the timing to filter the edible oil in the cooking utensil, and data indicating the remaining amount of food that can be cooked with the edible oil before it reaches a predetermined degree of deterioration.
- the deterioration characteristic model includes at least one of a model showing a correlation between the heating time of the edible oil and the deterioration index, and a model showing a correlation between the amount of food ingredients that can be cooked with the edible oil and the deterioration index.
- the oil deterioration prediction device acquires the measurement values of the deterioration index at a predetermined cycle, and updates the stored deterioration characteristic model based on the measurement values for the last two business days in the store that uses the oil, including the most recent acquired measurement value.
- the present invention also provides an oil deterioration prediction method for predicting the deterioration of the oil and notifying the prediction result using a measurement device for measuring a deterioration index, which is an index showing the deterioration degree of the oil, an oil deterioration prediction device for predicting deterioration information, which is information related to the deterioration of the oil, using a measurement value of the deterioration index measured by the measurement device, and an alarm device for notifying the prediction result of the deterioration information predicted by the oil deterioration prediction device, wherein the oil deterioration prediction device respectively stores a deterioration characteristic model showing the progress of the deterioration index and a deterioration standard value showing a standard related to the deterioration index, and the measurement device includes a measurement step in which the measurement device measures the deterioration index, a data acquisition step in which the oil deterioration prediction device acquires the measurement value of the deterioration index measured in the measurement step, and a data acquisition step in which
- the method includes a model update step of updating a deterioration characteristic model showing the progress of the stored deterioration index based on the most recent measured values acquired in the data acquisition step, a deterioration prediction step in which the oil deterioration prediction device predicts the deterioration information based on the latest measured values acquired in the data acquisition step, the updated deterioration characteristic model updated in the model update step, and a deterioration reference value showing a reference for the stored deterioration index, a result output step in which the oil deterioration prediction device outputs the prediction result of the deterioration information predicted in the deterioration prediction step to the notification device, and a notification step in which the notification device acquires the prediction result of the deterioration information output in the result output step and notifies the user.
- the oils and fats are edible oils used when cooking food with a cooking utensil
- the deterioration information includes at least one of the following data: data indicating the remaining time until the edible oil reaches a predetermined point of waste oil, data indicating the timing for removing and inserting the edible oil in the cooking utensil to remove a portion of the edible oil and inject another edible oil different from the edible oil, data indicating the timing for filtering the edible oil in the cooking utensil, and data indicating the remaining amount of food that can be cooked with the edible oil before it reaches a predetermined degree of deterioration.
- the oil and fat deterioration prediction device acquires the measurement values of the deterioration index at a predetermined cycle, and in the model update step, the oil and fat deterioration prediction device updates the stored deterioration characteristic model based on the measurement values for the most recent two business days in a store that uses the oil and fat, including the latest measurement values acquired in the data acquisition step.
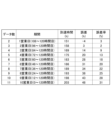
- 15 is a table showing the number of data used in the deterioration characteristic model, the period corresponding to the number of data, the time from the present time to the time of oil disposal, the error, and the error rate for the graph shown in FIG. 14.
- 1 is a graph showing the change in acid value of frying oil versus heating time at a certain convenience store.
- 17 is a table showing the number of data used in the deterioration characteristic model, the period corresponding to the number of data, the time from the present time to the time of oil disposal, the error, and the error rate for the graph shown in FIG. 16.
- 1 is a graph showing the change in acid value of frying oil versus the number of business days a store is open.
- cooking fried foods will be referred to as “deep-frying”
- the edible oil used in deep-frying will be referred to as “deep-frying oil”
- the ingredients to be deep-fryed will be referred to as “fried ingredients”.
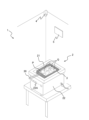
- Figure 1 shows a part of the kitchen 1 where deep-frying is performed.
- the fryer 2 is composed of an oil tank 21 for storing frying oil P, and a housing 22 for accommodating the oil tank 21. On the side of the housing 22, there are multiple setting switches 22A for setting the temperature of the frying oil P and the contents of the frying cooking according to the type of frying ingredient Q.
- the fryer 2 determines which setting switch 22A has been operated by the cook, and when the frying time associated with the operated setting switch 22A has elapsed, it notifies the cook that the food is done. At the same time, the fry basket 3 containing the fried food (fried food Q after frying) automatically rises from the oil tank 21, and the fried food is lifted out of the frying oil P from its submerged state.
- the cook senses that the deep-frying is complete, he or she lifts up the fry basket 3 and removes the fried food.
- the fry basket 3 may be automatically lifted from the oil tank 21 by providing a drive mechanism on the fryer 2 side.
- the color of the frying oil P darkens as the heating time passes, and is therefore used as a deterioration index that indicates the degree of deterioration of the frying oil P (hereinafter simply referred to as the "degree of deterioration").
- the deterioration indexes of the frying oil P include, for example, the acid value (AV) of the frying oil P, the polar compound content (PC) of the frying oil P, the viscosity of the frying oil P, the viscosity increase rate of the frying oil P, the anisidine value of the frying oil P, the carbonyl value of the frying oil P, the smoke point of the frying oil P, the tocopherol content of the frying oil P, the iodine value of the frying oil P, the refractive index of the frying oil P, the amount of volatile components of the frying oil P, the composition of volatile components of the frying oil P, the flavor of the frying oil P, the
- Users who use the frying oil P e.g., cooks, store employees, etc.
- a general-purpose gas sensor for example, a semiconductor gas sensor or a quartz crystal resonator gas sensor.
- each deterioration index includes, for example, a method of using image recognition technology to determine the type and number of foods fried in the frying oil P from an image taken by the camera 4, and estimating each deterioration index based on the correlation between the type and number of foods and each deterioration index, a method of measuring the spectrum of the frying oil P using a spectrometer, and estimating each deterioration index based on the correlation between the spectrum of the frying oil P and each deterioration index, and a method of estimating each deterioration index based on the correlation between the number of times the setting switch 22A of the fryer 2 has been operated (i.e., the number of times deep-frying has been performed) and each deterioration index.
- the measurement of the deterioration index of frying oil P is not necessarily limited to the above-mentioned measuring device and measuring method, and any known measuring device or measuring method may be used.
- Frying oil P exhibits deterioration characteristics that progress in the direction of deterioration as the heating time or the number of fried items Q increases.
- the deterioration characteristics of this frying oil P are not fixed, but vary depending on the environment and conditions in which the frying oil P is used. Therefore, for example, frying oil P used in the same store will not always exhibit the same deterioration characteristics.
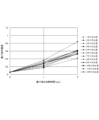
- Figure 2 shows the change in acid value of frying oil P versus heating time [days] for the 1st to 12th cycles at a certain store, where one cycle is defined as the time from when frying oil P goes from new oil to when it becomes waste oil.
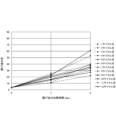
- Figure 3 shows the change in color of frying oil P versus heating time [days] for the 1st to 12th cycles at a certain store.
- the first cycle is shown as a graph with multiple ⁇ marks connected by dotted lines
- the second cycle is shown as a graph with multiple ⁇ marks connected by dashed lines
- the third cycle is shown as a graph with multiple ⁇ marks connected by dashed lines
- the fourth cycle is shown as a graph with multiple ⁇ marks connected by dotted lines
- the fifth cycle is shown as a graph with multiple ⁇ marks connected by dotted lines
- the sixth cycle is shown as a graph with multiple ⁇ marks connected by dotted lines
- the seventh cycle is shown as a graph with multiple ⁇ marks connected by dotted lines
- the eighth cycle is shown as a graph with multiple ⁇ marks connected by dashed lines
- the ninth cycle is shown as a graph with multiple ⁇ marks connected by solid lines
- the tenth cycle is shown as a graph with multiple ⁇ marks connected by solid lines
- the eleventh cycle is shown as a graph with multiple ⁇ marks connected by dotted lines
- the twelfth cycle is shown as a graph with multiple ⁇ marks connected
- the acid value of the frying oil P in the 6th cycle is approximately 0.38 one day after the start of the new oil state, and approximately 0.85 two days after the start of the new oil state
- the acid value of the frying oil P in the 8th cycle is approximately 0.19 one day after the start of the new oil state, and approximately 0.41 two days after the start of the new oil state.
- the way in which the acid value increases with heating time for each of the frying oils P in the 1st to 5th cycles, 7th cycle, and 9th to 12th cycles is different from one another.
- the color of the frying oil P in the 10th cycle is about 23 one day after it was fresh and about 61 two days after it was fresh
- the color of the frying oil P in the 12th cycle is about 16 one day after it was fresh and about 27 two days after it was fresh
- the color of the frying oil P in the 1st to 9th cycles and the 11th cycle also differ from each other in how they increase in color with heating time.
- Figures 2 and 3 show differences in how the deterioration index of frying oil P changes with respect to the heating time of frying oil P, this is not limited to the above, and there are similar differences in how the deterioration index of frying oil P changes with respect to the number of fried items Q that can be fried in frying oil P.
- Figure 4 is a graph showing the change in acid value of frying oil P relative to the number of pieces of frying ingredient Q fried in a certain store.
- Figure 5 is a graph showing the change in color of frying oil P relative to the number of pieces of frying ingredient Q fried in a certain store.
- Figure 4 shows how the acid value of frying oil P changes in relation to the number of items Q that can be fried in frying oil P for the first to fifth cycles at a certain store, where one cycle is defined as the time from when frying oil P goes from new oil to when it becomes waste oil.
- Figure 5 shows how the color of frying oil P changes in relation to the number of items Q that can be fried in frying oil P for the first to fifth cycles at a certain store.
- x written on the horizontal axis of each of Figures 4 and 5 indicates the number of fried ingredients Q per set, which is predetermined for each store. For example, in a store that sells only croquettes, one set would contain 10 croquettes, and in a store that sells both croquettes and fried chicken, one set would contain 4 croquettes and 5 pieces of fried chicken. By checking the number of sets, deterioration of the frying oil P can be managed.
- Figures 4 and 5 each only show up to 3x pieces (3 sets) of fried frying ingredients Q
- the waste oil P is not necessarily used once every 3x pieces of fried frying ingredients Q are fried, and the frying oil P may continue to be used when frying 4x pieces (4 sets) or more of fried frying ingredients Q.
- Figure 4 shows the change in acid value of the frying oil P from the state of new oil until the number of fried frying ingredients Q reaches 6x
- Figure 5 shows the change in color of the frying oil P from the state of new oil until the number of fried frying ingredients Q reaches 3x.
- the first cycle is shown as a graph with multiple ⁇ marks connected by dashed lines
- the second cycle is shown as a graph with multiple ⁇ marks connected by solid lines
- the third cycle is shown as a graph with multiple ⁇ marks connected by dotted lines
- the fourth cycle is shown as a graph with multiple ⁇ marks connected by solid lines
- the fifth cycle is shown as a graph with multiple ⁇ marks connected by dashed lines.
- the frying oil P in the first cycle has an acid value of about 0.41 after x number of frying ingredients Q (1 set) are fried from the fresh oil state, an acid value of about 0.99 after 2x number of frying ingredients Q (2 sets) are fried from the fresh oil state, and an acid value of about 1.48 after 3x number of frying ingredients Q (3 sets) are fried from the fresh oil state
- the frying oil P in the fifth cycle has an acid value of about 0.58 after x number of frying ingredients Q are fried from the fresh oil state, an acid value of about 1.21 after 2x number of frying ingredients Q are fried from the fresh oil state, and an acid value of about 1.82 after 3x number of frying ingredients Q are fried from the fresh oil state.
- the acid value of each frying oil P in the second to fourth cycles also increases differently with respect to the number of frying ingredients Q.
- the color of the frying oil P in the second cycle is about 16 after x number of frying ingredients Q have been fried from the fresh oil state, about 45 after 2x number of frying ingredients Q have been fried from the fresh oil state, and exactly 100 after 3x number of frying ingredients Q have been fried from the fresh oil state
- the color of the frying oil P in the fifth cycle is about 19 after x number of frying ingredients Q have been fried from the fresh oil state, about 50 after 2x number of frying ingredients Q have been fried from the fresh oil state, and about 132 after 3x number of frying ingredients Q have been fried from the fresh oil state.
- the color of the frying oil P in the first, third, and fourth cycles also differ from one another in how the color increases with the number of frying ingredients Q.
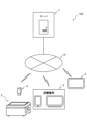
- FIG. 6 is a system configuration diagram showing an example of the configuration of a frying oil P deterioration prediction system 100.
- the frying oil P deterioration prediction system 100 is a system that predicts deterioration of frying oil P and notifies the prediction results, and is composed of store terminals 6 installed in each of a number of stores that make up, for example, a convenience store chain or a supermarket chain, a server 7 that executes a program that predicts the deterioration of the frying oil P used in each store, and a monitor 5 (see Figure 1) installed in each store.
- the monitor 5, store terminal 6, and server 7 of each store are connected to each other directly or indirectly via a communication network N such as an Internet line so that they can communicate information with each other.
- the store terminals 6 in each of the multiple stores are all configured in the same way, so in the following, the store terminal 6 in one store will be used as an example, and a description of the store terminals 6 in the other stores will be omitted.
- the store terminal 6 is an input terminal into which information related to the frying oil P being used in the store and information related to the frying ingredients Q are input, and is also a management terminal that manages the frying oil P being used in the store.
- An application for managing the frying oil P (hereinafter referred to as the "frying oil management app") is installed in the store terminal 6.
- the information related to the frying oil P includes data related to the measurement values of the deterioration indexes of the frying oil P (e.g., the measurement values of the acid value and the color).
- the information related to the frying ingredient Q includes data related to the type and number of the frying ingredient Q fried in the frying oil P.
- the store terminal 6 is communicatively connected to the camera 4 installed in the kitchen 1 in the store, acquires image data captured by the camera 4, and acquires a measurement value of the color of the frying oil P in the oil tank 21 of the fryer 2 based on the acquired image.
- the store terminal 6 and the camera 4 do not necessarily need to be communicatively connected. If the store terminal 6 and the camera 4 are not communicatively connected, the image data captured by the camera 4 is read into the store terminal 6 via an external device, for example. The same applies to the method of acquiring measurement values of deterioration indicators other than color in the store terminal 6.
- the server 7 is one aspect of a deterioration prediction device that predicts deterioration information, which is information relating to the deterioration of the frying oil P, using the measured value of the deterioration index of the frying oil P.
- the server 7 is described as being realized by a server device installed in a headquarters center that oversees multiple stores, as shown in FIG. 6, but it does not necessarily have to be realized by a server device, and may also be realized by, for example, a cloud server constructed on the communication network N.
- the deterioration information includes at least one of the following data: data indicating the remaining time (remaining heating time) until the frying oil P reaches a specified point of waste oil, data indicating the timing to insert or remove the frying oil P from the fryer 2, data indicating the timing to filter the frying oil P from the fryer 2, and data indicating the remaining number of fried items Q that can be fried before the frying oil P reaches a specified level of deterioration.
- “adding and removing” means removing a portion of the frying oil P in the fryer 2 and adding (adding) another frying oil P1 that is different from the frying oil P.
- the "other frying oil P1" does not necessarily have to be new oil, and may be, for example, frying oil that is less deteriorated than the frying oil P in the fryer 2.
- the degree of deterioration of the frying oil P in the oil tank 21 of each fryer 2 progresses in the order of the tempura tank, the breaded side dishes tank, and the fried chicken tank.
- the fried chicken tank may be added with the frying oil P from the tempura tank or the frying oil P from the breaded side dishes tank.
- Frtration refers to passing the frying oil P in the fryer 2 through a filter to remove fried debris, or passing the frying oil P in the fryer 2 through a filter agent to regenerate it to a state close to new oil.
- the server 7 performs a deterioration prediction process to predict deterioration information of the frying oil P based on the measured value of the deterioration index of the frying oil P, a deterioration characteristic model showing the progress of the deterioration index of the frying oil P, and a deterioration standard value showing the standard for the deterioration index of the frying oil P, and outputs the prediction result to the monitor 5.
- the deterioration characteristic model of frying oil P includes at least one of a model showing the correlation between the heating time of frying oil P and the deterioration index of frying oil P, and a model showing the correlation between the number of fried items Q that can be fried in frying oil P and the deterioration index of frying oil P.
- the deterioration characteristic model of frying oil P corresponds to the graphs showing the deterioration characteristics of frying oil P exemplified in Figures 2 to 5, and since it is possible to predict the deterioration of frying oil P, it can also be called a "deterioration prediction model" of frying oil P.
- the server 7 does not predict deterioration information of frying oil P using a single preset deterioration characteristics model, but instead updates the deterioration characteristics model from time to time and predicts deterioration information of frying oil P using the updated deterioration characteristics model.
- the deterioration standard value of the frying oil P includes at least one of the following standard values: a waste oil standard value that is the standard for the deterioration index of the frying oil P at a specified time of waste oil, a removal and insertion standard value that is the standard for the deterioration index of the frying oil P when it is necessary to remove or insert the frying oil P in the fryer 2, and a filtration standard value that is the standard for the deterioration index of the frying oil P at the time of filtering the frying oil P in the fryer 2.
- These deterioration standards are set to values that correspond to the specifications of the deep-frying process performed in the store, and may be set based on information related to the content of the deep-frying process entered into the store terminal 6, or may be set to arbitrary values by, for example, a store employee.
- Monitor 5 is one aspect of an alarm device that notifies the deterioration information of frying oil P predicted by server 7. For example, when server 7 predicts the remaining time until frying oil P reaches a specified point of waste, monitor 5 displays a message such as "X hours left until the oil is wasted.” In addition, when server 7 predicts the remaining number of fried items Q that can be fried before frying oil P reaches the point of waste, monitor 5 displays a message such as "YY more fried items can be fried before the oil is wasted.”
- the monitor 5 is used to notify the deterioration information of the frying oil P, but this is not limited to the above, and the deterioration information of the frying oil P may be notified using the store terminal 6. Furthermore, the method of notifying the deterioration information of the frying oil P is not limited to a text display, and may be other methods, for example, audio.
- FIG. 7 shows an example of the hardware configuration of server 7.
- the server 7 includes, as the hardware configuration of the server device, a CPU (Central Processing Unit) 70A, a RAM (Random Access Memory) 70B, a ROM (Read Only Memory) 70C, a HDD (Hard Disk Drive) 70D, and an I/F (Interface) 70E. Each of these components is connected to each other via a common bus 70F.
- a CPU Central Processing Unit
- RAM Random Access Memory
- ROM Read Only Memory
- HDD Hard Disk Drive
- I/F Interface
- the CPU 70A is a computing device that controls the operation of the entire server 7.
- RAM 70B is a volatile storage medium that allows high-speed reading and writing of information, and is used, for example, as a working area when CPU 70A processes image information.
- ROM70C is a read-only non-volatile storage medium that stores programs such as firmware.
- the HDD 70D is a non-volatile storage medium that can read and write information and has a large storage capacity, and stores the OS (Operating System), control programs for executing various information processing operations described below, and application programs.
- OS Operating System
- control programs for executing various information processing operations described below
- application programs for executing various information processing operations described below
- HDD 70D can be replaced by any type of device, such as an SSD (Solid State Drive), as long as it is a non-volatile storage medium capable of storing and managing information.
- SSD Solid State Drive
- I/F70E is a connection interface with the communication network N, and is connected to the monitors 5 and store terminals 6 of each store.
- the server 7 with such a hardware configuration is an information processing device that realizes processing functions by using the calculation functions of the CPU 70A to process control programs stored in the ROM 70C and control programs and application programs loaded from a storage medium such as the HDD 70D to the RAM 70B.
- a software control unit including various functional modules in the server 7 is configured.
- the software control unit configured in this way is combined with hardware resources including the above configuration to form a functional block that realizes the functions of the server 7.
- server 7 is a cloud server
- the computer that realizes the cloud server e.g., a computer owned by a company that provides a cloud system
- the computer that realizes the cloud server will have the above hardware configuration.
- FIG. 8 is a functional block diagram showing the functions of server 7.
- the server 7 includes a data acquisition unit 71, a storage unit 72, a model update unit 73, a deterioration prediction unit 74, and a result output unit 75.
- the data acquisition unit 71 acquires data related to the measurement value of the deterioration index of the frying oil P output from the store terminal 6.
- the deterioration index of the frying oil P in use is often measured at a specific time during the day, such as after closing time. Therefore, the data acquisition unit 71 acquires the measurement value of the deterioration index of the frying oil P at a specific period (for example, once every 12 hours or once every 24 hours).
- the measured value of the deterioration index of the frying oil P acquired by the data acquisition unit 71 is data output from the store terminal 6 to the server 7, but is not limited to this and may be, for example, data output to the server 7 from a measuring device that measures the deterioration index of the frying oil P.
- the memory unit 72 stores a deterioration characteristic model of the frying oil P and a deterioration reference value of the frying oil P. Furthermore, when the data acquisition unit 71 acquires a measurement value of the deterioration index of the frying oil P, the memory unit 72 stores the measurement value. In other words, the memory unit 72 stores past measurement values of the deterioration index of the frying oil P.
- the model update unit 73 updates the deterioration characteristic model of frying oil P stored in the memory unit 72 based on the most recent measurement values of the deterioration index of frying oil P, including the most recent measurement value of the deterioration index of frying oil P acquired by the data acquisition unit 71.
- the model update unit 73 it is desirable for the model update unit 73 to update the deterioration characteristic model of frying oil P stored in the memory unit 72 based on the measured values of the deterioration index of frying oil P for the most recent two business days in the store (the store that uses frying oil P), including the latest measured value of the deterioration index of frying oil P acquired by the data acquisition unit 71.
- the memory unit 72 always stores the updated deterioration characteristic model of frying oil P updated by the model update unit 73.
- the deterioration prediction unit 74 predicts at least one of the following based on the latest measurement value of the deterioration index of the frying oil P acquired by the data acquisition unit 71, the deterioration characteristic model of the frying oil P after updating by the model update unit 73, and the deterioration standard value of the frying oil P stored in the memory unit 72: the remaining heating time until the frying oil P reaches a predetermined waste oil point, the timing for inserting and removing the frying oil P in the fryer 2, the timing for filtering the frying oil P in the fryer 2, and the number of remaining fried items Q that can be fried before the frying oil P reaches a predetermined deterioration level.
- the result output unit 75 outputs the predicted results of the deterioration information of the frying oil P predicted by the deterioration prediction unit 74 to the monitor 5.
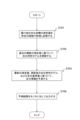
- FIG. 9 is a flowchart showing the flow of processing executed by the server 7.
- the data acquisition unit 71 first acquires the measurement value of the deterioration index of the frying oil P, which is measured by a measurement device (e.g., the camera 4 when the deterioration index is color) (measurement step) and output from the store terminal 6, at a predetermined interval (data acquisition step).
- the memory unit 72 stores the measurement value each time the data acquisition unit 71 acquires the measurement value of the deterioration index of the frying oil P (step S701).
- the model update unit 73 updates the deterioration characteristic model of the frying oil P stored in the memory unit 72 based on the most recent measurement values of the deterioration index of the frying oil P obtained in step S701 (preferably, the measurement values for the most recent two business days at the store, including the most recent measurement value) (step S702; model update step).
- the deterioration prediction unit 74 predicts deterioration information of the frying oil P based on the latest measurement value of the deterioration index of the frying oil P obtained in step S701, the deterioration characteristic model of the frying oil P after updating in step S702, and the deterioration reference value of the frying oil P stored in the memory unit 72 (step S703; deterioration prediction step).
- the result output unit 75 outputs the predicted result of the deterioration information of the frying oil P predicted in step S703 to the monitor 5 (step S704; result output step), and the processing in the server 7 ends.
- the monitor 5 notifies the store employee of the information (for example, "There are xx hours left until the oil is wasted,” “Yxx more fries can be made before the oil is wasted,” “Please remove and insert the oil in ⁇ hours,” etc.) by displaying it on the screen or by voice (notification step).
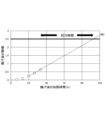
- Figure 10 is a diagram showing an example of a deterioration characteristic model when the heating time of frying oil P is 40 hours.
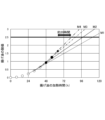
- Figure 11 is a diagram showing an example of an update to the deterioration characteristic model when the heating time of frying oil P is 48 hours.
- Figure 12 is a diagram showing an example of an update to the deterioration characteristic model when the heating time of frying oil P is 56 hours.
- Figure 13 is a diagram showing an example of an update to the deterioration characteristic model when the heating time of frying oil P is 64 hours.
- Figures 10 to 13 each show an example of the relationship between the heating time of frying oil P and the measured acid value of frying oil P in a store where the acid value of frying oil P is measured once every 8 hours.
- the deterioration characteristic model M1 of the frying oil P at the point when the heating time of the frying oil P has reached 40 hours will be referred to as the "first deterioration characteristic model M1.”
- the deterioration prediction unit 74 calculates the current heating time of the frying oil P by applying the measured value of the deterioration index of the frying oil P acquired by the data acquisition unit 71 to the deterioration characteristic model of the frying oil P.
- the deterioration prediction unit 74 uses the updated deterioration characteristic model M2 (shown by the dashed line in FIG. 11) obtained by updating the first deterioration characteristic model M1 by the model update unit 73, rather than the first deterioration characteristic model M1 (shown by the dotted line in FIG. 11) stored in the memory unit 72.
- the degradation characteristic model M2 obtained after the first degradation characteristic model M1 is updated by the model update unit 73 will be referred to as the "second degradation characteristic model M2.”
- this second deterioration characteristic model M2 reflects the latest measured acid value of frying oil P (approximately 0.9), so that its slope is steeper than that of the first deterioration characteristic model M1, making it a model that is consistent with the actual deterioration progress of frying oil P at the current point in time (when frying oil P has been heated for 48 hours).
- the deterioration prediction unit 74 applies the latest measured acid value of the frying oil P (approximately 0.9) acquired by the data acquisition unit 71 and the waste oil standard value of 2.5 stored in the memory unit 72 to the updated second deterioration characteristic model M2 updated by the model update unit 73, and predicts that the remaining time until the frying oil P will be wasted is approximately 50 hours.
- the deterioration prediction unit 74 were to apply the latest measured acid value of the frying oil P (approximately 0.9) acquired by the data acquisition unit 71 and the waste oil standard value of 2.5 stored in the memory unit 72 to the first deterioration characteristic model M1, which is the deterioration characteristic model before the update, the remaining time until the frying oil P becomes waste oil would be approximately 62 hours, resulting in a difference in the prediction result compared to when it is applied to the second deterioration characteristic model M2.
- the deterioration prediction unit 74 uses the updated deterioration characteristic model M3 (shown by a dashed line in FIG. 12) obtained by updating the second deterioration characteristic model M2 by the model update unit 73, rather than the second deterioration characteristic model M2 (shown by a dashed line in FIG. 12) stored in the memory unit 72.
- the degradation characteristic model M3 obtained after the second degradation characteristic model M2 is updated by the model update unit 73 will be referred to as the "third degradation characteristic model M3.”
- this third deterioration characteristic model M3 reflects the latest measured value of the acid value of frying oil P (approximately 1.3), so that the slope of the third deterioration characteristic model M3 is steeper than the slopes of the first deterioration characteristic model M1 and the second deterioration characteristic model M2, making it a model that is consistent with the actual deterioration progress of frying oil P at the current point in time (when frying oil P has been heated for 56 hours).
- the deterioration prediction unit 74 applies the latest measured acid value of the frying oil P (approximately 1.3) acquired by the data acquisition unit 71 and the waste oil standard value of 2.5 stored in the memory unit 72 to the updated third deterioration characteristic model M3 updated by the model update unit 73, and predicts that the remaining time until the frying oil P will be wasted is approximately 30 hours.
- the deterioration prediction unit 74 were to apply the latest measured acid value of the frying oil P (approximately 1.3) acquired by the data acquisition unit 71 and the waste oil standard value of 2.5 stored in the memory unit 72 to the second deterioration characteristic model M2, which is the deterioration characteristic model before the update, the remaining time until the frying oil P becomes waste oil would be approximately 42 hours, resulting in a difference in the prediction result compared to when it is applied to the third deterioration characteristic model M3.
- the deterioration prediction unit 74 uses the updated deterioration characteristic model M4 (shown by a two-dot chain line in FIG. 13) obtained by updating the third deterioration characteristic model M3 by the model update unit 73, rather than the third deterioration characteristic model M3 (shown by a dashed line in FIG. 13) stored in the memory unit 72.
- the degradation characteristic model M4 obtained after the third degradation characteristic model M3 is updated by the model update unit 73 will be referred to as the "fourth degradation characteristic model M4.”
- this fourth deterioration characteristic model M4 reflects the latest measured acid value of frying oil P (approximately 1.7), so that its slope is steeper than the slopes of the first deterioration characteristic model M1, the second deterioration characteristic model M2, and the third deterioration characteristic model M3, making it a model that is consistent with the actual deterioration progress of frying oil P at the current point in time (when frying oil P has been heated for 64 hours).
- the deterioration prediction unit 74 applies the latest measured acid value of the frying oil P (approximately 1.7) acquired by the data acquisition unit 71 and the waste oil standard value of 2.5 stored in the memory unit 72 to the updated fourth deterioration characteristic model M4 updated by the model update unit 73, and predicts that the remaining time until the frying oil P will be wasted is approximately 20 hours.
- the deterioration prediction unit 74 were to apply the latest measured acid value of the frying oil P (approximately 1.7) acquired by the data acquisition unit 71 and the waste oil standard value of 2.5 stored in the memory unit 72 to the third deterioration characteristic model M3, which is the deterioration characteristic model before the update, the remaining time until the frying oil P becomes waste oil would be approximately 22 hours, resulting in a difference in the prediction result compared to when it is applied to the fourth deterioration characteristic model M4.
- the deterioration prediction unit 74 applies the latest measured acid value of the frying oil P (approximately 1.7) acquired by the data acquisition unit 71 and the waste oil standard value of 2.5 stored in the memory unit 72 to the second deterioration characteristic model M2, which is a model when the heating time of the frying oil P is 48 hours, the remaining time until the frying oil P becomes waste oil is approximately 26 hours, and the difference in the prediction result becomes even greater when applied to the fourth deterioration characteristic model M4.
- the deterioration prediction unit 74 applies the latest measured acid value of the frying oil P (approximately 1.7) acquired by the data acquisition unit 71 and the waste oil standard value of 2.5 stored in the memory unit 72 to the first deterioration characteristic model M1, which is a model when the heating time of the frying oil P is 40 hours, the remaining time until the frying oil P becomes waste oil is approximately 30 hours, and the difference in the prediction result becomes even greater when applied to the fourth deterioration characteristic model M4.
- the server 7 updates the deterioration characteristic model of the frying oil P based on the most recent measurement values of multiple deterioration indexes including the latest measurement value of the deterioration index of the frying oil P, and predicts the deterioration information of the frying oil P using the updated deterioration characteristic model, so that even if the usage environment or usage conditions of the frying oil P change, it is possible to obtain prediction results that correspond to the actual progress of deterioration of the frying oil P. Therefore, the server 7 can obtain prediction results with higher accuracy than when predicting the deterioration of the frying oil P using a predetermined deterioration characteristic model.
- the method of predicting deterioration of the frying oil P in the server 7 is also the same for predicting the timing to insert or remove the frying oil P from the fryer 2, predicting the timing to filter the frying oil P from the fryer 2, and predicting the remaining number of fried foods that can be fried before the frying oil P reaches a specified level of deterioration.
- the above description shows the first deterioration characteristic model M1, the second deterioration characteristic model M2, the third deterioration characteristic model M3, and the fourth deterioration characteristic model M4 as the deterioration characteristic models of the frying oil P.
- the server 7 does not store multiple deterioration characteristic models (the first deterioration characteristic model M1, the second deterioration characteristic model M2, the third deterioration characteristic model M3, and the fourth deterioration characteristic model M4) in the memory unit 72 and select one deterioration characteristic model from among them to use in predicting the deterioration information of the frying oil P. Rather, the server 7 updates one deterioration characteristic model from time to time and uses the updated deterioration characteristic model in predicting the deterioration information of the frying oil P.
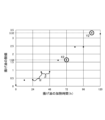
- Figure 14 is a graph showing the change in acid value of frying oil P versus heating time at a certain supermarket.
- Figure 15 is a table showing the number of data points used in the deterioration characteristic model, the period corresponding to the number of data points, the time from the current point in time to the point at which the oil is wasted, the error, and the error rate for the graph shown in Figure 14.
- the server 7 predicts the remaining time until the frying oil P reaches the waste oil standard value of 2.58 (plot indicated by Y1 in FIG. 14) based on each of the acid value measurements of the frying oil P shown in FIG. 14, up to the acid value measurement value of 1.69 (plot indicated by X1 in FIG. 14) of the frying oil P when the heating time of the frying oil P has reached 120 hours.
- the server 7 can predict the deterioration information of the frying oil P with good accuracy by using a deterioration characteristic model of the frying oil P updated based on the measured acid value of the frying oil P for the most recent one or two business days acquired by the data acquisition unit 71.
- Figure 16 is a graph showing the change in acid value of frying oil P versus heating time at a certain convenience store.
- Figure 17 is a table showing the number of data points used in the deterioration characteristic model, the period corresponding to the number of data points, the time from the current point in time to the point at which the oil is wasted, the error, and the error rate for the graph shown in Figure 16.
- a business day is divided into time periods when deep-frying is often performed (for example, the time periods indicated by ⁇ in FIG. 16) and time periods when dry heating is often performed (for example, the time periods indicated by ⁇ in FIG. 16).
- dry heating refers to heating only the frying oil P without cooking the deep-frying ingredients Q (food ingredients). As shown in FIG. 16, while dry heating is being performed, the frying oil P is less likely to deteriorate than while deep-frying is being performed.
- server 7 predicts the remaining time until frying oil P reaches the waste oil standard value of 3.32 (plot indicated by Y2 in FIG. 16) based on each of the acid value measurements of frying oil P shown in FIG. 16, up to the acid value measurement value of 1.64 (plot indicated by X2 in FIG. 16) of frying oil P when the heating time of frying oil P has reached 72 hours.
- the deterioration characteristic model of the frying oil P reflects both the effects of deep-frying and the effects of empty heating, so the error rate between the predicted arrival time and the actual arrival time in the server 7 is reduced, improving the prediction accuracy in the server 7.
- the server 7 can predict the deterioration information of the frying oil P most accurately by using a deterioration characteristic model of the frying oil P updated based on the measured acid value of the frying oil P for the most recent business day acquired by the data acquisition unit 71.
- the server 7 can predict the deterioration information of the frying oil P with the highest accuracy by using a deterioration characteristic model of the frying oil P updated based on the measured acid value of the frying oil P for the most recent business day acquired by the data acquisition unit 71.
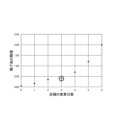
- Figure 18 is a graph showing the change in acid value of frying oil P versus the number of business days a store is open.
- the measured acid value of the frying oil P is approximately 0.2, and after two business days the measured acid value of the frying oil P is approximately 0.4, and the frying oil P is gradually deteriorating. After that, after three, four, five, and six business days have passed, the measured acid value of the frying oil P normally increases at a certain rate.
- the server 7 predicts deterioration information of the frying oil P using a deterioration characteristic model of the frying oil P updated based on the measured acid value of the frying oil P for the most recent business day acquired by the data acquisition unit 71, if the measured acid value of the frying oil P for one day on the third business day shown in Figure 18 is used, the prediction result of the deterioration information of the frying oil P will differ from the case where the measured acid value of the frying oil P for one day on another business day shown in Figure 18 is used.
- the deterioration characteristic model of frying oil P is based on the measured acid value of frying oil P for the most recent business day acquired by data acquisition unit 71, there is a possibility that the prediction accuracy of deterioration information of frying oil P in server 7 will be significantly reduced if sales of fried foods on that day happen to be low and deterioration of frying oil P does not progress.
- the server 7 it is desirable for the server 7 to update the deterioration characteristic model of the frying oil P based on the measurement values of the deterioration index of the frying oil P for the most recent two business days at the store, including the latest measurement value of the deterioration index of the frying oil P acquired by the data acquisition unit 71, in order to avoid a decrease in prediction accuracy due to variations in sales of fried foods at such stores.
- the server 7 was described as one aspect of the frying oil P deterioration prediction device, but this is not limited thereto, and the function of the frying oil P deterioration prediction device may be performed by a frying oil management app in the store terminal 6.
- color and acid value are mainly used as examples of deterioration indicators for frying oil P, but this is not limited thereto, and the present invention can be applied even when deterioration indicators other than color and acid value are used.
- the deterioration characteristic model of the frying oil P was a simple regression model expressed in the form of a linear equation, but there are no particular limitations on the type of deterioration characteristic model, and it may be, for example, a linear regression model other than simple regression, such as multiple regression, or a model generated by machine learning.
- the oil and fat is described as frying oil P, but the oil and fat to which the present invention is applied does not necessarily have to be edible oil used for deep-frying, but may be edible oil used for other types of cooking or other oils and fats (industrial oils, etc.).
Landscapes
- Engineering & Computer Science (AREA)
- Food Science & Technology (AREA)
- Health & Medical Sciences (AREA)
- Life Sciences & Earth Sciences (AREA)
- Chemical & Material Sciences (AREA)
- Medicinal Chemistry (AREA)
- Physics & Mathematics (AREA)
- Analytical Chemistry (AREA)
- Biochemistry (AREA)
- General Health & Medical Sciences (AREA)
- General Physics & Mathematics (AREA)
- Immunology (AREA)
- Pathology (AREA)
- Frying-Pans Or Fryers (AREA)
Abstract
Description
まず、揚げ調理が行われる環境の一例について、図1を参照して説明する。
次に、揚げ油Pの劣化特性について、図2~5を参照して説明する。
次に、揚げ油劣化予測システムとしての揚げ油Pの劣化予測システム100の構成について、図6を参照して説明する。
次に、サーバ7の構成について、図7および図8を参照して説明する。
次に、サーバ7内で実行される処理について、図9を参照して説明する。
次に、サーバ7で行われる揚げ油Pの劣化特性モデルの更新および劣化予測の具体的な方法について、図10~18を参照して説明する。
5:モニタ(報知装置)
6:店舗端末(報知装置、油脂劣化予測装置)
7:サーバ(油脂劣化予測装置)
71:データ取得部
72:記憶部
73:モデル更新部
74:劣化予測部
75:結果出力部
100:揚げ油劣化予測システム(油脂劣化予測システム)
P:揚げ油(食用油)
Q:揚げ種(食材)
Claims (12)
- 油脂の劣化を予測する油脂劣化予測装置であって、
前記油脂の劣化度合いを示す指標である劣化指標の推移を示す劣化特性モデルおよび前記劣化指標に関する基準を示す劣化基準値をそれぞれ記憶する記憶部と、
前記劣化指標の測定値を取得するデータ取得部と、
前記データ取得部にて取得された直近の複数の前記測定値に基づいて、前記記憶部に記憶されている前記劣化特性モデルを更新するモデル更新部と、
前記データ取得部にて取得された最新の前記測定値と、前記モデル更新部にて更新された更新後の前記劣化特性モデルと、前記記憶部に記憶されている前記劣化基準値と、に基づいて、前記油脂の劣化に関する情報である劣化情報を予測する劣化予測部と、
前記劣化予測部にて予測された前記劣化情報の予測結果を出力する結果出力部と、を含むことを特徴とする油脂劣化予測装置。 - 請求項1に記載の油脂劣化予測装置であって、
前記油脂は、調理器具にて食材を調理する場合に用いられる食用油であり、
前記劣化情報には、
前記食用油が所定の廃油時点に至るまでの残時間を示すデータ、前記調理器具内の前記食用油の一部を抜いて前記食用油とは異なる他の食用油を注入する抜き差しを行うタイミングを示すデータ、前記調理器具内の前記食用油をろ過するタイミングを示すデータ、および、前記食用油が所定の劣化度に至るまでに調理することが可能な残りの食材の量を示すデータのうちの少なくとも一のデータが含まれることを特徴とする油脂劣化予測装置。 - 請求項2に記載の油脂劣化予測装置であって、
前記劣化特性モデルには、
前記食用油の加熱時間と前記劣化指標との相関を示すモデル、および、前記食用油で調理することが可能な食材の量と前記劣化指標との相関を示すモデルのうちの少なくとも一のモデルが含まれることを特徴とする油脂劣化予測装置。 - 請求項1に記載の油脂劣化予測装置であって、
前記データ取得部は、
前記劣化指標の前記測定値を所定の周期で取得し、
前記モデル更新部は、
前記データ取得部にて取得された最新の前記測定値を含む、前記油脂を使用する店における直近の2営業日分の前記測定値に基づいて、前記記憶部に記憶されている前記劣化特性モデルを更新することを特徴とする油脂劣化予測装置。 - 油脂の劣化を予測して予測結果を報知する油脂劣化予測システムであって、
前記油脂の劣化度合いを示す指標である劣化指標を測定する測定装置と、
前記測定装置で測定された前記劣化指標の測定値を用いて前記油脂の劣化に関する情報である劣化情報を予測する油脂劣化予測装置と、
前記油脂劣化予測装置で予測された前記劣化情報の前記予測結果を報知する報知装置と、を備え、
前記油脂劣化予測装置は、
前記劣化指標の推移を示す劣化特性モデルおよび前記劣化指標に関する基準を示す劣化基準値をそれぞれ記憶し、
前記測定装置で測定された前記劣化指標の前記測定値を取得し、
取得した直近の複数の前記測定値に基づいて、記憶している前記劣化特性モデルを更新し、
取得した最新の前記測定値と、更新後の前記劣化特性モデルと、記憶している前記劣化基準値と、に基づいて、前記劣化情報を予測し、
予測した前記劣化情報の前記予測結果を前記報知装置に対して出力することを特徴とする油脂劣化予測システム。 - 請求項5に記載の油脂劣化予測システムであって、
前記油脂は、調理器具にて食材を調理する場合に用いられる食用油であり、
前記劣化情報には、
前記食用油が所定の廃油時点に至るまでの残時間を示すデータ、前記調理器具内の前記食用油の一部を抜いて前記食用油とは異なる他の食用油を注入する抜き差しを行うタイミングを示すデータ、前記調理器具内の前記食用油をろ過するタイミングを示すデータ、および、前記食用油が所定の劣化度に至るまでに調理することが可能な残りの食材の量を示すデータのうちの少なくとも一のデータが含まれることを特徴とする油脂劣化予測システム。 - 請求項6に記載の油脂劣化予測システムであって、
前記劣化特性モデルには、
前記食用油の加熱時間と前記劣化指標との相関を示すモデル、および、前記食用油で調理することが可能な食材の量と前記劣化指標との相関を示すモデルのうちの少なくとも一のモデルが含まれることを特徴とする油脂劣化予測システム。 - 請求項5に記載の油脂劣化予測システムであって、
前記油脂劣化予測装置は、
前記劣化指標の前記測定値を所定の周期で取得し、
取得した最新の前記測定値を含む、前記油脂を使用する店における直近の2営業日分の前記測定値に基づいて、記憶している前記劣化特性モデルを更新することを特徴とする油脂劣化予測システム。 - 油脂の劣化度合いを示す指標である劣化指標を測定する測定装置と、前記測定装置で測定された前記劣化指標の測定値を用いて前記油脂の劣化に関する情報である劣化情報を予測する油脂劣化予測装置と、前記油脂劣化予測装置で予測された前記劣化情報の予測結果を報知する報知装置と、を用いて、前記油脂の劣化を予測して前記予測結果を報知する油脂劣化予測方法であって、
前記油脂劣化予測装置は、
前記劣化指標の推移を示す劣化特性モデルおよび前記劣化指標に関する基準を示す劣化基準値をそれぞれ記憶しており、
前記測定装置が、前記劣化指標を測定する測定ステップと、
前記油脂劣化予測装置が、前記測定ステップにて測定された前記測定値を取得するデータ取得ステップと、
前記油脂劣化予測装置が、前記データ取得ステップにて取得された直近の複数の前記測定値に基づいて、記憶している前記劣化特性モデルを更新するモデル更新ステップと、
前記油脂劣化予測装置が、前記データ取得ステップにて取得された最新の前記測定値と、前記モデル更新ステップにて更新された更新後の前記劣化特性モデルと、記憶している前記劣化基準値と、に基づいて、前記劣化情報を予測する劣化予測ステップと、
前記油脂劣化予測装置が、前記劣化予測ステップにて予測された前記予測結果を前記報知装置に対して出力する結果出力ステップと、
前記報知装置が、前記結果出力ステップにて出力された前記劣化情報の前記予測結果を取得して報知する報知ステップと、を含むことを特徴とする油脂劣化予測方法。 - 請求項9に記載の油脂劣化予測方法であって、
前記油脂は、調理器具にて食材を調理する場合に用いられる食用油であり、
前記劣化情報には、
前記食用油が所定の廃油時点に至るまでの残時間を示すデータ、前記調理器具内の前記食用油の一部を抜いて前記食用油とは異なる他の食用油を注入する抜き差しを行うタイミングを示すデータ、前記調理器具内の前記食用油をろ過するタイミングを示すデータ、および、前記食用油が所定の劣化度に至るまでに調理することが可能な残りの食材の量を示すデータのうちの少なくとも一のデータが含まれることを特徴とする油脂劣化予測方法。 - 請求項10に記載の油脂劣化予測方法であって、
前記劣化特性モデルには、
前記食用油の加熱時間と前記劣化指標との相関を示すモデル、および、前記食用油で調理することが可能な食材の量と前記劣化指標との相関を示すモデルのうちの少なくとも一のモデルが含まれることを特徴とする油脂劣化予測方法。 - 請求項9に記載の油脂劣化予測方法であって、
前記データ取得ステップでは、
前記油脂劣化予測装置は、前記劣化指標の前記測定値を所定の周期で取得し、
前記モデル更新ステップでは、
前記油脂劣化予測装置は、前記データ取得ステップにて取得された最新の前記測定値を含む、前記油脂を使用する店における直近の2営業日分の前記測定値に基づいて、記憶している前記劣化特性モデルを更新することを特徴とする油脂劣化予測方法。
Priority Applications (1)
| Application Number | Priority Date | Filing Date | Title |
|---|---|---|---|
| JP2024571650A JPWO2024154473A1 (ja) | 2023-01-17 | 2023-12-08 |
Applications Claiming Priority (2)
| Application Number | Priority Date | Filing Date | Title |
|---|---|---|---|
| JP2023-005156 | 2023-01-17 | ||
| JP2023005156 | 2023-01-17 |
Publications (1)
| Publication Number | Publication Date |
|---|---|
| WO2024154473A1 true WO2024154473A1 (ja) | 2024-07-25 |
Family
ID=91955727
Family Applications (1)
| Application Number | Title | Priority Date | Filing Date |
|---|---|---|---|
| PCT/JP2023/044062 Ceased WO2024154473A1 (ja) | 2023-01-17 | 2023-12-08 | 油脂劣化予測装置、油脂劣化予測システム、および油脂劣化予測方法 |
Country Status (2)
| Country | Link |
|---|---|
| JP (1) | JPWO2024154473A1 (ja) |
| WO (1) | WO2024154473A1 (ja) |
Cited By (1)
| Publication number | Priority date | Publication date | Assignee | Title |
|---|---|---|---|---|
| CN120929772A (zh) * | 2025-10-11 | 2025-11-11 | 南通昶昊机电制造有限公司 | 方便面油炸过程中油劣化程度在线检测方法及系统 |
Citations (5)
| Publication number | Priority date | Publication date | Assignee | Title |
|---|---|---|---|---|
| JP2007178144A (ja) * | 2005-12-27 | 2007-07-12 | Advanced Mask Inspection Technology Kk | パターン検査装置、パターン検査方法、検査対象試料、及び検査対象試料の管理方法 |
| JP2011094982A (ja) * | 2009-10-27 | 2011-05-12 | Sharp Corp | ネットワークシステム、精度管理方法、成分分析装置、および管理サーバ |
| WO2021079692A1 (ja) * | 2019-10-24 | 2021-04-29 | 株式会社J-オイルミルズ | 油脂の劣化予測装置、劣化予測システム、劣化予測方法、油脂交換システム及びフライヤーシステム |
| JP6997362B1 (ja) * | 2020-03-31 | 2022-01-17 | 株式会社J-オイルミルズ | 食用油の劣化度判定装置、食用油の劣化度判定システム、食用油の劣化度判定方法、食用油の劣化度判定プログラム、食用油の劣化度学習装置、食用油の劣化度判定に用いられる学習済モデル、及び食用油の交換システム |
| JP7171970B1 (ja) * | 2021-03-25 | 2022-11-15 | 株式会社J-オイルミルズ | 判定装置、学習装置、判定システム、判定方法、学習方法、及び、プログラム |
-
2023
- 2023-12-08 JP JP2024571650A patent/JPWO2024154473A1/ja active Pending
- 2023-12-08 WO PCT/JP2023/044062 patent/WO2024154473A1/ja not_active Ceased
Patent Citations (5)
| Publication number | Priority date | Publication date | Assignee | Title |
|---|---|---|---|---|
| JP2007178144A (ja) * | 2005-12-27 | 2007-07-12 | Advanced Mask Inspection Technology Kk | パターン検査装置、パターン検査方法、検査対象試料、及び検査対象試料の管理方法 |
| JP2011094982A (ja) * | 2009-10-27 | 2011-05-12 | Sharp Corp | ネットワークシステム、精度管理方法、成分分析装置、および管理サーバ |
| WO2021079692A1 (ja) * | 2019-10-24 | 2021-04-29 | 株式会社J-オイルミルズ | 油脂の劣化予測装置、劣化予測システム、劣化予測方法、油脂交換システム及びフライヤーシステム |
| JP6997362B1 (ja) * | 2020-03-31 | 2022-01-17 | 株式会社J-オイルミルズ | 食用油の劣化度判定装置、食用油の劣化度判定システム、食用油の劣化度判定方法、食用油の劣化度判定プログラム、食用油の劣化度学習装置、食用油の劣化度判定に用いられる学習済モデル、及び食用油の交換システム |
| JP7171970B1 (ja) * | 2021-03-25 | 2022-11-15 | 株式会社J-オイルミルズ | 判定装置、学習装置、判定システム、判定方法、学習方法、及び、プログラム |
Cited By (1)
| Publication number | Priority date | Publication date | Assignee | Title |
|---|---|---|---|---|
| CN120929772A (zh) * | 2025-10-11 | 2025-11-11 | 南通昶昊机电制造有限公司 | 方便面油炸过程中油劣化程度在线检测方法及系统 |
Also Published As
| Publication number | Publication date |
|---|---|
| JPWO2024154473A1 (ja) | 2024-07-25 |
Similar Documents
| Publication | Publication Date | Title |
|---|---|---|
| US12596112B2 (en) | Edible oil deterioration level determination device, edible oil deterioration level determination system, edible oil deterioration level determination method, edible oil deterioration level determination program, edible oil deterioration level learning device, learned model for use in edible oil deterioration level determination, and edible oil exchange system | |
| TWI574004B (zh) | 油劣化度計及油劣化度評價方法 | |
| WO2021053992A1 (ja) | フライ油劣化判定装置及びフライ油劣化判定方法 | |
| US20240386538A1 (en) | Edible oil deterioration degree determination device, edible oil deterioration degree determination system, edible oil deterioration degree determination method, edible oil deterioration degree learning device, and learned model for use in edible oil deterioration degree determination | |
| WO2024154473A1 (ja) | 油脂劣化予測装置、油脂劣化予測システム、および油脂劣化予測方法 | |
| WO2015084044A1 (ko) | 튀김유의 실시간 산가 측정 및 산가 정보 제공 시스템 및 방법 | |
| KR102465314B1 (ko) | 튀김유 관리 시스템 및 방법 | |
| JP7759339B2 (ja) | 食用油劣化度判定装置、食用油劣化度判定処理装置、食用油劣化度判定方法、およびフライヤー | |
| JP2023021124A (ja) | 揚げ物廃棄時期管理装置、揚げ物廃棄時期管理システム、および揚げ物廃棄時期管理方法 | |
| US20250166148A1 (en) | Learning device, prediction device, learning method, program, and learning system | |
| JP6829347B1 (ja) | フライ油劣化判定装置及びフライ油劣化判定方法 | |
| CA3213612A1 (en) | Determination device, learning device, determination system, determination method, learning method, and program | |
| JP7224547B2 (ja) | 食品廃棄時期管理装置、食品廃棄時期管理システム、および食品廃棄時期管理方法 | |
| JP7688241B1 (ja) | 油脂管理装置および油脂管理方法 | |
| WO2024101072A1 (ja) | 食用油の劣化情報処理装置、食用油の劣化情報処理システム、および食用油の劣化情報処理方法 | |
| WO2025169664A1 (ja) | 油脂管理装置および油脂管理方法 | |
| JP7525757B1 (ja) | 油脂管理装置、油脂管理システム、油脂管理方法、および油脂管理表示装置 | |
| JP2024103323A (ja) | 揚げ油管理装置及び揚げ油管理方法 | |
| WO2024111554A1 (ja) | 油脂劣化度検出装置、油脂劣化度検出システム、油脂劣化度検出方法、および油脂劣化度検出プログラム | |
| WO2024185247A1 (ja) | 油脂管理装置、油脂管理システム、油脂管理方法、および油脂管理表示装置 | |
| JP7583210B1 (ja) | 油劣化判定システム、油劣化判定方法およびプログラム | |
| JP2024141537A (ja) | 分析システム、分析方法及び、コンピュータプログラム | |
| JP2025147293A (ja) | 商品管理装置、商品管理方法、及び、プログラム | |
| WO2023106034A1 (ja) | 食品販売促進制御装置、食品販売促進システム、および食品販売促進方法 |
Legal Events
| Date | Code | Title | Description |
|---|---|---|---|
| 121 | Ep: the epo has been informed by wipo that ep was designated in this application |
Ref document number: 23917684 Country of ref document: EP Kind code of ref document: A1 |
|
| ENP | Entry into the national phase |
Ref document number: 2024571650 Country of ref document: JP Kind code of ref document: A |
|
| WWE | Wipo information: entry into national phase |
Ref document number: 2024571650 Country of ref document: JP |
|
| NENP | Non-entry into the national phase |
Ref country code: DE |
|
| 122 | Ep: pct application non-entry in european phase |
Ref document number: 23917684 Country of ref document: EP Kind code of ref document: A1 |