WO2024034253A1 - 内視鏡システム及びその作動方法 - Google Patents
内視鏡システム及びその作動方法 Download PDFInfo
- Publication number
- WO2024034253A1 WO2024034253A1 PCT/JP2023/021964 JP2023021964W WO2024034253A1 WO 2024034253 A1 WO2024034253 A1 WO 2024034253A1 JP 2023021964 W JP2023021964 W JP 2023021964W WO 2024034253 A1 WO2024034253 A1 WO 2024034253A1
- Authority
- WO
- WIPO (PCT)
- Prior art keywords
- image
- index value
- region
- area
- display
- Prior art date
- Legal status (The legal status is an assumption and is not a legal conclusion. Google has not performed a legal analysis and makes no representation as to the accuracy of the status listed.)
- Ceased
Links
Images







































Classifications
-
- A—HUMAN NECESSITIES
- A61—MEDICAL OR VETERINARY SCIENCE; HYGIENE
- A61B—DIAGNOSIS; SURGERY; IDENTIFICATION
- A61B1/00—Instruments for performing medical examinations of the interior of cavities or tubes of the body by visual or photographical inspection, e.g. endoscopes; Illuminating arrangements therefor
- A61B1/04—Instruments for performing medical examinations of the interior of cavities or tubes of the body by visual or photographical inspection, e.g. endoscopes; Illuminating arrangements therefor combined with photographic or television appliances
- A61B1/045—Control thereof
-
- A—HUMAN NECESSITIES
- A61—MEDICAL OR VETERINARY SCIENCE; HYGIENE
- A61B—DIAGNOSIS; SURGERY; IDENTIFICATION
- A61B1/00—Instruments for performing medical examinations of the interior of cavities or tubes of the body by visual or photographical inspection, e.g. endoscopes; Illuminating arrangements therefor
-
- A—HUMAN NECESSITIES
- A61—MEDICAL OR VETERINARY SCIENCE; HYGIENE
- A61B—DIAGNOSIS; SURGERY; IDENTIFICATION
- A61B1/00—Instruments for performing medical examinations of the interior of cavities or tubes of the body by visual or photographical inspection, e.g. endoscopes; Illuminating arrangements therefor
- A61B1/00002—Operational features of endoscopes
- A61B1/00004—Operational features of endoscopes characterised by electronic signal processing
- A61B1/00006—Operational features of endoscopes characterised by electronic signal processing of control signals
-
- A—HUMAN NECESSITIES
- A61—MEDICAL OR VETERINARY SCIENCE; HYGIENE
- A61B—DIAGNOSIS; SURGERY; IDENTIFICATION
- A61B1/00—Instruments for performing medical examinations of the interior of cavities or tubes of the body by visual or photographical inspection, e.g. endoscopes; Illuminating arrangements therefor
- A61B1/00002—Operational features of endoscopes
- A61B1/00004—Operational features of endoscopes characterised by electronic signal processing
- A61B1/00009—Operational features of endoscopes characterised by electronic signal processing of image signals during a use of endoscope
-
- A—HUMAN NECESSITIES
- A61—MEDICAL OR VETERINARY SCIENCE; HYGIENE
- A61B—DIAGNOSIS; SURGERY; IDENTIFICATION
- A61B1/00—Instruments for performing medical examinations of the interior of cavities or tubes of the body by visual or photographical inspection, e.g. endoscopes; Illuminating arrangements therefor
- A61B1/00002—Operational features of endoscopes
- A61B1/00004—Operational features of endoscopes characterised by electronic signal processing
- A61B1/00009—Operational features of endoscopes characterised by electronic signal processing of image signals during a use of endoscope
- A61B1/000094—Operational features of endoscopes characterised by electronic signal processing of image signals during a use of endoscope extracting biological structures
-
- A—HUMAN NECESSITIES
- A61—MEDICAL OR VETERINARY SCIENCE; HYGIENE
- A61B—DIAGNOSIS; SURGERY; IDENTIFICATION
- A61B1/00—Instruments for performing medical examinations of the interior of cavities or tubes of the body by visual or photographical inspection, e.g. endoscopes; Illuminating arrangements therefor
- A61B1/00002—Operational features of endoscopes
- A61B1/00043—Operational features of endoscopes provided with output arrangements
- A61B1/00045—Display arrangement
-
- A—HUMAN NECESSITIES
- A61—MEDICAL OR VETERINARY SCIENCE; HYGIENE
- A61B—DIAGNOSIS; SURGERY; IDENTIFICATION
- A61B1/00—Instruments for performing medical examinations of the interior of cavities or tubes of the body by visual or photographical inspection, e.g. endoscopes; Illuminating arrangements therefor
- A61B1/00002—Operational features of endoscopes
- A61B1/00043—Operational features of endoscopes provided with output arrangements
- A61B1/00045—Display arrangement
- A61B1/0005—Display arrangement combining images e.g. side-by-side, superimposed or tiled
-
- A—HUMAN NECESSITIES
- A61—MEDICAL OR VETERINARY SCIENCE; HYGIENE
- A61B—DIAGNOSIS; SURGERY; IDENTIFICATION
- A61B1/00—Instruments for performing medical examinations of the interior of cavities or tubes of the body by visual or photographical inspection, e.g. endoscopes; Illuminating arrangements therefor
- A61B1/04—Instruments for performing medical examinations of the interior of cavities or tubes of the body by visual or photographical inspection, e.g. endoscopes; Illuminating arrangements therefor combined with photographic or television appliances
- A61B1/043—Instruments for performing medical examinations of the interior of cavities or tubes of the body by visual or photographical inspection, e.g. endoscopes; Illuminating arrangements therefor combined with photographic or television appliances for fluorescence imaging
-
- A—HUMAN NECESSITIES
- A61—MEDICAL OR VETERINARY SCIENCE; HYGIENE
- A61B—DIAGNOSIS; SURGERY; IDENTIFICATION
- A61B1/00—Instruments for performing medical examinations of the interior of cavities or tubes of the body by visual or photographical inspection, e.g. endoscopes; Illuminating arrangements therefor
- A61B1/04—Instruments for performing medical examinations of the interior of cavities or tubes of the body by visual or photographical inspection, e.g. endoscopes; Illuminating arrangements therefor combined with photographic or television appliances
- A61B1/044—Instruments for performing medical examinations of the interior of cavities or tubes of the body by visual or photographical inspection, e.g. endoscopes; Illuminating arrangements therefor combined with photographic or television appliances for absorption imaging
-
- A—HUMAN NECESSITIES
- A61—MEDICAL OR VETERINARY SCIENCE; HYGIENE
- A61B—DIAGNOSIS; SURGERY; IDENTIFICATION
- A61B1/00—Instruments for performing medical examinations of the interior of cavities or tubes of the body by visual or photographical inspection, e.g. endoscopes; Illuminating arrangements therefor
- A61B1/06—Instruments for performing medical examinations of the interior of cavities or tubes of the body by visual or photographical inspection, e.g. endoscopes; Illuminating arrangements therefor with illuminating arrangements
- A61B1/0638—Instruments for performing medical examinations of the interior of cavities or tubes of the body by visual or photographical inspection, e.g. endoscopes; Illuminating arrangements therefor with illuminating arrangements providing two or more wavelengths
-
- A—HUMAN NECESSITIES
- A61—MEDICAL OR VETERINARY SCIENCE; HYGIENE
- A61B—DIAGNOSIS; SURGERY; IDENTIFICATION
- A61B5/00—Measuring for diagnostic purposes; Identification of persons
- A61B5/145—Measuring characteristics of blood in vivo, e.g. gas concentration or pH-value ; Measuring characteristics of body fluids or tissues, e.g. interstitial fluid or cerebral tissue
- A61B5/1455—Measuring characteristics of blood in vivo, e.g. gas concentration or pH-value ; Measuring characteristics of body fluids or tissues, e.g. interstitial fluid or cerebral tissue using optical sensors, e.g. spectral photometrical oximeters
- A61B5/14551—Measuring characteristics of blood in vivo, e.g. gas concentration or pH-value ; Measuring characteristics of body fluids or tissues, e.g. interstitial fluid or cerebral tissue using optical sensors, e.g. spectral photometrical oximeters for measuring blood gases
- A61B5/14552—Details of sensors specially adapted therefor
-
- A—HUMAN NECESSITIES
- A61—MEDICAL OR VETERINARY SCIENCE; HYGIENE
- A61B—DIAGNOSIS; SURGERY; IDENTIFICATION
- A61B5/00—Measuring for diagnostic purposes; Identification of persons
- A61B5/145—Measuring characteristics of blood in vivo, e.g. gas concentration or pH-value ; Measuring characteristics of body fluids or tissues, e.g. interstitial fluid or cerebral tissue
- A61B5/1455—Measuring characteristics of blood in vivo, e.g. gas concentration or pH-value ; Measuring characteristics of body fluids or tissues, e.g. interstitial fluid or cerebral tissue using optical sensors, e.g. spectral photometrical oximeters
- A61B5/1459—Measuring characteristics of blood in vivo, e.g. gas concentration or pH-value ; Measuring characteristics of body fluids or tissues, e.g. interstitial fluid or cerebral tissue using optical sensors, e.g. spectral photometrical oximeters invasive, e.g. introduced into the body by a catheter
-
- A—HUMAN NECESSITIES
- A61—MEDICAL OR VETERINARY SCIENCE; HYGIENE
- A61B—DIAGNOSIS; SURGERY; IDENTIFICATION
- A61B5/00—Measuring for diagnostic purposes; Identification of persons
- A61B5/74—Details of notification to user or communication with user or patient; User input means
- A61B5/742—Details of notification to user or communication with user or patient; User input means using visual displays
- A61B5/743—Displaying an image simultaneously with additional graphical information, e.g. symbols, charts, function plots
-
- A—HUMAN NECESSITIES
- A61—MEDICAL OR VETERINARY SCIENCE; HYGIENE
- A61B—DIAGNOSIS; SURGERY; IDENTIFICATION
- A61B5/00—Measuring for diagnostic purposes; Identification of persons
- A61B5/74—Details of notification to user or communication with user or patient; User input means
- A61B5/7475—User input or interface means, e.g. keyboard, pointing device, joystick
- A61B5/748—Selection of a region of interest, e.g. using a graphics tablet
- A61B5/7485—Automatic selection of region of interest
-
- G—PHYSICS
- G02—OPTICS
- G02B—OPTICAL ELEMENTS, SYSTEMS OR APPARATUS
- G02B23/00—Telescopes, e.g. binoculars; Periscopes; Instruments for viewing the inside of hollow bodies; Viewfinders; Optical aiming or sighting devices
- G02B23/24—Instruments or systems for viewing the inside of hollow bodies, e.g. fibrescopes
Definitions
- the present invention relates to an endoscope system that controls the display of index values indicating the condition of a living body and an operating method thereof.
- Patent Document 1 describes an image acquisition unit that acquires a subject image containing at least two types of spectral information regarding the wavelength of light at regular time intervals, and a lock-on area that follows the movement of a region of interest of the subject.
- a lock-on setting means that is set in a region of interest on the subject image, and monitoring used to monitor temporal changes in oxygen saturation in the lock-on area based on an image of the lock-on area portion of the subject image.
- a medical device system is disclosed that includes a monitoring image generating means for generating an image and a display means for displaying the monitoring image.
- oxygen saturation is calculated as an index value indicating the state of a living body.
- index values indicating the condition of a living body When supporting surgical treatment using index values indicating the condition of a living body based on endoscopic images, monitoring of index values indicating the condition of the living body is only performed for one local region included in the endoscopic image. However, this may be insufficient in situations where it is desired to know spatial changes in index values indicating the state of the body, particularly in situations where it is desired to determine the resection range of a wide range of lesions. Therefore, there is a need for a technology that can visually recognize spatial changes in index values that indicate the condition of a living body.
- An object of the present invention is to provide an endoscope system and an operating method thereof that allow a user to visually recognize spatial changes in index values indicating the state of a living body.
- the endoscope system of the present invention includes an endoscope and a processor.
- An endoscope generates an image signal by photographing a subject.
- the processor acquires an image signal, generates an endoscopic image based on the image signal, sets a plurality of regions of interest at mutually different positions in the endoscopic image, and sets a plurality of regions of interest in the endoscopic image.
- the position of each is stored as region position information, and based on the image signal in the region of interest, a biometric index value indicating the state of the subject is calculated. Based on the biometric index value in each region of interest, the statistical value of the biometric index value is calculated.
- a display device that calculates a certain region index value for each region of interest, generates an index value display table that collectively displays multiple region index values, and displays endoscopic images, index value display tables, and multiple region position information. Generates images and controls displaying images for display.
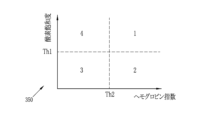
- the biomarker value is oxygen saturation and/or hemoglobin index.
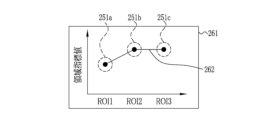
- the index value display table displays the plurality of area index values in a graph format.
- the processor associates the area position information with the area index value, stores the area index value as a specific area index value, holds the specific area index value, and displays it in the index value display table.
- the processor calculates a biometric index value based on the latest image signal in the region of interest, calculates a region index value for each region of interest based on the latest biometric index value, and calculates the region index value displayed in the index value display table. It is preferable to update.
- the processor can store the position of the region of interest in the endoscopic image as a lock-on area, and calculate the biometric index value based on the image signal in the lock-on area. preferable.
- the processor stores the area index value calculated based on the image signal in the lock-on area as a specific lock-on area index value by associating it with the lock-on area, and displays the specific lock-on area index value in the display image. It is preferable to control display.
- the processor stores a specific lock-on area index value stored immediately before the position of the lock-on area becomes an out-of-field position. It is preferable to define the out-of-field lock-on area index value as the out-of-field lock-on area index value, and to generate an index value display table that displays the out-of-field lock-on area index value.
- the processor sets at least one lock-on area in the endoscopic image as an additional region of interest, calculates a biometric value based on the image signal in the additional region of interest, and calculates the statistics of the biometric index value in the additional region of interest.
- the additional area index value that is the value is calculated as the area index value
- an extended index value display table that displays the additional area index value and the out-of-field lock-on area index value together is generated, and the extended index value is displayed in the display image. It is preferable to perform control to display a display table.
- the processor controls superimposing and displaying a plurality of region position information on the endoscopic image, and displays the region position information superimposed on the endoscopic image and the region position information displayed on the extended index value display table. It is preferable to perform control to display an index value link line connecting the information and the corresponding area index value other than the out-of-field lock-on area index value on the display image.
- the processor performs control to change the display size of the extended index value display table displayed in the display image.
- the processor controls superimposing and displaying multiple pieces of area position information on the endoscopic image, and displays the area position information superimposed on the endoscopic image and the area position information displayed on the index value display table. It is preferable to perform control to display an index value link line connecting the area index value and the corresponding area index value on the display image.
- the processor sets at least one lock-on area in the endoscopic image as an additional region of interest, calculates a biometric value based on the image signal in the additional region of interest, and calculates the statistics of the biometric index value in the additional region of interest.
- Calculate the additional area index value as the area index value generate an index value display table that displays the additional area index value, and display the index value display table that displays the additional area index value on the display image.
- control is performed.
- a region of interest setting switch is provided, and the processor sets the plurality of regions of interest according to pressing of the region of interest setting switch, and sets the region index value in the set region of interest according to pressing of the region of interest setting switch again. It is preferable to calculate.
- the operating method of the endoscope system of the present invention includes the steps of: acquiring an image signal generated by photographing a subject with the endoscope; generating an endoscopic image based on the image signal; a step of setting a plurality of regions of interest at different positions in the endoscopic image; a step of storing the positions of the plurality of regions of interest in the endoscopic image as region position information; , a step of calculating a biometric index value indicating the state of the subject, a step of calculating a region index value, which is a statistical value of the biometric index value, for each region of interest based on the biometric index value in each region of interest; A step of generating an index value display table that collectively displays index values, a step of generating a display image that displays an endoscopic image, an index value display table, and a plurality of area position information, and a step of displaying the display image. and a step of performing control.
- a user can visually recognize spatial changes in index values indicating the state of a living body.
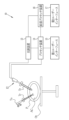
- FIG. 1 is a schematic diagram of an endoscope system.
- FIG. 1 is a schematic diagram of an endoscope system according to a first embodiment.
- FIG. 1 is a schematic diagram of an endoscope system in which the endoscope is a laparoscope.
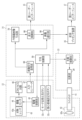
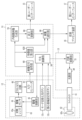
- FIG. 1 is a block diagram showing the functions of the endoscope system according to the first embodiment.
- FIG. 2 is a block diagram showing the functions of a light source section.
- FIG. 3 is an explanatory diagram showing an example of a display display in normal mode. It is an explanatory view showing an example of a display display in oxygen saturation mode.
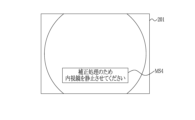
- FIG. 7 is an image diagram showing an example of a notification image when prompting a switch to a correction mode.
- FIG. 1 is a schematic diagram of an endoscope system according to a first embodiment.
- FIG. 1 is a schematic diagram of an endoscope system in which the endoscope is a laparoscope.
- FIG. 1 is a block diagram showing the functions of the end
- 3 is an explanatory diagram showing an example of a display display in a correction mode. It is a graph showing the spectrum of white light. It is a graph showing the spectrum of the first illumination light. It is a graph which shows the spectrum of 2nd illumination light. It is a graph which shows the spectrum of 3rd illumination light. It is an explanatory view showing an example of a light emission pattern for normal mode. It is an explanatory view showing an example of a light emission pattern for oxygen saturation mode. It is an explanatory view showing an example of a light emission pattern for correction mode. It is a graph which shows the transmission band of the color filter of the image sensor of 1st Embodiment. It is a table showing illumination light emitted and image signals acquired in the normal mode of the first embodiment.
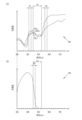
- (A) is a graph showing the reflection spectrum of reduced hemoglobin in the presence of yellow pigment.
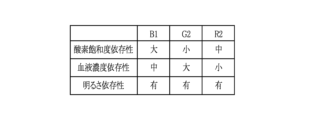
- (B) is a graph showing the absorption spectrum of yellow dye. It is a table showing oxygen saturation dependence, blood concentration dependence, and brightness dependence of B1 image signal, G2 image signal, and R2 image signal. It is a graph showing an oxygen saturation calculation table.
- FIG. 2 is a block diagram showing the functions of an extended processor device.
- FIG. 2 is an explanatory diagram showing a method of calculating oxygen saturation.
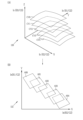
- A) is a graph showing a corrected oxygen saturation calculation table in a two-dimensional coordinate system.
- FIG. 3 is an explanatory diagram showing a method of calculating corrected oxygen saturation.
- FIG. 3 is an image diagram showing an example of a correction image. It is a graph showing a first reliability calculation table. It is a graph which shows the 2nd reliability calculation table. It is a graph which shows the 3rd reliability calculation table.
- FIG. 7 is an image diagram showing an example of a correction image when the saturation of the correction image is changed depending on reliability.
- FIG. 7 is an image diagram showing an example of a correction image when a specific area is surrounded by a frame based on reliability.
- FIG. 7 is an image diagram illustrating an example of a correction image that indicates that correction processing can be performed appropriately.
- FIG. 7 is an image diagram showing an example of a correction image when displaying a warning.
- A is an image diagram showing an example of an oxygen saturation image.
- B is an image diagram showing an example of a region of interest image in specific example (1).
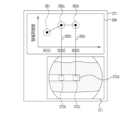
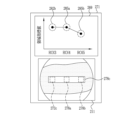
- FIG. 7 is an explanatory diagram showing an example of a display display when displaying a region of interest image in specific example (1). It is a graph showing a combination index calculation table. It is an image diagram showing an example of a biometric index value selection screen.
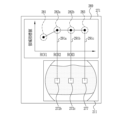
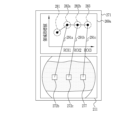
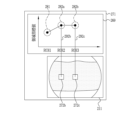
- FIG. 2 is an explanatory diagram showing an example of an index value display table in a graph format.
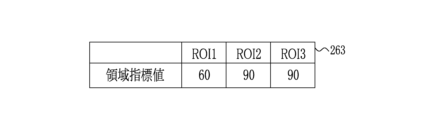
- FIG. 2 is an explanatory diagram showing an example of an index value display table in a tabular format.
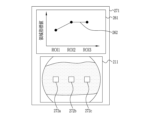
- FIG. 7 is an image diagram showing an example of a display image in specific example (1).
- FIG. 7 is an explanatory diagram showing an example of a display display when displaying a display image in specific example (1).
- FIG. 7 is an explanatory diagram showing an example of a display when displaying a display image in specific example (2).
- FIG. 7 is an explanatory diagram showing an example of a display when displaying a region of interest image in specific example (3).
- FIG. 7 is an explanatory diagram showing an example of a display when displaying a display image in specific example (3).
- FIG. 7 is an image diagram showing an example of a display image when calculating area index values regarding multiple types of biometric index values. It is a flowchart explaining the flow when displaying the display image of 1st Embodiment.
- FIG. 7 is an explanatory diagram showing an example of a display display when displaying a display image in specific example (1).
- FIG. 7 is an explanatory diagram showing an example of a display when displaying a display image in specific example (2).
- FIG. 7 is an explanatory diagram showing an example of
- FIG. 7 is an image diagram showing an example of a region of interest image when displaying a region of interest for display.
- FIG. 3 is an image diagram showing an example of a display image when display area position information is displayed.
- FIG. 3 is a block diagram showing the functions of the extended processor device when an area index value storage unit is provided.
- FIG. 7 is an image diagram showing an example of a display image when updating a region index value.
- FIG. 7 is an explanatory diagram showing an example of area index values calculated in chronological order when illumination light is emitted using a light emission pattern for oxygen saturation mode.
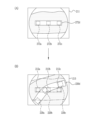
- A is an image diagram showing an example of a region of interest image.
- (B) is an image diagram showing an example of a region of interest image when the region of interest in (A) follows the movement of the endoscope.
- (A) is an image diagram showing an example of a region of interest image when displaying a region of interest for display.
- (B) is an image diagram showing an example of a region of interest image when the region of interest in (A) follows the movement of the endoscope and a region of interest for display is displayed.
- (A) is an image diagram showing an example of a display image before displaying an out-of-field lock-on area index value.
- (B) is an image diagram showing an example of a display image when displaying an out-of-field lock-on area index value at a time point after (A).
- FIG. 7 is an image diagram showing an example of a display image when displaying an out-of-field lock-on area index value and setting an additional region of interest.
- FIG. 7 is an image diagram showing an example of a display image when displaying an out-of-field lock-on area index value and an index value link line.
- FIG. 7 is an image diagram showing an example of a display image when displaying out-of-field lock-on area index values and changing the display size of an index value display table.
- FIG. 7 is an image diagram showing an example of a display image when an index value link line is displayed when an out-of-field lock-on area index value and an additional region of interest are not displayed.
- FIG. 7 is an image diagram showing an example of a display image after moving the endoscope in a case where an out-of-field lock-on area index value and an additional region of interest are not displayed.
- FIG. 7 is an image diagram showing an example of a display image when the endoscope is moved and the display size of the index value display table is changed when the out-of-field lock-on area index value and the additional region of interest are not displayed.
- FIG. 7 is an image diagram showing an example of a display image when an index value link line and display region position information are displayed when an out-of-field lock-on area index value and an additional region of interest are not displayed.
- FIG. 3 is an image diagram showing an example of an image for use.
- FIG. 7 is an image diagram showing an example of a display image when an out-of-field lock-on area index value is not displayed.
- FIG. 7 is an image diagram showing an example of a display image when an additional region of interest is set when an out-of-field lock-on area index value is not displayed.
- FIG. 7 is an image diagram showing an example of a display image that displays an additional area index value when an out-of-field lock-on area index value is not displayed.
- FIG. 7 is an image diagram showing an example of a display image when display area position information is displayed without displaying an out-of-field lock-on area index value.
- FIG. 7 is an image diagram showing an example of a display image when an additional region of interest is set and display region position information is displayed when an out-of-field lock-on area index value is not displayed.
- FIG. 7 is an image diagram showing an example of a display image when display area position information is displayed when displaying an additional area index value when an out-of-field lock-on area index value is not displayed. It is a block diagram showing the function of the endoscope system of a 2nd embodiment.
- FIG. 3 is a plan view of a rotating filter.
- FIG. 3 is an explanatory diagram showing a difference value ⁇ Z used in a calculated value correction process.
- FIG. 5 is a graph showing a spectrum of light incident on an image sensor 511.
- FIG. 5 is a graph showing a spectrum of light incident on an image sensor 512.
- FIG. 5 is a graph showing the spectrum of light incident on the image sensor 513.
- FIG. 5 is a graph showing the spectrum of light incident on the image sensor 514.
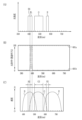
- FIG. It is a graph showing the reflection spectrum of reduced hemoglobin in the presence of a yellow pigment, with the wavelength band Rk displayed.
- (A) is a graph showing the spectrum of the fourth illumination light.
- (B) is a graph showing the relationship between the reflectance and transmittance of light incident on the dichroic mirror of the fourth embodiment and the wavelength of the light.
- (C) is a graph showing the relationship between the sensitivity of the image sensor 611 and the wavelength of light.
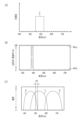
- (A) is a graph showing the spectrum of the fourth illumination light.
- (B) is a graph showing the relationship between the reflectance and transmittance of light incident on the dichroic mirror of the fourth embodiment and the wavelength of the light.
- (C) is a graph showing the relationship between the sensitivity of the image sensor 612 and the wavelength of light. It is an explanatory view showing a light emission pattern in oxygen saturation mode of a 4th embodiment.
- FIG. 7 is an explanatory diagram showing a light emission pattern in a correction mode according to a fourth embodiment.
- (A) is a graph showing the spectrum of the third illumination light.
- (B) is a graph showing the relationship between the reflectance and transmittance of light incident on the dichroic mirror of the fourth embodiment and the wavelength of the light.
- (C) is a graph showing the relationship between the sensitivity of the image sensor 611 and the wavelength of light.
- A) is a graph showing the spectrum of the third illumination light.
- B) is a graph showing the relationship between the reflectance and transmittance of light incident on the dichroic mirror of the fourth embodiment and the wavelength of the light.
- C) is a graph showing the relationship between the sensitivity of the image sensor 612 and the wavelength of light. It is a block diagram showing the function of the endoscope system of a 4th embodiment.
- (A) is an image diagram showing the correction area.
- B) is an enlarged view of the correction area shown in (A).
- FIG. 7 is a block diagram showing the functions of a reliability calculation section, a correction determination section, and an extended display control section according to a fourth embodiment. It is a graph showing a first reliability calculation table in which the horizontal axis is a pixel value of a G2 image signal. It is a graph showing a third reliability calculation table with the vertical axis representing the signal ratio ln (B1/G2).
- FIG. 12 is an explanatory diagram showing the relationship between a light emission pattern, a generated endoscopic image, and an image set in a correction mode of the fourth embodiment.
- FIG. 7 is an explanatory diagram showing corresponding correction areas among a white light equivalent image, a first blue light image, and a third illumination light image.
- FIG. 3 is an explanatory diagram showing a method of calculating a correlation coefficient.
- FIG. 7 is an image diagram showing an example of a display when a warning is displayed in the fourth embodiment.
- the endoscope system 10 includes an endoscope 12, a light source device 13, a processor device 14, a first user interface 15, an extended processor device 16, and a second user interface 17.
- the endoscope 12 is optically or electrically connected to the light source device 13 and electrically connected to the processor device 23.
- the first user interface 15 is electrically connected to the processor device 23 .
- the extended processor device 16 is electrically connected to the light source device 13, the processor device 14, and the second user interface 17. These respective connections are not limited to wired connections, but may be wireless. Alternatively, it may be via a network.
- the endoscope system 10 includes an endoscope 12 that is inserted into a body cavity of a subject for surgical treatment, and is a rigid endoscope that photographs organs in the body cavity from the serosa side. It is particularly suitable for laparoscopic applications.
- the endoscope 12 may be a flexible endoscope that is inserted through the nose, mouth, or anus of the subject.
- a subject means a subject into whom the endoscope 12 is inserted.
- subject refers to an object to be observed that is included in the field of view of the endoscope 12 and appears in an endoscopic image.
- the endoscope 12 When the endoscope 12 is a laparoscope, as shown in FIG. 2, the endoscope 12 includes an insertion section 12a that is inserted into the abdominal cavity of the subject, and an operation section provided at the proximal end of the insertion section 12a. 12b.
- An optical system and an image sensor are built into a portion near the tip of the insertion section 12a (hereinafter referred to as the tip).
- the optical system includes an illumination optical system, which will be described later, for irradiating the subject with illumination light, and an imaging optical system, which will be described later, for capturing an image of the subject.
- the image sensor generates an image signal by focusing reflected light from an observation target that has passed through an imaging optical system and entered on an imaging plane. The generated image signal is output to the processor device 14.
- the operation unit 12b is provided with a mode switching switch 12c and a region of interest setting switch 12d.
- the mode switching switch 12c is used to switch the observation mode, which will be described later.
- the region of interest setting switch 12d is used to input a region of interest setting instruction, which will be described later, and an instruction to calculate a biometric index value within the region of interest. Although details will be described later, mode switching may be performed by operating the region of interest setting switch 12d without using the mode switching switch 12c.
- the endoscope 12 is inserted into the peritoneal cavity AC of the subject P who is in the supine position (face up) on the operating table Ot via the trocar Tr. .
- the inside of the peritoneal cavity AC of the subject P is inflated with carbon dioxide gas being fed by an insufflation device in order to secure an observation field and a surgical field.
- treatment tools such as grasping forceps for expanding the observation field and surgical field, and an electric scalpel for resecting a part of the organ having a diseased area are used. To is inserted.
- the light source device 13 generates illumination light.
- the processor device 14 performs system control of the endoscope system 10, and further generates endoscopic images by performing image processing on image signals transmitted from the endoscope 12.
- endoscopic image includes a white light image, a white light equivalent image, an oxygen saturation image, a region of interest image, a display image, a correction image, a notification image, a third illumination light image, A first blue light image is included.
- the first user interface 15 and the second user interface 17 include a keyboard, a mouse, a microphone, a foot switch, a touch pad, and the like, which accept input operations from the user and send input signals to the processor device 14 or the extended processor device 16. This is an input device such as a tablet or touch pen. Further, the first user interface 15 and the second user interface 17 receive output signals from the processor device 14 or the extended processor device 16, and output endoscopic images, audio, etc., such as displays, head-mounted displays, speakers, etc. It is an output device.
- the first user interface 15 and the second user interface 17 will be collectively referred to as a user interface, and the first user interface 15 or the second user interface 17 will be referred to as a user interface.
- the mode switching switch 12c and the region of interest setting switch 12d of the endoscope 12 may be provided not on the endoscope 12 but on the user interface.
- the endoscope system 10 has three modes: normal mode, oxygen saturation mode, and correction mode. These three modes can be switched by the user operating the mode switching switch 12c or the region of interest setting switch 12d.
- the normal mode a naturally colored white light image generated by imaging a subject using white light as the illumination light is displayed on the display, which is the user interface.
- the oxygen saturation mode the oxygen saturation of the subject is calculated, and an oxygen saturation image obtained by converting the calculated oxygen saturation into an image is displayed on the display.
- a white light equivalent image containing fewer short wavelength components than the white light image is displayed on the display.
- correction mode correction processing regarding the calculation of oxygen saturation is performed in consideration of the influence of a specific dye, which will be described later.
- the light source device 13 includes a light source section 20 and a light source control section 21 that controls the light source section 20.
- the light source section 20 includes, for example, a semiconductor light source such as a multi-color LED (Light Emitting Diode), a laser light source, a combination of a laser diode and a phosphor, a xenon lamp, a halogen light source, and the like.
- the light source section 20 has, for example, a plurality of light sources, turns on or off each of these, and when turned on, the light emission amount of each light source is controlled by the light source control section 21 to illuminate the observation target. Emits illumination light.
- the light source unit 20 includes, for example, a V-LED (Violet Light Emitting Diode) 20a, a BS-LED (Blue Short-wavelength Light Emitting Diode) 20b, and a BL-LED (Blue It has five color LEDs: Long-wavelength Light Emitting Diode) 20c, G-LED (Green Light Emitting Diode) 20d, and R-LED (Red Light Emitting Diode) 20e. Note that the combination of each color LED is not limited to this.
- the V-LED 20a emits violet light V with a center wavelength of 410 nm ⁇ 10 nm.
- the BS-LED 20b emits second blue light BS having a center wavelength of 450 nm ⁇ 10 nm.
- the BL-LED 20c emits first blue light BL having a center wavelength of 470 nm ⁇ 10 nm.
- the G-LED 20d emits green light G in the green band. It is preferable that the center wavelength of the green light G is 540 nm.
- the R-LED 20e emits red light R in the red band. It is preferable that the center wavelength of the red light R is 620 nm. Note that the center wavelength and peak wavelength of each of the LEDs 20a to 20e may be the same or different.
- the light source control unit 21 inputs control signals independently to each of the LEDs 20a to 20e, thereby independently controlling the lighting, extinguishing, and amount of light emitted by each of the LEDs 20a to 20e.
- the lighting or extinguishing control by the light source control unit 21 differs depending on each mode, and details will be described later.
- Illumination light emitted from the light source section 20 is incident on the light guide 41 via an optical path coupling section (not shown) composed of mirrors, lenses, and the like.
- the light guide 41 may be built into the endoscope 12 and a universal cord (a cord that connects the endoscope 12, the light source device 13, and the processor device 14).
- the light guide 41 propagates the light from the optical path coupling section to the distal end of the endoscope 12.
- An illumination optical system 42 and an imaging optical system 43 are provided at the distal end of the endoscope 12.
- the illumination optical system 42 has an illumination lens 42a, and the illumination light propagated by the light guide 41 is irradiated onto the subject via the illumination lens 42a. Note that when the endoscope 12 is a flexible endoscope and the light source section 20 is built into the distal end of the endoscope 12, the light is transmitted through the illumination lens 42a of the illumination optical system 42 without passing through the light guide 41. illumination light is emitted.
- the imaging optical system 43 includes an objective lens 43a and an imaging sensor 44. Reflected light from the subject irradiated with the illumination light enters the image sensor 44 via the objective lens 43a. As a result, an image of the subject is formed on the image sensor 44.
- the image sensor 44 is a color image sensor or a monochrome image sensor that images reflected light from a subject.
- each pixel of the image sensor 44 includes a B pixel (blue pixel) having a B (blue) color filter, a G pixel (green pixel) having a G (green) color filter, Either R pixel (red pixel) having an R (red) color filter is provided.
- the wavelength band and transmittance of light transmitted by the B color filter, G color filter, and R color filter will be described later.
- the image sensor 44 is preferably a color image sensor with a Bayer array in which the ratio of the number of B pixels, G pixels, and R pixels is 1:2:1.
- CMOS Complementary Metal-Oxide Semiconductor
- image sensor 44 a CCD (Charge Coupled Device) image sensor, a CMOS (Complementary Metal-Oxide Semiconductor) image sensor, etc. can be applied.
- CMOS Complementary Metal-Oxide Semiconductor
- a color image sensor having blue pixels, green pixels, and red pixels a complementary color image sensor having complementary color filters of C (cyan), M (magenta), Y (yellow), and G (green) is used. Also good.
- image signals of four colors, CMYG are output.
- CMYG four-color image signal into the RGB three-color image signal by complementary color-primary color conversion
- a color image sensor similar to a color image sensor including a blue pixel, a green pixel, and a red pixel, which will be described later, can be used. It is possible to obtain image signals of each RGB color. The details of the lighting/extinguishing control of the illumination light in each mode and the image signal output by the image sensor 44 in each mode will be described later.
- the imaging sensor 44 is driven and controlled by an imaging control section 45. Control of the imaging sensor 44 in each mode by the imaging control unit 45 will be described later.
- the CDS/AGC circuit 46 Correlated Double Sampling/Automatic Gain Control
- CDS correlated double sampling
- AGC automatic gain control
- the image signal that has passed through the CDS/AGC circuit 46 is converted into a digital image signal by an A/D converter 47 (Analog/Digital).
- A/D converter 47 Analog/Digital
- the processor device 14 includes a central control section 50, an image signal acquisition section 60, an endoscopic image generation section 70, a display control section 80, and an image communication section 90.
- programs related to various processes are incorporated in a program memory (not shown).
- the functions of the image acquisition unit 60, the endoscopic image generation unit 70, the display control unit 80, and the image communication unit 90 are realized by the central control unit 50 configured by a processor executing the program in the program memory. .
- the image signal acquisition section 60 acquires an A/D converted image signal from the endoscope 12 and transmits it to the endoscope image generation section 70 and/or the image communication section 90.
- the endoscopic image generation unit 70 generates an endoscopic image based on the image signal. Specifically, image signals of each color are subjected to color conversion processing such as demosaic processing, 3 x 3 matrix processing, gradation conversion processing, 3D LUT (Look Up Table) processing, and/or color enhancement processing, spatial An endoscopic image is generated by performing image processing that is structure enhancement processing such as frequency enhancement processing. Note that the demosaic process is a process that generates a signal of the missing color of each pixel. Through demosaic processing, all pixels have signals of each RGB color. Demosaic processing is also performed in the expanded processor device 16, which will be described later.
- the endoscopic image generation unit 70 generates an endoscopic image by performing image processing according to the mode. In the case of normal mode, the endoscopic image generation unit 70 generates a white light image by performing image processing for normal mode. In the case of oxygen saturation mode, the endoscopic image generation unit 70 generates a white light equivalent image.
- the image signal acquisition unit 60 transmits the image signal to the extended processor device 16 via the image communication unit 90.
- the correction mode as in the case of the oxygen saturation mode, a white light equivalent image is generated in the endoscope image generation section 70, and image signals of each color are sent to the extended processor device via the image communication section 90. 16.
- the display control unit 80 and the extended display control unit 200 of the extended processor device 16 perform control regarding output to the user interface.
- the display control unit 80 performs display control to display the endoscopic image generated by the endoscopic image generation unit 70 on a display that is a user interface. Further, the display control unit 80 may perform display control to display the endoscopic image generated by the extended processor device 16 on a display that is a user interface.
- the extended processor device 16 receives image signals from the processor device 14 and performs various image processing.
- the extended processor device 16 calculates oxygen saturation in the oxygen saturation mode, and generates an oxygen saturation image that is an image of the calculated oxygen saturation.
- An extended display control unit 200 of the extended processor device 16, which will be described later, performs display control for displaying endoscopic images generated by the extended processor device 16 on a display that is a user interface. Further, the extended processor device 16 performs correction processing regarding calculation of oxygen saturation in the correction mode. Details of the processing performed by the extended processor device 16 on image signals in the oxygen saturation mode and the correction mode will be described later.
- the extended processor device 16 performs demosaic processing on the image signal received from the processor device 14, and then performs reliability calculation, correction processing, and biological analysis including oxygen saturation, which will be described later. Calculates index values, generates oxygen saturation images, generates display images, etc.
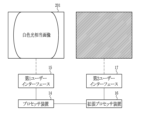
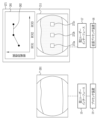
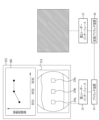
- the display control unit 80 of the processor device 14 displays a white light image 81 on the display, which is the first user interface 15, as shown in FIG.
- nothing is displayed on the display, which is the second user interface 17.
- the fact that nothing is displayed on the display, which is the second user interface 17, is indicated by diagonal lines.
- the display control unit 80 of the processor device 14 displays the white light equivalent image 201 on the display that is the first user interface 15, as shown in FIG.
- the extended display control unit 200 of the extended processor device 16 displays the oxygen saturation image 202 on the display that is the second user interface 17.
- the extended display control unit 200 of the extended processor device 16 displays a display image or a region of interest image, which will be described later, on the display that is the second user interface 17. Display control by the extended display control unit 200 will be described in detail later.
- the display control unit 80 of the processor device 14 displays a message MS0 "Please perform correction processing" as shown in FIG. 8 on the display that is the user interface.
- the notification image 82 may be displayed to prompt the user to switch to the correction mode.
- the oxygen saturation mode it is preferable to display the oxygen saturation image on the display after the correction processing in the correction mode is performed. Note that even when the correction process is not performed, the extended display control section 200, which will be described later, may perform control to display the oxygen saturation image.
- the display control unit 80 of the processor device 14 displays a white light equivalent image on the display, which is the first user interface 15, as shown in FIG.
- the display serving as the second user interface 17 either displays nothing (indicated by diagonal lines) or displays a notification image 82, a display image to be described later, and a corrected oxygen saturation level to be described later.
- An oxygen saturation image, a correction image, or a warning display image reflected in the base image to be described later is displayed.
- Image display control for the second user interface 17 is controlled by the extended display control unit 200 of the extended processor device 16.
- the notification image 82 that displays the message MS0 is displayed on the display without displaying the oxygen saturation image, thereby prompting the user to switch to the correction mode. prompt.
- the mode is switched to the oxygen saturation mode automatically or by the user's mode switching operation.
- a notification image 82 that displays the message "Correction process has been completed” is displayed to prompt the user to switch from the correction mode to the oxygen saturation mode. You can do it like this.
- white light is emitted from the light source section 20.
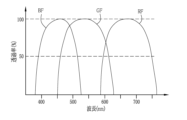
- the white light is a violet light V and a second blue light BS, each having a wavelength band as shown in FIG. , green light G, and red light R.
- calculation illumination light (hereinafter referred to as first illumination light) and white equivalent light (hereinafter referred to as second illumination light) are emitted from the light source section 20. It emits light.
- the first illumination light is emitted by simultaneously lighting the BL-LED 20c, the G-LED 20d, and the R-LED 20e, and has the wavelength bands shown in FIG. 11, respectively.
- the white light including the light R is broadband illumination light having different wavelength bands.
- the second illumination light is emitted by simultaneously lighting the BS-LED 20b, the G-LED 20d, and the R-LED 20e, and has the wavelength bands shown in FIG. 12, respectively.
- the first illumination light, the second illumination light, and the correction illumination light are emitted from the light source section 20.
- the third illumination light is illumination light made of green light G, which is emitted by lighting the G-LED 20d and has a wavelength band as shown in FIG. 13.
- the term "illumination light” refers to white light, first illumination light, second illumination light, third illumination light, mixed light, fourth illumination light, violet light V, first blue light BL, third illumination light, 2 is used as a term meaning any one of blue light BS, green light G, or red light R, or these lights collectively, or as a term meaning light emitted from the light source device 13. Note that in FIGS.
- the light intensity of each illumination light is set to a constant value for simplicity, but the light intensity of each illumination light is not limited to a constant value.
- the third illumination light is not limited to monochromatic light as shown in FIG. 13, but may be illumination light using light of multiple colors.
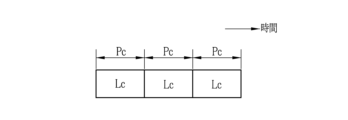
- each light source is controlled to turn on or off in accordance with the normal mode light emission pattern.
- the normal mode light emission pattern is a light emission pattern in which a pattern of emitting white light Lc is repeated during one white light illumination period Pc, as shown in FIG.
- the illumination period means a certain period of time during which illumination light is turned on. Further, one illumination period is provided for each frame.
- a frame refers to a unit of period that includes at least the period from the timing of illumination light emission to the completion of reading out the image signal by the image sensor 44.
- each light source is controlled to turn on or off in accordance with the oxygen saturation mode light emission pattern.
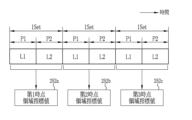
- the light emission pattern for the oxygen saturation mode is as shown in FIG. 15, in which the first illumination light L1 is emitted during one first illumination period P1, and the second illumination light L2 is emitted during one second illumination period P2. This is a light emitting pattern that repeats a light emitting pattern.
- each light source is controlled to turn on or off in accordance with the correction mode light emission pattern.
- the correction mode light emission pattern is as shown in FIG. 16, in which the first illumination light L1 is emitted during one first illumination period P1, the second illumination light L2 is emitted during one second illumination period P2, and This is a light emission pattern that repeats a light emission pattern in which the third illumination light L3 is emitted during one third illumination period P3 and the second illumination light L2 is emitted during one second illumination period P2. That is, the correction mode light emission pattern is a light emission pattern in which illumination light is emitted in the order of first illumination light L1, second illumination light L2, third illumination light L3, second illumination light L2, . . . .
- the image signal output from the image sensor 44 in each mode will be explained.
- the wavelength band and transmittance of light transmitted by the B color filter, G color filter, and R color filter of the image sensor 44 will be explained.
- the B color filter BF provided at the B pixel of the image sensor 44 mainly transmits light in the blue band, specifically, light in the wavelength band of 380 to 560 nm (blue transmission band).
- the peak wavelength at which the transmittance is maximum is around 460 to 470 nm.
- the G color filter GF provided in the G pixel of the image sensor 44 mainly transmits light in the green band, specifically, light in the wavelength band of 450 to 630 nm (green transmission band).
- the R color filter RF provided in the R pixel of the image sensor 44 mainly transmits light in the red band, specifically, light in the range of 580 to 760 nm (red transmission band).
- the imaging control unit 45 controls the imaging sensor 44 to capture reflected light from a subject illuminated with white light for each frame.
- a Bc image signal is output from the B pixel of the image sensor 44
- a Gc image signal is output from the G pixel
- an Rc image signal is output from the R pixel of the image sensor 44.
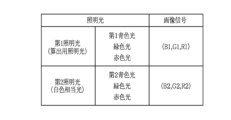
- the imaging control unit 45 controls the imaging sensor 44 to capture the reflected light from the subject illuminated with the first illumination light or the second illumination light for each frame. Control. With such control, in the oxygen saturation mode of the first embodiment, as shown in FIG. For each frame including the period P1, a B1 image signal, a G1 image signal, and an R1 image signal are output from the B pixel, the G pixel, and the R pixel of the image sensor 44, respectively.
- the B2 image signal is transmitted from the B pixel of the image sensor 44 to the G A G2 image signal is output from each pixel, and an R2 image signal is output from each R pixel.
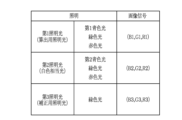
- the imaging control unit 45 controls the imaging so that the reflected light from the subject illuminated with the first illumination light, the second illumination light, or the third illumination light is photographed frame by frame. Controls the sensor 44. With such control, in the correction mode of the first embodiment, as shown in FIG. 20, the first illumination period P1 in which the first illumination light including the first blue light BL, green light G and red light R is emitted. A B1 image signal is output from the B pixel of the image sensor 44, a G1 image signal is output from the G pixel, and an R1 image signal is output from the R pixel of the image sensor 44.
- the B2 image signal is transmitted from the B pixel of the image sensor 44 to the G A G2 image signal is output from each pixel, and an R2 image signal is output from each R pixel.
- the B3 image signal is transmitted from the B pixel of the image sensor 44, the G3 image signal is transmitted from the G pixel, and the G3 image signal is transmitted from the R pixel of the image sensor 44.
- Each image signal is output. 18, 19, and 20 illustrate the relationship between illumination light emitted during one illumination period and image signals output in a frame including one illumination period.
- the characteristics of each image signal output in each mode, the oxygen saturation calculation table, and the correction process will be explained.
- the oxygen saturation mode among the image signals output in the oxygen saturation mode, the B1 image signal, the G2 image signal, and the R2 image signal are used to calculate the oxygen saturation.
- the B1 image signal, G2 In addition to the image signal and the R2 image signal, a B3 image signal and a G3 image signal are used.
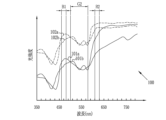
- the wavelength band of the first illumination light emitted toward the biological tissue to be observed and the reflected light obtained by illuminating the biological tissue using the first illumination light are Of these, the hemoglobin reflection spectrum, which indicates the relationship between the light intensity of the reflected light from deoxyhemoglobin (Hb) and oxidized hemoglobin (HbO 2 ) in living tissue, changes depending on the blood concentration. Blood concentration means the concentration of hemoglobin (amount of hemoglobin) contained in living tissue. Note that reduced hemoglobin (Hb) is hemoglobin that is not bonded to oxygen (O 2 ). Furthermore, oxyhemoglobin (HbO 2 ) is hemoglobin that is bound to oxygen (O 2 ).
- the hemoglobin reflection spectrum 100 when the specific dye is not contained in the living tissue is represented by a curve as shown in FIG. 21.
- curves 101a and 101b shown by solid lines represent the reflection spectra of hemoglobin when the blood concentration is high.
- the curve 101a represents the reflection spectrum of deoxyhemoglobin (Hb) when the blood concentration is high
- the curve 101b represents the reflection spectrum of oxyhemoglobin ( HbO2 ) when the blood concentration is high.
- curves 102a and 102b shown by broken lines represent the reflection spectra of hemoglobin when the blood concentration is low.
- the curve 102a represents the reflection spectrum of deoxyhemoglobin (Hb) when the blood concentration is low
- the curve 102b represents the reflection spectrum of oxyhemoglobin ( HbO2 ) when the blood concentration is low.
- the B1 image signal is the light that has passed through the B color filter BF among the reflected light that is reflected by illuminating the subject with the first illumination light that includes the first blue light BL having a center wavelength of 470 nm ⁇ 10 nm. This is an image signal output from the B pixel when the B pixel is photographed. Therefore, from the relationship between the wavelength band of the first blue light BL (see FIG. 11) and the transmission band of the B color filter BF of the image sensor 44 (see FIG. 17), the B1 image signal has the wavelength shown in FIG. Contains information on band B1.
- the wavelength band B1 corresponds to deoxyhemoglobin (Hb) and oxidized hemoglobin (HbO 2 ), which are shown by curves 101a and 101b (when the blood concentration is high) or curves 102a and 102b (when the blood concentration is low) in FIG.
- This is a wavelength band (460 nm to 480 nm) in which there is a large difference in reflection spectra.
- the G2 image signal is generated from the G pixel by the image sensor 44 capturing the light that has passed through the G color filter GF, out of the reflected light that is reflected by illuminating the subject with the second illumination light that includes the green light G. This is the image signal to be output. Therefore, from the relationship between the wavelength band of the green light G (see FIG. 12) and the transmission band of the G color filter GF of the image sensor 44 (see FIG. 17), the G2 image signal is generated in the wavelength band G2 shown in FIG. Contains information.
- the R2 image signal is generated from the R pixel by the image sensor 44 capturing the light that has passed through the R color filter RF, out of the reflected light that is reflected by illuminating the subject with the second illumination light that includes the red light R. This is the image signal to be output. Therefore, from the relationship between the wavelength band of the red light R (see FIG. 12) and the transmission band of the R color filter RF of the image sensor 44 (see FIG. 17), the R2 image signal is divided into the wavelength band R2 shown in FIG. Contains information.
- the observation target may include a specific pigment that is a pigment other than reduced hemoglobin (Hb) or oxidized hemoglobin (HbO 2 ) and that affects the calculation of oxygen saturation.
- the specific dye is, for example, a yellow dye.
- FIG. 22(A) shows an example of a hemoglobin reflection spectrum 103 when a specific dye is contained in a living tissue.
- FIG. 22(A) shows the reflection spectrum of deoxyhemoglobin (Hb) when the blood concentration is high (curve 101a) and the reflection spectrum of oxyhemoglobin (HbO 2 ) when the blood concentration is high.
- the reflection spectra are shown.
- wavelength band B1, wavelength band G2, and wavelength band R2 shown in FIG. 21 are shown.
- the absorption spectrum of the yellow dye is large. Therefore, when the observation target is illuminated with the first illumination light including the first blue light BL with a center wavelength of 470 nm ⁇ 10 nm, a part of the first illumination light (especially the first blue light BL) is converted into yellow pigment. It gets absorbed.
- wavelength band B3 and wavelength band G3 shown in FIG. 22(B) are bands in which the influence of the yellow pigment on the hemoglobin reflection spectrum is smaller than in wavelength band B1. Wavelength band B3 and wavelength band G3 will be explained in detail later.
- the B1 image signal, G2 image signal, and R2 image signal which are image signals output from the image sensor 44, include oxygen saturation, blood concentration, and brightness, as shown in FIG. Both have dependencies on .
- the dependence on oxygen saturation refers to the degree of change in the signal value (or signal ratio described later) depending on the level of oxygen saturation. Gender is qualitatively expressed as “large,” “medium,” or "small.”
- dependence on blood concentration refers to the degree of change in signal values (or signal ratios described later) depending on the level of blood concentration. It is qualitatively expressed as “large,” “medium,” and “small.”
- dependence on brightness means whether the signal value (or signal ratio described later) changes depending on the level of brightness. If there is a brightness dependence, it is expressed as “yes,” and if there is no brightness dependence, it is expressed as “absent.”
- the oxygen saturation dependence of the B1 image signal is “large”, the blood concentration dependence is “medium”, and the brightness dependence is “present”.
- the oxygen saturation dependence of the G2 image signal is “small”
- the blood concentration dependence is “large”
- the brightness dependence is “present.”
- the oxygen saturation dependence of the R2 image signal is “medium”
- the blood concentration dependence is “small”
- the brightness dependence is “present”.
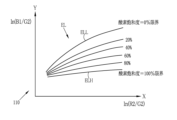
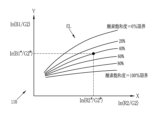
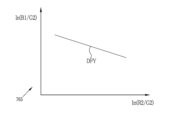
- the oxygen saturation calculation table 110 for calculating the oxygen saturation uses the G2 image signal as a normalized signal and the signal ratio ln (B1/G2) obtained by normalizing the B1 image signal with the G2 image signal. , is created based on the relationship with the signal ratio ln (R2/G2) obtained by normalizing the R2 image signal with the G2 image signal. Note that "ln" of the signal ratio ln(B1/G2) is a natural logarithm (the same applies to the signal ratio ln(R2/G2)).
- the oxygen saturation calculation table 110 is created in advance by using the correlation between the signal ratio of the experimentally acquired image signal and the oxygen saturation, and is stored in the extended processor device 17.
- the image signal for generating the oxygen saturation calculation table 110 is obtained by preparing a plurality of phantoms imitating a living body having a certain oxygen saturation according to multiple levels of oxygen saturation, and photographing each phantom. obtained by. Further, the correlation between the signal ratio of the image signal and the oxygen saturation may be obtained in advance by simulation.
- the correlation between the signal ratio ln(B1/G2) and the signal ratio ln(R2/G2) and the oxygen saturation is shown with the signal ratio ln(R2/G2) on the X axis and the signal ratio ln(B1/G2) on the Y axis.
- contour lines EL When expressed in a two-dimensional coordinate system of axes, it is expressed as contour lines EL on the oxygen saturation calculation table 110 as shown in FIG.
- the contour line ELH is a contour line indicating that the oxygen saturation level is "100%”.
- the contour line ELL is a contour line indicating that the oxygen saturation level is "0%”.
- the contour lines are distributed such that the oxygen saturation gradually decreases from the contour ELH to the contour ELL (in FIG. contour lines are drawn for ⁇ 80%'', ⁇ 60%'', ⁇ 40%'', and ⁇ 20%'').
- the value of the X component (signal ratio ln(R2/G2)) and the value of the Y component (signal ratio ln(B1/G2)) represent oxygen saturation dependence and blood concentration dependence, respectively.
- the brightness dependence is determined to be "none”.
- oxygen saturation dependence is "medium”
- blood concentration dependence is "large”.
- the value of the Y component has a "high” oxygen saturation dependence and a "medium” blood concentration dependence.
- the B1 image signal, G2 image signal, and R2 image signal have dependence on yellow pigment (yellow pigment dependence).
- Yellow pigment dependence refers to the degree of change in signal value (or signal ratio) depending on the level of yellow pigment concentration. Expressed qualitatively.
- FIG. 26 shows the dependence of image signals on yellow pigment.
- the yellow pigment dependence of the B1 image signal (indicated by "B1" in FIG. 26) is "large”. This is because, as shown in FIG. 22(A), when yellow pigment is present, the reflection spectrum of deoxyhemoglobin (Hb) in the wavelength band B1 becomes smaller, so that the signal value of the B1 image signal increases. This is because it decreases.
- the yellow pigment dependence of the G2 image signal is “small to medium”.
- the dependence of the R2 image signal (indicated by "R2" in FIG. 26) on the yellow dye is "small".
- the value of the Y component (signal ratio ln (B1/G2)) also decreases. Therefore, as shown in FIG. 27, in the oxygen saturation calculation table 110, due to the presence of the yellow pigment, the oxygen saturation StO 2 A when the yellow pigment is present is higher than the oxygen saturation StO 2 A when the yellow pigment is not present.
- the saturation StO 2 B is calculated so that the oxygen saturation appears to be high.
- a B3 image signal and a G3 image signal are further acquired by photographing the reflected light obtained by illuminating the subject with the third illumination light.
- the B3 image signal is an image signal output from the B pixel when the image sensor 44 captures the light that has passed through the B color filter BF among the reflected light obtained by illuminating the subject with the third illumination light. be. Therefore, from the relationship between the wavelength band of the green light G (see FIG. 13) and the transmission band of the B color filter BF of the image sensor 44 (see FIG. 17), the B3 image signal is as shown in FIG. 22(B). Contains information on wavelength band B3.
- the G3 image signal is output from the G pixel by the image sensor 44 capturing the light that has passed through the G color filter GF among the reflected light obtained by illuminating the subject with the third illumination light consisting of green light G. This is the image signal to be used. Therefore, from the relationship between the wavelength band of the green light G (see FIG. 13) and the transmission band of the G color filter GF of the image sensor 44 (see FIG. 17), the G3 image signal is as shown in FIG. 22(B). Contains information on wavelength band G3.
- the B3 image signal and the G3 image signal like the B1 image signal, G2 image signal, and R2 image signal, have oxygen saturation dependence, blood concentration dependence, and brightness dependence. Depends on yellow pigment.
- the oxygen saturation dependence of the B3 image signal (indicated by “B3” in FIG. 28) is “small”
- the blood concentration dependence is “large”
- the yellow pigment dependence is “medium”
- Brightness dependence is “yes”.
- the G3 image signal indicated by “G3” in FIG. 28
- the oxygen saturation dependence is "small”
- the blood concentration dependence is “large
- the yellow pigment dependence is "large”
- brightness dependence is "Yes”.
- the B2 image signal since the B2 image signal also has "high” yellow pigment dependence, the B2 image signal may be used instead of the B3 image signal during the correction process. Further, as shown in FIG. 28, the oxygen saturation dependence of the B2 image signal is "small,” the blood concentration dependence is “large,” and the brightness dependence is "present.”
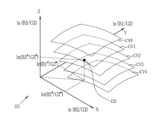
- a corrected oxygen saturation calculation table 120 as shown in FIG. 29 is used to calculate the oxygen saturation in consideration of the concentration of the specific dye.
- the corrected oxygen saturation calculation table 120 shows the relationship between the signal ratio ln (B1/G2), the signal ratio ln (R2/G2), the signal ratio ln (B3/G3), and the oxygen saturation according to the concentration of the specific dye. This is a table representing correlation.
- the signal ratio ln(B3/G3) is a signal ratio obtained by normalizing the B3 image signal with the G3 image signal. Note that, like the oxygen saturation calculation table 110, the corrected oxygen saturation calculation table 120 is created in advance and stored in the extended processor device 17.
- the corrected oxygen saturation calculation table 120 has the signal ratio ln(R2/G2) on the X axis, the signal ratio ln(B1/G2) on the Y axis, and the signal ratio ln(B3 /G3) as the Z-axis, curved surfaces CV0 to CV4 representing oxygen saturation are distributed in the Z-axis direction according to the concentration of the yellow pigment (hereinafter referred to as the first pigment value). Ru.
- the curved surface CV0 represents the oxygen saturation when the first pigment value is "0" (when there is no yellow pigment, or there is a very small amount of yellow pigment, so there is no effect on the calculation of oxygen saturation). ing.
- Curved surfaces CV1 to CV4 represent the oxygen saturation when the first dye value is “1" to "4", respectively.
- the three-dimensional coordinates have the signal ratio ln(R2/G2) as the X axis, the signal ratio ln(B1/G2) as the Y axis, and the signal ratio ln(B3/G3) as the Z axis.
- the oxygen saturation (curved surfaces CV0 to CV4) according to the first dye value expressed in the system is expressed as
- regions AR0 to AR4 representing oxygen saturation are distributed at different positions depending on the first dye value. Regions AR0 to AR4 represent the distribution of oxygen saturation when the first dye value is "0" to "4", respectively.
- the oxygen saturation corresponding to the concentration of the yellow pigment can be determined. Note that, as shown in the regions AR0 to AR4, the larger the first dye value, the higher the value on the X axis and the lower the value on the Y axis.
- FIG. G3 has oxygen saturation dependence, blood concentration dependence, and yellow pigment dependence, respectively.
- the dependence of the value of the X component on the yellow dye is "small to medium”
- the dependence of the value of the Y component on the yellow dye is "large”
- the dependence of the value of the Z component on the yellow dye is "medium”.
- the oxygen saturation dependence is "small to medium”
- the blood concentration dependence is “small to medium.”
- Gender is “nothingness”.
- the "correction processing" in the correction mode of the first embodiment means that in addition to the image signal acquired in the oxygen saturation mode, the image signal has yellow pigment dependence, and has oxygen saturation dependence and blood concentration dependence.
- This is a process of further acquiring different image signals, referring to the corrected oxygen saturation calculation table 120 expressed in a three-dimensional coordinate system, and selecting the oxygen saturation calculation table according to the specific dye concentration. By switching to the oxygen saturation mode again after completing the correction process, more accurate oxygen saturation can be calculated using the oxygen saturation calculation table according to the specific pigment concentration of the tissue being observed.
- the extended processor device 16 includes an oxygen saturation image generation section 130, a corrected oxygen saturation calculation section 140, a table correction section 141, an extended central control section 150, a reliability calculation section 160, and a correction determination section 170. , an extended display control section 200, a region of interest setting section 210, a region position information storage section 240, a region index value calculation section 250, an index value display table generation section 260, and a display image generation section 270.
- programs related to various processes are incorporated in a program memory (not shown).
- the extended central control unit 150 constituted by a processor
- the oxygen saturation image generation unit 130 the corrected oxygen saturation calculation unit 140
- the table correction unit 141 the reliability calculation unit 160
- the functions of the correction determination section 170, extended display control section 200, region of interest setting section 210, region position information storage section 240, region index value calculation section 250, index value display table generation section 260, and display image generation section 270 are realized. .
- the oxygen saturation image generation section 130 includes a base image generation section 131, a calculated value calculation section 132, an oxygen saturation calculation section 133, and a color tone adjustment section 134.
- the base image generation unit 131 generates a base image based on the image signal transmitted from the image communication unit 90 of the processor device 14.
- the base image is preferably an image that allows morphological information such as the shape of the observation target to be grasped.
- the base image is a white light equivalent image generated using a B2 image signal, a G2 image signal, and an R2 image signal.
- the base image may be a narrowband light image obtained by illuminating a subject with narrowband light, in which blood vessels, glandular duct structures, etc. are highlighted.
- the calculated value calculation unit 132 calculates a calculated value through calculation processing based on the image signal transmitted from the image communication unit 90. Specifically, the calculated value calculation unit 132 uses the signal ratio B1/G2 between the B1 image signal and the G2 image signal and the signal ratio between the R2 image signal and the G2 image signal as the calculated values used to calculate the oxygen saturation level. Calculate R2/G2. Furthermore, in the correction mode, a signal ratio B3/G3 between the B3 image signal and the G3 image signal is calculated. Note that it is preferable that the signal ratio B1/G2, the signal ratio R2/G2, and the signal ratio B3/G3 be further logarithmized (ln). In addition, as the calculated values, color difference signals Cr, Cb, saturation S, hue H, etc. that are converted and calculated using the B1 image signal, G2 image signal, R2 image signal, B3 image signal, or G3 image signal are used. Good too.
- the oxygen saturation calculation unit 133 calculates the oxygen saturation using the calculated value and by referring to the oxygen saturation calculation table 110 (see FIG. 24).
- the oxygen saturation calculation unit 133 refers to the oxygen saturation calculation table 110 and calculates the oxygen saturation corresponding to the signal ratios B1/G2 and R2/G2 for each pixel. For example, as shown in FIG. 32, when the signal ratio of a specific pixel is ln(B1 * /G2 * ) and ln(R2 * /G2 * ), the signal ratio is ln(B1 * /G2 * ). , ln(R2 * /G2 * ) is "40%". In this case, the oxygen saturation calculation unit 133 calculates the oxygen saturation of the specific pixel as "40%". Note that oxygen saturation is one of the biometric index values described later, which is a value indicating the state of an observation target, which is a subject.
- the color tone adjustment unit 134 generates an oxygen saturation image by performing color tone adjustment processing using the oxygen saturation calculated by the oxygen saturation calculation unit 133.
- an oxygen saturation image is generated by pseudo color processing in which a color is assigned according to the oxygen saturation level.
- pseudo-color processing a base image is not required.
- a threshold value for oxygen saturation image generation is set in advance, and for pixels whose oxygen saturation is equal to or higher than the oxygen saturation image generation threshold value in the base image, the color tone is maintained and the oxygen saturation image generation threshold value is set in advance. For pixels whose saturation is less than the oxygen saturation image generation threshold, an oxygen saturation image is generated by performing a process of changing the color tone according to the oxygen saturation.
- the color tone of areas where oxygen saturation is relatively high (above the oxygen saturation image generation threshold) is maintained, while the color tone of areas where oxygen saturation is relatively low (oxygen saturation
- the color tone of areas where oxygen saturation is relatively low oxygen saturation
- tissue will coalesce at the site where the incision and sutures were made, leading to healing.
- tissue at the sutured site becomes incompletely fused for some reason, suturing failure may occur in which part or all of the sutured site separates again.
- Suture failure is known to occur in areas of low oxygen saturation or congestion. Therefore, by displaying the oxygen saturation image, it is possible to support the user in determining the resection site or anastomosis site that is unlikely to cause suturing failure after surgery.
- the index value display table (described later) and the oxygen saturation image side by side, in addition to expressing the oxygen saturation using color tones, the actual value of the oxygen saturation is shown to the user, allowing the user to more accurately In addition, it is possible to easily support the determination of a region suitable for incision or anastomosis.
- the corrected oxygen saturation calculation unit 140 performs correction processing using the calculated value and by referring to the corrected oxygen saturation calculation table 120 (see FIG. 29(A)). Note that among the calculated values, the calculation and logarithmization of the signal ratio B3/G3 may be performed by the corrected oxygen saturation calculation unit 140.
- the table correction unit 141 performs a table correction process in which the oxygen saturation calculation table is set as the oxygen saturation calculation table selected by referring to the corrected oxygen saturation calculation table 120. conduct.
- table correction processing for example, when the first dye value is "2", the areas AR0 to AR4 (corrected oxygen saturation calculation table 120) defined according to the first dye value shown in FIG. Among the curved surfaces CV0 to CV4), the oxygen saturation calculation table in which the contour lines EL as shown in FIG. 33(B) are drawn and the area AR2 corresponding to the first dye value "2" is selected.
- the table correction unit 141 corrects the oxygen saturation calculation table 110 so that the oxygen saturation calculation table 110 referred to in the oxygen saturation calculation unit 133 is the oxygen saturation calculation table that is the area AR2. .
- the correction process may be performed for each pixel of the endoscopic image, or may be performed for each pixel in a specific area, which will be described later.
- the value of the X component (signal ratio ln(R2/G2)) and the value of the Y component (signal ratio ln (B1/G2)) and the value of the Z component (signal ratio ln(B3/G3)).
- the signal ratio ln(R2/G2) is set on the X axis
- the signal ratio ln(B1/G2) is set on the Y axis
- the signal ratio ln In a three-dimensional coordinate system with (B3/G3) as the Z axis, the value of the X component (signal ratio ln(R2/G2)), the value of the Y component (signal ratio ln(B1/G2)), and the value of the Z component. (signal ratio ln(B3/G3)) and the oxygen saturation is calculated using a table for calculating the corrected oxygen saturation, which takes into account the influence of the specific dye. You can do it like this. Note that in such a table for calculating corrected oxygen saturation, contour lines or spaces indicating the same oxygen saturation are three-dimensionally distributed in a three-dimensional coordinate system.
- the signal ratio is the signal ratio ln(R2 * /G2 * ), ln(B1 * /G2 * ), ln(B3 * /G3 * ), the signal ratio ln(R2 * /G2 * ), ln
- the corrected oxygen saturation at the point 123 corresponding to (B1 * /G2 * ) and ln(B3 * /G3 * ) is calculated as the oxygen saturation.
- some of the image signals obtained in the correction mode may be used.
- a part of the image signal refers to an image signal in a specific area of the correction image to be described later.
- the specific region be a region that is less affected by disturbances that affect the accuracy of oxygen saturation calculation. In order to determine the degree of influence of disturbance in a specific area, the reliability of the image signal in the specific area is calculated.
- the extended central control unit 150 of the extended processor device 16 sets a lower limit value and an upper limit channel threshold value for each channel (B channel, G channel, R channel) of each pixel. If the pixel values of all channels are greater than or equal to the channel lower limit value for each color and less than the channel upper limit value, that pixel is determined to be a valid pixel and is used as the pixel for reliability calculation. .
- Disturbances include halation, dark areas, bleeding, fat, and mucous membranes that can cause a decrease in the accuracy of calculating oxygen saturation, other than specific pigments among the observation objects shown in the endoscopic image taken by the endoscope 12. These are deposits on the surface, etc.
- Halation and dark areas are related to the brightness of endoscopic images. Halation is an area where an image is blown out due to strong light entering the image sensor 44.
- a dark area is an area where illumination light is difficult to reach due to shadows of in-vivo structures such as folds and colonic flexures, treatment instruments, etc., or because it is deep in the lumen, and the image is dark.
- Bleeding includes external bleeding into the extraserosal (intraperitoneal) or gastrointestinal lumen, and internal bleeding within the mucous membranes.
- Fat includes fat observed extraserally (intraperitoneal), such as the greater omentum, lesser omentum, and mesentery, and fat observed on the mucosal surface of the lumen of the gastrointestinal tract.
- Deposits on the surface of mucous membranes include deposits of biological origin such as mucus, blood, and exudates; This includes deposits that are leftover liquid or residue mixed with kimono.
- a correction image 161 as shown in FIG. 35 is displayed on the display at the timing of switching to the correction mode. Display of the correction image 161 is controlled by the extended display control section 200. In the correction image 161, a specific area 162 is displayed in a manner that is visible to the user.
- the shape of the specific region 162 is not limited to a circular shape as shown in FIG. 35. Further, the position of the specific area 162 is not limited to the center of the image as shown in FIG. 35. For example, a donut-shaped area excluding the periphery of the correction image 161, where the influence of distortion is large due to the curvature of the lens, and the center of the correction image 161, which is a dark area because it corresponds to the back of the lumen, is designated as a specific area. You can also use it as Note that the correction image is preferably a color image (for example, a white light equivalent image) generated using the B2 image signal, the G2 image signal, and the R2 image signal. The correction image may be an image generated using other image signals.
- a color image for example, a white light equivalent image
- the reliability calculation unit 160 of the extended processor device 16 calculates the Based on this, reliability is calculated for each pixel included in the specific area 162. Note that the input of the reliability calculation instruction may be performed according to an input instruction via the user interface, or may be performed automatically at the same timing as the control for displaying the correction image 161.
- the reliability includes (1) reliability regarding the brightness of the endoscopic image, (2) reliability based on the degree of bleeding contained in the endoscopic image, and (3) degree of fat contained in the endoscopic image. There are reliability etc.
- the reliability calculation unit 160 uses the G1 image signal to calculate the reliability by referring to the first reliability calculation table 163 as shown in FIG.
- the first reliability calculation table 163 is a table generated in advance that shows the relationship between the signal value of the G1 image signal and the reliability.
- the signal value of the G1 image signal is, for example, a luminance value obtained by performing conversion processing using the G1 image signal.
- the reliability is calculated as a value between 0 and 1.
- the reliability when the signal value of the G1 image signal is outside the fixed range Rx is lower than the reliability when the luminance value of the G1 image signal is within the fixed range Rx. It has become.
- the signal value of the G1 image signal when the signal value of the G1 image signal is outside the fixed range Rx, it means that the pixel contains halation, has a high luminance value, or contains a dark part in a specific area, which causes minimal luminance. For example, when the value is a value.
- the G2 image signal may be used instead of the G1 image signal to calculate the reliability regarding brightness (see FIG. 102 described later).
- the reliability calculation unit 160 uses the signal ratio ln(R2/G2) and the signal ratio ln(B2/G2) and refers to the second reliability calculation table 164 as shown in FIG. Calculate reliability.
- the definition line DFX is plotted in a two-dimensional coordinate system in which the X axis is ln(R2/G2) and the Y axis is the signal ratio ln(B2/G2).
- coordinates (X2, Y2) (ln(R2/G2), ln( B2/G2)) is calculated so that the lower the right position in the second reliability calculation table 164, the lower the reliability.
- the reliability based on the degree of bleeding is set to a fixed value that is highly reliable.
- the signal ratio ln(R2/G2) is a value obtained by normalizing the R2 image signal with the G2 image signal and converting it into a logarithm.
- the signal ratio ln(B2/G2) is a value obtained by normalizing the B2 image signal with the G2 image signal and converting it into a logarithm.
- the reliability calculation unit 160 uses the signal value ln(R1/G1) and the signal ratio ln(B1/G1) and refers to the third reliability calculation table 165 as shown in FIG. Calculate reliability.
- the definition line DFY is plotted in a two-dimensional coordinate system in which the X axis is ln(R1/G1) and the Y axis is the signal ratio ln(B1/G1).
- coordinates (X3, Y3) (ln (R1/G1), ln ( B1/G1)) is calculated so that the lower the left position in the third reliability calculation table 165, the lower the reliability.
- the reliability based on the degree of fat is set to a fixed value that is highly reliable.
- the signal ratio ln(R1/G1) is a value obtained by normalizing the R1 image signal with the G1 image signal and converting it into a logarithm.
- the signal ratio ln(B1/G1) is a value obtained by normalizing the B1 image signal with the G1 image signal and converting it into a logarithm.
- the value of the X component can be changed to the signal value ln(R2/G2), and the value of the Y component can be changed to the signal ratio.
- the reliability calculation unit 160 calculates at least one of the reliability regarding brightness (first reliability), the reliability regarding the degree of bleeding (second reliability), and the reliability regarding the degree of fat (third reliability). Calculate more than one confidence level.
- the calculated reliability is used for notification to prevent a region with low reliability from entering a specific region, or for weighting processing of signal values of image signals used in correction processing.
- the calculated reliability is transmitted to the correction determination unit 170.
- the correction determination unit 170 uses a preset reliability determination threshold to determine the reliability calculated for each pixel in the specific area, and determines whether each pixel is a high reliability pixel or a low reliability pixel. The result of determining whether the pixel is a degree pixel is output.
- the correction determination unit 170 determines a pixel whose reliability is greater than or equal to a reliability determination threshold as a high reliability pixel, and determines a pixel whose reliability is less than a reliability determination threshold as a low reliability pixel.
- the correction determination unit 170 transmits the determination result of determining the reliability of each pixel to the extended display control unit 200.
- the extended display control unit 200 performs control to change the display mode of the correction image 161 displayed on the display according to the determination result.
- the extended display control unit 200 makes the saturation of the low reliability area 171a higher than the saturation of the high reliability area 171b in the specific area 162.
- a low reliability area is a set of pixels having low reliability pixels.
- the high reliability area is a set of pixels having high reliability pixels.
- the reliability level used for the determination of the reliability level is the first reliability level, the second reliability level, or the third reliability level.
- the lowest reliability level may be used.
- a reliability determination threshold may be set for each reliability. For example, a first reliability determination threshold for the first reliability, a second reliability determination threshold for the second reliability, and a third reliability determination threshold for the third reliability are set in advance, and any of the reliability is less than a reliability determination threshold, the pixel whose reliability has been calculated may be determined to be a low reliability pixel.
- the correction determination unit 170 may further perform determination on the number of high reliability pixels with respect to the reliability calculated for each pixel.
- the extended display control unit 200 determines whether the high-reliability pixels in the specific area are equal to or greater than the threshold for determining the number of high-reliability pixels and when the number of high-reliability pixels in the specific area is less than the threshold for determining the number of high-reliability pixels. Change the display mode. For example, if the high reliability pixels in a specific area are equal to or higher than the threshold for determining the number of high reliability pixels, the specific area is highlighted by surrounding it with a frame 172 of the first determination result color, as shown in FIG. A correction image 161 is displayed. By highlighting the specific area by surrounding it with a frame of the first determination result color, it is possible to notify the user that the correction process can be performed with less influence of disturbance.
- the specific area is highlighted by surrounding it with a frame of a second judgment result color that is different from the first judgment result color.
- the corrected image 161 may be displayed.
- the extended display control unit 200 determines whether the number of low reliability pixels in the specific area is equal to or greater than the threshold for determining the number of low reliability pixels;
- the display mode of the specific area may be changed depending on whether the number of pixels is less than the threshold for determining the number of low reliability pixels.
- the threshold for determining the number of reliable pixels threshold for determining the number of high reliability pixels or the threshold for determining the number of low reliability pixels
- the display mode of the image for correction is determined according to the number of pixels with high or low reliability. By changing this, it is possible to notify the extent to which disturbance is included in a specific area and prompt the user to operate the endoscope in order to appropriately perform correction processing.
- the correction determination unit 170 determines the reliability of each pixel in the specific area using the reliability determination threshold and/or the reliability pixel number determination threshold, and determines that the influence of disturbance in the specific area is small.
- a message indicating that the correction process can be appropriately performed may be displayed on the correction image 161.
- a message MS1 such as "Correction processing will be performed properly" is displayed superimposed on the correction image 161.
- the correction determination unit 170 determines the reliability of each pixel in the specific area using the reliability determination threshold and/or the reliability pixel count determination threshold, and if the specific area includes a low reliability area, Alternatively, a warning may be displayed when the number of low-reliability pixels is equal to or greater than a threshold for determining the number of reliability pixels. For example, as shown in FIG. 42, a message MS2 such as "Please operate the endoscope for correction processing" is displayed superimposed on the correction image 161. Furthermore, if it is determined that the reliability of brightness has a particularly large influence, a message MS3 such as "Please avoid dark areas" may be superimposed on the correction image 161 as shown in FIG. good.
- the user is notified that a specific area includes a low-reliability area that contains relatively many disturbances, or correction processing can be performed appropriately. This can be reported. Note that in addition to the images displayed on the display, audio notifications may also be provided.
- the user can be encouraged to operate the endoscope 12 while observing the correction image 161 so that an area less affected by disturbances is within the specific area 162. . That is, the user can be prompted to operate the endoscope 12 so that the low reliability area does not enter the specific area as much as possible, and the high reliability area enters the specific area as much as possible.
- the correction process in the correction mode is performed.
- the reliability of each pixel in the specific area is determined using the reliability determination threshold and/or the reliability pixel number determination threshold, and it is determined that the influence of disturbance in the specific area 162 is small, the user's input The correction process may be automatically executed without any operation.
- the reliability in a specific area is calculated as an internal process of the extended processor device 16, and the image signal in the specific area is determined after determining the reliability for each pixel.
- the correction process may be performed using the data.
- display control is performed to prompt the user to switch to oxygen saturation mode.
- the mode may be automatically switched to the oxygen saturation mode without such a display.
- weighting is applied to the signal values of the B2 image signal, G2 image signal, R2 image signal, B3 image signal, and/or G3 image signal using the reliability calculated for each pixel in a specific area. By performing the process, the reliability may be reflected in the correction process.
- the average value (average signal value) of the B2 image signal, G2 image signal, R2 image signal, B3 image signal and/or G3 image signal in the specific area is used to value (signal ratio ln(R2/G2)), Y component value (signal ratio ln(B1/G2)), and Z component value (signal ratio ln(B3/G3)), the average signal value
- the weighted average value that has been subjected to weighting processing may be used to calculate the X component value, the Y component value, and the Z component value.
- the extended processor device 16 includes a region of interest setting section 210, a region position information storage section 240, a region index value calculation section 250, an index value display table generation section 260, a display image generation section 270, and an extended display control section 200. Further, it may include a region index value storage section 280 and/or an index value link line generation section 290, which will be described later.
- the region of interest setting unit 210 sets a region of interest in the endoscopic image displayed on the first user interface or the second user interface.
- a region of interest is a region of an endoscopic image that is a target for calculating a region index value.
- a region index value is a statistical value of a biometric index value calculated based on an image signal in a region of interest.
- the biometric index value is a value indicating the state of an observation target, which is a subject, and specifically, it is an oxygen saturation level, a hemoglobin index, and a combination index. The biometric index value and the region index value will be described later.
- a specific example (1) is a case where the endoscopic image for setting the region of interest is an oxygen saturation image.
- a specific example (2) is a case where the endoscopic image for setting the region of interest is a white light equivalent image.
- a specific example (3) is a case where the endoscopic image for setting the region of interest is a white light image.
- an oxygen saturation image 202 as shown in FIG. 43(A) is displayed on the display.
- a region of interest setting instruction is input to the extended processor device 16 via the central control unit 50 of the processor device 13.
- the region of interest setting unit 210 that receives the region of interest setting instruction sets regions of interest 212a, 212b, and 212c on the endoscopic image (oxygen saturation image 202), for example, as shown in FIG. 43(B). .
- a plurality of regions of interest are set at different positions on the endoscopic image.
- the reference numeral of the object Ob will be omitted to avoid cluttering the figures.
- regions of interest or region position information to be described later are drawn in a straight line for simplicity, but it is preferable that the set regions of interest are not aligned in a straight line.
- region of interest image 211 An endoscopic image in which regions of interest 212a, 212b, and 212c are set (hereinafter referred to as region of interest image 211) as shown in FIG.
- region of interest image 211 An endoscopic image in which regions of interest 212a, 212b, and 212c are set (hereinafter referred to as region of interest image 211) as shown in FIG.
- region of interest image 211 under the display control of the extended display control unit 200, as shown in FIG. 44, it is displayed on the display that is the second user interface.
- a region of interest image 211 in which a region of interest is set in an oxygen saturation image is displayed on the display that is the second user interface 17
- a white light equivalent image 201 is displayed on the display that is the first user interface 15. .
- the region of interest setting unit 210 displays a region of interest at a preset position on the endoscopic image.
- the number and positions of regions of interest on the endoscopic image are set in advance.
- “three" regions of interest are set in advance.
- "setting positions" of the three regions of interest 212a, 212b, and 212c are set in advance.
- the number of regions of interest can be arbitrarily set as a natural number of 2 or more.
- the position of the region of interest can be set arbitrarily. The reason why a plurality of regions of interest are set at different positions is to calculate region index values in regions of interest located at spatially distant positions.
- spatially distant positions mean different positions in the living tissue, and by setting regions of interest at mutually different positions on the living tissue, spatial changes in index values, i.e., different positions in the living tissue. It is possible to grasp the index values in the region of interest set in , and the changes in these index values.
- the position of the region of interest is stored in the region position information storage unit 240 as a plurality of pieces of region position information. That is, the positions of multiple regions of interest in the region of interest image become region position information.
- the position of the region of interest refers to coordinate information of the region of interest in the endoscopic image.
- the area location information storage unit 240 may be located in the extended processor device 16 or may be a storage located outside the extended processor device 16.
- the operation of the region of interest setting switch 12d may be a pressing operation of the region of interest setting switch 12d provided on the endoscope 12 or a foot switch that is a user interface, and may be performed by pressing the region of interest setting switch 12d provided on the endoscope 12 or a foot switch that is a user interface. It may also be a selection operation such as clicking or tapping a switch for setting the region of interest (User Interface).
- biometric index values are calculated based on image signals within the regions of interest 212a, 212b, and 212c.
- the calculated biometric index value in the region of interest is transmitted to the region index value calculation unit 250.
- the oxygen saturation is measured in almost real time based on the B1 image signal, B2 image signal, G2 image signal, R2 image signal, etc.
- a hemoglobin index or a combination index may be calculated as the biological index value.
- a hemoglobin index indicating the blood concentration of the subject may be calculated based on the B1 image signal, B2 image signal, G2 image signal, R2 image signal, etc. that have blood concentration dependence.
- a combination index which is a biological index value that combines oxygen saturation and hemoglobin index, may be calculated.
- the combination index is calculated using a combination index calculation table 350 as shown in FIG.
- the combination index calculation table 350 since threshold values are provided for oxygen saturation and hemoglobin index, the values are set to "1", “2", “3”, or "4" depending on the level of oxygen saturation and hemoglobin index.
- a combination index which is the value of , can be determined.
- the combination index is It becomes "1". Further, the combination index is "2" when the oxygen saturation is less than the oxygen saturation threshold Th1 and the hemoglobin index threshold is greater than or equal to the hemoglobin index threshold Th2. The combination index is "3" when the oxygen saturation is less than the oxygen saturation threshold Th1 and the hemoglobin index threshold is less than the hemoglobin index threshold Th2. The combination index is "4" when the oxygen saturation is greater than or equal to the oxygen saturation threshold Th1 and the hemoglobin index threshold is less than the hemoglobin index threshold Th2.
- Pixels or regions with a combination index of "1", “2" or “3” have low oxygen saturation or congestion, and are at risk of suture failure.
- a pixel or region with a combination index of "4" is a region with high oxygen saturation, low hemoglobin index, non-congestion, and low risk of suture failure.
- biometric index value selection screen 351 as shown in FIG. 46 may be displayed on the display, and a biometric index value to be calculated may be selected by operating a radio button 352 that is a GUI.
- oxygen saturation and hemoglobin index are selected as the biometric index values to be calculated.
- the oxygen saturation is calculated by the oxygen saturation calculation unit 133.
- a biometric index value calculation section (not shown) may be provided in the extended processor device 16, and these biometric index values may be calculated by the biometric index value calculation section.
- the region index value calculation unit 250 calculates a region index value as a statistical value of the biometric index value in the region of interest based on the biometric index value in the region of interest.
- the statistical value is an average value, median value, mode value, maximum value, minimum value, etc.
- a region index value is calculated for each region of interest. In the example shown in FIG. 43(B), region index values are calculated for each of the region of interest 212a, the region of interest 212b, and the region of interest 212c.
- the calculated area index value is sent to the index value display table generation section 260. Alternatively, the information may be transmitted to the area index value storage unit 280, which will be described later.
- the index value display table generation unit 260 generates an index value display table that summarizes a plurality of area index values to be displayed on the display image.
- the index value display table generation unit 260 generates an index value display table 261 that represents a plurality of area index values in a graph format, as shown in FIG.
- the example of the index value display table 261 shown in FIG. 47 shows an example of the index value display table 261 in which the vertical axis is the region index value and the horizontal axis is the region of interest.
- region of interest 212a is indicated as "ROI1
- region of interest 212b is indicated as “ROI2”
- region of interest 212c is indicated as “ROI3”
- polygonal lines indicate the respective region index values 251a, 251b, and 251c.
- a spark line 262 is displayed (see FIG. 43(B)). Note that "ROI” is an abbreviation for Region Of Interest, and means "region of interest.”
- spark lines may be displayed using a vertical bar graph.
- the region index value 251a of the region of interest 212a (ROI1) is "60”
- the region index value 251b of the region of interest 212b (ROI2) is "90”
- the region of interest 212c (ROI3) is ) is calculated as "90”.
- the calculated area index values 251a, 251b, and 251c may be displayed together with the spark line 262. Note that the specific example shown in FIG. 47 assumes an example in which the biometric index value is calculated as the oxygen saturation level.
- the index value display table generation unit 260 may generate an index value display table 263 that represents a plurality of area index values in a table format, as shown in FIG.
- the region index values are calculated when the region index value of the region of interest 212a is calculated as "60"
- the region index value of the region of interest 212b is calculated as "90”
- the region index value of the region of interest 212c is calculated as "90”.
- An index value display table 263 is shown in a table format.
- the index value display table generation unit 260 determines whether to generate an index value display table in a graph format or a table format, and in the case of a graph format, whether to generate a line sparkline or a vertical bar sparkline. may be set in advance or may be set by the user. When these settings are made by the user, an index value display table setting screen (not shown) may be displayed on the display, and the settings may be made by operating the GUI.
- the index value display table generated by the index value display table generation section 260 is transmitted to the display image generation section 270.
- the display image generation unit 270 generates a display image for displaying the index value display table, the endoscopic image, and the area position information. For example, when generating a display image for displaying an index value display table as shown in FIG. 47, the display image generation unit 270 generates a display image 271 as shown in FIG. 49. In the example of the display image 271 shown in FIG. 49, an endoscopic image (region of interest image 211 in which a region of interest is set in the oxygen saturation image 201, see FIG. 43(B)) and an index value display table 261 are displayed. There is. Further, in the display image 271, region position information 272a, 272b, and 272c, which is information on the position of the region of interest for which the region index value is calculated, is displayed superimposed on the endoscopic image.
- the display image generation unit 270 reads the region position information, which is the position of the region of interest in the endoscopic image, stored in the region position information storage unit 240, thereby adding the region position information stored in the region position information storage unit 240 to the endoscopic image to be displayed in the display image.
- the position of the region of interest for which the region index value is calculated is superimposed and displayed as region position information.
- region position information 272a corresponds to the region of interest 212a
- region position information 272b corresponds to the region of interest 212b
- region position information 272c corresponds to the region of interest 212c. (See FIG. 43(B) and FIG. 44).
- the generated display image is sent to the extended display control unit 200.
- the extended display control unit 200 displays the display image on the display, which is the second user interface, by performing signal processing to display the display image on the display.
- a region of interest is set in the oxygen saturation image 211, for example, as shown in FIG. displays the display image 271.
- an index value display table that displays regional index values related to multiple regions of interest in an oxygen saturation image
- the user can see the biometric index values in the oxygen saturation image that the user is observing. Spatial changes can be reported.
- the oxygen saturation mode by displaying the white light equivalent image and the display image side by side, it is possible to display an image close to white light and area indicators at multiple locations on the oxygen saturation image. The values can be displayed so that the user can easily compare them. As a result, it is possible to support the user in determining which parts are suitable candidates for incision based on the biometric index value and which parts are inappropriate for incision based on the biometric index value.
- Specific example (2) differs from specific example (1) in which a region of interest is set on an oxygen saturation image, in which a plurality of regions of interest are set on a white light equivalent image in oxygen saturation mode. Further, when finally displaying the display image, the display image generated by the display image generation unit 270 is transmitted to the display control unit 80 of the processor device 15, and the display image is transmitted to the first user interface. Display on display.
- a display image 273 is displayed on the display that is the first user interface 15, and an oxygen saturation image 202 is displayed on the display that is the second user interface 17. Ru.
- region position information 274a, 274b, and 274c indicating the position of the set region of interest is displayed superimposed on the white light equivalent image 213.
- an index value display table 264 is displayed that collectively displays region index values in the regions of interest set in the white light equivalent image 213.
- the flow from the setting of the region of interest on the white light equivalent image to the generation of the display image is the same as that of the specific example (1), so a detailed explanation will be omitted. A brief explanation will be given below.
- the positions of the plurality of regions of interest set on the white light equivalent image are each stored in the region position information storage unit 240 as region position information.
- the biometric index value is determined based on the image signal in the region of interest. is calculated.
- the region index value calculation unit 250 calculates a region index value based on the biometric index value in the region of interest.
- the index value display table generation unit 260 uses the calculated region index values for each region of interest to generate an index value display table 263 that summarizes the plurality of region index values.
- the display image generation unit 270 generates a display image for displaying the white light equivalent image 213 in which the area position information 274a, 274b, and 274c are superimposed and the index value display table 263.
- the area index values at multiple locations on the white light equivalent image and the oxygen saturation Images can be displayed so that users can easily compare them.
- Specific example (3) differs from specific example (1) and specific example (2) in that a plurality of regions of interest are set in a white light image in normal mode. Further, a region of interest setting instruction is input by operating the mode switching switch 12c instead of the region of interest setting switch 12d.
- a region of interest setting instruction is input to the extended processor device 16 using the operation of the mode switching switch 12c as a trigger, and the region of interest setting section 210 sends the endoscopic image to the white light image to the display control section 200 of the processor device.
- An instruction signal to display a region of interest image on a display serving as a first user interface is transmitted.
- a region of interest image 214 in which the endoscopic image is a white light image is displayed on the display which is the first user interface 15, and what is displayed on the display which is the second user interface 17. (The diagonal line indicates that nothing is displayed). Note that in the example shown in FIG. 52, nothing is displayed on the display that is the second user interface 17, but the white light equivalent image 201 or the oxygen saturation image 202 may be displayed. Furthermore, in this case, a region of interest is set on the white light image almost simultaneously with the mode switching.
- the flow from the setting of the region of interest on the white light image to the generation of the display image is the same as that of the specific example (1), so a detailed explanation will be omitted. A brief explanation will be given below.
- the positions of the plurality of regions of interest set on the white light image are each stored in the region position information storage unit 240 as region position information.
- the region of interest image 211 in which the region of interest is displayed on the white light image is displayed on the display
- the region of interest setting switch 12d is operated, a biometric index value is calculated based on the image signal in the region of interest. be done.
- the region index value calculation unit 250 calculates a region index value based on the biometric index value in the region of interest.
- the index value display table generation unit 260 uses the calculated region index values for each region of interest to generate an index value display table that summarizes the plurality of region index values.
- the display image generation unit 270 generates a white light image on which the area position information is superimposed and a display image for displaying the index value display table.
- a display image 275 is displayed on the display that is the first user interface 15, and nothing is displayed on the display that is the second user interface 17.
- region position information 276a, 276b, and 276c indicating the position of the set region of interest is superimposed and displayed on a region of interest image 214 in which the endoscopic image is a white light image.
- an index value display table 265 that collectively displays region index values for the regions of interest set in the region of interest image 214. Note that in the example shown in FIG. 53, nothing is displayed on the display that is the second user interface 17, but the white light equivalent image 201 or the oxygen saturation image 202 may be displayed.
- the image in which the region of interest is displayed is the oxygen saturation image (specific example (1)), a white light equivalent image (specific example (2)), or a white light image (specific example (3)).
- the special light image may be a special light image photographed using reflected light obtained by irradiating the subject with special light other than the first illumination light, the second illumination light, and the third illumination light.
- an endoscopic image that displays region position information i.e., the background of the region of interest image
- the white light image or special light image may be an image generated based on an image signal acquired in real time, or may be a still image generated based on an image signal acquired immediately before mode switching. It's okay.
- the first illumination light is used as the illumination light emitted in the oxygen saturation mode.
- white light or special light is added. Accordingly, the light emission pattern in the oxygen saturation mode (see FIG. 15) is changed so that an illumination period in which white light or special light is emitted is provided.
- a display image may be displayed without displaying a region of interest image on the display.
- a display image may be displayed in the oxygen saturation mode, when the white light equivalent image 201 and the oxygen saturation image 202 are displayed as shown in FIG. 7, by operating the region of interest setting switch 12d (as shown in FIG. The display image may be displayed in a display mode as shown in FIG. 50 or FIG. 51 without going through the display mode as shown in FIG.
- region index values regarding multiple types of biometric index values may be calculated and an index value display table may be generated. For example, when calculating oxygen saturation and hemoglobin index as biological index values, as shown in FIG .
- An index value display table may be generated that displays a polygonal spark line 266 (indicated by a broken line) whose value is a hemoglobin index (HbI).
- an index value display table that displays regional index values related to multiple regions of interest
- users can see spatial changes in the real values of biometric index values in the endoscopic image being observed. Can be notified.
- An index value display table that displays all of these real values can present more reliable information to the user in a way that is easier to compare than when changes in biological index values are displayed only by color tone. It is possible.
- the endoscope 12 generates an image signal by photographing reflected light from a subject (ST101).
- the image signal acquisition unit 60 of the processor device 14 acquires the image signal generated by the endoscope 12 (ST102).
- the endoscopic image generation section 70 of the processor device 14 and/or the oxygen saturation image generation section 130 of the extended processor device 16 generates an endoscopic image based on the image signal (ST103).
- the region of interest setting unit 210 sets a plurality of regions of interest in the endoscopic image (ST104).
- the positions of the plurality of regions of interest in the endoscopic image are each stored in the region position information storage unit 240 as a plurality of region position information (ST105).
- biometric index values are calculated based on the image signals in each region of interest (ST106).
- the region index value calculation unit 250 calculates a region index value for each region of interest based on the biometric index value in each region of interest (ST107).
- the index value display table generation unit 260 generates an index value display table that collectively displays a plurality of area index values (ST108).
- the display image generation unit 270 generates a display image that displays an endoscopic image on which a plurality of area position information are superimposed and an index value display table (ST109).
- the extended display control unit 200 performs control to display the display image (ST110). As a result, the display image is displayed on the display that is the user interface.
- a plurality of regions of interest may be displayed together as one region of interest for display.
- a region of interest for display 212d as shown in FIG. 56 may be displayed. good.
- the display region of interest 212d shown in FIG. 56 includes a plurality of regions of interest 212a, 212b, and 212c, but the broken lines indicate that these are not actually displayed.
- region index values are calculated for each of the plurality of regions of interest 212a, 212b, and 212c.
- the display image includes display area position information such that the endoscopic image 211 includes area position information 272a, 272b, and 272c indicated by broken lines, which are not actually displayed. 272d is displayed.
- the apparent amount of information included in the display image can be reduced and the visibility of the display image can be improved.
- the symbol of the polygonal spark line 262 and the leader line are omitted.
- the reference numerals and leader lines of the polygonal spark line 262 are omitted to make the figures easier to read.
- an area index value storage section 280 may be further provided.
- the region index value storage unit 280 stores a specific region in which the region position information and the region index value are associated. It is preferable that the index value is stored and that the specific region index value is held and displayed in the index value display table of the display image.
- the region index values are calculated only once after the biometric index values are calculated.
- the region index value calculation unit 250 calculates a region index value for each region of interest based on the biometric index value in each region of interest (see ST106 and ST107 in FIG. 55). , and the area position information as a specific area index value, which is stored in the area index value storage unit 280.
- the area index value storage unit 280 may be included in the extended processor device 16 or may be a storage outside the extended processor device 16.
- the index value display table generation unit 260 generates an index value display table that collectively displays the specific area index values calculated for each region of interest, and the display image generation unit 270 generates an index value display table in which the specific area index values are displayed. Generate a display image that displays the index value display table. In this case, the specific area index value of the display image displayed on the user interface by the extended display control unit 200 is held and displayed as a fixed value.
- the user can watch the index value display table and display multiple region indexes. You can compare the values.
- the region index value calculation unit 250 calculates a region index value for each region of interest based on the biometric index value in each region of interest (see ST106 and ST107 in FIG. 55).
- the index value display table generation unit 260 generates an index value display table that collectively displays the specific region index values calculated for each region of interest (see ST108 in FIG. 55).
- the index value display table generation unit 260 generates an index value display table that reflects the newly calculated latest region index value every time a region index value is calculated, thereby displaying the index value display table on the index value display table. Update each of the multiple area index values.
- FIG. 59 shows a specific example of the display image 271 when updating the area index values displayed on the index value display table 261.
- the index value display table generation unit 260 converts the polygonal spark line 267 (indicated by a dashed line in FIG. 59) generated at a previous point in time to a point in time at a later point in time.
- the polygonal spark line 268 (indicated by a solid line in FIG. 59) generated in FIG.
- region index values are calculated in time series in a region of interest indicated by region position information 272a.
- region position information 272a For example, when illumination light is emitted in the oxygen saturation mode light emission pattern, as shown in FIG. 60, a first time point area index value 252a, a second time point area index value 252b, and a third time point area index value 252c are calculated in time series for each "1 Set").
- the index value display table generation unit 260 generates a first time point region index value 252a, a second time point region index value 252b, a third time point region index value 252c, and a new region index value in the region of interest indicated by the region position information 272a.
- the index value display table is generated to be updated every time it is calculated.
- index value display table By updating and displaying the index value display table, it is possible to show the user the area index values that are updated almost in real time.
- the user can check the actual values of biometric index values at multiple locations almost in real time in scenes where blood flow changes significantly, such as during or immediately after a procedure.
- the area index value is calculated for each frame set, but the frame set for which the area index value is calculated can be set arbitrarily. For example, in one frame set, a region index value is calculated, in the next frame set, a region index value is not calculated, and in the next frame set, a region index value is calculated. It can be set to calculate. Further, it is preferable that whether to retain or update the area index value displayed in the display image can be set by a user operation.
- the region of interest setting unit 210 sets regions of interest at a plurality of preset different positions on the endoscopic image, and stores the region of interest once set as a lock-on area, and The lock-on area may be displayed by following the movement. Furthermore, when updating the region index value, a new region index value may be calculated for the region of interest stored as the lock-on area.
- a once-set region of interest is associated with the region position information of the region of interest, thereby storing it as lock-on area position information indicating the position of the lock-on area.
- the lock-on area position information is coordinate information of the lock-on area on the endoscopic image.
- the region of interest setting section 210 may be provided with a region position matching section (not shown), and the region of interest setting section 210 may be provided with a region position matching section (not shown) to associate the once set region of interest with the region position information of the region of interest. It's okay.
- the region of interest setting unit 210 The photographed range may deviate significantly from the initially set position that includes the region of interest. For example, in a region of interest image 211 as shown in FIG. 61(A), region index values are calculated based on image signals acquired in regions of interest 212a, 212b, and 212c.
- region index values are calculated based on image signals acquired in regions of interest 212a, 212b, and 212c.
- the endoscopic image displayed on the display changes from the region of interest image 211 as shown in FIG. Assume that the region of interest image 215 is changed as shown in (B).
- the region position information of the regions of interest 212a, 212b, and 212c shown in FIG. 61(A) is stored as lock-on area position information.
- the region of interest image 215 as shown in FIG. 61(B) the region of interest is divided from regions 212a, 212b, 212c (indicated by dashed lines) shown in FIG. (indicated by ).
- the region index value calculation unit 250 calculates the region index value based on the biometric index values in the lock-on areas 220a, 220b, and 220c.
- the region of interest 212a shown in FIG. 61(A) moves to the lock-on area 220a shown in FIG. 61(B), and the region of interest 212b shown in FIG. 61(A) moves to the lock-on area 220a shown in FIG. 61(B).
- the region of interest 212c shown in FIG. 61(A) moves to the lock-on area 220c shown in FIG. 61(B).
- the plurality of regions of interest 212a, 212b, and 212c are each stored in the region position information storage unit 240 as lock-on area position information that is the position of the plurality of lock-on areas 220a, 220b, and 220c.
- the amount of movement from the regions of interest 212a, 212b, 212c shown in FIG. 61(A) to the lock-on areas 220a, 220b, 220c shown in FIG. 61(B) is determined by the amount of movement, rotation amount, and observation magnification of the endoscope 12. Calculated based on the rate of change, etc. Note that when lock-on area position information is not stored, area index values are calculated based on biometric index values in areas 212a, 212b, and 212c also in FIG. 61(B). Therefore, when attempting to move the endoscope 12 significantly, the once set region of interest is stored as a lock-on area, and the region index value is calculated by following the movement of the endoscope 12. be able to.
- the endoscopic image displayed in the display image changes from the region of interest image 211 shown in FIG. 61(A) to that shown in FIG. 61(B) as the endoscope 12 is operated.
- the region of interest image 215 is changed to display the lock-on areas 220a, 220b, and 220c.
- a display lock-on area 220d including a plurality of lock-on areas 220a, 220b, and 220c as shown in FIG. 62(B) is displayed.
- the endoscopic image displayed on the display is switched from a distant view image to a near view image, or from a close view image to a distant view image.
- the distant view image is an endoscopic image observed at a low magnification suitable for observation of a wide range.
- the foreground image is an endoscopic image observed at a high magnification suitable for observing fine structures.
- the initially set position of the region of interest and the position where you want to actually calculate the region index value may deviate. be. Therefore, by setting the initially set region of interest as the lock-on area, even if the endoscope 12 moves, the region index value in the initially set region of interest can be calculated.
- a lock-on area storage instruction is input by operating a lock-on area setting switch (not shown), and the lock-on area position information is stored. It is preferable.
- the area index value (lock-on area index value) calculated based on the image signal in the lock-on area is associated with the lock-on area position information, so that the lock-on area position information and the lock-on area index value are Preferably, it is stored as an associated specific lock-on area index value.
- the specific lock-on area index value is stored in the area index value storage section 280. Further, the specific lock-on area index value is stored for each of the plurality of lock-on areas.
- the specific lock-on area index value may be stored only once, or may be updated every time the lock-on area index value is calculated.
- each time a region index value in a lock-on area is calculated it is associated with time-series data showing the time series, and each specific lock-on area index value is stored as information that can determine when it was calculated. good.
- the lock-on area index value (in this case, the specific lock-on area index value) to be displayed on the index value display table of the display image can be changed to the lock-on area index calculated once. Values can be held and displayed. Further, each time the lock-on area index value is calculated, the lock-on area index value (in this case, the specific lock-on area index value) displayed on the index value display table of the display image can be updated.
- the lock-on area When observing endoscopic images in real time during examinations, surgeries, etc., the lock-on area may no longer be included in the endoscopic image being observed due to operations such as moving the endoscope 12 or changing observation magnification. There is. In this way, when the position of the lock-on area is outside the field of view, which is a position that is not included in the endoscopic image being observed, the lock-on area index value in the lock-on area that is outside the field of view is It is preferable to continue displaying the index value display table of the display image.
- the index value display table generation unit 260 sets the specific lock-on area index value stored immediately before the position of the lock-on area becomes the out-of-field position as the out-of-field lock-on area index value, and Generate an index value display table that displays area index values.
- FIG. 63(A) shows a display image 271 before the endoscope 12 is moved.
- an index value display table 261 is displayed that displays region index values calculated in three lock-on areas displayed as region position information 272a, 272b, and 272c.
- FIG. 63(B) shows the display image 271 after the endoscope 12 has been moved.
- FIG. 63(B) due to the movement of the endoscope 12, the position of the lock-on area that was displayed as the area position information 272a has become a position outside the field of view. Therefore, in FIG. 63(B), two lock-on areas are displayed as area position information 272b and 272c.
- the area index value of the lock-on area displayed as the area position information 272a is stored as the out-of-field lock-on area index value.
- the index value display table generation unit 260 generates an index value display table 261 that displays the out-of-field lock-on area index value 281.
- the extended display control unit 200 controls displaying a display image that displays an index value display table 261 that displays an out-of-field lock-on area index value 281, which is generated by a display image generation unit 270.
- a display image as shown in 63(B) is displayed.
- the region of interest setting unit 210 When the out-of-field lock-on area index value is displayed in the display image as shown in FIG. 63(B), the region of interest setting unit 210 performs An additional region of interest 277 as shown in FIG. 64 is set.
- the additional region of interest 277 in the example of the display image shown in FIG. 64 is, to be precise, region position information of the additional region of interest 277 that is displayed superimposed on the display image.
- the additional region of interest 277 is preferably a lock-on area.
- the region position information of the additional region of interest 277 is stored in the set region position information storage unit 240.
- the region index value calculation unit 250 calculates an additional region index value as a statistical value of the biometric index value calculated based on the image signal in the additional region of interest 277.
- the additional region index value is a region index value that is a statistical value of the biometric index value calculated based on the image signal in the additional region of interest 277.
- the index value display table generation unit 260 generates an out-of-field lock-on area index value 281, area index values 282a and 282b of each of the two lock-on areas displayed as area position information 272b and 272c, and an additional area index value 283.
- An extended index value display table 269 is generated, which is an index value display table that collectively displays the following.
- the extended display control unit 200 controls displaying the display image for displaying the extended index value display table 269 generated by the display image generation unit 270, thereby creating a display image 271 as shown in FIG. indicate.
- the extended index value display table is an index value display table that displays additional area index values, and is one form of an "index value display table.”
- the extended index value display table may hold and display additional area index values that have been calculated once, or may be updated and displayed each time an additional area index value is calculated.
- one additional region of interest 277 is newly set, but by setting a plurality of additional regions of interest and calculating a region index value for each additional region of interest, may be additionally displayed on the index value display table.
- the additional region of interest by setting the additional region of interest and displaying the additional region index value, information on a wide range of the subject can be presented to the user. Furthermore, rather than setting an additional region of interest, displaying the additional region index value in addition to the out-of-field lock-on area index value calculated chronologically earlier allows the user to view a wider area of the subject. information can be presented.
- an index value link line is displayed that connects the area position information displayed in the display image and the area index values corresponding to these area position information. It is preferable to do so.
- the display image generation section 270 is provided with an index value link line generation section 290. An example of displaying the index value link line will be described below with reference to FIG. 66.
- index value link lines 291a, 291b, and 291c are displayed in the display image 271 illustrated in FIG. 64.
- the index value link line 291a is displayed to connect the region index value 282a and the region position information 272b.
- the index value link line generation unit 290 associates the area index value 282a (lock-on area index value) and area position information 272b (lock-on area position information) stored in the area index value storage unit 280. By reading, an index value index value link line 291a connecting these is generated, and the extended display control unit 200 is controlled to perform display control.
- the index value link line 291b is an index value link line that connects the region index value 282b and the region position information 272c.
- the index value link line 291c is an index value link line that connects the additional region index value 283 and the additional region of interest 277 displayed as region position information.
- the index value link line 291b and the index value link line 291c are generated by the index value link line generation unit 290 based on the correspondence stored in the area index value storage unit 280, similarly to the index value link line 291a.
- the region index value and region position information can be displayed. It is possible to display the correspondence relationship with the user in a manner that the user can easily understand. Particularly when there are many region index values displayed on the index value display table, visibility of information that helps determine a region suitable for incision can be improved.
- the index value link line is not displayed in the region index value 281, which is the out-of-field lock-on area index value. This is to allow the user to easily understand that the position of the lock-on area corresponding to the area index value 281 is outside the field of view.
- the extended display control unit 200 may change the display size of the index value display table displayed in the display image.
- “Change in display size” includes a change in which the index value display table is enlarged or reduced while maintaining the aspect ratio, and a change in which the index value display table is enlarged or reduced without maintaining the aspect ratio. Changes that enlarge or reduce the index value display table without maintaining the aspect ratio include changes that increase or decrease the distance between adjacent area index values displayed on the index value display table.
- FIG. 67 shows an enlarged index value display table 269a that is obtained by reducing the enlarged index value display table 269 displayed in the display image 271 shown in FIG. 66 by reducing the distance between adjacent area index values. .
- the display size of the index value display table by changing the display size of the index value display table, the visibility of the index value display table can be improved.
- the display range of the index value display table can be made small when other information is desired to be displayed on the display image.
- the control for changing the display size of the index value display table in the display image may be performed through an operation input by the user, or may be performed automatically.
- FIG. 66 shows an example in which an index value link line is displayed in a display image in which an out-of-field lock-on area index value and an additional region of interest are displayed.
- the value and the additional region of interest may be displayed in a display image that is not displayed. A specific example will be explained below.
- index value link line For example, when displaying the index value link line in the display image 271 illustrated in FIG. 49, the display image 271 as illustrated in FIG. 68 is displayed on the display. In the example of the display image shown in FIG. 68, index value link lines 292a, 292b, and 292c are displayed in the display image 271 shown in FIG. 49.
- the index value link line 292a is an index value link line that connects the region index value 284 and the region position information 272a.
- the index value link line 292b is an index value link line that connects the region index value 282b and the region position information 272b.
- the index value link line 292c is an index value link line that connects the region index value 282b and the region position information 272c.
- the index value link line 292a, index value link line 292b, and index value link line 292c are generated by the index value link line generation unit 290 based on the correspondence stored in the area index value storage unit 280.
- the area index value 284 and area position information 272a, the area index value 282b and area position information 272b, and the area index value 282b and area position information 272c are associated with each other, and the area index It is stored in the value storage section 280.
- the area position information 272a, the area position information 272b, and the area position information 272c are lock-on area position information
- the area index value 284, the area index value 282b, and the area index value 282b are lock-on area index values.
- the area position information 272a (lock-on area position information) is set to an out-of-field position by moving the endoscope 12, an out-of-field lock as shown in FIG.
- a display image 271 that displays an extended index value display table 269 that displays on-area index values 281 is displayed.
- the index value link line 292a displayed in FIG. 68 is not displayed in the display image 271 shown in FIG. 69.
- An enlarged index value display table 269b which is a reduced version of the enlarged index value display table 269a, as shown in 70, is displayed on the display image 271.
- Display area position information 272d indicated by a solid line may be displayed, including two or more display area position information 272d.
- the display mode of the display area position information 272d is changed. It is preferable to change.
- an additional region of interest may be additionally set even in a display image in which an out-of-field lock-on area index value is not displayed.
- the out-of-field lock-on area index value is not displayed in the index value display table of the display image, but only the area index value stored in association with the area position information displayed in the display image is displayed. It may also be displayed. A specific example will be explained below.
- the area position information 272a, 272b (lock-on area position information) is set to a position outside the field of view, and as shown in FIG.
- the information 272c (lock-on area position information) is displayed in the display image
- only the area index value 282b associated with the area position information 272c is displayed in the index value display table 261 of the display image 271. It's okay.
- the region of interest setting unit 210 sets an additional region of interest 278a as shown in FIG. , 278b.
- the region of interest setting unit 210 sets an additional region of interest 278a as shown in FIG. , 278b.
- two additional regions of interest are set in advance.
- the number of additional regions of interest to be set may be arbitrarily set, and may be one, three or more.
- the additional regions of interest 278a and 278b in the example of the display image shown in FIG. 75 are, to be exact, region position information of the additional regions of interest 278a and 278b that are superimposed and displayed on the display image.
- the region position information of the additional regions of interest 278a and 278b is stored in the region position information storage unit 240.
- the region index value calculation unit 250 calculates additional region index values 285a and 285b as statistical values of biometric index values calculated based on the image signals in the additional regions of interest 278a and 278b (see FIG. 76).
- the additional region index value 285a is a region index value calculated based on the image signal in the additional region of interest 278a.
- the additional region index value 285b is a region index value calculated based on the image signal in the additional region of interest 278b.
- the index value display table generation unit 260 summarizes the region position information 272c, the region index value 282b, and the additional region index values 285a and 285b of the two lock-on areas displayed as the additional region of interest 278a and the additional region of interest 278b.
- An extended index value display table 269 is generated, which is an index value display table to be displayed.
- the extended display control unit 200 controls displaying the display image for displaying the extended index value display table 269 generated by the display image generation unit 270, thereby creating a display image 271 as shown in FIG. indicate. Note that the index value link line may also be displayed in the display image 271 as shown in FIG. 76.
- FIG. 76 shows an example of displaying the extended index value display table 269 that displays the region index value 282b and the additional region index values 285a and 285b together
- the index value that displays the region index value 282b The display table and the index value display table that displays the additional area index values 285a and 285b may be displayed separately as a plurality of different index value display tables.
- Display area position information 278c indicated by a solid line may be displayed, including two or more display area position information 278c. Note that, as shown in FIGS. 78 and 79, when an additional region of interest is set, it is preferable to change the display mode of the display region position information 278c.
- the light source section 20 is replaced with a broadband light source 400 that emits broadband light such as a white LED, a xenon lamp, or a halogen light source, instead of the LEDs 20a to 20e of each color shown in the first embodiment.
- a broadband light source 400 that emits broadband light such as a white LED, a xenon lamp, or a halogen light source, instead of the LEDs 20a to 20e of each color shown in the first embodiment.
- the rotating filter 410 the light emitted from the light source device 13 is used as illumination light for illuminating the subject.
- the light source device 13 of the endoscope system 10 is provided with a broadband light source 400, a rotary filter 410, and a filter switching section 420.
- the filter switching section 420 is controlled by the light source control section 21.
- the other configurations are the same as the endoscope system 10 of the first embodiment.
- the image sensor 44 is a monochrome image sensor.
- the broadband light source 400 emits broadband light having a wavelength band ranging from blue to red.
- the broadband light is, for example, white light.
- the rotary filter 410 includes an inner filter 411 provided on the inside and an outer filter 412 provided on the outside.
- the filter switching section 420 moves the rotary filter 410 in the radial direction. In the normal mode, the filter switching unit 420 inserts the inner filter 411 of the rotating filter 410 into the optical path of white light. Furthermore, in the case of the oxygen saturation mode or the correction mode, the filter switching unit 420 inserts the outer filter 412 of the rotating filter 410 into the optical path of the white light.
- the inner filter 411 includes, along the circumferential direction, a B1 filter 411a that transmits the wavelength band of the violet light V of the white light and the wavelength band of the second blue light BS, and the green light G of the white light.
- a G filter 411b that transmits the wavelength band of the red light R and an R filter 411c that transmits the wavelength band of the red light R among the white light are provided. Therefore, in the normal mode, the illumination light having the wavelength band of the violet light V and the second blue light BS, the illumination light having the wavelength band of the green light G, and the illumination light having the wavelength band of the red light R are transmitted to the rotating filter 410.
- the light is emitted from the light source device 13 in accordance with the rotation of the light source.
- the outer filter 412 includes, along the circumferential direction, a B1 filter 412a that transmits a first blue light BL having a wavelength band B1 among the white light, and a second blue light BL among the white light.
- a B2 filter 412b that transmits light in a wavelength band that the BS has, a G filter 412c that transmits green light G that has a wavelength band G2 among white light, and an R filter that transmits red light R that has a wavelength band R2 among white light.
- 412d and a B3 filter 412e that transmits blue-green light BG, which is light in wavelength band B3 of white light (see FIGS. 21 and 22).
- the illumination light having the wavelength bands of the first blue light BL, the second blue light BS, the green light G, the red light R, and the blue-green light BG is caused by the rotation of the rotary filter 410. Together, they are emitted from the light source device 13.
- the endoscope system 10 uses a monochrome image sensor to capture reflected light obtained by illuminating a subject with illumination light having wavelength bands of the violet light V and the second blue light BS.
- a Bc image signal is output.
- a Gc image signal is output.
- an Rc image signal is output.
- a white light image is generated based on the Bc image signal, Gc image signal, and Rc image signal by the same method as in the first embodiment.
- the B1 image signal is obtained by photographing the reflected light obtained by illuminating the subject with illumination light having the wavelength band of the first blue light BL using a monochrome image sensor. Output. Further, a B2 image signal is output by photographing reflected light obtained by illuminating a subject with illumination light having a wavelength band of the second blue light BS using a monochrome image sensor. Further, by photographing reflected light obtained by illuminating a subject with illumination light having a wavelength band of green light G using a monochrome image sensor, a G2 image signal is output.
- an R2 image signal is output.
- a B3 image signal is output by photographing reflected light obtained by illuminating a subject with illumination light having a wavelength band of blue-green light BG using a monochrome image sensor.
- the extended processor device 16 Based on the B1 image signal, B2 image signal, G2 image signal, R2 image signal, and B3 image signal transmitted from the processor device 14, the extended processor device 16 generates an oxygen saturation image using the same method as in the first embodiment. is generated, and correction processing is also performed.
- the signal ratio ln(B3/G3) instead of the signal ratio ln(B3/G3), a signal ratio ln(B3/G2) obtained by normalizing the B3 image signal with the G2 image signal is used.
- the oxygen saturation calculation table corresponding to the specific dye concentration is selected, and the oxygen saturation calculation table is selected.
- a table correction process may be performed using the selected oxygen saturation calculation table 110 as the oxygen saturation calculation table 110 as shown in FIG.
- Calculated value correction processing may be performed to add or subtract a correction value obtained from .
- a correction value used for correcting oxygen saturation is calculated by referring to a two-dimensional coordinate system 430 shown in FIG.
- the vertical axis of the two-dimensional coordinate system 430 is a specific calculation value obtained based on the B1 image signal, G2 image signal, R2 image signal, and B3 image signal, and the horizontal axis is ln(R2/G2).
- the specific calculation value is determined by the following formula A).
- a reference line 431a indicating a distribution of predetermined reference baseline information and an actual measurement line 431b indicating a distribution of actually measured baseline information obtained by photographing an actual observation target are shown.
- a difference value ⁇ Z between the reference line 431a and the measured line 431b is calculated as a correction value.
- the reference baseline information is determined as information that is obtained in the absence of a specific dye and does not depend on oxygen saturation.
- the reference baseline information is a value obtained by adjusting ⁇ in formula A) so that it remains constant even if the oxygen saturation changes.
- the three-dimensional coordinates 121 shown in FIG. 34 may be referred to.
- the Z axis of the three-dimensional coordinates 121 shown in FIG. 34 is set to the signal ratio ln(B3/G2), and the signal ratio ln(B3/G2) is used as the value of the Z component. .
- the endoscope 12 is a rigid endoscope that includes a camera head 500 at the proximal end portion of the insertion portion 12a, as shown in FIG.
- the camera head 500 is equipped with an imaging optical system 43.
- an imaging optical system 43 having an objective lens 43a and an image sensor 44 is provided at the distal end of the endoscope 12, but in the third embodiment, an imaging optical system 43 is provided at the distal end of the endoscope 12. 43, an image sensor is provided in the camera head 500, not in the tip.
- the camera head 500 photographs reflected light guided from the distal end of the endoscope 12.
- the image signal captured by camera head 500 is transmitted to processor device 14 .
- the mode switching switch 12c and the region of interest setting switch 12d are omitted.
- parts that are different from the first embodiment and the second embodiment will be described, and descriptions of common parts will be omitted.
- the light source device 13 emits white light including violet light V, second blue light BS, green light G, and red light R in the normal mode. Further, in the case of the oxygen saturation mode and the correction mode, the light source device 13 provides illumination that is a mixed light including a first blue light BL, a second blue light BS, a green light G, and a red light R as shown in FIG. Emits light.
- the camera head 500 includes dichroic mirrors 501, 502, and 503, and image sensors 511, 512, 513, and 514 that are monochrome image sensors.
- the dichroic mirror 501 reflects light in the wavelength band of the violet light V and the second blue light BS among the reflected light from the subject, and reflects the light in the wavelength band of the first blue light BL, the green light G, and the red light R. Transmits light in the band.
- the light reflected by the dichroic mirror 501 and incident on the image sensor 511 has a wavelength band of violet light V or second blue light BS, as shown in FIG.
- the image sensor 511 outputs a Bc image signal in the normal mode, and outputs a B2 image signal in the oxygen saturation or correction mode.
- the dichroic mirror 502 reflects light in the wavelength band of the first blue light BL, and transmits light in the wavelength band of the green light G and red light R.
- the light reflected by the dichroic mirror 502 and incident on the image sensor 512 has a wavelength band of the first blue light BL, as shown in FIG. 87.
- the image sensor 512 stops outputting an image signal in normal mode, and outputs a B1 image signal in oxygen saturation mode or correction mode.
- the dichroic mirror 503 reflects the light in the wavelength band of the green light G, and transmits the light in the wavelength band of the red light R.
- the light reflected by the dichroic mirror 503 and incident on the image sensor 513 has a wavelength band of green light G, as shown in FIG.
- the image sensor 513 outputs a Gc image signal in normal mode, and outputs a G2 image signal in oxygen saturation or correction mode.
- the light that passes through the dichroic mirror 503 and enters the image sensor 514 has a wavelength band of red light R, as shown in FIG.
- the image sensor 514 outputs an Rc image signal in normal mode, and outputs an R2 image signal in oxygen saturation mode or correction mode.
- the Bc image signal, Gc image signal, and Rc image signal are used in the normal mode, and the B1 image signal, B2 image signal, G2 image signal, and R2 image signal are used in the oxygen saturation mode or correction mode.
- the Bc image signal, Gc image signal, and Rc image signal output from the camera head are acquired by the image signal acquisition unit 60 of the processor device 14, and transmitted to the endoscope image generation unit 70 to generate a white light image. be done.
- the B1 image signal, B2 image signal, G2 image signal, and R2 image signal output from the camera head are acquired by the image signal acquisition unit 60 of the processor device 14.
- the B2 image signal, G2 image signal, and R2 image signal are sent to the endoscopic image generation section 70 in order to generate a white light equivalent image. Further, the B1 image signal, B2 image signal, G2 image signal, and R2 image signal are transmitted to the extended processor device 16 via the image communication unit 90 in order to generate an oxygen saturation image.
- the B1 image signal including information of the wavelength band B1 is used to calculate the oxygen saturation level, but other image signals may be used instead of the B1 image signal.
- FIG. 90 see FIG. 22(A)
- the wavelength band Rx is a wavelength band in the range of 680 nm ⁇ 10 nm.
- the Rk image signal (indicated by "Rk" in FIG.
- the camera head 500 is equipped with a dichroic mirror that allows the camera to move.
- the endoscope 12 is a rigid endoscope that includes a camera head at the proximal end portion of the insertion portion 12a.
- the fourth embodiment includes a camera head 600 as shown in FIG. 92 instead of the camera head 500 of the third embodiment.
- the camera head 600 includes a dichroic mirror 601 and image sensors 611 and 612.
- the dichroic mirror 601 reflects light in a wavelength band included in the violet light V, the second blue light BS, the green light G, and the red light R among the reflected light from the subject, and reflects the light in the wavelength band included in the first blue light BL. Transmits light in the band.
- the image sensor 611 that receives the light reflected by the dichroic mirror 601 is a color image sensor in which the B pixel is provided with a B color filter BF, the G pixel is provided with a G color filter GF, and the R pixel is provided with an R color filter RF. be. Further, the image sensor 612 that receives the light transmitted by the dichroic mirror 601 is a monochrome image sensor.
- the image sensor 611 which is a color image sensor, receives the reflected light from the subject reflected by the dichroic mirror 601, thereby generating a Bc image signal. , Gc image signal, and Rc image signal are output from the image sensor 611, respectively.
- the image sensor 612 which is a monochrome image sensor, stops outputting image signals.
- the light source device 13 emits observation illumination light (hereinafter referred to as , referred to as fourth illumination light) is emitted.
- the dichroic mirror 601 separates the reflected light from the subject illuminated with the fourth illumination light by reflecting and transmitting it.
- FIG. 93B shows the relationship between the reflectance (broken line 601a) and transmittance (solid line 601b) of light incident on the dichroic mirror 601 and the wavelength of the light.
- the image sensor 611 which is a color image sensor.
- the sensitivity of the B pixel B, the G pixel G, and the R pixel R of the image sensor 611 and the wavelength of light have a relationship as shown in FIG. 93(C). Therefore, the B pixel B of the image sensor 611 outputs a B2 image signal by sensing the light in the wavelength band B2 that the second blue light BS has. Further, the G pixel G of the image sensor 611 outputs a G2 image signal by sensing the light in the wavelength band G2 that the green light G has. Furthermore, the R pixel R of the image sensor 611 outputs an R2 image signal by sensing the light in the wavelength band R2 that the red light R has.
- the image sensor 612 which is a monochrome image sensor.
- the sensitivity of the image sensor 612 and the wavelength of light have a relationship as shown in FIG. 94(C). Therefore, the image sensor 612 outputs a B1 image signal by sensing the light in the wavelength band BL of the first blue light BL that is transmitted by the dichroic mirror 601.
- FIG. 94(A) shows the wavelength band of light included in the fourth illumination light.
- FIG. 94(B) shows the relationship between the reflectance (broken line 601a) and transmittance (solid line 601b) of light incident on the dichroic mirror 601 and the wavelength of the light. .
- a light emission pattern in which the fourth illumination light L4 is emitted is repeated once per frame F. Therefore, in the oxygen saturation mode of the fourth embodiment, a B2 image signal, a G2 image signal, and an R2 image signal are output per frame from the image sensor 611 which is a color image sensor, and the image sensor 611 which is a monochrome image sensor outputs a B2 image signal, a G2 image signal, and an R2 image signal for each frame.
- a B1 image signal is output from 612.
- the B1 image signal, B2 image signal, G2 image signal, and R2 image signal output from the image sensor 611 or the image sensor 612 in the oxygen saturation mode are transmitted to the processor device 14.
- the method of calculating biometric index values including oxygen saturation in oxygen saturation mode is the same as in the first embodiment.
- the non-emission state NL for two frames F is After that, the third illumination light L3 is emitted for two frames F, and after passing through a non-emission state NL for a plurality of frames, a light emission pattern is adopted in which the fourth illumination light L4 for two frames F is emitted.
- the frame of the non-emission state NL is a period for switching between the fourth illumination light L4 and the third illumination light, and neither illumination light is emitted.
- the light emission switching instruction may be input by operating an illumination light switching switch (not shown) provided on the endoscope 12 or the user interface, or may be input by toggling the mode changeover switch 12c.
- the B2 image signal, G2 image signal, and R2 image signal are output from the image sensor 611, and the B1 image signal is output from the image sensor 612, as in the oxygen saturation mode. A signal is output.
- the light source device 13 emits third illumination light (correction illumination light) including green light G as shown in FIG. 97(A).
- the image sensor 611 which is a color image sensor, receives the reflected light from the subject reflected by the dichroic mirror 601 (see FIG. 97(B)).
- the B pixel B of the image sensor 611 outputs a B3 image signal by sensing the light in the wavelength band B3 of the green light G.
- the G pixel G of the image sensor 611 outputs a G3 image signal by sensing light in the wavelength band G3 of the green light G. Further, the R pixel R of the image sensor 611 outputs an R3 image signal by sensing light in the wavelength band of the green light G (not shown).
- FIG. 98(A) shows the wavelength band of light included in the third illumination light.
- FIGS. 97(B) and 98(B) show the reflectance (broken line 601a) and transmittance (solid line 601b) of the light incident on the dichroic mirror 601, and the wavelength of the light. It shows the relationship between Also, FIGS. 97(C) and 98(C) show the relationship between the sensitivities of B pixel B, G pixel G, and R pixel R of the image sensor 611 and the wavelength of light, as in FIG. 93(C). It shows.
- the B1 image signal, B2 image signal, G2 image signal, and R2 image signal output from the image sensor 611 or the image sensor 612 in the oxygen saturation mode are transmitted to the processor device 14 and acquired by the image signal acquisition unit 60.
- the image signal acquisition unit 60 acquires the Bc image signal, Gc image signal, and Rc image signal acquired in the normal mode, the oxygen saturation mode, and the correction mode. Demosaic processing is performed on the B2 image signal, G2 image signal, and R2 image signal that are obtained, and the B3 image signal, G3 image signal, and R3 image signal that are obtained in the correction mode. Calculation of reliability in the fourth embodiment will be described below.
- the correction image 161 is displayed, and the reliability is calculated for each pixel included in the specific area 162 included in the correction image 161.
- the images obtained in the frame in which the fourth illumination light L4 is emitted (the white light equivalent image and the first blue light image) and the third illumination light L3 are emitted.
- the reliability is calculated for each correction area using the frame and the image (third illumination light image) obtained in the frame.
- the correction area corresponds to the specific area in the first embodiment.
- the term "correction area” refers to a "set of small areas divided into multiple parts" or "the small area itself (Nth correction area, N is a natural number of 1 or more)" as described later. used as
- the white light equivalent image is an endoscopic image generated using the B2 image signal, G2 image signal, and R2 image signal that are output in the frame in which the fourth illumination light L4 is emitted.
- the first blue light image is an endoscopic image generated using the B1 image signal output in the frame in which the fourth illumination light L4 is emitted.
- the third illumination light image is an endoscopic image generated using the B3 image signal, the G3 image signal, and the R3 image signal that are output in the frame in which the third illumination light L3 is emitted.
- the white light equivalent image and the third illumination light image are endoscopic images in which all pixels have pixel values, which are generated by performing demosaic processing in the image signal acquisition unit 60. It is. Since the first blue light image is output from the monochrome image sensor, all pixels have pixel values at the time when the image signal acquisition unit 60 acquires the B1 image signal.
- the white light equivalent image and the third illumination light image are transmitted to the feature value calculation unit 620 of the processor device 14 shown in FIG. 99.
- the feature value calculation section 620 is configured by a processor different from the central control section 50 in the processor device 14 .
- the feature amount calculation unit 620 is configured by an FPGA (Field Programmable Gate Array).
- the feature amount calculation unit 620 calculates area feature amounts for each of the plurality of correction regions shown in FIG. 100 among the white light equivalent image, the first blue light image, and the third illumination light image.
- the region feature amount will be described later.
- the correction area 622 is a small area divided into a plurality of areas in the white light equivalent image 621, as shown in FIG. In the example shown in FIG. 100, the correction area 622 has the horizontal length a of the white light equivalent image 621 set to a1, a2, and a3, and the vertical length b set to b1, b2, and b3, respectively.
- the area where the column a2 intersects the row b2 is further divided into 16 equal parts (see FIG. 100(A)).
- the position of the area to be the correction area 622 and the number of areas to be divided into the correction areas 622 are not limited to these. For example, the correction area 622 may be divided into 9 equal parts or 25 equal parts.
- FIG. 100(B) is an enlarged view of the correction area 622 shown in FIG. 100(A). As shown in FIG. 100(B), the correction area 622 is divided into 16 areas from a first correction area 622a to a sixteenth correction area 622p. In FIG. 100(B), numbers from 1 to 16 are used to indicate that the correction area 622 is divided into 16 areas, from the first correction area 622a to the 16th correction area 622p. .
- the feature value calculation unit 620 configures each correction area for each of the Nth correction areas (in the case of the example shown in FIG. 100, from the first correction area to the 16th correction area). Determine whether a pixel is a valid pixel. The determination of whether a pixel is a valid pixel is performed by setting a lower limit value and an upper limit channel threshold value for each channel (B channel, G channel, R channel) of each pixel.
- a B channel lower limit threshold and a B channel upper limit threshold are provided.
- a G channel lower limit threshold and a G channel upper limit threshold are provided.
- an R channel lower limit threshold and an R channel upper limit threshold are provided.
- the feature value calculation unit 620 calculates that, for each pixel in each correction area, the pixel values of all color channels are equal to or greater than the channel lower limit threshold of each color for the white light equivalent image, the first blue light image, and the third illumination light image. If the pixel is within the range below the channel upper limit threshold, the pixel is determined to be a valid pixel.
- the B channel pixel value of each pixel constituting the white light equivalent image and the third illumination light image is within the range of not less than the B channel lower limit threshold and less than the B channel upper limit threshold; And, if the pixel value of the G channel is within the range of the G channel lower limit threshold and less than the G channel upper limit threshold, and the R channel pixel value is within the range of the R channel lower limit threshold and less than the R channel upper limit threshold, then the pixel is determined to be a valid pixel.
- each pixel is within the range from the monochrome image channel lower limit value to the monochrome image channel upper limit value, that pixel is determined to be a valid pixel.
- the feature quantity calculation unit 620 calculates the area feature quantity for each correction area in the white light equivalent image, the third illumination light image, and the first blue light image.
- the area feature amount includes the number of effective pixels, the sum of pixel values of effective pixels, the sum of squares of pixel values of effective pixels, the variance of pixel values of effective pixels, and the like.
- the feature quantity calculation unit 620 calculates the area feature quantity for each correction area of each channel of the white light equivalent image. Furthermore, area feature amounts are calculated for each correction area of each channel of the third illumination light image. Further, a region feature amount is calculated for each correction region of the first blue light image. The area feature amount of each correction region of each channel of each endoscopic image calculated by the feature amount calculation section 620 is transmitted to the reliability calculation section 160 of the extended processor device 16.
- the reliability calculation unit 160 calculates the reliability for determining the degree of influence of disturbance in the correction area. Furthermore, the reliability calculation unit 160 calculates a second dye value for determining the degree of movement of the endoscope 12.
- the degree of movement of the endoscope 12 is the degree for determining whether or not the endoscope 12 is moved during switching of illumination light in the correction mode of the fourth embodiment (that is, the non-emission state NL). be.
- the endoscope 12 moves in the non-emission state NL, the observation target reflected in the endoscopic image also moves, so the correction process may not be performed appropriately.
- a determination regarding the movement of the endoscope 12 is made based on the degree of movement of the endoscope 12, as described later. If the degree of movement is large, the user can be notified not to move the endoscope 12. Calculation of the second dye value will be described later.
- the correction determining unit 170 of the extended processor device 16 determines the degree of influence of disturbance using the reliability and/or determines the movement of the endoscope 12 using the second pigment value. Determine the degree.
- the reliability calculation section 160 includes a region reliability calculation section 630 and a second dye value calculation section 650.
- the correction determination section 170 includes a region reliability determination section 640 and a second dye value determination section 660.
- the area reliability calculation unit 630 of the reliability calculation unit 160 performs corrections for each channel of the white light equivalent image, the first blue light image, and the third illumination light image generated from the image signal output in each frame.
- a region reliability is calculated using the region feature amount of the region.
- the area reliability includes the average value of pixel values within the correction area, the standard deviation of pixel values within the correction area, the effective pixel rate within the correction area, the reliability of the brightness within the correction area, and the correction There is a degree of reliability depending on the degree of bleeding included in the correction area, a degree of reliability depending on the degree of fat contained in the correction area, and the like. Note that the area reliability is one aspect of the "reliability" in the first embodiment.
- the average value of pixel values within the correction area is calculated using the number of pixels within the correction area and the pixel values of effective pixels within the correction area.
- the standard deviation of pixel values within the correction area is calculated using the number of pixels within the correction area and the variance of pixel values of effective pixels.
- the effective pixel rate within the correction area is calculated using the number of pixels within the correction area and the number of effective pixels.
- the reliability of the brightness within the correction area is obtained by converting the average value of the G2 image signal within the correction area (i.e., the pixel value within the correction area of the G channel of the white light equivalent image). signal value) is applied to the first reliability calculation table 763 as shown in FIG. 102, where the horizontal axis of the first reliability calculation table 163 (see FIG. 36) is the signal value of the G2 image signal. calculate.
- the signal value of the G2 image signal is preferably an average value of luminance values obtained by performing conversion processing using the G2 image signal.
- the reliability based on the degree of bleeding included in the correction area is determined by the average value of the B2 image signal, the average value of the G2 image signal, and the average value of the R2 image signal (i.e., Calculate the area average signal ratio ln(R2/G2) and area average signal ratio ln(B2/G2) using the average of pixel values in each correction area of each color channel of the white light equivalent image, and The signal ratio is applied to the second reliability calculation table 164 (see FIG. 37).
- the reliability based on the degree of fat included in the correction area is calculated based on the average value of the G2 image signal and the average value of the R2 image signal in each correction area of the white light equivalent image (i.e., the average value of the G2 image signal of the white light equivalent image).
- the calculation is performed by applying the ratio ln(B1/G2) to the third reliability calculation table 765.
- the region reliability calculated by the region reliability calculation section 630 is transmitted to the region reliability determination section 640 of the correction determination section 170 (see FIG. 101).
- the region reliability determination unit 640 performs high reliability correction for each correction region in the white light equivalent image, the first blue light image, and the third illumination light image using a preset threshold for region reliability determination. The result of the determination as to whether the region is a region for use or a region for low reliability correction is output.
- the threshold for region reliability determination may be set depending on the type of region reliability. For example, the threshold for determining the first region reliability is set for the "average value of pixel values within the correction region," and the “average value of pixel values within the correction region” is set as the threshold for determining the first region reliability. If this is the case, the correction area is determined to be a "high reliability correction area.” On the other hand, if the "average value of pixel values within the correction area" is less than the first area reliability determination threshold, the correction area is determined to be a "low reliability correction area.”
- the second area reliability determination threshold is set for the "standard deviation of pixel values within the correction area”
- the third area reliability determination threshold is set for the "effective pixel rate within the correction area.”
- the fourth region reliability determination threshold is set for the "reliability of the brightness within the correction region”
- the fifth region reliability is set for the "reliability of the degree of fat included in the correction region”. The determination thresholds are set respectively and the determination results are output.
- the area reliability determination unit 640 uses the determination result of each correction area as to whether it is a high reliability correction area or a low reliability correction area, and further determines the white light equivalent image, the first The reliability of the blue light image and the third illumination light image is determined. In this case, among all the correction areas in the white light equivalent image, the first blue light image, and the third illumination light image, the image is Output the judgment result.
- the image determination result is output by, for example, setting a threshold value for outputting the first image determination result in advance.
- the first image judgment result output threshold is set to 10 and the number of correction areas for the white light equivalent image is 16, the number of low reliability correction areas for the white light equivalent image is 10. If the value is greater than or equal to 1, an image determination result is output indicating that the reliability of the correction area as a whole is high, that is, the influence of disturbance is small and correction processing can be performed appropriately. On the other hand, if the number of low-reliability correction areas in the white light equivalent image is less than 10, the reliability of the correction areas as a whole is low, that is, the image is considered to be affected by some kind of disturbance and cannot be properly corrected. Output the judgment result.
- calculation of the area reliability and the output of the image judgment results may be performed for all the white light equivalent images, the first blue light image, and the third illumination light image, or for some of the white light equivalent images, the third illumination light image, and the third illumination light image.
- the process may be performed for the first blue light image and the third illumination light image. This is to speed up calculation processing.
- the image determination result output by the area reliability determination unit 640 is transmitted to the extended display control unit 200. It is preferable that the extended display control unit 200 changes the display mode on the display according to the image determination result. For example, when the image determination result that "the entire correction area is highly reliable" is output, the extended display control unit 200 displays a message on the display indicating that the correction process can be performed appropriately (see FIG. 41). On the other hand, if the image judgment result is that the reliability of the correction area as a whole is low, a message such as ⁇ Please operate the endoscope for correction processing'' will be displayed on the display as a warning ( (See Figure 42). Note that such a message may be displayed superimposed on the white light equivalent image displayed on the display.
- the area reliability determination unit 640 may calculate the average reliability for image determination using each correction area in the white light equivalent image, the first blue light image, and the third illumination light image.
- the average reliability for image determination is calculated, for example, by dividing the sum of the reliability of all correction areas of the white light equivalent image by the number of correction areas.
- the region reliability determination unit 640 presets the second image determination result output threshold for the image determination average reliability, and if the image determination average reliability is equal to or greater than the second image determination result output threshold, If there is, the image determination result is output as "the reliability of the correction area as a whole is high".
- the extended display control unit 200 changes the display mode on the display according to the image determination result.
- each correction area in the white light equivalent image, the first blue light image, and the third illumination light image output by the area reliability determination unit 640 is determined to be a high reliability correction area or a low reliability correction area.
- the determination result as to whether the area is a correction area is transmitted to the second dye value calculation unit 650 (see FIG. 101).
- the second dye value calculation unit 650 selects a correction area determined to be a "low reliability correction area" from among the correction areas in the white light equivalent image, the first blue light image, and the third illumination light image. It is preferable to perform an exclusion process to exclude from the calculation of the second dye value.
- the second dye value calculation unit 650 performs the exclusion process on a part of the white light equivalent image, the first blue light image, and the third illumination light image.
- each frame 651a in which the fourth illumination light L4 or the third illumination light L3 is emitted Among 651b, 651c, 651d, 651e, and 651f, a white light equivalent image 652a and a first blue light image 652b are generated based on the image signal output in frame 651b, and a first blue light image 652b is generated based on the image signal output in frame 651c.
- the white light equivalent image 652a, the first blue light image 652b, and the third illumination light image 652c are referred to as a first image set 652d.
- the white light equivalent image 653a, the first blue light image 653b, and the third illumination light image 653c are referred to as a second image set 653d.
- the second dye value calculation unit 650 preferably performs exclusion processing on the images included in the first image set 652d and the images included in the second image set 653d.
- a correction area that is determined to be a "high reliability correction area” and is not subject to exclusion processing will be referred to as an effective area.
- a correction area that is determined to be a "low reliability correction area” and is a target of exclusion processing is referred to as an exclusion area.
- the second dye value calculation unit 650 calculates that the position of each effective area and the position of each excluded area included in the first image set 652d are the white light equivalent image 652a, the first blue light image 652b, and the third illumination light image. Exclusion processing is performed to correspond between 652c and 652c.
- the excluded areas of the white light equivalent image 652a are correction areas 654d and 654h, and the correction areas other than the correction areas 654d and 654h out of the entire correction area 654 are Let the area be the valid area.
- the exclusion areas of the first blue light image 652b are set as correction areas 655d and 655h, and the correction areas other than the correction areas 655d and 655h in the entire correction area 655 are set as effective areas.
- exclusion areas of the third illumination light image 652c are defined as correction areas 656d and 656h, and correction areas other than the correction areas 656d and 656h in the entire correction area 656 are defined as effective areas.
- the second dye value calculation unit 650 performs exclusion processing on each image set using a preset exclusion processing threshold.
- the threshold for exclusion processing is set as a plurality of values so that the area reliability of each correction area can be evaluated and calculated in five levels from "1" to "5". Note that the threshold for exclusion processing is preferably set according to the type of region reliability.
- the second pigment value calculation unit 650 first calculates five levels of area determination reliability for each correction area of the white light equivalent image, the first blue light image, and the third illumination light image included in the image set. . Next, from among the corresponding correction areas of the white light equivalent image, the first blue light image, and the third illumination light image included in the image set, the correction area having the minimum area determination reliability is selected. .
- a region reliability determination threshold for determining a "high reliability correction region” or a "low reliability correction region” is applied to the correction region having the minimum region determination reliability.
- the correction area that is determined to be a low reliability correction area is set as an exclusion area.
- all the correction areas of the white light equivalent image, the first blue light image, and the third illumination light image that correspond to the correction area determined to be the "low reliability correction area” are set as exclusion areas. .
- the second dye value calculation unit 650 calculates second dye values from the first image set 652d and the second image set 653d, respectively. Hereinafter, calculation of the second dye value will be specifically explained.
- the white light equivalent image 652a, the first blue light image 652b, and the third illumination light image 652c are based on the signal values in the respective effective areas located at mutually corresponding positions.
- the region average signal ratio ln (R2/G2) as the value of the X component the region average signal ratio ln (B1/G2) as the value of the Y component
- the region average signal ratio ln (B3/G3) as the value of the Z component
- the area average signal ratio ln(R2/G2) is the average value of the R2 image signal in each effective area of the white light equivalent image 652a, and the average value of the G2 image signal in each effective area (i.e., the average value of the G2 image signal in each effective area (i.e., the white light equivalent image).
- the average pixel value in each effective region of the R channel and the average pixel value in each effective region of the G channel) are used.
- the area average signal ratio ln(B1/G2) is the average value of the B1 image signal within each effective area of the first blue light image 652b (i.e., the average of the pixel values within each effective area of the first blue light image). , the average value of the G2 image signal in each effective area of the white light equivalent image 652a.
- the area average signal ratio ln(B3/G3) is the average value of the B3 image signal in each effective area of the third illumination light image 652c, and the average value of the G3 image signal in each effective area (i.e., the average value of the G3 image signal in each effective area) It is calculated using the average of pixel values in each effective area of the B channel and the average of pixel values in each effective area of the G channel of the optical image.
- the second pigment value calculation unit 650 calculates a region average signal ratio ln(R2/G2), a region average signal ratio ln(B1/G2), and a region average signal ratio calculated for each corresponding effective region of the first image set 652d.
- ln(B3/G3) is calculated by referring to the corrected oxygen saturation calculation table 120 (see FIG. 29(A)).
- the corrected oxygen saturation calculation table 120 has a three-dimensional structure with the signal ratio ln(R2/G2) as the X axis, the signal ratio ln(B1/G2) as the Y axis, and the signal ratio ln(B3/G3) as the Z axis. In the coordinate system, curved surfaces CV0 to CV4 are distributed according to the concentration of the yellow dye.
- the second dye value calculation unit 650 calculates a second dye value for each effective area of the first image set 652d. Similarly, the second dye value of the second image set 653d is also calculated for each effective area.
- the second dye value calculated for each effective area of the first image set 652d and the second dye value calculated for each effective area of the second image set 653d are calculated by the second dye value judgment unit of the correction judgment unit 170. 660. Furthermore, the X component value, Y component value, and Z component value calculated for each effective area of the first image set 652d, and the X component value, Y component value calculated for each effective area of the second image set 653d. It is preferable to send the component value and the Z component value to the second dye value determination section 660.
- the second dye value determination unit 660 calculates the second dye value 661 calculated for each effective area of the first image set 652d and the second dye value 661 calculated for each effective area of the second image set 653d.
- a correlation coefficient 663 with the second dye value 662 is determined.
- the second dye values 661 and 662 calculated for each effective area are plotted, the vertical axis is the second dye value, and the horizontal axis is the correction area number (i.e., the correction area number assigned to the effective area). The number “N” of the N correction area) is shown.
- the second dye value determination unit 660 determines that "the degree of movement of the endoscope is large.” On the other hand, if the correlation coefficient is larger than the motion determination threshold, it is determined that "the degree of movement of the endoscope is small”. In this case, the second dye value determination unit 660 outputs a determination result of "the degree of movement of the endoscope is large” or "the degree of movement of the endoscope is small” as a motion determination result, and controls the extended display. 200.
- the extended display control unit 200 changes the display mode on the display according to the motion determination result. For example, when the motion determination result that "the degree of movement of the endoscope is small" is output, the extended display control unit 200 displays a message on the display indicating that the correction process can be performed appropriately (see FIG. 41). On the other hand, if the motion determination result that "the degree of endoscope movement is large” is output, a message MS4 such as "Please hold the endoscope still for correction processing" as shown in FIG. 107 is output. Displayed on the display as a warning message. Note that such a message may be displayed superimposed on the white light equivalent image 201.
- the movement of the endoscope 12 may increase during the switching. In such a case, it may not be possible to appropriately perform correction processing depending on the influence of the density of the specific dye. Therefore, by determining the degree of movement of the endoscope 12 and notifying the user if the degree of movement is large, the user can be urged not to move the endoscope 12. As a result, when the degree of movement of the endoscope 12 is reduced, correction processing can be performed appropriately.
- the correction process may be performed by determining the first dye value using the area average signal ratio in the correction area determined to be the ⁇ degree correction area''.
- the hardware structure of a processing unit that executes various processes, such as the index value link line generation unit 290, is the following various processors.
- processors include CPUs (Central Processing Units), which are general-purpose processors that execute software (programs) and function as various processing units, and programmable processors, which are processors whose circuit configuration can be changed after manufacturing, such as FPGAs.
- CPUs Central Processing Units
- programmable processors which are processors whose circuit configuration can be changed after manufacturing, such as FPGAs.
- logic devices Programmable Logic Devices: PLDs
- dedicated electric circuits that are processors with circuit configurations specifically designed to execute various types of processing, and the like.
- One processing unit may be composed of one of these various types of processors, or may be composed of a combination of two or more processors of the same type or different types (for example, multiple FPGAs or a combination of a CPU and an FPGA). may be done. Further, the plurality of processing units may be configured with one processor. As an example of configuring multiple processing units with one processor, first, as typified by computers such as clients and servers, one processor is configured with a combination of one or more CPUs and software, There is a form in which this processor functions as a plurality of processing units. Second, there are processors that use a single IC (Integrated Circuit) chip, such as System On Chip (SoC), which implements the functions of an entire system that includes multiple processing units. be. In this way, various processing units are configured using one or more of the various processors described above as a hardware structure.
- SoC System On Chip
- the hardware structure of these various processors is, more specifically, an electric circuit (circuitry) in the form of a combination of circuit elements such as semiconductor elements.
- the hardware structure of the storage unit is a storage device such as an HDD (hard disk drive) or an SSD (solid state drive).
Landscapes
- Health & Medical Sciences (AREA)
- Life Sciences & Earth Sciences (AREA)
- Physics & Mathematics (AREA)
- Surgery (AREA)
- Engineering & Computer Science (AREA)
- Medical Informatics (AREA)
- Public Health (AREA)
- Biophysics (AREA)
- Biomedical Technology (AREA)
- Heart & Thoracic Surgery (AREA)
- Pathology (AREA)
- Molecular Biology (AREA)
- Veterinary Medicine (AREA)
- Animal Behavior & Ethology (AREA)
- General Health & Medical Sciences (AREA)
- Optics & Photonics (AREA)
- Nuclear Medicine, Radiotherapy & Molecular Imaging (AREA)
- Radiology & Medical Imaging (AREA)
- Spectroscopy & Molecular Physics (AREA)
- Signal Processing (AREA)
- Astronomy & Astrophysics (AREA)
- General Physics & Mathematics (AREA)
- Endoscopes (AREA)
Priority Applications (2)
| Application Number | Priority Date | Filing Date | Title |
|---|---|---|---|
| JP2024540289A JPWO2024034253A1 (https=) | 2022-08-12 | 2023-06-13 | |
| US19/048,953 US20250176876A1 (en) | 2022-08-12 | 2025-02-09 | Endoscope system and method for operating the same |
Applications Claiming Priority (2)
| Application Number | Priority Date | Filing Date | Title |
|---|---|---|---|
| JP2022-129056 | 2022-08-12 | ||
| JP2022129056 | 2022-08-12 |
Related Child Applications (1)
| Application Number | Title | Priority Date | Filing Date |
|---|---|---|---|
| US19/048,953 Continuation US20250176876A1 (en) | 2022-08-12 | 2025-02-09 | Endoscope system and method for operating the same |
Publications (1)
| Publication Number | Publication Date |
|---|---|
| WO2024034253A1 true WO2024034253A1 (ja) | 2024-02-15 |
Family
ID=89851329
Family Applications (1)
| Application Number | Title | Priority Date | Filing Date |
|---|---|---|---|
| PCT/JP2023/021964 Ceased WO2024034253A1 (ja) | 2022-08-12 | 2023-06-13 | 内視鏡システム及びその作動方法 |
Country Status (3)
| Country | Link |
|---|---|
| US (1) | US20250176876A1 (https=) |
| JP (1) | JPWO2024034253A1 (https=) |
| WO (1) | WO2024034253A1 (https=) |
Citations (8)
| Publication number | Priority date | Publication date | Assignee | Title |
|---|---|---|---|---|
| WO2012165505A1 (ja) * | 2011-06-02 | 2012-12-06 | オリンパス株式会社 | 蛍光観察装置 |
| JP2012235926A (ja) * | 2011-05-12 | 2012-12-06 | Fujifilm Corp | 医療装置システム及び生体情報監視方法 |
| WO2014073331A1 (ja) * | 2012-11-08 | 2014-05-15 | 富士フイルム株式会社 | 内視鏡システム |
| WO2017061256A1 (ja) * | 2015-10-07 | 2017-04-13 | 富士フイルム株式会社 | 内視鏡システム及び内視鏡システムの作動方法 |
| WO2017154292A1 (ja) * | 2016-03-07 | 2017-09-14 | 富士フイルム株式会社 | 内視鏡システム、プロセッサ装置、及び、内視鏡システムの作動方法 |
| WO2019012911A1 (ja) * | 2017-07-14 | 2019-01-17 | 富士フイルム株式会社 | 医療画像処理装置、内視鏡システム、診断支援装置、並びに医療業務支援装置 |
| WO2019065111A1 (ja) * | 2017-09-26 | 2019-04-04 | 富士フイルム株式会社 | 医療画像処理システム、内視鏡システム、診断支援装置、及び医療業務支援装置 |
| WO2019172231A1 (ja) * | 2018-03-06 | 2019-09-12 | 富士フイルム株式会社 | 医療画像処理システム及び内視鏡システム |
-
2023
- 2023-06-13 JP JP2024540289A patent/JPWO2024034253A1/ja active Pending
- 2023-06-13 WO PCT/JP2023/021964 patent/WO2024034253A1/ja not_active Ceased
-
2025
- 2025-02-09 US US19/048,953 patent/US20250176876A1/en active Pending
Patent Citations (8)
| Publication number | Priority date | Publication date | Assignee | Title |
|---|---|---|---|---|
| JP2012235926A (ja) * | 2011-05-12 | 2012-12-06 | Fujifilm Corp | 医療装置システム及び生体情報監視方法 |
| WO2012165505A1 (ja) * | 2011-06-02 | 2012-12-06 | オリンパス株式会社 | 蛍光観察装置 |
| WO2014073331A1 (ja) * | 2012-11-08 | 2014-05-15 | 富士フイルム株式会社 | 内視鏡システム |
| WO2017061256A1 (ja) * | 2015-10-07 | 2017-04-13 | 富士フイルム株式会社 | 内視鏡システム及び内視鏡システムの作動方法 |
| WO2017154292A1 (ja) * | 2016-03-07 | 2017-09-14 | 富士フイルム株式会社 | 内視鏡システム、プロセッサ装置、及び、内視鏡システムの作動方法 |
| WO2019012911A1 (ja) * | 2017-07-14 | 2019-01-17 | 富士フイルム株式会社 | 医療画像処理装置、内視鏡システム、診断支援装置、並びに医療業務支援装置 |
| WO2019065111A1 (ja) * | 2017-09-26 | 2019-04-04 | 富士フイルム株式会社 | 医療画像処理システム、内視鏡システム、診断支援装置、及び医療業務支援装置 |
| WO2019172231A1 (ja) * | 2018-03-06 | 2019-09-12 | 富士フイルム株式会社 | 医療画像処理システム及び内視鏡システム |
Also Published As
| Publication number | Publication date |
|---|---|
| JPWO2024034253A1 (https=) | 2024-02-15 |
| US20250176876A1 (en) | 2025-06-05 |
Similar Documents
| Publication | Publication Date | Title |
|---|---|---|
| US20240389829A1 (en) | Endoscope system | |
| CN110325100B (zh) | 内窥镜系统及其操作方法 | |
| US20250160615A1 (en) | Endoscope system | |
| US12433475B2 (en) | Medical image processing device | |
| JP6839773B2 (ja) | 内視鏡システム、内視鏡システムの作動方法及びプロセッサ | |
| WO2018159083A1 (ja) | 内視鏡システム、プロセッサ装置、及び、内視鏡システムの作動方法 | |
| JP7590607B2 (ja) | 内視鏡システム、プロセッサ装置、及び内視鏡システムの作動方法 | |
| US20230101620A1 (en) | Medical image processing apparatus, endoscope system, method of operating medical image processing apparatus, and non-transitory computer readable medium | |
| US20230237659A1 (en) | Image processing apparatus, endoscope system, operation method of image processing apparatus, and non-transitory computer readable medium | |
| JP2024015112A (ja) | 画像処理装置及びその作動方法 | |
| US20250169706A1 (en) | Endoscope system, operation method for endoscope system, and non-transitory computer readable medium | |
| CN113905653B (zh) | 内窥镜系统、内窥镜系统的工作方法、图像处理装置及计算机可读介质 | |
| US12283068B2 (en) | Medical image processing device, endoscope system, and medical image processing device operation method | |
| WO2024034253A1 (ja) | 内視鏡システム及びその作動方法 | |
| WO2023132188A1 (ja) | 内視鏡システム及びその作動方法 | |
| WO2023132138A1 (ja) | プロセッサ装置及びその作動方法並びに内視鏡システム | |
| US20240335092A1 (en) | Endoscope system and method for operating the same | |
| US20240108198A1 (en) | Medical image processing device, endoscope system, and operation method of medical image processing device | |
| JP2023178526A (ja) | 画像処理装置、内視鏡システム、画像処理装置の作動方法、及び画像処理装置用プログラム |
Legal Events
| Date | Code | Title | Description |
|---|---|---|---|
| 121 | Ep: the epo has been informed by wipo that ep was designated in this application |
Ref document number: 23852237 Country of ref document: EP Kind code of ref document: A1 |
|
| WWE | Wipo information: entry into national phase |
Ref document number: 2024540289 Country of ref document: JP |
|
| NENP | Non-entry into the national phase |
Ref country code: DE |
|
| 122 | Ep: pct application non-entry in european phase |
Ref document number: 23852237 Country of ref document: EP Kind code of ref document: A1 |