WO2024034253A1 - 内視鏡システム及びその作動方法 - Google Patents
内視鏡システム及びその作動方法 Download PDFInfo
- Publication number
- WO2024034253A1 WO2024034253A1 PCT/JP2023/021964 JP2023021964W WO2024034253A1 WO 2024034253 A1 WO2024034253 A1 WO 2024034253A1 JP 2023021964 W JP2023021964 W JP 2023021964W WO 2024034253 A1 WO2024034253 A1 WO 2024034253A1
- Authority
- WO
- WIPO (PCT)
- Prior art keywords
- image
- index value
- region
- area
- display
- Prior art date
Links
- 238000000034 method Methods 0.000 title claims abstract description 63
- 230000008859 change Effects 0.000 claims abstract description 15
- QVGXLLKOCUKJST-UHFFFAOYSA-N atomic oxygen Chemical group [O] QVGXLLKOCUKJST-UHFFFAOYSA-N 0.000 claims description 288
- 229910052760 oxygen Inorganic materials 0.000 claims description 288
- 239000001301 oxygen Substances 0.000 claims description 288
- 108010054147 Hemoglobins Proteins 0.000 claims description 42
- 102000001554 Hemoglobins Human genes 0.000 claims description 42
- 238000003825 pressing Methods 0.000 claims description 6
- 238000003384 imaging method Methods 0.000 abstract description 25
- 238000012937 correction Methods 0.000 description 305
- 238000005286 illumination Methods 0.000 description 195
- 238000004364 calculation method Methods 0.000 description 175
- 238000012545 processing Methods 0.000 description 77
- 238000010586 diagram Methods 0.000 description 65
- 239000000975 dye Substances 0.000 description 63
- 230000008569 process Effects 0.000 description 44
- 210000004369 blood Anatomy 0.000 description 40
- 239000008280 blood Substances 0.000 description 40
- 230000033001 locomotion Effects 0.000 description 39
- 238000001228 spectrum Methods 0.000 description 36
- 239000001052 yellow pigment Substances 0.000 description 36
- 238000003860 storage Methods 0.000 description 32
- 230000003287 optical effect Effects 0.000 description 20
- 210000001519 tissue Anatomy 0.000 description 18
- 230000007717 exclusion Effects 0.000 description 17
- 235000019646 color tone Nutrition 0.000 description 15
- 230000006870 function Effects 0.000 description 15
- 230000000875 corresponding effect Effects 0.000 description 14
- INGWEZCOABYORO-UHFFFAOYSA-N 2-(furan-2-yl)-7-methyl-1h-1,8-naphthyridin-4-one Chemical compound N=1C2=NC(C)=CC=C2C(O)=CC=1C1=CC=CO1 INGWEZCOABYORO-UHFFFAOYSA-N 0.000 description 13
- 239000000049 pigment Substances 0.000 description 13
- 230000000740 bleeding effect Effects 0.000 description 10
- 238000004891 communication Methods 0.000 description 10
- AJDUTMFFZHIJEM-UHFFFAOYSA-N n-(9,10-dioxoanthracen-1-yl)-4-[4-[[4-[4-[(9,10-dioxoanthracen-1-yl)carbamoyl]phenyl]phenyl]diazenyl]phenyl]benzamide Chemical compound O=C1C2=CC=CC=C2C(=O)C2=C1C=CC=C2NC(=O)C(C=C1)=CC=C1C(C=C1)=CC=C1N=NC(C=C1)=CC=C1C(C=C1)=CC=C1C(=O)NC1=CC=CC2=C1C(=O)C1=CC=CC=C1C2=O AJDUTMFFZHIJEM-UHFFFAOYSA-N 0.000 description 10
- 238000002834 transmittance Methods 0.000 description 10
- 239000001043 yellow dye Substances 0.000 description 10
- 230000005540 biological transmission Effects 0.000 description 9
- 238000001356 surgical procedure Methods 0.000 description 9
- 230000007423 decrease Effects 0.000 description 7
- 108010002255 deoxyhemoglobin Proteins 0.000 description 7
- 230000035945 sensitivity Effects 0.000 description 7
- 108010064719 Oxyhemoglobins Proteins 0.000 description 6
- 238000006243 chemical reaction Methods 0.000 description 6
- 238000003780 insertion Methods 0.000 description 6
- 230000037431 insertion Effects 0.000 description 6
- 238000000862 absorption spectrum Methods 0.000 description 5
- 230000000295 complement effect Effects 0.000 description 5
- 238000012544 monitoring process Methods 0.000 description 4
- 210000000056 organ Anatomy 0.000 description 4
- 238000009826 distribution Methods 0.000 description 3
- 210000004400 mucous membrane Anatomy 0.000 description 3
- 238000011017 operating method Methods 0.000 description 3
- 239000004065 semiconductor Substances 0.000 description 3
- CURLTUGMZLYLDI-UHFFFAOYSA-N Carbon dioxide Chemical compound O=C=O CURLTUGMZLYLDI-UHFFFAOYSA-N 0.000 description 2
- 210000000683 abdominal cavity Anatomy 0.000 description 2
- 230000003872 anastomosis Effects 0.000 description 2
- 230000017531 blood circulation Effects 0.000 description 2
- 239000003086 colorant Substances 0.000 description 2
- 230000001276 controlling effect Effects 0.000 description 2
- 230000002596 correlated effect Effects 0.000 description 2
- 230000008878 coupling Effects 0.000 description 2
- 238000010168 coupling process Methods 0.000 description 2
- 238000005859 coupling reaction Methods 0.000 description 2
- 229910052736 halogen Inorganic materials 0.000 description 2
- 150000002367 halogens Chemical class 0.000 description 2
- 238000007912 intraperitoneal administration Methods 0.000 description 2
- 230000001678 irradiating effect Effects 0.000 description 2
- 210000002429 large intestine Anatomy 0.000 description 2
- 238000005259 measurement Methods 0.000 description 2
- 230000000877 morphologic effect Effects 0.000 description 2
- 210000003200 peritoneal cavity Anatomy 0.000 description 2
- 238000002271 resection Methods 0.000 description 2
- 238000005070 sampling Methods 0.000 description 2
- 230000002123 temporal effect Effects 0.000 description 2
- 229910052724 xenon Inorganic materials 0.000 description 2
- FHNFHKCVQCLJFQ-UHFFFAOYSA-N xenon atom Chemical compound [Xe] FHNFHKCVQCLJFQ-UHFFFAOYSA-N 0.000 description 2
- 101100366935 Caenorhabditis elegans sto-2 gene Proteins 0.000 description 1
- 206010028980 Neoplasm Diseases 0.000 description 1
- OAICVXFJPJFONN-UHFFFAOYSA-N Phosphorus Chemical compound [P] OAICVXFJPJFONN-UHFFFAOYSA-N 0.000 description 1
- 238000004458 analytical method Methods 0.000 description 1
- 210000000436 anus Anatomy 0.000 description 1
- 238000013459 approach Methods 0.000 description 1
- 239000000090 biomarker Substances 0.000 description 1
- 210000004204 blood vessel Anatomy 0.000 description 1
- 201000011510 cancer Diseases 0.000 description 1
- 229910002092 carbon dioxide Inorganic materials 0.000 description 1
- 239000001569 carbon dioxide Substances 0.000 description 1
- 230000000112 colonic effect Effects 0.000 description 1
- 230000003247 decreasing effect Effects 0.000 description 1
- 230000001419 dependent effect Effects 0.000 description 1
- 230000000694 effects Effects 0.000 description 1
- 238000005516 engineering process Methods 0.000 description 1
- 210000000416 exudates and transudate Anatomy 0.000 description 1
- 239000007789 gas Substances 0.000 description 1
- 230000002496 gastric effect Effects 0.000 description 1
- 210000001035 gastrointestinal tract Anatomy 0.000 description 1
- 230000000762 glandular Effects 0.000 description 1
- 210000000569 greater omentum Anatomy 0.000 description 1
- 230000035876 healing Effects 0.000 description 1
- 238000001727 in vivo Methods 0.000 description 1
- 230000003902 lesion Effects 0.000 description 1
- 210000000565 lesser omentum Anatomy 0.000 description 1
- 239000007788 liquid Substances 0.000 description 1
- 238000004519 manufacturing process Methods 0.000 description 1
- 239000011159 matrix material Substances 0.000 description 1
- 210000000713 mesentery Anatomy 0.000 description 1
- 229910044991 metal oxide Inorganic materials 0.000 description 1
- 150000004706 metal oxides Chemical class 0.000 description 1
- 210000003097 mucus Anatomy 0.000 description 1
- 238000007781 pre-processing Methods 0.000 description 1
- 230000000644 propagated effect Effects 0.000 description 1
- 238000004549 pulsed laser deposition Methods 0.000 description 1
- 238000010079 rubber tapping Methods 0.000 description 1
- 238000004088 simulation Methods 0.000 description 1
- 239000007787 solid Substances 0.000 description 1
- 230000003595 spectral effect Effects 0.000 description 1
Images


Classifications
-
- A—HUMAN NECESSITIES
- A61—MEDICAL OR VETERINARY SCIENCE; HYGIENE
- A61B—DIAGNOSIS; SURGERY; IDENTIFICATION
- A61B1/00—Instruments for performing medical examinations of the interior of cavities or tubes of the body by visual or photographical inspection, e.g. endoscopes; Illuminating arrangements therefor
- A61B1/04—Instruments for performing medical examinations of the interior of cavities or tubes of the body by visual or photographical inspection, e.g. endoscopes; Illuminating arrangements therefor combined with photographic or television appliances
- A61B1/045—Control thereof
-
- A—HUMAN NECESSITIES
- A61—MEDICAL OR VETERINARY SCIENCE; HYGIENE
- A61B—DIAGNOSIS; SURGERY; IDENTIFICATION
- A61B5/00—Measuring for diagnostic purposes; Identification of persons
- A61B5/145—Measuring characteristics of blood in vivo, e.g. gas concentration or pH-value ; Measuring characteristics of body fluids or tissues, e.g. interstitial fluid or cerebral tissue
- A61B5/1455—Measuring characteristics of blood in vivo, e.g. gas concentration or pH-value ; Measuring characteristics of body fluids or tissues, e.g. interstitial fluid or cerebral tissue using optical sensors, e.g. spectral photometrical oximeters
- A61B5/1459—Measuring characteristics of blood in vivo, e.g. gas concentration or pH-value ; Measuring characteristics of body fluids or tissues, e.g. interstitial fluid or cerebral tissue using optical sensors, e.g. spectral photometrical oximeters invasive, e.g. introduced into the body by a catheter
-
- G—PHYSICS
- G02—OPTICS
- G02B—OPTICAL ELEMENTS, SYSTEMS OR APPARATUS
- G02B23/00—Telescopes, e.g. binoculars; Periscopes; Instruments for viewing the inside of hollow bodies; Viewfinders; Optical aiming or sighting devices
- G02B23/24—Instruments or systems for viewing the inside of hollow bodies, e.g. fibrescopes
Definitions
- the present invention relates to an endoscope system that controls the display of index values indicating the condition of a living body and an operating method thereof.
- Patent Document 1 describes an image acquisition unit that acquires a subject image containing at least two types of spectral information regarding the wavelength of light at regular time intervals, and a lock-on area that follows the movement of a region of interest of the subject.
- a lock-on setting means that is set in a region of interest on the subject image, and monitoring used to monitor temporal changes in oxygen saturation in the lock-on area based on an image of the lock-on area portion of the subject image.
- a medical device system is disclosed that includes a monitoring image generating means for generating an image and a display means for displaying the monitoring image.
- oxygen saturation is calculated as an index value indicating the state of a living body.
- index values indicating the condition of a living body When supporting surgical treatment using index values indicating the condition of a living body based on endoscopic images, monitoring of index values indicating the condition of the living body is only performed for one local region included in the endoscopic image. However, this may be insufficient in situations where it is desired to know spatial changes in index values indicating the state of the body, particularly in situations where it is desired to determine the resection range of a wide range of lesions. Therefore, there is a need for a technology that can visually recognize spatial changes in index values that indicate the condition of a living body.
- An object of the present invention is to provide an endoscope system and an operating method thereof that allow a user to visually recognize spatial changes in index values indicating the state of a living body.
- the endoscope system of the present invention includes an endoscope and a processor.
- An endoscope generates an image signal by photographing a subject.
- the processor acquires an image signal, generates an endoscopic image based on the image signal, sets a plurality of regions of interest at mutually different positions in the endoscopic image, and sets a plurality of regions of interest in the endoscopic image.
- the position of each is stored as region position information, and based on the image signal in the region of interest, a biometric index value indicating the state of the subject is calculated. Based on the biometric index value in each region of interest, the statistical value of the biometric index value is calculated.
- a display device that calculates a certain region index value for each region of interest, generates an index value display table that collectively displays multiple region index values, and displays endoscopic images, index value display tables, and multiple region position information. Generates images and controls displaying images for display.
- the biomarker value is oxygen saturation and/or hemoglobin index.
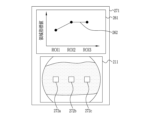
- the index value display table displays the plurality of area index values in a graph format.
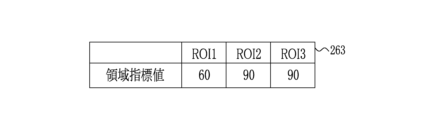
- the processor associates the area position information with the area index value, stores the area index value as a specific area index value, holds the specific area index value, and displays it in the index value display table.
- the processor calculates a biometric index value based on the latest image signal in the region of interest, calculates a region index value for each region of interest based on the latest biometric index value, and calculates the region index value displayed in the index value display table. It is preferable to update.
- the processor can store the position of the region of interest in the endoscopic image as a lock-on area, and calculate the biometric index value based on the image signal in the lock-on area. preferable.
- the processor stores the area index value calculated based on the image signal in the lock-on area as a specific lock-on area index value by associating it with the lock-on area, and displays the specific lock-on area index value in the display image. It is preferable to control display.
- the processor stores a specific lock-on area index value stored immediately before the position of the lock-on area becomes an out-of-field position. It is preferable to define the out-of-field lock-on area index value as the out-of-field lock-on area index value, and to generate an index value display table that displays the out-of-field lock-on area index value.
- the processor sets at least one lock-on area in the endoscopic image as an additional region of interest, calculates a biometric value based on the image signal in the additional region of interest, and calculates the statistics of the biometric index value in the additional region of interest.
- the additional area index value that is the value is calculated as the area index value
- an extended index value display table that displays the additional area index value and the out-of-field lock-on area index value together is generated, and the extended index value is displayed in the display image. It is preferable to perform control to display a display table.
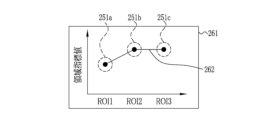
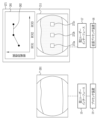
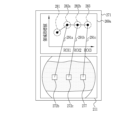
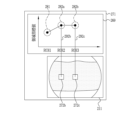
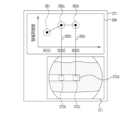
- the processor controls superimposing and displaying a plurality of region position information on the endoscopic image, and displays the region position information superimposed on the endoscopic image and the region position information displayed on the extended index value display table. It is preferable to perform control to display an index value link line connecting the information and the corresponding area index value other than the out-of-field lock-on area index value on the display image.
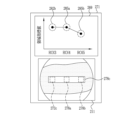
- the processor performs control to change the display size of the extended index value display table displayed in the display image.
- the processor controls superimposing and displaying multiple pieces of area position information on the endoscopic image, and displays the area position information superimposed on the endoscopic image and the area position information displayed on the index value display table. It is preferable to perform control to display an index value link line connecting the area index value and the corresponding area index value on the display image.
- the processor sets at least one lock-on area in the endoscopic image as an additional region of interest, calculates a biometric value based on the image signal in the additional region of interest, and calculates the statistics of the biometric index value in the additional region of interest.
- Calculate the additional area index value as the area index value generate an index value display table that displays the additional area index value, and display the index value display table that displays the additional area index value on the display image.
- control is performed.
- a region of interest setting switch is provided, and the processor sets the plurality of regions of interest according to pressing of the region of interest setting switch, and sets the region index value in the set region of interest according to pressing of the region of interest setting switch again. It is preferable to calculate.
- the operating method of the endoscope system of the present invention includes the steps of: acquiring an image signal generated by photographing a subject with the endoscope; generating an endoscopic image based on the image signal; a step of setting a plurality of regions of interest at different positions in the endoscopic image; a step of storing the positions of the plurality of regions of interest in the endoscopic image as region position information; , a step of calculating a biometric index value indicating the state of the subject, a step of calculating a region index value, which is a statistical value of the biometric index value, for each region of interest based on the biometric index value in each region of interest; A step of generating an index value display table that collectively displays index values, a step of generating a display image that displays an endoscopic image, an index value display table, and a plurality of area position information, and a step of displaying the display image. and a step of performing control.
- a user can visually recognize spatial changes in index values indicating the state of a living body.
- FIG. 1 is a schematic diagram of an endoscope system.
- FIG. 1 is a schematic diagram of an endoscope system according to a first embodiment.
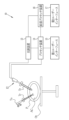
- FIG. 1 is a schematic diagram of an endoscope system in which the endoscope is a laparoscope.
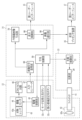
- FIG. 1 is a block diagram showing the functions of the endoscope system according to the first embodiment.
- FIG. 2 is a block diagram showing the functions of a light source section.
- FIG. 3 is an explanatory diagram showing an example of a display display in normal mode. It is an explanatory view showing an example of a display display in oxygen saturation mode.
- FIG. 7 is an image diagram showing an example of a notification image when prompting a switch to a correction mode.
- FIG. 1 is a schematic diagram of an endoscope system according to a first embodiment.
- FIG. 1 is a schematic diagram of an endoscope system in which the endoscope is a laparoscope.
- FIG. 1 is a block diagram showing the functions of the end
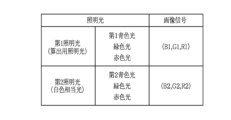
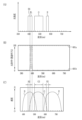
- 3 is an explanatory diagram showing an example of a display display in a correction mode. It is a graph showing the spectrum of white light. It is a graph showing the spectrum of the first illumination light. It is a graph which shows the spectrum of 2nd illumination light. It is a graph which shows the spectrum of 3rd illumination light. It is an explanatory view showing an example of a light emission pattern for normal mode. It is an explanatory view showing an example of a light emission pattern for oxygen saturation mode. It is an explanatory view showing an example of a light emission pattern for correction mode. It is a graph which shows the transmission band of the color filter of the image sensor of 1st Embodiment. It is a table showing illumination light emitted and image signals acquired in the normal mode of the first embodiment.
- (A) is a graph showing the reflection spectrum of reduced hemoglobin in the presence of yellow pigment.
- (B) is a graph showing the absorption spectrum of yellow dye. It is a table showing oxygen saturation dependence, blood concentration dependence, and brightness dependence of B1 image signal, G2 image signal, and R2 image signal. It is a graph showing an oxygen saturation calculation table.
- FIG. 2 is a block diagram showing the functions of an extended processor device.
- FIG. 2 is an explanatory diagram showing a method of calculating oxygen saturation.
- A) is a graph showing a corrected oxygen saturation calculation table in a two-dimensional coordinate system.
- FIG. 3 is an explanatory diagram showing a method of calculating corrected oxygen saturation.
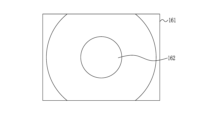
- FIG. 3 is an image diagram showing an example of a correction image. It is a graph showing a first reliability calculation table. It is a graph which shows the 2nd reliability calculation table. It is a graph which shows the 3rd reliability calculation table.
- FIG. 7 is an image diagram showing an example of a correction image when the saturation of the correction image is changed depending on reliability.
- FIG. 7 is an image diagram showing an example of a correction image when a specific area is surrounded by a frame based on reliability.
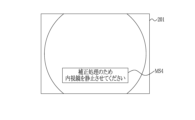
- FIG. 7 is an image diagram illustrating an example of a correction image that indicates that correction processing can be performed appropriately.
- FIG. 7 is an image diagram showing an example of a correction image when displaying a warning.
- A is an image diagram showing an example of an oxygen saturation image.
- B is an image diagram showing an example of a region of interest image in specific example (1).
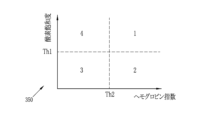
- FIG. 7 is an explanatory diagram showing an example of a display display when displaying a region of interest image in specific example (1). It is a graph showing a combination index calculation table. It is an image diagram showing an example of a biometric index value selection screen.
- FIG. 2 is an explanatory diagram showing an example of an index value display table in a graph format.
- FIG. 2 is an explanatory diagram showing an example of an index value display table in a tabular format.
- FIG. 7 is an image diagram showing an example of a display image in specific example (1).
- FIG. 7 is an explanatory diagram showing an example of a display display when displaying a display image in specific example (1).
- FIG. 7 is an explanatory diagram showing an example of a display when displaying a display image in specific example (2).
- FIG. 7 is an explanatory diagram showing an example of a display when displaying a region of interest image in specific example (3).
- FIG. 7 is an explanatory diagram showing an example of a display when displaying a display image in specific example (3).
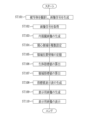
- FIG. 7 is an image diagram showing an example of a display image when calculating area index values regarding multiple types of biometric index values. It is a flowchart explaining the flow when displaying the display image of 1st Embodiment.
- FIG. 7 is an explanatory diagram showing an example of a display display when displaying a display image in specific example (1).
- FIG. 7 is an explanatory diagram showing an example of a display when displaying a display image in specific example (2).
- FIG. 7 is an explanatory diagram showing an example of
- FIG. 7 is an image diagram showing an example of a region of interest image when displaying a region of interest for display.
- FIG. 3 is an image diagram showing an example of a display image when display area position information is displayed.
- FIG. 3 is a block diagram showing the functions of the extended processor device when an area index value storage unit is provided.
- FIG. 7 is an image diagram showing an example of a display image when updating a region index value.
- FIG. 7 is an explanatory diagram showing an example of area index values calculated in chronological order when illumination light is emitted using a light emission pattern for oxygen saturation mode.
- A is an image diagram showing an example of a region of interest image.
- (B) is an image diagram showing an example of a region of interest image when the region of interest in (A) follows the movement of the endoscope.
- (A) is an image diagram showing an example of a region of interest image when displaying a region of interest for display.
- (B) is an image diagram showing an example of a region of interest image when the region of interest in (A) follows the movement of the endoscope and a region of interest for display is displayed.
- (A) is an image diagram showing an example of a display image before displaying an out-of-field lock-on area index value.
- (B) is an image diagram showing an example of a display image when displaying an out-of-field lock-on area index value at a time point after (A).
- FIG. 7 is an image diagram showing an example of a display image when displaying an out-of-field lock-on area index value and setting an additional region of interest.
- FIG. 7 is an image diagram showing an example of a display image when displaying an out-of-field lock-on area index value and an index value link line.
- FIG. 7 is an image diagram showing an example of a display image when displaying out-of-field lock-on area index values and changing the display size of an index value display table.
- FIG. 7 is an image diagram showing an example of a display image when an index value link line is displayed when an out-of-field lock-on area index value and an additional region of interest are not displayed.
- FIG. 7 is an image diagram showing an example of a display image after moving the endoscope in a case where an out-of-field lock-on area index value and an additional region of interest are not displayed.
- FIG. 7 is an image diagram showing an example of a display image when the endoscope is moved and the display size of the index value display table is changed when the out-of-field lock-on area index value and the additional region of interest are not displayed.
- FIG. 7 is an image diagram showing an example of a display image when an index value link line and display region position information are displayed when an out-of-field lock-on area index value and an additional region of interest are not displayed.
- FIG. 3 is an image diagram showing an example of an image for use.
- FIG. 7 is an image diagram showing an example of a display image when an out-of-field lock-on area index value is not displayed.
- FIG. 7 is an image diagram showing an example of a display image when an additional region of interest is set when an out-of-field lock-on area index value is not displayed.
- FIG. 7 is an image diagram showing an example of a display image that displays an additional area index value when an out-of-field lock-on area index value is not displayed.
- FIG. 7 is an image diagram showing an example of a display image when display area position information is displayed without displaying an out-of-field lock-on area index value.
- FIG. 7 is an image diagram showing an example of a display image when an additional region of interest is set and display region position information is displayed when an out-of-field lock-on area index value is not displayed.
- FIG. 7 is an image diagram showing an example of a display image when display area position information is displayed when displaying an additional area index value when an out-of-field lock-on area index value is not displayed. It is a block diagram showing the function of the endoscope system of a 2nd embodiment.
- FIG. 3 is a plan view of a rotating filter.
- FIG. 3 is an explanatory diagram showing a difference value ⁇ Z used in a calculated value correction process.
- FIG. 5 is a graph showing a spectrum of light incident on an image sensor 511.
- FIG. 5 is a graph showing a spectrum of light incident on an image sensor 512.
- FIG. 5 is a graph showing the spectrum of light incident on the image sensor 513.
- FIG. 5 is a graph showing the spectrum of light incident on the image sensor 514.
- FIG. It is a graph showing the reflection spectrum of reduced hemoglobin in the presence of a yellow pigment, with the wavelength band Rk displayed.
- (A) is a graph showing the spectrum of the fourth illumination light.
- (B) is a graph showing the relationship between the reflectance and transmittance of light incident on the dichroic mirror of the fourth embodiment and the wavelength of the light.
- (C) is a graph showing the relationship between the sensitivity of the image sensor 611 and the wavelength of light.
- (A) is a graph showing the spectrum of the fourth illumination light.
- (B) is a graph showing the relationship between the reflectance and transmittance of light incident on the dichroic mirror of the fourth embodiment and the wavelength of the light.
- (C) is a graph showing the relationship between the sensitivity of the image sensor 612 and the wavelength of light. It is an explanatory view showing a light emission pattern in oxygen saturation mode of a 4th embodiment.
- FIG. 7 is an explanatory diagram showing a light emission pattern in a correction mode according to a fourth embodiment.
- (A) is a graph showing the spectrum of the third illumination light.
- (B) is a graph showing the relationship between the reflectance and transmittance of light incident on the dichroic mirror of the fourth embodiment and the wavelength of the light.
- (C) is a graph showing the relationship between the sensitivity of the image sensor 611 and the wavelength of light.
- A) is a graph showing the spectrum of the third illumination light.
- B) is a graph showing the relationship between the reflectance and transmittance of light incident on the dichroic mirror of the fourth embodiment and the wavelength of the light.
- C) is a graph showing the relationship between the sensitivity of the image sensor 612 and the wavelength of light. It is a block diagram showing the function of the endoscope system of a 4th embodiment.
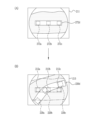
- (A) is an image diagram showing the correction area.
- B) is an enlarged view of the correction area shown in (A).
- FIG. 7 is a block diagram showing the functions of a reliability calculation section, a correction determination section, and an extended display control section according to a fourth embodiment. It is a graph showing a first reliability calculation table in which the horizontal axis is a pixel value of a G2 image signal. It is a graph showing a third reliability calculation table with the vertical axis representing the signal ratio ln (B1/G2).
- FIG. 12 is an explanatory diagram showing the relationship between a light emission pattern, a generated endoscopic image, and an image set in a correction mode of the fourth embodiment.
- FIG. 7 is an explanatory diagram showing corresponding correction areas among a white light equivalent image, a first blue light image, and a third illumination light image.
- FIG. 3 is an explanatory diagram showing a method of calculating a correlation coefficient.
- FIG. 7 is an image diagram showing an example of a display when a warning is displayed in the fourth embodiment.
- the endoscope system 10 includes an endoscope 12, a light source device 13, a processor device 14, a first user interface 15, an extended processor device 16, and a second user interface 17.
- the endoscope 12 is optically or electrically connected to the light source device 13 and electrically connected to the processor device 23.
- the first user interface 15 is electrically connected to the processor device 23 .
- the extended processor device 16 is electrically connected to the light source device 13, the processor device 14, and the second user interface 17. These respective connections are not limited to wired connections, but may be wireless. Alternatively, it may be via a network.
- the endoscope system 10 includes an endoscope 12 that is inserted into a body cavity of a subject for surgical treatment, and is a rigid endoscope that photographs organs in the body cavity from the serosa side. It is particularly suitable for laparoscopic applications.
- the endoscope 12 may be a flexible endoscope that is inserted through the nose, mouth, or anus of the subject.
- a subject means a subject into whom the endoscope 12 is inserted.
- subject refers to an object to be observed that is included in the field of view of the endoscope 12 and appears in an endoscopic image.
- the endoscope 12 When the endoscope 12 is a laparoscope, as shown in FIG. 2, the endoscope 12 includes an insertion section 12a that is inserted into the abdominal cavity of the subject, and an operation section provided at the proximal end of the insertion section 12a. 12b.
- An optical system and an image sensor are built into a portion near the tip of the insertion section 12a (hereinafter referred to as the tip).
- the optical system includes an illumination optical system, which will be described later, for irradiating the subject with illumination light, and an imaging optical system, which will be described later, for capturing an image of the subject.
- the image sensor generates an image signal by focusing reflected light from an observation target that has passed through an imaging optical system and entered on an imaging plane. The generated image signal is output to the processor device 14.
- the operation unit 12b is provided with a mode switching switch 12c and a region of interest setting switch 12d.
- the mode switching switch 12c is used to switch the observation mode, which will be described later.
- the region of interest setting switch 12d is used to input a region of interest setting instruction, which will be described later, and an instruction to calculate a biometric index value within the region of interest. Although details will be described later, mode switching may be performed by operating the region of interest setting switch 12d without using the mode switching switch 12c.
- the endoscope 12 is inserted into the peritoneal cavity AC of the subject P who is in the supine position (face up) on the operating table Ot via the trocar Tr. .
- the inside of the peritoneal cavity AC of the subject P is inflated with carbon dioxide gas being fed by an insufflation device in order to secure an observation field and a surgical field.
- treatment tools such as grasping forceps for expanding the observation field and surgical field, and an electric scalpel for resecting a part of the organ having a diseased area are used. To is inserted.
- the light source device 13 generates illumination light.
- the processor device 14 performs system control of the endoscope system 10, and further generates endoscopic images by performing image processing on image signals transmitted from the endoscope 12.
- endoscopic image includes a white light image, a white light equivalent image, an oxygen saturation image, a region of interest image, a display image, a correction image, a notification image, a third illumination light image, A first blue light image is included.
- the first user interface 15 and the second user interface 17 include a keyboard, a mouse, a microphone, a foot switch, a touch pad, and the like, which accept input operations from the user and send input signals to the processor device 14 or the extended processor device 16. This is an input device such as a tablet or touch pen. Further, the first user interface 15 and the second user interface 17 receive output signals from the processor device 14 or the extended processor device 16, and output endoscopic images, audio, etc., such as displays, head-mounted displays, speakers, etc. It is an output device.
- the first user interface 15 and the second user interface 17 will be collectively referred to as a user interface, and the first user interface 15 or the second user interface 17 will be referred to as a user interface.
- the mode switching switch 12c and the region of interest setting switch 12d of the endoscope 12 may be provided not on the endoscope 12 but on the user interface.
- the endoscope system 10 has three modes: normal mode, oxygen saturation mode, and correction mode. These three modes can be switched by the user operating the mode switching switch 12c or the region of interest setting switch 12d.
- the normal mode a naturally colored white light image generated by imaging a subject using white light as the illumination light is displayed on the display, which is the user interface.
- the oxygen saturation mode the oxygen saturation of the subject is calculated, and an oxygen saturation image obtained by converting the calculated oxygen saturation into an image is displayed on the display.
- a white light equivalent image containing fewer short wavelength components than the white light image is displayed on the display.
- correction mode correction processing regarding the calculation of oxygen saturation is performed in consideration of the influence of a specific dye, which will be described later.
- the light source device 13 includes a light source section 20 and a light source control section 21 that controls the light source section 20.
- the light source section 20 includes, for example, a semiconductor light source such as a multi-color LED (Light Emitting Diode), a laser light source, a combination of a laser diode and a phosphor, a xenon lamp, a halogen light source, and the like.
- the light source section 20 has, for example, a plurality of light sources, turns on or off each of these, and when turned on, the light emission amount of each light source is controlled by the light source control section 21 to illuminate the observation target. Emits illumination light.
- the light source unit 20 includes, for example, a V-LED (Violet Light Emitting Diode) 20a, a BS-LED (Blue Short-wavelength Light Emitting Diode) 20b, and a BL-LED (Blue It has five color LEDs: Long-wavelength Light Emitting Diode) 20c, G-LED (Green Light Emitting Diode) 20d, and R-LED (Red Light Emitting Diode) 20e. Note that the combination of each color LED is not limited to this.
- the V-LED 20a emits violet light V with a center wavelength of 410 nm ⁇ 10 nm.
- the BS-LED 20b emits second blue light BS having a center wavelength of 450 nm ⁇ 10 nm.
- the BL-LED 20c emits first blue light BL having a center wavelength of 470 nm ⁇ 10 nm.
- the G-LED 20d emits green light G in the green band. It is preferable that the center wavelength of the green light G is 540 nm.
- the R-LED 20e emits red light R in the red band. It is preferable that the center wavelength of the red light R is 620 nm. Note that the center wavelength and peak wavelength of each of the LEDs 20a to 20e may be the same or different.
- the light source control unit 21 inputs control signals independently to each of the LEDs 20a to 20e, thereby independently controlling the lighting, extinguishing, and amount of light emitted by each of the LEDs 20a to 20e.
- the lighting or extinguishing control by the light source control unit 21 differs depending on each mode, and details will be described later.
- Illumination light emitted from the light source section 20 is incident on the light guide 41 via an optical path coupling section (not shown) composed of mirrors, lenses, and the like.
- the light guide 41 may be built into the endoscope 12 and a universal cord (a cord that connects the endoscope 12, the light source device 13, and the processor device 14).
- the light guide 41 propagates the light from the optical path coupling section to the distal end of the endoscope 12.
- An illumination optical system 42 and an imaging optical system 43 are provided at the distal end of the endoscope 12.
- the illumination optical system 42 has an illumination lens 42a, and the illumination light propagated by the light guide 41 is irradiated onto the subject via the illumination lens 42a. Note that when the endoscope 12 is a flexible endoscope and the light source section 20 is built into the distal end of the endoscope 12, the light is transmitted through the illumination lens 42a of the illumination optical system 42 without passing through the light guide 41. illumination light is emitted.
- the imaging optical system 43 includes an objective lens 43a and an imaging sensor 44. Reflected light from the subject irradiated with the illumination light enters the image sensor 44 via the objective lens 43a. As a result, an image of the subject is formed on the image sensor 44.
- the image sensor 44 is a color image sensor or a monochrome image sensor that images reflected light from a subject.
- each pixel of the image sensor 44 includes a B pixel (blue pixel) having a B (blue) color filter, a G pixel (green pixel) having a G (green) color filter, Either R pixel (red pixel) having an R (red) color filter is provided.
- the wavelength band and transmittance of light transmitted by the B color filter, G color filter, and R color filter will be described later.
- the image sensor 44 is preferably a color image sensor with a Bayer array in which the ratio of the number of B pixels, G pixels, and R pixels is 1:2:1.
- CMOS Complementary Metal-Oxide Semiconductor
- image sensor 44 a CCD (Charge Coupled Device) image sensor, a CMOS (Complementary Metal-Oxide Semiconductor) image sensor, etc. can be applied.
- CMOS Complementary Metal-Oxide Semiconductor
- a color image sensor having blue pixels, green pixels, and red pixels a complementary color image sensor having complementary color filters of C (cyan), M (magenta), Y (yellow), and G (green) is used. Also good.
- image signals of four colors, CMYG are output.
- CMYG four-color image signal into the RGB three-color image signal by complementary color-primary color conversion
- a color image sensor similar to a color image sensor including a blue pixel, a green pixel, and a red pixel, which will be described later, can be used. It is possible to obtain image signals of each RGB color. The details of the lighting/extinguishing control of the illumination light in each mode and the image signal output by the image sensor 44 in each mode will be described later.
- the imaging sensor 44 is driven and controlled by an imaging control section 45. Control of the imaging sensor 44 in each mode by the imaging control unit 45 will be described later.
- the CDS/AGC circuit 46 Correlated Double Sampling/Automatic Gain Control
- CDS correlated double sampling
- AGC automatic gain control
- the image signal that has passed through the CDS/AGC circuit 46 is converted into a digital image signal by an A/D converter 47 (Analog/Digital).
- A/D converter 47 Analog/Digital
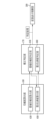
- the processor device 14 includes a central control section 50, an image signal acquisition section 60, an endoscopic image generation section 70, a display control section 80, and an image communication section 90.
- programs related to various processes are incorporated in a program memory (not shown).
- the functions of the image acquisition unit 60, the endoscopic image generation unit 70, the display control unit 80, and the image communication unit 90 are realized by the central control unit 50 configured by a processor executing the program in the program memory. .
- the image signal acquisition section 60 acquires an A/D converted image signal from the endoscope 12 and transmits it to the endoscope image generation section 70 and/or the image communication section 90.
- the endoscopic image generation unit 70 generates an endoscopic image based on the image signal. Specifically, image signals of each color are subjected to color conversion processing such as demosaic processing, 3 x 3 matrix processing, gradation conversion processing, 3D LUT (Look Up Table) processing, and/or color enhancement processing, spatial An endoscopic image is generated by performing image processing that is structure enhancement processing such as frequency enhancement processing. Note that the demosaic process is a process that generates a signal of the missing color of each pixel. Through demosaic processing, all pixels have signals of each RGB color. Demosaic processing is also performed in the expanded processor device 16, which will be described later.
- the endoscopic image generation unit 70 generates an endoscopic image by performing image processing according to the mode. In the case of normal mode, the endoscopic image generation unit 70 generates a white light image by performing image processing for normal mode. In the case of oxygen saturation mode, the endoscopic image generation unit 70 generates a white light equivalent image.
- the image signal acquisition unit 60 transmits the image signal to the extended processor device 16 via the image communication unit 90.
- the correction mode as in the case of the oxygen saturation mode, a white light equivalent image is generated in the endoscope image generation section 70, and image signals of each color are sent to the extended processor device via the image communication section 90. 16.
- the display control unit 80 and the extended display control unit 200 of the extended processor device 16 perform control regarding output to the user interface.
- the display control unit 80 performs display control to display the endoscopic image generated by the endoscopic image generation unit 70 on a display that is a user interface. Further, the display control unit 80 may perform display control to display the endoscopic image generated by the extended processor device 16 on a display that is a user interface.
- the extended processor device 16 receives image signals from the processor device 14 and performs various image processing.
- the extended processor device 16 calculates oxygen saturation in the oxygen saturation mode, and generates an oxygen saturation image that is an image of the calculated oxygen saturation.
- An extended display control unit 200 of the extended processor device 16, which will be described later, performs display control for displaying endoscopic images generated by the extended processor device 16 on a display that is a user interface. Further, the extended processor device 16 performs correction processing regarding calculation of oxygen saturation in the correction mode. Details of the processing performed by the extended processor device 16 on image signals in the oxygen saturation mode and the correction mode will be described later.
- the extended processor device 16 performs demosaic processing on the image signal received from the processor device 14, and then performs reliability calculation, correction processing, and biological analysis including oxygen saturation, which will be described later. Calculates index values, generates oxygen saturation images, generates display images, etc.
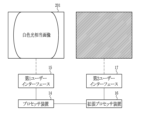
- the display control unit 80 of the processor device 14 displays a white light image 81 on the display, which is the first user interface 15, as shown in FIG.
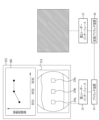
- nothing is displayed on the display, which is the second user interface 17.
- the fact that nothing is displayed on the display, which is the second user interface 17, is indicated by diagonal lines.
- the display control unit 80 of the processor device 14 displays the white light equivalent image 201 on the display that is the first user interface 15, as shown in FIG.
- the extended display control unit 200 of the extended processor device 16 displays the oxygen saturation image 202 on the display that is the second user interface 17.
- the extended display control unit 200 of the extended processor device 16 displays a display image or a region of interest image, which will be described later, on the display that is the second user interface 17. Display control by the extended display control unit 200 will be described in detail later.
- the display control unit 80 of the processor device 14 displays a message MS0 "Please perform correction processing" as shown in FIG. 8 on the display that is the user interface.
- the notification image 82 may be displayed to prompt the user to switch to the correction mode.
- the oxygen saturation mode it is preferable to display the oxygen saturation image on the display after the correction processing in the correction mode is performed. Note that even when the correction process is not performed, the extended display control section 200, which will be described later, may perform control to display the oxygen saturation image.
- the display control unit 80 of the processor device 14 displays a white light equivalent image on the display, which is the first user interface 15, as shown in FIG.
- the display serving as the second user interface 17 either displays nothing (indicated by diagonal lines) or displays a notification image 82, a display image to be described later, and a corrected oxygen saturation level to be described later.
- An oxygen saturation image, a correction image, or a warning display image reflected in the base image to be described later is displayed.
- Image display control for the second user interface 17 is controlled by the extended display control unit 200 of the extended processor device 16.
- the notification image 82 that displays the message MS0 is displayed on the display without displaying the oxygen saturation image, thereby prompting the user to switch to the correction mode. prompt.
- the mode is switched to the oxygen saturation mode automatically or by the user's mode switching operation.
- a notification image 82 that displays the message "Correction process has been completed” is displayed to prompt the user to switch from the correction mode to the oxygen saturation mode. You can do it like this.
- white light is emitted from the light source section 20.
- the white light is a violet light V and a second blue light BS, each having a wavelength band as shown in FIG. , green light G, and red light R.
- calculation illumination light (hereinafter referred to as first illumination light) and white equivalent light (hereinafter referred to as second illumination light) are emitted from the light source section 20. It emits light.
- the first illumination light is emitted by simultaneously lighting the BL-LED 20c, the G-LED 20d, and the R-LED 20e, and has the wavelength bands shown in FIG. 11, respectively.
- the white light including the light R is broadband illumination light having different wavelength bands.
- the second illumination light is emitted by simultaneously lighting the BS-LED 20b, the G-LED 20d, and the R-LED 20e, and has the wavelength bands shown in FIG. 12, respectively.
- the first illumination light, the second illumination light, and the correction illumination light are emitted from the light source section 20.
- the third illumination light is illumination light made of green light G, which is emitted by lighting the G-LED 20d and has a wavelength band as shown in FIG. 13.
- the term "illumination light” refers to white light, first illumination light, second illumination light, third illumination light, mixed light, fourth illumination light, violet light V, first blue light BL, third illumination light, 2 is used as a term meaning any one of blue light BS, green light G, or red light R, or these lights collectively, or as a term meaning light emitted from the light source device 13. Note that in FIGS.
- the light intensity of each illumination light is set to a constant value for simplicity, but the light intensity of each illumination light is not limited to a constant value.
- the third illumination light is not limited to monochromatic light as shown in FIG. 13, but may be illumination light using light of multiple colors.
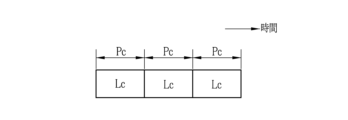
- each light source is controlled to turn on or off in accordance with the normal mode light emission pattern.
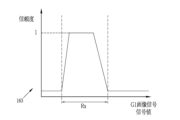
- the normal mode light emission pattern is a light emission pattern in which a pattern of emitting white light Lc is repeated during one white light illumination period Pc, as shown in FIG.
- the illumination period means a certain period of time during which illumination light is turned on. Further, one illumination period is provided for each frame.
- a frame refers to a unit of period that includes at least the period from the timing of illumination light emission to the completion of reading out the image signal by the image sensor 44.
- each light source is controlled to turn on or off in accordance with the oxygen saturation mode light emission pattern.
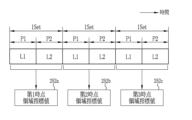
- the light emission pattern for the oxygen saturation mode is as shown in FIG. 15, in which the first illumination light L1 is emitted during one first illumination period P1, and the second illumination light L2 is emitted during one second illumination period P2. This is a light emitting pattern that repeats a light emitting pattern.
- each light source is controlled to turn on or off in accordance with the correction mode light emission pattern.
- the correction mode light emission pattern is as shown in FIG. 16, in which the first illumination light L1 is emitted during one first illumination period P1, the second illumination light L2 is emitted during one second illumination period P2, and This is a light emission pattern that repeats a light emission pattern in which the third illumination light L3 is emitted during one third illumination period P3 and the second illumination light L2 is emitted during one second illumination period P2. That is, the correction mode light emission pattern is a light emission pattern in which illumination light is emitted in the order of first illumination light L1, second illumination light L2, third illumination light L3, second illumination light L2, . . . .
- the image signal output from the image sensor 44 in each mode will be explained.
- the wavelength band and transmittance of light transmitted by the B color filter, G color filter, and R color filter of the image sensor 44 will be explained.
- the B color filter BF provided at the B pixel of the image sensor 44 mainly transmits light in the blue band, specifically, light in the wavelength band of 380 to 560 nm (blue transmission band).
- the peak wavelength at which the transmittance is maximum is around 460 to 470 nm.
- the G color filter GF provided in the G pixel of the image sensor 44 mainly transmits light in the green band, specifically, light in the wavelength band of 450 to 630 nm (green transmission band).
- the R color filter RF provided in the R pixel of the image sensor 44 mainly transmits light in the red band, specifically, light in the range of 580 to 760 nm (red transmission band).
- the imaging control unit 45 controls the imaging sensor 44 to capture reflected light from a subject illuminated with white light for each frame.
- a Bc image signal is output from the B pixel of the image sensor 44
- a Gc image signal is output from the G pixel
- an Rc image signal is output from the R pixel of the image sensor 44.
- the imaging control unit 45 controls the imaging sensor 44 to capture the reflected light from the subject illuminated with the first illumination light or the second illumination light for each frame. Control. With such control, in the oxygen saturation mode of the first embodiment, as shown in FIG. For each frame including the period P1, a B1 image signal, a G1 image signal, and an R1 image signal are output from the B pixel, the G pixel, and the R pixel of the image sensor 44, respectively.
- the B2 image signal is transmitted from the B pixel of the image sensor 44 to the G A G2 image signal is output from each pixel, and an R2 image signal is output from each R pixel.
- the imaging control unit 45 controls the imaging so that the reflected light from the subject illuminated with the first illumination light, the second illumination light, or the third illumination light is photographed frame by frame. Controls the sensor 44. With such control, in the correction mode of the first embodiment, as shown in FIG. 20, the first illumination period P1 in which the first illumination light including the first blue light BL, green light G and red light R is emitted. A B1 image signal is output from the B pixel of the image sensor 44, a G1 image signal is output from the G pixel, and an R1 image signal is output from the R pixel of the image sensor 44.
- the B2 image signal is transmitted from the B pixel of the image sensor 44 to the G A G2 image signal is output from each pixel, and an R2 image signal is output from each R pixel.
- the B3 image signal is transmitted from the B pixel of the image sensor 44, the G3 image signal is transmitted from the G pixel, and the G3 image signal is transmitted from the R pixel of the image sensor 44.
- Each image signal is output. 18, 19, and 20 illustrate the relationship between illumination light emitted during one illumination period and image signals output in a frame including one illumination period.
- the characteristics of each image signal output in each mode, the oxygen saturation calculation table, and the correction process will be explained.
- the oxygen saturation mode among the image signals output in the oxygen saturation mode, the B1 image signal, the G2 image signal, and the R2 image signal are used to calculate the oxygen saturation.
- the B1 image signal, G2 In addition to the image signal and the R2 image signal, a B3 image signal and a G3 image signal are used.
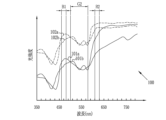
- the wavelength band of the first illumination light emitted toward the biological tissue to be observed and the reflected light obtained by illuminating the biological tissue using the first illumination light are Of these, the hemoglobin reflection spectrum, which indicates the relationship between the light intensity of the reflected light from deoxyhemoglobin (Hb) and oxidized hemoglobin (HbO 2 ) in living tissue, changes depending on the blood concentration. Blood concentration means the concentration of hemoglobin (amount of hemoglobin) contained in living tissue. Note that reduced hemoglobin (Hb) is hemoglobin that is not bonded to oxygen (O 2 ). Furthermore, oxyhemoglobin (HbO 2 ) is hemoglobin that is bound to oxygen (O 2 ).
- the hemoglobin reflection spectrum 100 when the specific dye is not contained in the living tissue is represented by a curve as shown in FIG. 21.
- curves 101a and 101b shown by solid lines represent the reflection spectra of hemoglobin when the blood concentration is high.
- the curve 101a represents the reflection spectrum of deoxyhemoglobin (Hb) when the blood concentration is high
- the curve 101b represents the reflection spectrum of oxyhemoglobin ( HbO2 ) when the blood concentration is high.
- curves 102a and 102b shown by broken lines represent the reflection spectra of hemoglobin when the blood concentration is low.
- the curve 102a represents the reflection spectrum of deoxyhemoglobin (Hb) when the blood concentration is low
- the curve 102b represents the reflection spectrum of oxyhemoglobin ( HbO2 ) when the blood concentration is low.
- the B1 image signal is the light that has passed through the B color filter BF among the reflected light that is reflected by illuminating the subject with the first illumination light that includes the first blue light BL having a center wavelength of 470 nm ⁇ 10 nm. This is an image signal output from the B pixel when the B pixel is photographed. Therefore, from the relationship between the wavelength band of the first blue light BL (see FIG. 11) and the transmission band of the B color filter BF of the image sensor 44 (see FIG. 17), the B1 image signal has the wavelength shown in FIG. Contains information on band B1.
- the wavelength band B1 corresponds to deoxyhemoglobin (Hb) and oxidized hemoglobin (HbO 2 ), which are shown by curves 101a and 101b (when the blood concentration is high) or curves 102a and 102b (when the blood concentration is low) in FIG.
- This is a wavelength band (460 nm to 480 nm) in which there is a large difference in reflection spectra.
- the G2 image signal is generated from the G pixel by the image sensor 44 capturing the light that has passed through the G color filter GF, out of the reflected light that is reflected by illuminating the subject with the second illumination light that includes the green light G. This is the image signal to be output. Therefore, from the relationship between the wavelength band of the green light G (see FIG. 12) and the transmission band of the G color filter GF of the image sensor 44 (see FIG. 17), the G2 image signal is generated in the wavelength band G2 shown in FIG. Contains information.
- the R2 image signal is generated from the R pixel by the image sensor 44 capturing the light that has passed through the R color filter RF, out of the reflected light that is reflected by illuminating the subject with the second illumination light that includes the red light R. This is the image signal to be output. Therefore, from the relationship between the wavelength band of the red light R (see FIG. 12) and the transmission band of the R color filter RF of the image sensor 44 (see FIG. 17), the R2 image signal is divided into the wavelength band R2 shown in FIG. Contains information.
- the observation target may include a specific pigment that is a pigment other than reduced hemoglobin (Hb) or oxidized hemoglobin (HbO 2 ) and that affects the calculation of oxygen saturation.
- the specific dye is, for example, a yellow dye.
- FIG. 22(A) shows an example of a hemoglobin reflection spectrum 103 when a specific dye is contained in a living tissue.
- FIG. 22(A) shows the reflection spectrum of deoxyhemoglobin (Hb) when the blood concentration is high (curve 101a) and the reflection spectrum of oxyhemoglobin (HbO 2 ) when the blood concentration is high.
- the reflection spectra are shown.
- wavelength band B1, wavelength band G2, and wavelength band R2 shown in FIG. 21 are shown.
- the absorption spectrum of the yellow dye is large. Therefore, when the observation target is illuminated with the first illumination light including the first blue light BL with a center wavelength of 470 nm ⁇ 10 nm, a part of the first illumination light (especially the first blue light BL) is converted into yellow pigment. It gets absorbed.
- wavelength band B3 and wavelength band G3 shown in FIG. 22(B) are bands in which the influence of the yellow pigment on the hemoglobin reflection spectrum is smaller than in wavelength band B1. Wavelength band B3 and wavelength band G3 will be explained in detail later.
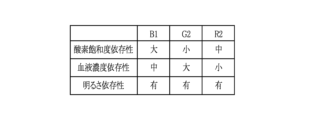
- the B1 image signal, G2 image signal, and R2 image signal which are image signals output from the image sensor 44, include oxygen saturation, blood concentration, and brightness, as shown in FIG. Both have dependencies on .
- the dependence on oxygen saturation refers to the degree of change in the signal value (or signal ratio described later) depending on the level of oxygen saturation. Gender is qualitatively expressed as “large,” “medium,” or "small.”
- dependence on blood concentration refers to the degree of change in signal values (or signal ratios described later) depending on the level of blood concentration. It is qualitatively expressed as “large,” “medium,” and “small.”
- dependence on brightness means whether the signal value (or signal ratio described later) changes depending on the level of brightness. If there is a brightness dependence, it is expressed as “yes,” and if there is no brightness dependence, it is expressed as “absent.”
- the oxygen saturation dependence of the B1 image signal is “large”, the blood concentration dependence is “medium”, and the brightness dependence is “present”.
- the oxygen saturation dependence of the G2 image signal is “small”
- the blood concentration dependence is “large”
- the brightness dependence is “present.”
- the oxygen saturation dependence of the R2 image signal is “medium”
- the blood concentration dependence is “small”
- the brightness dependence is “present”.
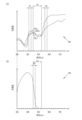
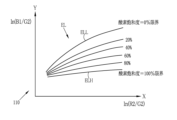
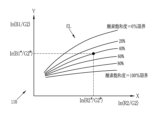
- the oxygen saturation calculation table 110 for calculating the oxygen saturation uses the G2 image signal as a normalized signal and the signal ratio ln (B1/G2) obtained by normalizing the B1 image signal with the G2 image signal. , is created based on the relationship with the signal ratio ln (R2/G2) obtained by normalizing the R2 image signal with the G2 image signal. Note that "ln" of the signal ratio ln(B1/G2) is a natural logarithm (the same applies to the signal ratio ln(R2/G2)).
- the oxygen saturation calculation table 110 is created in advance by using the correlation between the signal ratio of the experimentally acquired image signal and the oxygen saturation, and is stored in the extended processor device 17.
- the image signal for generating the oxygen saturation calculation table 110 is obtained by preparing a plurality of phantoms imitating a living body having a certain oxygen saturation according to multiple levels of oxygen saturation, and photographing each phantom. obtained by. Further, the correlation between the signal ratio of the image signal and the oxygen saturation may be obtained in advance by simulation.
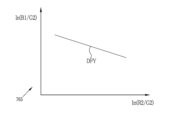
- the correlation between the signal ratio ln(B1/G2) and the signal ratio ln(R2/G2) and the oxygen saturation is shown with the signal ratio ln(R2/G2) on the X axis and the signal ratio ln(B1/G2) on the Y axis.
- contour lines EL When expressed in a two-dimensional coordinate system of axes, it is expressed as contour lines EL on the oxygen saturation calculation table 110 as shown in FIG.
- the contour line ELH is a contour line indicating that the oxygen saturation level is "100%”.
- the contour line ELL is a contour line indicating that the oxygen saturation level is "0%”.
- the contour lines are distributed such that the oxygen saturation gradually decreases from the contour ELH to the contour ELL (in FIG. contour lines are drawn for ⁇ 80%'', ⁇ 60%'', ⁇ 40%'', and ⁇ 20%'').
- the value of the X component (signal ratio ln(R2/G2)) and the value of the Y component (signal ratio ln(B1/G2)) represent oxygen saturation dependence and blood concentration dependence, respectively.
- the brightness dependence is determined to be "none”.
- oxygen saturation dependence is "medium”
- blood concentration dependence is "large”.
- the value of the Y component has a "high” oxygen saturation dependence and a "medium” blood concentration dependence.
- the B1 image signal, G2 image signal, and R2 image signal have dependence on yellow pigment (yellow pigment dependence).
- Yellow pigment dependence refers to the degree of change in signal value (or signal ratio) depending on the level of yellow pigment concentration. Expressed qualitatively.
- FIG. 26 shows the dependence of image signals on yellow pigment.
- the yellow pigment dependence of the B1 image signal (indicated by "B1" in FIG. 26) is "large”. This is because, as shown in FIG. 22(A), when yellow pigment is present, the reflection spectrum of deoxyhemoglobin (Hb) in the wavelength band B1 becomes smaller, so that the signal value of the B1 image signal increases. This is because it decreases.
- the yellow pigment dependence of the G2 image signal is “small to medium”.
- the dependence of the R2 image signal (indicated by "R2" in FIG. 26) on the yellow dye is "small".
- the value of the Y component (signal ratio ln (B1/G2)) also decreases. Therefore, as shown in FIG. 27, in the oxygen saturation calculation table 110, due to the presence of the yellow pigment, the oxygen saturation StO 2 A when the yellow pigment is present is higher than the oxygen saturation StO 2 A when the yellow pigment is not present.
- the saturation StO 2 B is calculated so that the oxygen saturation appears to be high.
- a B3 image signal and a G3 image signal are further acquired by photographing the reflected light obtained by illuminating the subject with the third illumination light.
- the B3 image signal is an image signal output from the B pixel when the image sensor 44 captures the light that has passed through the B color filter BF among the reflected light obtained by illuminating the subject with the third illumination light. be. Therefore, from the relationship between the wavelength band of the green light G (see FIG. 13) and the transmission band of the B color filter BF of the image sensor 44 (see FIG. 17), the B3 image signal is as shown in FIG. 22(B). Contains information on wavelength band B3.
- the G3 image signal is output from the G pixel by the image sensor 44 capturing the light that has passed through the G color filter GF among the reflected light obtained by illuminating the subject with the third illumination light consisting of green light G. This is the image signal to be used. Therefore, from the relationship between the wavelength band of the green light G (see FIG. 13) and the transmission band of the G color filter GF of the image sensor 44 (see FIG. 17), the G3 image signal is as shown in FIG. 22(B). Contains information on wavelength band G3.
- the B3 image signal and the G3 image signal like the B1 image signal, G2 image signal, and R2 image signal, have oxygen saturation dependence, blood concentration dependence, and brightness dependence. Depends on yellow pigment.
- the oxygen saturation dependence of the B3 image signal (indicated by “B3” in FIG. 28) is “small”
- the blood concentration dependence is “large”
- the yellow pigment dependence is “medium”
- Brightness dependence is “yes”.
- the G3 image signal indicated by “G3” in FIG. 28
- the oxygen saturation dependence is "small”
- the blood concentration dependence is “large
- the yellow pigment dependence is "large”
- brightness dependence is "Yes”.
- the B2 image signal since the B2 image signal also has "high” yellow pigment dependence, the B2 image signal may be used instead of the B3 image signal during the correction process. Further, as shown in FIG. 28, the oxygen saturation dependence of the B2 image signal is "small,” the blood concentration dependence is “large,” and the brightness dependence is "present.”
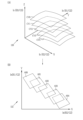
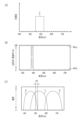
- a corrected oxygen saturation calculation table 120 as shown in FIG. 29 is used to calculate the oxygen saturation in consideration of the concentration of the specific dye.
- the corrected oxygen saturation calculation table 120 shows the relationship between the signal ratio ln (B1/G2), the signal ratio ln (R2/G2), the signal ratio ln (B3/G3), and the oxygen saturation according to the concentration of the specific dye. This is a table representing correlation.
- the signal ratio ln(B3/G3) is a signal ratio obtained by normalizing the B3 image signal with the G3 image signal. Note that, like the oxygen saturation calculation table 110, the corrected oxygen saturation calculation table 120 is created in advance and stored in the extended processor device 17.
- the corrected oxygen saturation calculation table 120 has the signal ratio ln(R2/G2) on the X axis, the signal ratio ln(B1/G2) on the Y axis, and the signal ratio ln(B3 /G3) as the Z-axis, curved surfaces CV0 to CV4 representing oxygen saturation are distributed in the Z-axis direction according to the concentration of the yellow pigment (hereinafter referred to as the first pigment value). Ru.
- the curved surface CV0 represents the oxygen saturation when the first pigment value is "0" (when there is no yellow pigment, or there is a very small amount of yellow pigment, so there is no effect on the calculation of oxygen saturation). ing.
- Curved surfaces CV1 to CV4 represent the oxygen saturation when the first dye value is “1" to "4", respectively.
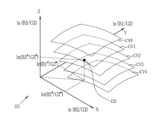
- the three-dimensional coordinates have the signal ratio ln(R2/G2) as the X axis, the signal ratio ln(B1/G2) as the Y axis, and the signal ratio ln(B3/G3) as the Z axis.
- the oxygen saturation (curved surfaces CV0 to CV4) according to the first dye value expressed in the system is expressed as
- regions AR0 to AR4 representing oxygen saturation are distributed at different positions depending on the first dye value. Regions AR0 to AR4 represent the distribution of oxygen saturation when the first dye value is "0" to "4", respectively.
- the oxygen saturation corresponding to the concentration of the yellow pigment can be determined. Note that, as shown in the regions AR0 to AR4, the larger the first dye value, the higher the value on the X axis and the lower the value on the Y axis.
- FIG. G3 has oxygen saturation dependence, blood concentration dependence, and yellow pigment dependence, respectively.
- the dependence of the value of the X component on the yellow dye is "small to medium”
- the dependence of the value of the Y component on the yellow dye is "large”
- the dependence of the value of the Z component on the yellow dye is "medium”.
- the oxygen saturation dependence is "small to medium”
- the blood concentration dependence is “small to medium.”
- Gender is “nothingness”.
- the "correction processing" in the correction mode of the first embodiment means that in addition to the image signal acquired in the oxygen saturation mode, the image signal has yellow pigment dependence, and has oxygen saturation dependence and blood concentration dependence.
- This is a process of further acquiring different image signals, referring to the corrected oxygen saturation calculation table 120 expressed in a three-dimensional coordinate system, and selecting the oxygen saturation calculation table according to the specific dye concentration. By switching to the oxygen saturation mode again after completing the correction process, more accurate oxygen saturation can be calculated using the oxygen saturation calculation table according to the specific pigment concentration of the tissue being observed.
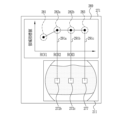
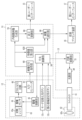
- the extended processor device 16 includes an oxygen saturation image generation section 130, a corrected oxygen saturation calculation section 140, a table correction section 141, an extended central control section 150, a reliability calculation section 160, and a correction determination section 170. , an extended display control section 200, a region of interest setting section 210, a region position information storage section 240, a region index value calculation section 250, an index value display table generation section 260, and a display image generation section 270.
- programs related to various processes are incorporated in a program memory (not shown).
- the extended central control unit 150 constituted by a processor
- the oxygen saturation image generation unit 130 the corrected oxygen saturation calculation unit 140
- the table correction unit 141 the reliability calculation unit 160
- the functions of the correction determination section 170, extended display control section 200, region of interest setting section 210, region position information storage section 240, region index value calculation section 250, index value display table generation section 260, and display image generation section 270 are realized. .
- the oxygen saturation image generation section 130 includes a base image generation section 131, a calculated value calculation section 132, an oxygen saturation calculation section 133, and a color tone adjustment section 134.
- the base image generation unit 131 generates a base image based on the image signal transmitted from the image communication unit 90 of the processor device 14.
- the base image is preferably an image that allows morphological information such as the shape of the observation target to be grasped.
- the base image is a white light equivalent image generated using a B2 image signal, a G2 image signal, and an R2 image signal.
- the base image may be a narrowband light image obtained by illuminating a subject with narrowband light, in which blood vessels, glandular duct structures, etc. are highlighted.
- the calculated value calculation unit 132 calculates a calculated value through calculation processing based on the image signal transmitted from the image communication unit 90. Specifically, the calculated value calculation unit 132 uses the signal ratio B1/G2 between the B1 image signal and the G2 image signal and the signal ratio between the R2 image signal and the G2 image signal as the calculated values used to calculate the oxygen saturation level. Calculate R2/G2. Furthermore, in the correction mode, a signal ratio B3/G3 between the B3 image signal and the G3 image signal is calculated. Note that it is preferable that the signal ratio B1/G2, the signal ratio R2/G2, and the signal ratio B3/G3 be further logarithmized (ln). In addition, as the calculated values, color difference signals Cr, Cb, saturation S, hue H, etc. that are converted and calculated using the B1 image signal, G2 image signal, R2 image signal, B3 image signal, or G3 image signal are used. Good too.
- the oxygen saturation calculation unit 133 calculates the oxygen saturation using the calculated value and by referring to the oxygen saturation calculation table 110 (see FIG. 24).
- the oxygen saturation calculation unit 133 refers to the oxygen saturation calculation table 110 and calculates the oxygen saturation corresponding to the signal ratios B1/G2 and R2/G2 for each pixel. For example, as shown in FIG. 32, when the signal ratio of a specific pixel is ln(B1 * /G2 * ) and ln(R2 * /G2 * ), the signal ratio is ln(B1 * /G2 * ). , ln(R2 * /G2 * ) is "40%". In this case, the oxygen saturation calculation unit 133 calculates the oxygen saturation of the specific pixel as "40%". Note that oxygen saturation is one of the biometric index values described later, which is a value indicating the state of an observation target, which is a subject.
- the color tone adjustment unit 134 generates an oxygen saturation image by performing color tone adjustment processing using the oxygen saturation calculated by the oxygen saturation calculation unit 133.
- an oxygen saturation image is generated by pseudo color processing in which a color is assigned according to the oxygen saturation level.
- pseudo-color processing a base image is not required.
- a threshold value for oxygen saturation image generation is set in advance, and for pixels whose oxygen saturation is equal to or higher than the oxygen saturation image generation threshold value in the base image, the color tone is maintained and the oxygen saturation image generation threshold value is set in advance. For pixels whose saturation is less than the oxygen saturation image generation threshold, an oxygen saturation image is generated by performing a process of changing the color tone according to the oxygen saturation.
- the color tone of areas where oxygen saturation is relatively high (above the oxygen saturation image generation threshold) is maintained, while the color tone of areas where oxygen saturation is relatively low (oxygen saturation
- the color tone of areas where oxygen saturation is relatively low oxygen saturation
- tissue will coalesce at the site where the incision and sutures were made, leading to healing.
- tissue at the sutured site becomes incompletely fused for some reason, suturing failure may occur in which part or all of the sutured site separates again.
- Suture failure is known to occur in areas of low oxygen saturation or congestion. Therefore, by displaying the oxygen saturation image, it is possible to support the user in determining the resection site or anastomosis site that is unlikely to cause suturing failure after surgery.
- the index value display table (described later) and the oxygen saturation image side by side, in addition to expressing the oxygen saturation using color tones, the actual value of the oxygen saturation is shown to the user, allowing the user to more accurately In addition, it is possible to easily support the determination of a region suitable for incision or anastomosis.
- the corrected oxygen saturation calculation unit 140 performs correction processing using the calculated value and by referring to the corrected oxygen saturation calculation table 120 (see FIG. 29(A)). Note that among the calculated values, the calculation and logarithmization of the signal ratio B3/G3 may be performed by the corrected oxygen saturation calculation unit 140.
- the table correction unit 141 performs a table correction process in which the oxygen saturation calculation table is set as the oxygen saturation calculation table selected by referring to the corrected oxygen saturation calculation table 120. conduct.
- table correction processing for example, when the first dye value is "2", the areas AR0 to AR4 (corrected oxygen saturation calculation table 120) defined according to the first dye value shown in FIG. Among the curved surfaces CV0 to CV4), the oxygen saturation calculation table in which the contour lines EL as shown in FIG. 33(B) are drawn and the area AR2 corresponding to the first dye value "2" is selected.
- the table correction unit 141 corrects the oxygen saturation calculation table 110 so that the oxygen saturation calculation table 110 referred to in the oxygen saturation calculation unit 133 is the oxygen saturation calculation table that is the area AR2. .
- the correction process may be performed for each pixel of the endoscopic image, or may be performed for each pixel in a specific area, which will be described later.
- the value of the X component (signal ratio ln(R2/G2)) and the value of the Y component (signal ratio ln (B1/G2)) and the value of the Z component (signal ratio ln(B3/G3)).
- the signal ratio ln(R2/G2) is set on the X axis
- the signal ratio ln(B1/G2) is set on the Y axis
- the signal ratio ln In a three-dimensional coordinate system with (B3/G3) as the Z axis, the value of the X component (signal ratio ln(R2/G2)), the value of the Y component (signal ratio ln(B1/G2)), and the value of the Z component. (signal ratio ln(B3/G3)) and the oxygen saturation is calculated using a table for calculating the corrected oxygen saturation, which takes into account the influence of the specific dye. You can do it like this. Note that in such a table for calculating corrected oxygen saturation, contour lines or spaces indicating the same oxygen saturation are three-dimensionally distributed in a three-dimensional coordinate system.
- the signal ratio is the signal ratio ln(R2 * /G2 * ), ln(B1 * /G2 * ), ln(B3 * /G3 * ), the signal ratio ln(R2 * /G2 * ), ln
- the corrected oxygen saturation at the point 123 corresponding to (B1 * /G2 * ) and ln(B3 * /G3 * ) is calculated as the oxygen saturation.
- some of the image signals obtained in the correction mode may be used.
- a part of the image signal refers to an image signal in a specific area of the correction image to be described later.
- the specific region be a region that is less affected by disturbances that affect the accuracy of oxygen saturation calculation. In order to determine the degree of influence of disturbance in a specific area, the reliability of the image signal in the specific area is calculated.
- the extended central control unit 150 of the extended processor device 16 sets a lower limit value and an upper limit channel threshold value for each channel (B channel, G channel, R channel) of each pixel. If the pixel values of all channels are greater than or equal to the channel lower limit value for each color and less than the channel upper limit value, that pixel is determined to be a valid pixel and is used as the pixel for reliability calculation. .
- Disturbances include halation, dark areas, bleeding, fat, and mucous membranes that can cause a decrease in the accuracy of calculating oxygen saturation, other than specific pigments among the observation objects shown in the endoscopic image taken by the endoscope 12. These are deposits on the surface, etc.
- Halation and dark areas are related to the brightness of endoscopic images. Halation is an area where an image is blown out due to strong light entering the image sensor 44.
- a dark area is an area where illumination light is difficult to reach due to shadows of in-vivo structures such as folds and colonic flexures, treatment instruments, etc., or because it is deep in the lumen, and the image is dark.
- Bleeding includes external bleeding into the extraserosal (intraperitoneal) or gastrointestinal lumen, and internal bleeding within the mucous membranes.
- Fat includes fat observed extraserally (intraperitoneal), such as the greater omentum, lesser omentum, and mesentery, and fat observed on the mucosal surface of the lumen of the gastrointestinal tract.
- Deposits on the surface of mucous membranes include deposits of biological origin such as mucus, blood, and exudates; This includes deposits that are leftover liquid or residue mixed with kimono.
- a correction image 161 as shown in FIG. 35 is displayed on the display at the timing of switching to the correction mode. Display of the correction image 161 is controlled by the extended display control section 200. In the correction image 161, a specific area 162 is displayed in a manner that is visible to the user.
- the shape of the specific region 162 is not limited to a circular shape as shown in FIG. 35. Further, the position of the specific area 162 is not limited to the center of the image as shown in FIG. 35. For example, a donut-shaped area excluding the periphery of the correction image 161, where the influence of distortion is large due to the curvature of the lens, and the center of the correction image 161, which is a dark area because it corresponds to the back of the lumen, is designated as a specific area. You can also use it as Note that the correction image is preferably a color image (for example, a white light equivalent image) generated using the B2 image signal, the G2 image signal, and the R2 image signal. The correction image may be an image generated using other image signals.
- a color image for example, a white light equivalent image
- the reliability calculation unit 160 of the extended processor device 16 calculates the Based on this, reliability is calculated for each pixel included in the specific area 162. Note that the input of the reliability calculation instruction may be performed according to an input instruction via the user interface, or may be performed automatically at the same timing as the control for displaying the correction image 161.
- the reliability includes (1) reliability regarding the brightness of the endoscopic image, (2) reliability based on the degree of bleeding contained in the endoscopic image, and (3) degree of fat contained in the endoscopic image. There are reliability etc.
- the reliability calculation unit 160 uses the G1 image signal to calculate the reliability by referring to the first reliability calculation table 163 as shown in FIG.
- the first reliability calculation table 163 is a table generated in advance that shows the relationship between the signal value of the G1 image signal and the reliability.
- the signal value of the G1 image signal is, for example, a luminance value obtained by performing conversion processing using the G1 image signal.
- the reliability is calculated as a value between 0 and 1.
- the reliability when the signal value of the G1 image signal is outside the fixed range Rx is lower than the reliability when the luminance value of the G1 image signal is within the fixed range Rx. It has become.
- the signal value of the G1 image signal when the signal value of the G1 image signal is outside the fixed range Rx, it means that the pixel contains halation, has a high luminance value, or contains a dark part in a specific area, which causes minimal luminance. For example, when the value is a value.
- the G2 image signal may be used instead of the G1 image signal to calculate the reliability regarding brightness (see FIG. 102 described later).
- the reliability calculation unit 160 uses the signal ratio ln(R2/G2) and the signal ratio ln(B2/G2) and refers to the second reliability calculation table 164 as shown in FIG. Calculate reliability.
- the definition line DFX is plotted in a two-dimensional coordinate system in which the X axis is ln(R2/G2) and the Y axis is the signal ratio ln(B2/G2).
- coordinates (X2, Y2) (ln(R2/G2), ln( B2/G2)) is calculated so that the lower the right position in the second reliability calculation table 164, the lower the reliability.
- the reliability based on the degree of bleeding is set to a fixed value that is highly reliable.
- the signal ratio ln(R2/G2) is a value obtained by normalizing the R2 image signal with the G2 image signal and converting it into a logarithm.
- the signal ratio ln(B2/G2) is a value obtained by normalizing the B2 image signal with the G2 image signal and converting it into a logarithm.
- the reliability calculation unit 160 uses the signal value ln(R1/G1) and the signal ratio ln(B1/G1) and refers to the third reliability calculation table 165 as shown in FIG. Calculate reliability.
- the definition line DFY is plotted in a two-dimensional coordinate system in which the X axis is ln(R1/G1) and the Y axis is the signal ratio ln(B1/G1).
- coordinates (X3, Y3) (ln (R1/G1), ln ( B1/G1)) is calculated so that the lower the left position in the third reliability calculation table 165, the lower the reliability.
- the reliability based on the degree of fat is set to a fixed value that is highly reliable.
- the signal ratio ln(R1/G1) is a value obtained by normalizing the R1 image signal with the G1 image signal and converting it into a logarithm.
- the signal ratio ln(B1/G1) is a value obtained by normalizing the B1 image signal with the G1 image signal and converting it into a logarithm.
- the value of the X component can be changed to the signal value ln(R2/G2), and the value of the Y component can be changed to the signal ratio.
- the reliability calculation unit 160 calculates at least one of the reliability regarding brightness (first reliability), the reliability regarding the degree of bleeding (second reliability), and the reliability regarding the degree of fat (third reliability). Calculate more than one confidence level.
- the calculated reliability is used for notification to prevent a region with low reliability from entering a specific region, or for weighting processing of signal values of image signals used in correction processing.
- the calculated reliability is transmitted to the correction determination unit 170.
- the correction determination unit 170 uses a preset reliability determination threshold to determine the reliability calculated for each pixel in the specific area, and determines whether each pixel is a high reliability pixel or a low reliability pixel. The result of determining whether the pixel is a degree pixel is output.
- the correction determination unit 170 determines a pixel whose reliability is greater than or equal to a reliability determination threshold as a high reliability pixel, and determines a pixel whose reliability is less than a reliability determination threshold as a low reliability pixel.
- the correction determination unit 170 transmits the determination result of determining the reliability of each pixel to the extended display control unit 200.
- the extended display control unit 200 performs control to change the display mode of the correction image 161 displayed on the display according to the determination result.
- the extended display control unit 200 makes the saturation of the low reliability area 171a higher than the saturation of the high reliability area 171b in the specific area 162.
- a low reliability area is a set of pixels having low reliability pixels.
- the high reliability area is a set of pixels having high reliability pixels.
- the reliability level used for the determination of the reliability level is the first reliability level, the second reliability level, or the third reliability level.
- the lowest reliability level may be used.
- a reliability determination threshold may be set for each reliability. For example, a first reliability determination threshold for the first reliability, a second reliability determination threshold for the second reliability, and a third reliability determination threshold for the third reliability are set in advance, and any of the reliability is less than a reliability determination threshold, the pixel whose reliability has been calculated may be determined to be a low reliability pixel.
- the correction determination unit 170 may further perform determination on the number of high reliability pixels with respect to the reliability calculated for each pixel.
- the extended display control unit 200 determines whether the high-reliability pixels in the specific area are equal to or greater than the threshold for determining the number of high-reliability pixels and when the number of high-reliability pixels in the specific area is less than the threshold for determining the number of high-reliability pixels. Change the display mode. For example, if the high reliability pixels in a specific area are equal to or higher than the threshold for determining the number of high reliability pixels, the specific area is highlighted by surrounding it with a frame 172 of the first determination result color, as shown in FIG. A correction image 161 is displayed. By highlighting the specific area by surrounding it with a frame of the first determination result color, it is possible to notify the user that the correction process can be performed with less influence of disturbance.
- the specific area is highlighted by surrounding it with a frame of a second judgment result color that is different from the first judgment result color.
- the corrected image 161 may be displayed.
- the extended display control unit 200 determines whether the number of low reliability pixels in the specific area is equal to or greater than the threshold for determining the number of low reliability pixels;
- the display mode of the specific area may be changed depending on whether the number of pixels is less than the threshold for determining the number of low reliability pixels.
- the threshold for determining the number of reliable pixels threshold for determining the number of high reliability pixels or the threshold for determining the number of low reliability pixels
- the display mode of the image for correction is determined according to the number of pixels with high or low reliability. By changing this, it is possible to notify the extent to which disturbance is included in a specific area and prompt the user to operate the endoscope in order to appropriately perform correction processing.
- the correction determination unit 170 determines the reliability of each pixel in the specific area using the reliability determination threshold and/or the reliability pixel number determination threshold, and determines that the influence of disturbance in the specific area is small.
- a message indicating that the correction process can be appropriately performed may be displayed on the correction image 161.
- a message MS1 such as "Correction processing will be performed properly" is displayed superimposed on the correction image 161.
- the correction determination unit 170 determines the reliability of each pixel in the specific area using the reliability determination threshold and/or the reliability pixel count determination threshold, and if the specific area includes a low reliability area, Alternatively, a warning may be displayed when the number of low-reliability pixels is equal to or greater than a threshold for determining the number of reliability pixels. For example, as shown in FIG. 42, a message MS2 such as "Please operate the endoscope for correction processing" is displayed superimposed on the correction image 161. Furthermore, if it is determined that the reliability of brightness has a particularly large influence, a message MS3 such as "Please avoid dark areas" may be superimposed on the correction image 161 as shown in FIG. good.
- the user is notified that a specific area includes a low-reliability area that contains relatively many disturbances, or correction processing can be performed appropriately. This can be reported. Note that in addition to the images displayed on the display, audio notifications may also be provided.
- the user can be encouraged to operate the endoscope 12 while observing the correction image 161 so that an area less affected by disturbances is within the specific area 162. . That is, the user can be prompted to operate the endoscope 12 so that the low reliability area does not enter the specific area as much as possible, and the high reliability area enters the specific area as much as possible.
- the correction process in the correction mode is performed.
- the reliability of each pixel in the specific area is determined using the reliability determination threshold and/or the reliability pixel number determination threshold, and it is determined that the influence of disturbance in the specific area 162 is small, the user's input The correction process may be automatically executed without any operation.
- the reliability in a specific area is calculated as an internal process of the extended processor device 16, and the image signal in the specific area is determined after determining the reliability for each pixel.
- the correction process may be performed using the data.
- display control is performed to prompt the user to switch to oxygen saturation mode.
- the mode may be automatically switched to the oxygen saturation mode without such a display.
- weighting is applied to the signal values of the B2 image signal, G2 image signal, R2 image signal, B3 image signal, and/or G3 image signal using the reliability calculated for each pixel in a specific area. By performing the process, the reliability may be reflected in the correction process.
- the average value (average signal value) of the B2 image signal, G2 image signal, R2 image signal, B3 image signal and/or G3 image signal in the specific area is used to value (signal ratio ln(R2/G2)), Y component value (signal ratio ln(B1/G2)), and Z component value (signal ratio ln(B3/G3)), the average signal value
- the weighted average value that has been subjected to weighting processing may be used to calculate the X component value, the Y component value, and the Z component value.
- the extended processor device 16 includes a region of interest setting section 210, a region position information storage section 240, a region index value calculation section 250, an index value display table generation section 260, a display image generation section 270, and an extended display control section 200. Further, it may include a region index value storage section 280 and/or an index value link line generation section 290, which will be described later.
- the region of interest setting unit 210 sets a region of interest in the endoscopic image displayed on the first user interface or the second user interface.
- a region of interest is a region of an endoscopic image that is a target for calculating a region index value.
- a region index value is a statistical value of a biometric index value calculated based on an image signal in a region of interest.
- the biometric index value is a value indicating the state of an observation target, which is a subject, and specifically, it is an oxygen saturation level, a hemoglobin index, and a combination index. The biometric index value and the region index value will be described later.
- a specific example (1) is a case where the endoscopic image for setting the region of interest is an oxygen saturation image.
- a specific example (2) is a case where the endoscopic image for setting the region of interest is a white light equivalent image.
- a specific example (3) is a case where the endoscopic image for setting the region of interest is a white light image.
- an oxygen saturation image 202 as shown in FIG. 43(A) is displayed on the display.
- a region of interest setting instruction is input to the extended processor device 16 via the central control unit 50 of the processor device 13.
- the region of interest setting unit 210 that receives the region of interest setting instruction sets regions of interest 212a, 212b, and 212c on the endoscopic image (oxygen saturation image 202), for example, as shown in FIG. 43(B). .
- a plurality of regions of interest are set at different positions on the endoscopic image.
- the reference numeral of the object Ob will be omitted to avoid cluttering the figures.
- regions of interest or region position information to be described later are drawn in a straight line for simplicity, but it is preferable that the set regions of interest are not aligned in a straight line.
- region of interest image 211 An endoscopic image in which regions of interest 212a, 212b, and 212c are set (hereinafter referred to as region of interest image 211) as shown in FIG.
- region of interest image 211 An endoscopic image in which regions of interest 212a, 212b, and 212c are set (hereinafter referred to as region of interest image 211) as shown in FIG.
- region of interest image 211 under the display control of the extended display control unit 200, as shown in FIG. 44, it is displayed on the display that is the second user interface.
- a region of interest image 211 in which a region of interest is set in an oxygen saturation image is displayed on the display that is the second user interface 17
- a white light equivalent image 201 is displayed on the display that is the first user interface 15. .
- the region of interest setting unit 210 displays a region of interest at a preset position on the endoscopic image.
- the number and positions of regions of interest on the endoscopic image are set in advance.
- “three" regions of interest are set in advance.
- "setting positions" of the three regions of interest 212a, 212b, and 212c are set in advance.
- the number of regions of interest can be arbitrarily set as a natural number of 2 or more.
- the position of the region of interest can be set arbitrarily. The reason why a plurality of regions of interest are set at different positions is to calculate region index values in regions of interest located at spatially distant positions.
- spatially distant positions mean different positions in the living tissue, and by setting regions of interest at mutually different positions on the living tissue, spatial changes in index values, i.e., different positions in the living tissue. It is possible to grasp the index values in the region of interest set in , and the changes in these index values.
- the position of the region of interest is stored in the region position information storage unit 240 as a plurality of pieces of region position information. That is, the positions of multiple regions of interest in the region of interest image become region position information.
- the position of the region of interest refers to coordinate information of the region of interest in the endoscopic image.
- the area location information storage unit 240 may be located in the extended processor device 16 or may be a storage located outside the extended processor device 16.
- the operation of the region of interest setting switch 12d may be a pressing operation of the region of interest setting switch 12d provided on the endoscope 12 or a foot switch that is a user interface, and may be performed by pressing the region of interest setting switch 12d provided on the endoscope 12 or a foot switch that is a user interface. It may also be a selection operation such as clicking or tapping a switch for setting the region of interest (User Interface).
- biometric index values are calculated based on image signals within the regions of interest 212a, 212b, and 212c.
- the calculated biometric index value in the region of interest is transmitted to the region index value calculation unit 250.
- the oxygen saturation is measured in almost real time based on the B1 image signal, B2 image signal, G2 image signal, R2 image signal, etc.
- a hemoglobin index or a combination index may be calculated as the biological index value.
- a hemoglobin index indicating the blood concentration of the subject may be calculated based on the B1 image signal, B2 image signal, G2 image signal, R2 image signal, etc. that have blood concentration dependence.
- a combination index which is a biological index value that combines oxygen saturation and hemoglobin index, may be calculated.
- the combination index is calculated using a combination index calculation table 350 as shown in FIG.
- the combination index calculation table 350 since threshold values are provided for oxygen saturation and hemoglobin index, the values are set to "1", “2", “3”, or "4" depending on the level of oxygen saturation and hemoglobin index.
- a combination index which is the value of , can be determined.
- the combination index is It becomes "1". Further, the combination index is "2" when the oxygen saturation is less than the oxygen saturation threshold Th1 and the hemoglobin index threshold is greater than or equal to the hemoglobin index threshold Th2. The combination index is "3" when the oxygen saturation is less than the oxygen saturation threshold Th1 and the hemoglobin index threshold is less than the hemoglobin index threshold Th2. The combination index is "4" when the oxygen saturation is greater than or equal to the oxygen saturation threshold Th1 and the hemoglobin index threshold is less than the hemoglobin index threshold Th2.
- Pixels or regions with a combination index of "1", “2" or “3” have low oxygen saturation or congestion, and are at risk of suture failure.
- a pixel or region with a combination index of "4" is a region with high oxygen saturation, low hemoglobin index, non-congestion, and low risk of suture failure.
- biometric index value selection screen 351 as shown in FIG. 46 may be displayed on the display, and a biometric index value to be calculated may be selected by operating a radio button 352 that is a GUI.
- oxygen saturation and hemoglobin index are selected as the biometric index values to be calculated.
- the oxygen saturation is calculated by the oxygen saturation calculation unit 133.
- a biometric index value calculation section (not shown) may be provided in the extended processor device 16, and these biometric index values may be calculated by the biometric index value calculation section.
- the region index value calculation unit 250 calculates a region index value as a statistical value of the biometric index value in the region of interest based on the biometric index value in the region of interest.
- the statistical value is an average value, median value, mode value, maximum value, minimum value, etc.
- a region index value is calculated for each region of interest. In the example shown in FIG. 43(B), region index values are calculated for each of the region of interest 212a, the region of interest 212b, and the region of interest 212c.
- the calculated area index value is sent to the index value display table generation section 260. Alternatively, the information may be transmitted to the area index value storage unit 280, which will be described later.
- the index value display table generation unit 260 generates an index value display table that summarizes a plurality of area index values to be displayed on the display image.
- the index value display table generation unit 260 generates an index value display table 261 that represents a plurality of area index values in a graph format, as shown in FIG.
- the example of the index value display table 261 shown in FIG. 47 shows an example of the index value display table 261 in which the vertical axis is the region index value and the horizontal axis is the region of interest.
- region of interest 212a is indicated as "ROI1
- region of interest 212b is indicated as “ROI2”
- region of interest 212c is indicated as “ROI3”
- polygonal lines indicate the respective region index values 251a, 251b, and 251c.
- a spark line 262 is displayed (see FIG. 43(B)). Note that "ROI” is an abbreviation for Region Of Interest, and means "region of interest.”
- spark lines may be displayed using a vertical bar graph.
- the region index value 251a of the region of interest 212a (ROI1) is "60”
- the region index value 251b of the region of interest 212b (ROI2) is "90”
- the region of interest 212c (ROI3) is ) is calculated as "90”.
- the calculated area index values 251a, 251b, and 251c may be displayed together with the spark line 262. Note that the specific example shown in FIG. 47 assumes an example in which the biometric index value is calculated as the oxygen saturation level.
- the index value display table generation unit 260 may generate an index value display table 263 that represents a plurality of area index values in a table format, as shown in FIG.
- the region index values are calculated when the region index value of the region of interest 212a is calculated as "60"
- the region index value of the region of interest 212b is calculated as "90”
- the region index value of the region of interest 212c is calculated as "90”.
- An index value display table 263 is shown in a table format.
- the index value display table generation unit 260 determines whether to generate an index value display table in a graph format or a table format, and in the case of a graph format, whether to generate a line sparkline or a vertical bar sparkline. may be set in advance or may be set by the user. When these settings are made by the user, an index value display table setting screen (not shown) may be displayed on the display, and the settings may be made by operating the GUI.
- the index value display table generated by the index value display table generation section 260 is transmitted to the display image generation section 270.
- the display image generation unit 270 generates a display image for displaying the index value display table, the endoscopic image, and the area position information. For example, when generating a display image for displaying an index value display table as shown in FIG. 47, the display image generation unit 270 generates a display image 271 as shown in FIG. 49. In the example of the display image 271 shown in FIG. 49, an endoscopic image (region of interest image 211 in which a region of interest is set in the oxygen saturation image 201, see FIG. 43(B)) and an index value display table 261 are displayed. There is. Further, in the display image 271, region position information 272a, 272b, and 272c, which is information on the position of the region of interest for which the region index value is calculated, is displayed superimposed on the endoscopic image.
- the display image generation unit 270 reads the region position information, which is the position of the region of interest in the endoscopic image, stored in the region position information storage unit 240, thereby adding the region position information stored in the region position information storage unit 240 to the endoscopic image to be displayed in the display image.
- the position of the region of interest for which the region index value is calculated is superimposed and displayed as region position information.
- region position information 272a corresponds to the region of interest 212a
- region position information 272b corresponds to the region of interest 212b
- region position information 272c corresponds to the region of interest 212c. (See FIG. 43(B) and FIG. 44).
- the generated display image is sent to the extended display control unit 200.
- the extended display control unit 200 displays the display image on the display, which is the second user interface, by performing signal processing to display the display image on the display.
- a region of interest is set in the oxygen saturation image 211, for example, as shown in FIG. displays the display image 271.
- an index value display table that displays regional index values related to multiple regions of interest in an oxygen saturation image
- the user can see the biometric index values in the oxygen saturation image that the user is observing. Spatial changes can be reported.
- the oxygen saturation mode by displaying the white light equivalent image and the display image side by side, it is possible to display an image close to white light and area indicators at multiple locations on the oxygen saturation image. The values can be displayed so that the user can easily compare them. As a result, it is possible to support the user in determining which parts are suitable candidates for incision based on the biometric index value and which parts are inappropriate for incision based on the biometric index value.
- Specific example (2) differs from specific example (1) in which a region of interest is set on an oxygen saturation image, in which a plurality of regions of interest are set on a white light equivalent image in oxygen saturation mode. Further, when finally displaying the display image, the display image generated by the display image generation unit 270 is transmitted to the display control unit 80 of the processor device 15, and the display image is transmitted to the first user interface. Display on display.
- a display image 273 is displayed on the display that is the first user interface 15, and an oxygen saturation image 202 is displayed on the display that is the second user interface 17. Ru.
- region position information 274a, 274b, and 274c indicating the position of the set region of interest is displayed superimposed on the white light equivalent image 213.
- an index value display table 264 is displayed that collectively displays region index values in the regions of interest set in the white light equivalent image 213.
- the flow from the setting of the region of interest on the white light equivalent image to the generation of the display image is the same as that of the specific example (1), so a detailed explanation will be omitted. A brief explanation will be given below.
- the positions of the plurality of regions of interest set on the white light equivalent image are each stored in the region position information storage unit 240 as region position information.
- the biometric index value is determined based on the image signal in the region of interest. is calculated.
- the region index value calculation unit 250 calculates a region index value based on the biometric index value in the region of interest.
- the index value display table generation unit 260 uses the calculated region index values for each region of interest to generate an index value display table 263 that summarizes the plurality of region index values.
- the display image generation unit 270 generates a display image for displaying the white light equivalent image 213 in which the area position information 274a, 274b, and 274c are superimposed and the index value display table 263.
- the area index values at multiple locations on the white light equivalent image and the oxygen saturation Images can be displayed so that users can easily compare them.
- Specific example (3) differs from specific example (1) and specific example (2) in that a plurality of regions of interest are set in a white light image in normal mode. Further, a region of interest setting instruction is input by operating the mode switching switch 12c instead of the region of interest setting switch 12d.
- a region of interest setting instruction is input to the extended processor device 16 using the operation of the mode switching switch 12c as a trigger, and the region of interest setting section 210 sends the endoscopic image to the white light image to the display control section 200 of the processor device.
- An instruction signal to display a region of interest image on a display serving as a first user interface is transmitted.
- a region of interest image 214 in which the endoscopic image is a white light image is displayed on the display which is the first user interface 15, and what is displayed on the display which is the second user interface 17. (The diagonal line indicates that nothing is displayed). Note that in the example shown in FIG. 52, nothing is displayed on the display that is the second user interface 17, but the white light equivalent image 201 or the oxygen saturation image 202 may be displayed. Furthermore, in this case, a region of interest is set on the white light image almost simultaneously with the mode switching.
- the flow from the setting of the region of interest on the white light image to the generation of the display image is the same as that of the specific example (1), so a detailed explanation will be omitted. A brief explanation will be given below.
- the positions of the plurality of regions of interest set on the white light image are each stored in the region position information storage unit 240 as region position information.
- the region of interest image 211 in which the region of interest is displayed on the white light image is displayed on the display
- the region of interest setting switch 12d is operated, a biometric index value is calculated based on the image signal in the region of interest. be done.
- the region index value calculation unit 250 calculates a region index value based on the biometric index value in the region of interest.
- the index value display table generation unit 260 uses the calculated region index values for each region of interest to generate an index value display table that summarizes the plurality of region index values.
- the display image generation unit 270 generates a white light image on which the area position information is superimposed and a display image for displaying the index value display table.
- a display image 275 is displayed on the display that is the first user interface 15, and nothing is displayed on the display that is the second user interface 17.
- region position information 276a, 276b, and 276c indicating the position of the set region of interest is superimposed and displayed on a region of interest image 214 in which the endoscopic image is a white light image.
- an index value display table 265 that collectively displays region index values for the regions of interest set in the region of interest image 214. Note that in the example shown in FIG. 53, nothing is displayed on the display that is the second user interface 17, but the white light equivalent image 201 or the oxygen saturation image 202 may be displayed.
- the image in which the region of interest is displayed is the oxygen saturation image (specific example (1)), a white light equivalent image (specific example (2)), or a white light image (specific example (3)).
- the special light image may be a special light image photographed using reflected light obtained by irradiating the subject with special light other than the first illumination light, the second illumination light, and the third illumination light.
- an endoscopic image that displays region position information i.e., the background of the region of interest image
- the white light image or special light image may be an image generated based on an image signal acquired in real time, or may be a still image generated based on an image signal acquired immediately before mode switching. It's okay.
- the first illumination light is used as the illumination light emitted in the oxygen saturation mode.
- white light or special light is added. Accordingly, the light emission pattern in the oxygen saturation mode (see FIG. 15) is changed so that an illumination period in which white light or special light is emitted is provided.
- a display image may be displayed without displaying a region of interest image on the display.
- a display image may be displayed in the oxygen saturation mode, when the white light equivalent image 201 and the oxygen saturation image 202 are displayed as shown in FIG. 7, by operating the region of interest setting switch 12d (as shown in FIG. The display image may be displayed in a display mode as shown in FIG. 50 or FIG. 51 without going through the display mode as shown in FIG.
- region index values regarding multiple types of biometric index values may be calculated and an index value display table may be generated. For example, when calculating oxygen saturation and hemoglobin index as biological index values, as shown in FIG .
- An index value display table may be generated that displays a polygonal spark line 266 (indicated by a broken line) whose value is a hemoglobin index (HbI).
- an index value display table that displays regional index values related to multiple regions of interest
- users can see spatial changes in the real values of biometric index values in the endoscopic image being observed. Can be notified.
- An index value display table that displays all of these real values can present more reliable information to the user in a way that is easier to compare than when changes in biological index values are displayed only by color tone. It is possible.
- the endoscope 12 generates an image signal by photographing reflected light from a subject (ST101).
- the image signal acquisition unit 60 of the processor device 14 acquires the image signal generated by the endoscope 12 (ST102).
- the endoscopic image generation section 70 of the processor device 14 and/or the oxygen saturation image generation section 130 of the extended processor device 16 generates an endoscopic image based on the image signal (ST103).
- the region of interest setting unit 210 sets a plurality of regions of interest in the endoscopic image (ST104).
- the positions of the plurality of regions of interest in the endoscopic image are each stored in the region position information storage unit 240 as a plurality of region position information (ST105).
- biometric index values are calculated based on the image signals in each region of interest (ST106).
- the region index value calculation unit 250 calculates a region index value for each region of interest based on the biometric index value in each region of interest (ST107).
- the index value display table generation unit 260 generates an index value display table that collectively displays a plurality of area index values (ST108).
- the display image generation unit 270 generates a display image that displays an endoscopic image on which a plurality of area position information are superimposed and an index value display table (ST109).
- the extended display control unit 200 performs control to display the display image (ST110). As a result, the display image is displayed on the display that is the user interface.
- a plurality of regions of interest may be displayed together as one region of interest for display.
- a region of interest for display 212d as shown in FIG. 56 may be displayed. good.
- the display region of interest 212d shown in FIG. 56 includes a plurality of regions of interest 212a, 212b, and 212c, but the broken lines indicate that these are not actually displayed.
- region index values are calculated for each of the plurality of regions of interest 212a, 212b, and 212c.
- the display image includes display area position information such that the endoscopic image 211 includes area position information 272a, 272b, and 272c indicated by broken lines, which are not actually displayed. 272d is displayed.
- the apparent amount of information included in the display image can be reduced and the visibility of the display image can be improved.
- the symbol of the polygonal spark line 262 and the leader line are omitted.
- the reference numerals and leader lines of the polygonal spark line 262 are omitted to make the figures easier to read.
- an area index value storage section 280 may be further provided.
- the region index value storage unit 280 stores a specific region in which the region position information and the region index value are associated. It is preferable that the index value is stored and that the specific region index value is held and displayed in the index value display table of the display image.
- the region index values are calculated only once after the biometric index values are calculated.
- the region index value calculation unit 250 calculates a region index value for each region of interest based on the biometric index value in each region of interest (see ST106 and ST107 in FIG. 55). , and the area position information as a specific area index value, which is stored in the area index value storage unit 280.
- the area index value storage unit 280 may be included in the extended processor device 16 or may be a storage outside the extended processor device 16.
- the index value display table generation unit 260 generates an index value display table that collectively displays the specific area index values calculated for each region of interest, and the display image generation unit 270 generates an index value display table in which the specific area index values are displayed. Generate a display image that displays the index value display table. In this case, the specific area index value of the display image displayed on the user interface by the extended display control unit 200 is held and displayed as a fixed value.
- the user can watch the index value display table and display multiple region indexes. You can compare the values.
- the region index value calculation unit 250 calculates a region index value for each region of interest based on the biometric index value in each region of interest (see ST106 and ST107 in FIG. 55).
- the index value display table generation unit 260 generates an index value display table that collectively displays the specific region index values calculated for each region of interest (see ST108 in FIG. 55).
- the index value display table generation unit 260 generates an index value display table that reflects the newly calculated latest region index value every time a region index value is calculated, thereby displaying the index value display table on the index value display table. Update each of the multiple area index values.
- FIG. 59 shows a specific example of the display image 271 when updating the area index values displayed on the index value display table 261.
- the index value display table generation unit 260 converts the polygonal spark line 267 (indicated by a dashed line in FIG. 59) generated at a previous point in time to a point in time at a later point in time.
- the polygonal spark line 268 (indicated by a solid line in FIG. 59) generated in FIG.
- region index values are calculated in time series in a region of interest indicated by region position information 272a.
- region position information 272a For example, when illumination light is emitted in the oxygen saturation mode light emission pattern, as shown in FIG. 60, a first time point area index value 252a, a second time point area index value 252b, and a third time point area index value 252c are calculated in time series for each "1 Set").
- the index value display table generation unit 260 generates a first time point region index value 252a, a second time point region index value 252b, a third time point region index value 252c, and a new region index value in the region of interest indicated by the region position information 272a.
- the index value display table is generated to be updated every time it is calculated.
- index value display table By updating and displaying the index value display table, it is possible to show the user the area index values that are updated almost in real time.
- the user can check the actual values of biometric index values at multiple locations almost in real time in scenes where blood flow changes significantly, such as during or immediately after a procedure.
- the area index value is calculated for each frame set, but the frame set for which the area index value is calculated can be set arbitrarily. For example, in one frame set, a region index value is calculated, in the next frame set, a region index value is not calculated, and in the next frame set, a region index value is calculated. It can be set to calculate. Further, it is preferable that whether to retain or update the area index value displayed in the display image can be set by a user operation.
- the region of interest setting unit 210 sets regions of interest at a plurality of preset different positions on the endoscopic image, and stores the region of interest once set as a lock-on area, and The lock-on area may be displayed by following the movement. Furthermore, when updating the region index value, a new region index value may be calculated for the region of interest stored as the lock-on area.
- a once-set region of interest is associated with the region position information of the region of interest, thereby storing it as lock-on area position information indicating the position of the lock-on area.
- the lock-on area position information is coordinate information of the lock-on area on the endoscopic image.
- the region of interest setting section 210 may be provided with a region position matching section (not shown), and the region of interest setting section 210 may be provided with a region position matching section (not shown) to associate the once set region of interest with the region position information of the region of interest. It's okay.
- the region of interest setting unit 210 The photographed range may deviate significantly from the initially set position that includes the region of interest. For example, in a region of interest image 211 as shown in FIG. 61(A), region index values are calculated based on image signals acquired in regions of interest 212a, 212b, and 212c.
- region index values are calculated based on image signals acquired in regions of interest 212a, 212b, and 212c.
- the endoscopic image displayed on the display changes from the region of interest image 211 as shown in FIG. Assume that the region of interest image 215 is changed as shown in (B).
- the region position information of the regions of interest 212a, 212b, and 212c shown in FIG. 61(A) is stored as lock-on area position information.
- the region of interest image 215 as shown in FIG. 61(B) the region of interest is divided from regions 212a, 212b, 212c (indicated by dashed lines) shown in FIG. (indicated by ).
- the region index value calculation unit 250 calculates the region index value based on the biometric index values in the lock-on areas 220a, 220b, and 220c.
- the region of interest 212a shown in FIG. 61(A) moves to the lock-on area 220a shown in FIG. 61(B), and the region of interest 212b shown in FIG. 61(A) moves to the lock-on area 220a shown in FIG. 61(B).
- the region of interest 212c shown in FIG. 61(A) moves to the lock-on area 220c shown in FIG. 61(B).
- the plurality of regions of interest 212a, 212b, and 212c are each stored in the region position information storage unit 240 as lock-on area position information that is the position of the plurality of lock-on areas 220a, 220b, and 220c.
- the amount of movement from the regions of interest 212a, 212b, 212c shown in FIG. 61(A) to the lock-on areas 220a, 220b, 220c shown in FIG. 61(B) is determined by the amount of movement, rotation amount, and observation magnification of the endoscope 12. Calculated based on the rate of change, etc. Note that when lock-on area position information is not stored, area index values are calculated based on biometric index values in areas 212a, 212b, and 212c also in FIG. 61(B). Therefore, when attempting to move the endoscope 12 significantly, the once set region of interest is stored as a lock-on area, and the region index value is calculated by following the movement of the endoscope 12. be able to.
- the endoscopic image displayed in the display image changes from the region of interest image 211 shown in FIG. 61(A) to that shown in FIG. 61(B) as the endoscope 12 is operated.
- the region of interest image 215 is changed to display the lock-on areas 220a, 220b, and 220c.
- a display lock-on area 220d including a plurality of lock-on areas 220a, 220b, and 220c as shown in FIG. 62(B) is displayed.
- the endoscopic image displayed on the display is switched from a distant view image to a near view image, or from a close view image to a distant view image.
- the distant view image is an endoscopic image observed at a low magnification suitable for observation of a wide range.
- the foreground image is an endoscopic image observed at a high magnification suitable for observing fine structures.
- the initially set position of the region of interest and the position where you want to actually calculate the region index value may deviate. be. Therefore, by setting the initially set region of interest as the lock-on area, even if the endoscope 12 moves, the region index value in the initially set region of interest can be calculated.
- a lock-on area storage instruction is input by operating a lock-on area setting switch (not shown), and the lock-on area position information is stored. It is preferable.
- the area index value (lock-on area index value) calculated based on the image signal in the lock-on area is associated with the lock-on area position information, so that the lock-on area position information and the lock-on area index value are Preferably, it is stored as an associated specific lock-on area index value.
- the specific lock-on area index value is stored in the area index value storage section 280. Further, the specific lock-on area index value is stored for each of the plurality of lock-on areas.
- the specific lock-on area index value may be stored only once, or may be updated every time the lock-on area index value is calculated.
- each time a region index value in a lock-on area is calculated it is associated with time-series data showing the time series, and each specific lock-on area index value is stored as information that can determine when it was calculated. good.
- the lock-on area index value (in this case, the specific lock-on area index value) to be displayed on the index value display table of the display image can be changed to the lock-on area index calculated once. Values can be held and displayed. Further, each time the lock-on area index value is calculated, the lock-on area index value (in this case, the specific lock-on area index value) displayed on the index value display table of the display image can be updated.
- the lock-on area When observing endoscopic images in real time during examinations, surgeries, etc., the lock-on area may no longer be included in the endoscopic image being observed due to operations such as moving the endoscope 12 or changing observation magnification. There is. In this way, when the position of the lock-on area is outside the field of view, which is a position that is not included in the endoscopic image being observed, the lock-on area index value in the lock-on area that is outside the field of view is It is preferable to continue displaying the index value display table of the display image.
- the index value display table generation unit 260 sets the specific lock-on area index value stored immediately before the position of the lock-on area becomes the out-of-field position as the out-of-field lock-on area index value, and Generate an index value display table that displays area index values.
- FIG. 63(A) shows a display image 271 before the endoscope 12 is moved.
- an index value display table 261 is displayed that displays region index values calculated in three lock-on areas displayed as region position information 272a, 272b, and 272c.
- FIG. 63(B) shows the display image 271 after the endoscope 12 has been moved.
- FIG. 63(B) due to the movement of the endoscope 12, the position of the lock-on area that was displayed as the area position information 272a has become a position outside the field of view. Therefore, in FIG. 63(B), two lock-on areas are displayed as area position information 272b and 272c.
- the area index value of the lock-on area displayed as the area position information 272a is stored as the out-of-field lock-on area index value.
- the index value display table generation unit 260 generates an index value display table 261 that displays the out-of-field lock-on area index value 281.
- the extended display control unit 200 controls displaying a display image that displays an index value display table 261 that displays an out-of-field lock-on area index value 281, which is generated by a display image generation unit 270.
- a display image as shown in 63(B) is displayed.
- the region of interest setting unit 210 When the out-of-field lock-on area index value is displayed in the display image as shown in FIG. 63(B), the region of interest setting unit 210 performs An additional region of interest 277 as shown in FIG. 64 is set.
- the additional region of interest 277 in the example of the display image shown in FIG. 64 is, to be precise, region position information of the additional region of interest 277 that is displayed superimposed on the display image.
- the additional region of interest 277 is preferably a lock-on area.
- the region position information of the additional region of interest 277 is stored in the set region position information storage unit 240.
- the region index value calculation unit 250 calculates an additional region index value as a statistical value of the biometric index value calculated based on the image signal in the additional region of interest 277.
- the additional region index value is a region index value that is a statistical value of the biometric index value calculated based on the image signal in the additional region of interest 277.
- the index value display table generation unit 260 generates an out-of-field lock-on area index value 281, area index values 282a and 282b of each of the two lock-on areas displayed as area position information 272b and 272c, and an additional area index value 283.
- An extended index value display table 269 is generated, which is an index value display table that collectively displays the following.
- the extended display control unit 200 controls displaying the display image for displaying the extended index value display table 269 generated by the display image generation unit 270, thereby creating a display image 271 as shown in FIG. indicate.
- the extended index value display table is an index value display table that displays additional area index values, and is one form of an "index value display table.”
- the extended index value display table may hold and display additional area index values that have been calculated once, or may be updated and displayed each time an additional area index value is calculated.
- one additional region of interest 277 is newly set, but by setting a plurality of additional regions of interest and calculating a region index value for each additional region of interest, may be additionally displayed on the index value display table.
- the additional region of interest by setting the additional region of interest and displaying the additional region index value, information on a wide range of the subject can be presented to the user. Furthermore, rather than setting an additional region of interest, displaying the additional region index value in addition to the out-of-field lock-on area index value calculated chronologically earlier allows the user to view a wider area of the subject. information can be presented.
- an index value link line is displayed that connects the area position information displayed in the display image and the area index values corresponding to these area position information. It is preferable to do so.
- the display image generation section 270 is provided with an index value link line generation section 290. An example of displaying the index value link line will be described below with reference to FIG. 66.
- index value link lines 291a, 291b, and 291c are displayed in the display image 271 illustrated in FIG. 64.
- the index value link line 291a is displayed to connect the region index value 282a and the region position information 272b.
- the index value link line generation unit 290 associates the area index value 282a (lock-on area index value) and area position information 272b (lock-on area position information) stored in the area index value storage unit 280. By reading, an index value index value link line 291a connecting these is generated, and the extended display control unit 200 is controlled to perform display control.
- the index value link line 291b is an index value link line that connects the region index value 282b and the region position information 272c.
- the index value link line 291c is an index value link line that connects the additional region index value 283 and the additional region of interest 277 displayed as region position information.
- the index value link line 291b and the index value link line 291c are generated by the index value link line generation unit 290 based on the correspondence stored in the area index value storage unit 280, similarly to the index value link line 291a.
- the region index value and region position information can be displayed. It is possible to display the correspondence relationship with the user in a manner that the user can easily understand. Particularly when there are many region index values displayed on the index value display table, visibility of information that helps determine a region suitable for incision can be improved.
- the index value link line is not displayed in the region index value 281, which is the out-of-field lock-on area index value. This is to allow the user to easily understand that the position of the lock-on area corresponding to the area index value 281 is outside the field of view.
- the extended display control unit 200 may change the display size of the index value display table displayed in the display image.
- “Change in display size” includes a change in which the index value display table is enlarged or reduced while maintaining the aspect ratio, and a change in which the index value display table is enlarged or reduced without maintaining the aspect ratio. Changes that enlarge or reduce the index value display table without maintaining the aspect ratio include changes that increase or decrease the distance between adjacent area index values displayed on the index value display table.
- FIG. 67 shows an enlarged index value display table 269a that is obtained by reducing the enlarged index value display table 269 displayed in the display image 271 shown in FIG. 66 by reducing the distance between adjacent area index values. .
- the display size of the index value display table by changing the display size of the index value display table, the visibility of the index value display table can be improved.
- the display range of the index value display table can be made small when other information is desired to be displayed on the display image.
- the control for changing the display size of the index value display table in the display image may be performed through an operation input by the user, or may be performed automatically.
- FIG. 66 shows an example in which an index value link line is displayed in a display image in which an out-of-field lock-on area index value and an additional region of interest are displayed.
- the value and the additional region of interest may be displayed in a display image that is not displayed. A specific example will be explained below.
- index value link line For example, when displaying the index value link line in the display image 271 illustrated in FIG. 49, the display image 271 as illustrated in FIG. 68 is displayed on the display. In the example of the display image shown in FIG. 68, index value link lines 292a, 292b, and 292c are displayed in the display image 271 shown in FIG. 49.
- the index value link line 292a is an index value link line that connects the region index value 284 and the region position information 272a.
- the index value link line 292b is an index value link line that connects the region index value 282b and the region position information 272b.
- the index value link line 292c is an index value link line that connects the region index value 282b and the region position information 272c.
- the index value link line 292a, index value link line 292b, and index value link line 292c are generated by the index value link line generation unit 290 based on the correspondence stored in the area index value storage unit 280.
- the area index value 284 and area position information 272a, the area index value 282b and area position information 272b, and the area index value 282b and area position information 272c are associated with each other, and the area index It is stored in the value storage section 280.
- the area position information 272a, the area position information 272b, and the area position information 272c are lock-on area position information
- the area index value 284, the area index value 282b, and the area index value 282b are lock-on area index values.
- the area position information 272a (lock-on area position information) is set to an out-of-field position by moving the endoscope 12, an out-of-field lock as shown in FIG.
- a display image 271 that displays an extended index value display table 269 that displays on-area index values 281 is displayed.
- the index value link line 292a displayed in FIG. 68 is not displayed in the display image 271 shown in FIG. 69.
- An enlarged index value display table 269b which is a reduced version of the enlarged index value display table 269a, as shown in 70, is displayed on the display image 271.
- Display area position information 272d indicated by a solid line may be displayed, including two or more display area position information 272d.
- the display mode of the display area position information 272d is changed. It is preferable to change.
- an additional region of interest may be additionally set even in a display image in which an out-of-field lock-on area index value is not displayed.
- the out-of-field lock-on area index value is not displayed in the index value display table of the display image, but only the area index value stored in association with the area position information displayed in the display image is displayed. It may also be displayed. A specific example will be explained below.
- the area position information 272a, 272b (lock-on area position information) is set to a position outside the field of view, and as shown in FIG.
- the information 272c (lock-on area position information) is displayed in the display image
- only the area index value 282b associated with the area position information 272c is displayed in the index value display table 261 of the display image 271. It's okay.
- the region of interest setting unit 210 sets an additional region of interest 278a as shown in FIG. , 278b.
- the region of interest setting unit 210 sets an additional region of interest 278a as shown in FIG. , 278b.
- two additional regions of interest are set in advance.
- the number of additional regions of interest to be set may be arbitrarily set, and may be one, three or more.
- the additional regions of interest 278a and 278b in the example of the display image shown in FIG. 75 are, to be exact, region position information of the additional regions of interest 278a and 278b that are superimposed and displayed on the display image.
- the region position information of the additional regions of interest 278a and 278b is stored in the region position information storage unit 240.
- the region index value calculation unit 250 calculates additional region index values 285a and 285b as statistical values of biometric index values calculated based on the image signals in the additional regions of interest 278a and 278b (see FIG. 76).
- the additional region index value 285a is a region index value calculated based on the image signal in the additional region of interest 278a.
- the additional region index value 285b is a region index value calculated based on the image signal in the additional region of interest 278b.
- the index value display table generation unit 260 summarizes the region position information 272c, the region index value 282b, and the additional region index values 285a and 285b of the two lock-on areas displayed as the additional region of interest 278a and the additional region of interest 278b.
- An extended index value display table 269 is generated, which is an index value display table to be displayed.
- the extended display control unit 200 controls displaying the display image for displaying the extended index value display table 269 generated by the display image generation unit 270, thereby creating a display image 271 as shown in FIG. indicate. Note that the index value link line may also be displayed in the display image 271 as shown in FIG. 76.
- FIG. 76 shows an example of displaying the extended index value display table 269 that displays the region index value 282b and the additional region index values 285a and 285b together
- the index value that displays the region index value 282b The display table and the index value display table that displays the additional area index values 285a and 285b may be displayed separately as a plurality of different index value display tables.
- Display area position information 278c indicated by a solid line may be displayed, including two or more display area position information 278c. Note that, as shown in FIGS. 78 and 79, when an additional region of interest is set, it is preferable to change the display mode of the display region position information 278c.
- the light source section 20 is replaced with a broadband light source 400 that emits broadband light such as a white LED, a xenon lamp, or a halogen light source, instead of the LEDs 20a to 20e of each color shown in the first embodiment.
- a broadband light source 400 that emits broadband light such as a white LED, a xenon lamp, or a halogen light source, instead of the LEDs 20a to 20e of each color shown in the first embodiment.
- the rotating filter 410 the light emitted from the light source device 13 is used as illumination light for illuminating the subject.
- the light source device 13 of the endoscope system 10 is provided with a broadband light source 400, a rotary filter 410, and a filter switching section 420.
- the filter switching section 420 is controlled by the light source control section 21.
- the other configurations are the same as the endoscope system 10 of the first embodiment.
- the image sensor 44 is a monochrome image sensor.
- the broadband light source 400 emits broadband light having a wavelength band ranging from blue to red.
- the broadband light is, for example, white light.
- the rotary filter 410 includes an inner filter 411 provided on the inside and an outer filter 412 provided on the outside.
- the filter switching section 420 moves the rotary filter 410 in the radial direction. In the normal mode, the filter switching unit 420 inserts the inner filter 411 of the rotating filter 410 into the optical path of white light. Furthermore, in the case of the oxygen saturation mode or the correction mode, the filter switching unit 420 inserts the outer filter 412 of the rotating filter 410 into the optical path of the white light.
- the inner filter 411 includes, along the circumferential direction, a B1 filter 411a that transmits the wavelength band of the violet light V of the white light and the wavelength band of the second blue light BS, and the green light G of the white light.
- a G filter 411b that transmits the wavelength band of the red light R and an R filter 411c that transmits the wavelength band of the red light R among the white light are provided. Therefore, in the normal mode, the illumination light having the wavelength band of the violet light V and the second blue light BS, the illumination light having the wavelength band of the green light G, and the illumination light having the wavelength band of the red light R are transmitted to the rotating filter 410.
- the light is emitted from the light source device 13 in accordance with the rotation of the light source.
- the outer filter 412 includes, along the circumferential direction, a B1 filter 412a that transmits a first blue light BL having a wavelength band B1 among the white light, and a second blue light BL among the white light.
- a B2 filter 412b that transmits light in a wavelength band that the BS has, a G filter 412c that transmits green light G that has a wavelength band G2 among white light, and an R filter that transmits red light R that has a wavelength band R2 among white light.
- 412d and a B3 filter 412e that transmits blue-green light BG, which is light in wavelength band B3 of white light (see FIGS. 21 and 22).
- the illumination light having the wavelength bands of the first blue light BL, the second blue light BS, the green light G, the red light R, and the blue-green light BG is caused by the rotation of the rotary filter 410. Together, they are emitted from the light source device 13.
- the endoscope system 10 uses a monochrome image sensor to capture reflected light obtained by illuminating a subject with illumination light having wavelength bands of the violet light V and the second blue light BS.
- a Bc image signal is output.
- a Gc image signal is output.
- an Rc image signal is output.
- a white light image is generated based on the Bc image signal, Gc image signal, and Rc image signal by the same method as in the first embodiment.
- the B1 image signal is obtained by photographing the reflected light obtained by illuminating the subject with illumination light having the wavelength band of the first blue light BL using a monochrome image sensor. Output. Further, a B2 image signal is output by photographing reflected light obtained by illuminating a subject with illumination light having a wavelength band of the second blue light BS using a monochrome image sensor. Further, by photographing reflected light obtained by illuminating a subject with illumination light having a wavelength band of green light G using a monochrome image sensor, a G2 image signal is output.
- an R2 image signal is output.
- a B3 image signal is output by photographing reflected light obtained by illuminating a subject with illumination light having a wavelength band of blue-green light BG using a monochrome image sensor.
- the extended processor device 16 Based on the B1 image signal, B2 image signal, G2 image signal, R2 image signal, and B3 image signal transmitted from the processor device 14, the extended processor device 16 generates an oxygen saturation image using the same method as in the first embodiment. is generated, and correction processing is also performed.
- the signal ratio ln(B3/G3) instead of the signal ratio ln(B3/G3), a signal ratio ln(B3/G2) obtained by normalizing the B3 image signal with the G2 image signal is used.
- the oxygen saturation calculation table corresponding to the specific dye concentration is selected, and the oxygen saturation calculation table is selected.
- a table correction process may be performed using the selected oxygen saturation calculation table 110 as the oxygen saturation calculation table 110 as shown in FIG.
- Calculated value correction processing may be performed to add or subtract a correction value obtained from .
- a correction value used for correcting oxygen saturation is calculated by referring to a two-dimensional coordinate system 430 shown in FIG.
- the vertical axis of the two-dimensional coordinate system 430 is a specific calculation value obtained based on the B1 image signal, G2 image signal, R2 image signal, and B3 image signal, and the horizontal axis is ln(R2/G2).
- the specific calculation value is determined by the following formula A).
- a reference line 431a indicating a distribution of predetermined reference baseline information and an actual measurement line 431b indicating a distribution of actually measured baseline information obtained by photographing an actual observation target are shown.
- a difference value ⁇ Z between the reference line 431a and the measured line 431b is calculated as a correction value.
- the reference baseline information is determined as information that is obtained in the absence of a specific dye and does not depend on oxygen saturation.
- the reference baseline information is a value obtained by adjusting ⁇ in formula A) so that it remains constant even if the oxygen saturation changes.
- the three-dimensional coordinates 121 shown in FIG. 34 may be referred to.
- the Z axis of the three-dimensional coordinates 121 shown in FIG. 34 is set to the signal ratio ln(B3/G2), and the signal ratio ln(B3/G2) is used as the value of the Z component. .
- the endoscope 12 is a rigid endoscope that includes a camera head 500 at the proximal end portion of the insertion portion 12a, as shown in FIG.
- the camera head 500 is equipped with an imaging optical system 43.
- an imaging optical system 43 having an objective lens 43a and an image sensor 44 is provided at the distal end of the endoscope 12, but in the third embodiment, an imaging optical system 43 is provided at the distal end of the endoscope 12. 43, an image sensor is provided in the camera head 500, not in the tip.
- the camera head 500 photographs reflected light guided from the distal end of the endoscope 12.
- the image signal captured by camera head 500 is transmitted to processor device 14 .
- the mode switching switch 12c and the region of interest setting switch 12d are omitted.
- parts that are different from the first embodiment and the second embodiment will be described, and descriptions of common parts will be omitted.
- the light source device 13 emits white light including violet light V, second blue light BS, green light G, and red light R in the normal mode. Further, in the case of the oxygen saturation mode and the correction mode, the light source device 13 provides illumination that is a mixed light including a first blue light BL, a second blue light BS, a green light G, and a red light R as shown in FIG. Emits light.
- the camera head 500 includes dichroic mirrors 501, 502, and 503, and image sensors 511, 512, 513, and 514 that are monochrome image sensors.
- the dichroic mirror 501 reflects light in the wavelength band of the violet light V and the second blue light BS among the reflected light from the subject, and reflects the light in the wavelength band of the first blue light BL, the green light G, and the red light R. Transmits light in the band.
- the light reflected by the dichroic mirror 501 and incident on the image sensor 511 has a wavelength band of violet light V or second blue light BS, as shown in FIG.
- the image sensor 511 outputs a Bc image signal in the normal mode, and outputs a B2 image signal in the oxygen saturation or correction mode.
- the dichroic mirror 502 reflects light in the wavelength band of the first blue light BL, and transmits light in the wavelength band of the green light G and red light R.
- the light reflected by the dichroic mirror 502 and incident on the image sensor 512 has a wavelength band of the first blue light BL, as shown in FIG. 87.
- the image sensor 512 stops outputting an image signal in normal mode, and outputs a B1 image signal in oxygen saturation mode or correction mode.
- the dichroic mirror 503 reflects the light in the wavelength band of the green light G, and transmits the light in the wavelength band of the red light R.
- the light reflected by the dichroic mirror 503 and incident on the image sensor 513 has a wavelength band of green light G, as shown in FIG.
- the image sensor 513 outputs a Gc image signal in normal mode, and outputs a G2 image signal in oxygen saturation or correction mode.
- the light that passes through the dichroic mirror 503 and enters the image sensor 514 has a wavelength band of red light R, as shown in FIG.
- the image sensor 514 outputs an Rc image signal in normal mode, and outputs an R2 image signal in oxygen saturation mode or correction mode.
- the Bc image signal, Gc image signal, and Rc image signal are used in the normal mode, and the B1 image signal, B2 image signal, G2 image signal, and R2 image signal are used in the oxygen saturation mode or correction mode.
- the Bc image signal, Gc image signal, and Rc image signal output from the camera head are acquired by the image signal acquisition unit 60 of the processor device 14, and transmitted to the endoscope image generation unit 70 to generate a white light image. be done.
- the B1 image signal, B2 image signal, G2 image signal, and R2 image signal output from the camera head are acquired by the image signal acquisition unit 60 of the processor device 14.
- the B2 image signal, G2 image signal, and R2 image signal are sent to the endoscopic image generation section 70 in order to generate a white light equivalent image. Further, the B1 image signal, B2 image signal, G2 image signal, and R2 image signal are transmitted to the extended processor device 16 via the image communication unit 90 in order to generate an oxygen saturation image.
- the B1 image signal including information of the wavelength band B1 is used to calculate the oxygen saturation level, but other image signals may be used instead of the B1 image signal.
- FIG. 90 see FIG. 22(A)
- the wavelength band Rx is a wavelength band in the range of 680 nm ⁇ 10 nm.
- the Rk image signal (indicated by "Rk" in FIG.
- the camera head 500 is equipped with a dichroic mirror that allows the camera to move.
- the endoscope 12 is a rigid endoscope that includes a camera head at the proximal end portion of the insertion portion 12a.
- the fourth embodiment includes a camera head 600 as shown in FIG. 92 instead of the camera head 500 of the third embodiment.
- the camera head 600 includes a dichroic mirror 601 and image sensors 611 and 612.
- the dichroic mirror 601 reflects light in a wavelength band included in the violet light V, the second blue light BS, the green light G, and the red light R among the reflected light from the subject, and reflects the light in the wavelength band included in the first blue light BL. Transmits light in the band.
- the image sensor 611 that receives the light reflected by the dichroic mirror 601 is a color image sensor in which the B pixel is provided with a B color filter BF, the G pixel is provided with a G color filter GF, and the R pixel is provided with an R color filter RF. be. Further, the image sensor 612 that receives the light transmitted by the dichroic mirror 601 is a monochrome image sensor.
- the image sensor 611 which is a color image sensor, receives the reflected light from the subject reflected by the dichroic mirror 601, thereby generating a Bc image signal. , Gc image signal, and Rc image signal are output from the image sensor 611, respectively.
- the image sensor 612 which is a monochrome image sensor, stops outputting image signals.
- the light source device 13 emits observation illumination light (hereinafter referred to as , referred to as fourth illumination light) is emitted.
- the dichroic mirror 601 separates the reflected light from the subject illuminated with the fourth illumination light by reflecting and transmitting it.
- FIG. 93B shows the relationship between the reflectance (broken line 601a) and transmittance (solid line 601b) of light incident on the dichroic mirror 601 and the wavelength of the light.
- the image sensor 611 which is a color image sensor.
- the sensitivity of the B pixel B, the G pixel G, and the R pixel R of the image sensor 611 and the wavelength of light have a relationship as shown in FIG. 93(C). Therefore, the B pixel B of the image sensor 611 outputs a B2 image signal by sensing the light in the wavelength band B2 that the second blue light BS has. Further, the G pixel G of the image sensor 611 outputs a G2 image signal by sensing the light in the wavelength band G2 that the green light G has. Furthermore, the R pixel R of the image sensor 611 outputs an R2 image signal by sensing the light in the wavelength band R2 that the red light R has.
- the image sensor 612 which is a monochrome image sensor.
- the sensitivity of the image sensor 612 and the wavelength of light have a relationship as shown in FIG. 94(C). Therefore, the image sensor 612 outputs a B1 image signal by sensing the light in the wavelength band BL of the first blue light BL that is transmitted by the dichroic mirror 601.
- FIG. 94(A) shows the wavelength band of light included in the fourth illumination light.
- FIG. 94(B) shows the relationship between the reflectance (broken line 601a) and transmittance (solid line 601b) of light incident on the dichroic mirror 601 and the wavelength of the light. .
- a light emission pattern in which the fourth illumination light L4 is emitted is repeated once per frame F. Therefore, in the oxygen saturation mode of the fourth embodiment, a B2 image signal, a G2 image signal, and an R2 image signal are output per frame from the image sensor 611 which is a color image sensor, and the image sensor 611 which is a monochrome image sensor outputs a B2 image signal, a G2 image signal, and an R2 image signal for each frame.
- a B1 image signal is output from 612.
- the B1 image signal, B2 image signal, G2 image signal, and R2 image signal output from the image sensor 611 or the image sensor 612 in the oxygen saturation mode are transmitted to the processor device 14.
- the method of calculating biometric index values including oxygen saturation in oxygen saturation mode is the same as in the first embodiment.
- the non-emission state NL for two frames F is After that, the third illumination light L3 is emitted for two frames F, and after passing through a non-emission state NL for a plurality of frames, a light emission pattern is adopted in which the fourth illumination light L4 for two frames F is emitted.
- the frame of the non-emission state NL is a period for switching between the fourth illumination light L4 and the third illumination light, and neither illumination light is emitted.
- the light emission switching instruction may be input by operating an illumination light switching switch (not shown) provided on the endoscope 12 or the user interface, or may be input by toggling the mode changeover switch 12c.
- the B2 image signal, G2 image signal, and R2 image signal are output from the image sensor 611, and the B1 image signal is output from the image sensor 612, as in the oxygen saturation mode. A signal is output.
- the light source device 13 emits third illumination light (correction illumination light) including green light G as shown in FIG. 97(A).
- the image sensor 611 which is a color image sensor, receives the reflected light from the subject reflected by the dichroic mirror 601 (see FIG. 97(B)).
- the B pixel B of the image sensor 611 outputs a B3 image signal by sensing the light in the wavelength band B3 of the green light G.
- the G pixel G of the image sensor 611 outputs a G3 image signal by sensing light in the wavelength band G3 of the green light G. Further, the R pixel R of the image sensor 611 outputs an R3 image signal by sensing light in the wavelength band of the green light G (not shown).
- FIG. 98(A) shows the wavelength band of light included in the third illumination light.
- FIGS. 97(B) and 98(B) show the reflectance (broken line 601a) and transmittance (solid line 601b) of the light incident on the dichroic mirror 601, and the wavelength of the light. It shows the relationship between Also, FIGS. 97(C) and 98(C) show the relationship between the sensitivities of B pixel B, G pixel G, and R pixel R of the image sensor 611 and the wavelength of light, as in FIG. 93(C). It shows.
- the B1 image signal, B2 image signal, G2 image signal, and R2 image signal output from the image sensor 611 or the image sensor 612 in the oxygen saturation mode are transmitted to the processor device 14 and acquired by the image signal acquisition unit 60.
- the image signal acquisition unit 60 acquires the Bc image signal, Gc image signal, and Rc image signal acquired in the normal mode, the oxygen saturation mode, and the correction mode. Demosaic processing is performed on the B2 image signal, G2 image signal, and R2 image signal that are obtained, and the B3 image signal, G3 image signal, and R3 image signal that are obtained in the correction mode. Calculation of reliability in the fourth embodiment will be described below.
- the correction image 161 is displayed, and the reliability is calculated for each pixel included in the specific area 162 included in the correction image 161.
- the images obtained in the frame in which the fourth illumination light L4 is emitted (the white light equivalent image and the first blue light image) and the third illumination light L3 are emitted.
- the reliability is calculated for each correction area using the frame and the image (third illumination light image) obtained in the frame.
- the correction area corresponds to the specific area in the first embodiment.
- the term "correction area” refers to a "set of small areas divided into multiple parts" or "the small area itself (Nth correction area, N is a natural number of 1 or more)" as described later. used as
- the white light equivalent image is an endoscopic image generated using the B2 image signal, G2 image signal, and R2 image signal that are output in the frame in which the fourth illumination light L4 is emitted.
- the first blue light image is an endoscopic image generated using the B1 image signal output in the frame in which the fourth illumination light L4 is emitted.
- the third illumination light image is an endoscopic image generated using the B3 image signal, the G3 image signal, and the R3 image signal that are output in the frame in which the third illumination light L3 is emitted.
- the white light equivalent image and the third illumination light image are endoscopic images in which all pixels have pixel values, which are generated by performing demosaic processing in the image signal acquisition unit 60. It is. Since the first blue light image is output from the monochrome image sensor, all pixels have pixel values at the time when the image signal acquisition unit 60 acquires the B1 image signal.
- the white light equivalent image and the third illumination light image are transmitted to the feature value calculation unit 620 of the processor device 14 shown in FIG. 99.
- the feature value calculation section 620 is configured by a processor different from the central control section 50 in the processor device 14 .
- the feature amount calculation unit 620 is configured by an FPGA (Field Programmable Gate Array).
- the feature amount calculation unit 620 calculates area feature amounts for each of the plurality of correction regions shown in FIG. 100 among the white light equivalent image, the first blue light image, and the third illumination light image.
- the region feature amount will be described later.
- the correction area 622 is a small area divided into a plurality of areas in the white light equivalent image 621, as shown in FIG. In the example shown in FIG. 100, the correction area 622 has the horizontal length a of the white light equivalent image 621 set to a1, a2, and a3, and the vertical length b set to b1, b2, and b3, respectively.
- the area where the column a2 intersects the row b2 is further divided into 16 equal parts (see FIG. 100(A)).
- the position of the area to be the correction area 622 and the number of areas to be divided into the correction areas 622 are not limited to these. For example, the correction area 622 may be divided into 9 equal parts or 25 equal parts.
- FIG. 100(B) is an enlarged view of the correction area 622 shown in FIG. 100(A). As shown in FIG. 100(B), the correction area 622 is divided into 16 areas from a first correction area 622a to a sixteenth correction area 622p. In FIG. 100(B), numbers from 1 to 16 are used to indicate that the correction area 622 is divided into 16 areas, from the first correction area 622a to the 16th correction area 622p. .
- the feature value calculation unit 620 configures each correction area for each of the Nth correction areas (in the case of the example shown in FIG. 100, from the first correction area to the 16th correction area). Determine whether a pixel is a valid pixel. The determination of whether a pixel is a valid pixel is performed by setting a lower limit value and an upper limit channel threshold value for each channel (B channel, G channel, R channel) of each pixel.
- a B channel lower limit threshold and a B channel upper limit threshold are provided.
- a G channel lower limit threshold and a G channel upper limit threshold are provided.
- an R channel lower limit threshold and an R channel upper limit threshold are provided.
- the feature value calculation unit 620 calculates that, for each pixel in each correction area, the pixel values of all color channels are equal to or greater than the channel lower limit threshold of each color for the white light equivalent image, the first blue light image, and the third illumination light image. If the pixel is within the range below the channel upper limit threshold, the pixel is determined to be a valid pixel.
- the B channel pixel value of each pixel constituting the white light equivalent image and the third illumination light image is within the range of not less than the B channel lower limit threshold and less than the B channel upper limit threshold; And, if the pixel value of the G channel is within the range of the G channel lower limit threshold and less than the G channel upper limit threshold, and the R channel pixel value is within the range of the R channel lower limit threshold and less than the R channel upper limit threshold, then the pixel is determined to be a valid pixel.
- each pixel is within the range from the monochrome image channel lower limit value to the monochrome image channel upper limit value, that pixel is determined to be a valid pixel.
- the feature quantity calculation unit 620 calculates the area feature quantity for each correction area in the white light equivalent image, the third illumination light image, and the first blue light image.
- the area feature amount includes the number of effective pixels, the sum of pixel values of effective pixels, the sum of squares of pixel values of effective pixels, the variance of pixel values of effective pixels, and the like.
- the feature quantity calculation unit 620 calculates the area feature quantity for each correction area of each channel of the white light equivalent image. Furthermore, area feature amounts are calculated for each correction area of each channel of the third illumination light image. Further, a region feature amount is calculated for each correction region of the first blue light image. The area feature amount of each correction region of each channel of each endoscopic image calculated by the feature amount calculation section 620 is transmitted to the reliability calculation section 160 of the extended processor device 16.
- the reliability calculation unit 160 calculates the reliability for determining the degree of influence of disturbance in the correction area. Furthermore, the reliability calculation unit 160 calculates a second dye value for determining the degree of movement of the endoscope 12.
- the degree of movement of the endoscope 12 is the degree for determining whether or not the endoscope 12 is moved during switching of illumination light in the correction mode of the fourth embodiment (that is, the non-emission state NL). be.
- the endoscope 12 moves in the non-emission state NL, the observation target reflected in the endoscopic image also moves, so the correction process may not be performed appropriately.
- a determination regarding the movement of the endoscope 12 is made based on the degree of movement of the endoscope 12, as described later. If the degree of movement is large, the user can be notified not to move the endoscope 12. Calculation of the second dye value will be described later.
- the correction determining unit 170 of the extended processor device 16 determines the degree of influence of disturbance using the reliability and/or determines the movement of the endoscope 12 using the second pigment value. Determine the degree.
- the reliability calculation section 160 includes a region reliability calculation section 630 and a second dye value calculation section 650.
- the correction determination section 170 includes a region reliability determination section 640 and a second dye value determination section 660.
- the area reliability calculation unit 630 of the reliability calculation unit 160 performs corrections for each channel of the white light equivalent image, the first blue light image, and the third illumination light image generated from the image signal output in each frame.
- a region reliability is calculated using the region feature amount of the region.
- the area reliability includes the average value of pixel values within the correction area, the standard deviation of pixel values within the correction area, the effective pixel rate within the correction area, the reliability of the brightness within the correction area, and the correction There is a degree of reliability depending on the degree of bleeding included in the correction area, a degree of reliability depending on the degree of fat contained in the correction area, and the like. Note that the area reliability is one aspect of the "reliability" in the first embodiment.
- the average value of pixel values within the correction area is calculated using the number of pixels within the correction area and the pixel values of effective pixels within the correction area.
- the standard deviation of pixel values within the correction area is calculated using the number of pixels within the correction area and the variance of pixel values of effective pixels.
- the effective pixel rate within the correction area is calculated using the number of pixels within the correction area and the number of effective pixels.
- the reliability of the brightness within the correction area is obtained by converting the average value of the G2 image signal within the correction area (i.e., the pixel value within the correction area of the G channel of the white light equivalent image). signal value) is applied to the first reliability calculation table 763 as shown in FIG. 102, where the horizontal axis of the first reliability calculation table 163 (see FIG. 36) is the signal value of the G2 image signal. calculate.
- the signal value of the G2 image signal is preferably an average value of luminance values obtained by performing conversion processing using the G2 image signal.
- the reliability based on the degree of bleeding included in the correction area is determined by the average value of the B2 image signal, the average value of the G2 image signal, and the average value of the R2 image signal (i.e., Calculate the area average signal ratio ln(R2/G2) and area average signal ratio ln(B2/G2) using the average of pixel values in each correction area of each color channel of the white light equivalent image, and The signal ratio is applied to the second reliability calculation table 164 (see FIG. 37).
- the reliability based on the degree of fat included in the correction area is calculated based on the average value of the G2 image signal and the average value of the R2 image signal in each correction area of the white light equivalent image (i.e., the average value of the G2 image signal of the white light equivalent image).
- the calculation is performed by applying the ratio ln(B1/G2) to the third reliability calculation table 765.
- the region reliability calculated by the region reliability calculation section 630 is transmitted to the region reliability determination section 640 of the correction determination section 170 (see FIG. 101).
- the region reliability determination unit 640 performs high reliability correction for each correction region in the white light equivalent image, the first blue light image, and the third illumination light image using a preset threshold for region reliability determination. The result of the determination as to whether the region is a region for use or a region for low reliability correction is output.
- the threshold for region reliability determination may be set depending on the type of region reliability. For example, the threshold for determining the first region reliability is set for the "average value of pixel values within the correction region," and the “average value of pixel values within the correction region” is set as the threshold for determining the first region reliability. If this is the case, the correction area is determined to be a "high reliability correction area.” On the other hand, if the "average value of pixel values within the correction area" is less than the first area reliability determination threshold, the correction area is determined to be a "low reliability correction area.”
- the second area reliability determination threshold is set for the "standard deviation of pixel values within the correction area”
- the third area reliability determination threshold is set for the "effective pixel rate within the correction area.”
- the fourth region reliability determination threshold is set for the "reliability of the brightness within the correction region”
- the fifth region reliability is set for the "reliability of the degree of fat included in the correction region”. The determination thresholds are set respectively and the determination results are output.
- the area reliability determination unit 640 uses the determination result of each correction area as to whether it is a high reliability correction area or a low reliability correction area, and further determines the white light equivalent image, the first The reliability of the blue light image and the third illumination light image is determined. In this case, among all the correction areas in the white light equivalent image, the first blue light image, and the third illumination light image, the image is Output the judgment result.
- the image determination result is output by, for example, setting a threshold value for outputting the first image determination result in advance.
- the first image judgment result output threshold is set to 10 and the number of correction areas for the white light equivalent image is 16, the number of low reliability correction areas for the white light equivalent image is 10. If the value is greater than or equal to 1, an image determination result is output indicating that the reliability of the correction area as a whole is high, that is, the influence of disturbance is small and correction processing can be performed appropriately. On the other hand, if the number of low-reliability correction areas in the white light equivalent image is less than 10, the reliability of the correction areas as a whole is low, that is, the image is considered to be affected by some kind of disturbance and cannot be properly corrected. Output the judgment result.
- calculation of the area reliability and the output of the image judgment results may be performed for all the white light equivalent images, the first blue light image, and the third illumination light image, or for some of the white light equivalent images, the third illumination light image, and the third illumination light image.
- the process may be performed for the first blue light image and the third illumination light image. This is to speed up calculation processing.
- the image determination result output by the area reliability determination unit 640 is transmitted to the extended display control unit 200. It is preferable that the extended display control unit 200 changes the display mode on the display according to the image determination result. For example, when the image determination result that "the entire correction area is highly reliable" is output, the extended display control unit 200 displays a message on the display indicating that the correction process can be performed appropriately (see FIG. 41). On the other hand, if the image judgment result is that the reliability of the correction area as a whole is low, a message such as ⁇ Please operate the endoscope for correction processing'' will be displayed on the display as a warning ( (See Figure 42). Note that such a message may be displayed superimposed on the white light equivalent image displayed on the display.
- the area reliability determination unit 640 may calculate the average reliability for image determination using each correction area in the white light equivalent image, the first blue light image, and the third illumination light image.
- the average reliability for image determination is calculated, for example, by dividing the sum of the reliability of all correction areas of the white light equivalent image by the number of correction areas.
- the region reliability determination unit 640 presets the second image determination result output threshold for the image determination average reliability, and if the image determination average reliability is equal to or greater than the second image determination result output threshold, If there is, the image determination result is output as "the reliability of the correction area as a whole is high".
- the extended display control unit 200 changes the display mode on the display according to the image determination result.
- each correction area in the white light equivalent image, the first blue light image, and the third illumination light image output by the area reliability determination unit 640 is determined to be a high reliability correction area or a low reliability correction area.
- the determination result as to whether the area is a correction area is transmitted to the second dye value calculation unit 650 (see FIG. 101).
- the second dye value calculation unit 650 selects a correction area determined to be a "low reliability correction area" from among the correction areas in the white light equivalent image, the first blue light image, and the third illumination light image. It is preferable to perform an exclusion process to exclude from the calculation of the second dye value.
- the second dye value calculation unit 650 performs the exclusion process on a part of the white light equivalent image, the first blue light image, and the third illumination light image.
- each frame 651a in which the fourth illumination light L4 or the third illumination light L3 is emitted Among 651b, 651c, 651d, 651e, and 651f, a white light equivalent image 652a and a first blue light image 652b are generated based on the image signal output in frame 651b, and a first blue light image 652b is generated based on the image signal output in frame 651c.
- the white light equivalent image 652a, the first blue light image 652b, and the third illumination light image 652c are referred to as a first image set 652d.
- the white light equivalent image 653a, the first blue light image 653b, and the third illumination light image 653c are referred to as a second image set 653d.
- the second dye value calculation unit 650 preferably performs exclusion processing on the images included in the first image set 652d and the images included in the second image set 653d.
- a correction area that is determined to be a "high reliability correction area” and is not subject to exclusion processing will be referred to as an effective area.
- a correction area that is determined to be a "low reliability correction area” and is a target of exclusion processing is referred to as an exclusion area.
- the second dye value calculation unit 650 calculates that the position of each effective area and the position of each excluded area included in the first image set 652d are the white light equivalent image 652a, the first blue light image 652b, and the third illumination light image. Exclusion processing is performed to correspond between 652c and 652c.
- the excluded areas of the white light equivalent image 652a are correction areas 654d and 654h, and the correction areas other than the correction areas 654d and 654h out of the entire correction area 654 are Let the area be the valid area.
- the exclusion areas of the first blue light image 652b are set as correction areas 655d and 655h, and the correction areas other than the correction areas 655d and 655h in the entire correction area 655 are set as effective areas.
- exclusion areas of the third illumination light image 652c are defined as correction areas 656d and 656h, and correction areas other than the correction areas 656d and 656h in the entire correction area 656 are defined as effective areas.
- the second dye value calculation unit 650 performs exclusion processing on each image set using a preset exclusion processing threshold.
- the threshold for exclusion processing is set as a plurality of values so that the area reliability of each correction area can be evaluated and calculated in five levels from "1" to "5". Note that the threshold for exclusion processing is preferably set according to the type of region reliability.
- the second pigment value calculation unit 650 first calculates five levels of area determination reliability for each correction area of the white light equivalent image, the first blue light image, and the third illumination light image included in the image set. . Next, from among the corresponding correction areas of the white light equivalent image, the first blue light image, and the third illumination light image included in the image set, the correction area having the minimum area determination reliability is selected. .
- a region reliability determination threshold for determining a "high reliability correction region” or a "low reliability correction region” is applied to the correction region having the minimum region determination reliability.
- the correction area that is determined to be a low reliability correction area is set as an exclusion area.
- all the correction areas of the white light equivalent image, the first blue light image, and the third illumination light image that correspond to the correction area determined to be the "low reliability correction area” are set as exclusion areas. .
- the second dye value calculation unit 650 calculates second dye values from the first image set 652d and the second image set 653d, respectively. Hereinafter, calculation of the second dye value will be specifically explained.
- the white light equivalent image 652a, the first blue light image 652b, and the third illumination light image 652c are based on the signal values in the respective effective areas located at mutually corresponding positions.
- the region average signal ratio ln (R2/G2) as the value of the X component the region average signal ratio ln (B1/G2) as the value of the Y component
- the region average signal ratio ln (B3/G3) as the value of the Z component
- the area average signal ratio ln(R2/G2) is the average value of the R2 image signal in each effective area of the white light equivalent image 652a, and the average value of the G2 image signal in each effective area (i.e., the average value of the G2 image signal in each effective area (i.e., the white light equivalent image).
- the average pixel value in each effective region of the R channel and the average pixel value in each effective region of the G channel) are used.
- the area average signal ratio ln(B1/G2) is the average value of the B1 image signal within each effective area of the first blue light image 652b (i.e., the average of the pixel values within each effective area of the first blue light image). , the average value of the G2 image signal in each effective area of the white light equivalent image 652a.
- the area average signal ratio ln(B3/G3) is the average value of the B3 image signal in each effective area of the third illumination light image 652c, and the average value of the G3 image signal in each effective area (i.e., the average value of the G3 image signal in each effective area) It is calculated using the average of pixel values in each effective area of the B channel and the average of pixel values in each effective area of the G channel of the optical image.
- the second pigment value calculation unit 650 calculates a region average signal ratio ln(R2/G2), a region average signal ratio ln(B1/G2), and a region average signal ratio calculated for each corresponding effective region of the first image set 652d.
- ln(B3/G3) is calculated by referring to the corrected oxygen saturation calculation table 120 (see FIG. 29(A)).
- the corrected oxygen saturation calculation table 120 has a three-dimensional structure with the signal ratio ln(R2/G2) as the X axis, the signal ratio ln(B1/G2) as the Y axis, and the signal ratio ln(B3/G3) as the Z axis. In the coordinate system, curved surfaces CV0 to CV4 are distributed according to the concentration of the yellow dye.
- the second dye value calculation unit 650 calculates a second dye value for each effective area of the first image set 652d. Similarly, the second dye value of the second image set 653d is also calculated for each effective area.
- the second dye value calculated for each effective area of the first image set 652d and the second dye value calculated for each effective area of the second image set 653d are calculated by the second dye value judgment unit of the correction judgment unit 170. 660. Furthermore, the X component value, Y component value, and Z component value calculated for each effective area of the first image set 652d, and the X component value, Y component value calculated for each effective area of the second image set 653d. It is preferable to send the component value and the Z component value to the second dye value determination section 660.
- the second dye value determination unit 660 calculates the second dye value 661 calculated for each effective area of the first image set 652d and the second dye value 661 calculated for each effective area of the second image set 653d.
- a correlation coefficient 663 with the second dye value 662 is determined.
- the second dye values 661 and 662 calculated for each effective area are plotted, the vertical axis is the second dye value, and the horizontal axis is the correction area number (i.e., the correction area number assigned to the effective area). The number “N” of the N correction area) is shown.
- the second dye value determination unit 660 determines that "the degree of movement of the endoscope is large.” On the other hand, if the correlation coefficient is larger than the motion determination threshold, it is determined that "the degree of movement of the endoscope is small”. In this case, the second dye value determination unit 660 outputs a determination result of "the degree of movement of the endoscope is large” or "the degree of movement of the endoscope is small” as a motion determination result, and controls the extended display. 200.
- the extended display control unit 200 changes the display mode on the display according to the motion determination result. For example, when the motion determination result that "the degree of movement of the endoscope is small" is output, the extended display control unit 200 displays a message on the display indicating that the correction process can be performed appropriately (see FIG. 41). On the other hand, if the motion determination result that "the degree of endoscope movement is large” is output, a message MS4 such as "Please hold the endoscope still for correction processing" as shown in FIG. 107 is output. Displayed on the display as a warning message. Note that such a message may be displayed superimposed on the white light equivalent image 201.
- the movement of the endoscope 12 may increase during the switching. In such a case, it may not be possible to appropriately perform correction processing depending on the influence of the density of the specific dye. Therefore, by determining the degree of movement of the endoscope 12 and notifying the user if the degree of movement is large, the user can be urged not to move the endoscope 12. As a result, when the degree of movement of the endoscope 12 is reduced, correction processing can be performed appropriately.
- the correction process may be performed by determining the first dye value using the area average signal ratio in the correction area determined to be the ⁇ degree correction area''.
- the hardware structure of a processing unit that executes various processes, such as the index value link line generation unit 290, is the following various processors.
- processors include CPUs (Central Processing Units), which are general-purpose processors that execute software (programs) and function as various processing units, and programmable processors, which are processors whose circuit configuration can be changed after manufacturing, such as FPGAs.
- CPUs Central Processing Units
- programmable processors which are processors whose circuit configuration can be changed after manufacturing, such as FPGAs.
- logic devices Programmable Logic Devices: PLDs
- dedicated electric circuits that are processors with circuit configurations specifically designed to execute various types of processing, and the like.
- One processing unit may be composed of one of these various types of processors, or may be composed of a combination of two or more processors of the same type or different types (for example, multiple FPGAs or a combination of a CPU and an FPGA). may be done. Further, the plurality of processing units may be configured with one processor. As an example of configuring multiple processing units with one processor, first, as typified by computers such as clients and servers, one processor is configured with a combination of one or more CPUs and software, There is a form in which this processor functions as a plurality of processing units. Second, there are processors that use a single IC (Integrated Circuit) chip, such as System On Chip (SoC), which implements the functions of an entire system that includes multiple processing units. be. In this way, various processing units are configured using one or more of the various processors described above as a hardware structure.
- SoC System On Chip
- the hardware structure of these various processors is, more specifically, an electric circuit (circuitry) in the form of a combination of circuit elements such as semiconductor elements.
- the hardware structure of the storage unit is a storage device such as an HDD (hard disk drive) or an SSD (solid state drive).
Landscapes
- Health & Medical Sciences (AREA)
- Life Sciences & Earth Sciences (AREA)
- Physics & Mathematics (AREA)
- Surgery (AREA)
- Optics & Photonics (AREA)
- Biomedical Technology (AREA)
- Animal Behavior & Ethology (AREA)
- Veterinary Medicine (AREA)
- Public Health (AREA)
- Engineering & Computer Science (AREA)
- Biophysics (AREA)
- Heart & Thoracic Surgery (AREA)
- Medical Informatics (AREA)
- Molecular Biology (AREA)
- Pathology (AREA)
- General Health & Medical Sciences (AREA)
- Nuclear Medicine, Radiotherapy & Molecular Imaging (AREA)
- Radiology & Medical Imaging (AREA)
- Spectroscopy & Molecular Physics (AREA)
- Astronomy & Astrophysics (AREA)
- General Physics & Mathematics (AREA)
- Endoscopes (AREA)
Abstract
生体の状態を示す指標値の空間的変化をユーザーに視認させることができる内視鏡システム及びその作動方法を提供する。 内視鏡システム(10)は、画像信号を生成する内視鏡(12)及びプロセッサを備える。プロセッサは、内視鏡画像に複数の関心領域(212a)、関心領域(212b)、関心領域(212c)を設定し、関心領域の位置を領域位置情報として記憶し、関心領域における画像信号に基づいて生体指標値及び生体指標値の統計値である領域指標値を関心領域ごとに算出し、複数の領域指標値をまとめた指標値表示表(261)を生成し、内視鏡画像、指標値表示表及び複数の領域位置情報を表示する表示用画像(271)を表示する制御を行う。
Description
本発明は、生体の状態を示す指標値を表示する制御を行う内視鏡システム及びその作動方法に関する。
外科的治療を支援するアプローチとして、硬性鏡を用いて撮影される内視鏡画像に基づき、生体の状態を示す指標値を算出し、表示する方法がある。例えば、特許文献1には、光の波長に関する分光情報を少なくとも2種以上含む被検体画像を一定時間毎に取得する画像取得手段と、被検体の関心領域の動きに追従するロックオンエリアを、被検体画像上の関心領域に設定するロックオン設定手段と、被検体画像のうちロックオンエリア部分の画像に基づいて、ロックオンエリアにおける酸素飽和度の時間的変化を監視するために用いられるモニタリング画像を生成するモニタリング画像生成手段と、モニタリング画像を表示する表示手段とを備える医療装置システムが開示されている。上記構成により、腹腔鏡の先端部における動きなどによって被検体の撮像エリアが変化したとしても、被検体における酸素飽和度の時間的変化を確実にモニタリングすることができる。特許文献1では、生体の状態を示す指標値として、酸素飽和度を算出している。
内視鏡画像に基づく生体の状態を示す指標値を用いて外科的治療の支援を行う場合、生体の状態を示す指標値のモニタリングを、内視鏡画像に含まれる1つの局所領域について行うのみでは、体の状態を示す指標値の空間的変化を知りたい場面、特に、広範囲にわたる病変の切除範囲を決定したい場面においては、不十分な場合がある。そこで、生体の状態を示す指標値の空間的変化を視認することができる技術が求められている。
本発明は、生体の状態を示す指標値の空間的変化をユーザーに視認させることができる内視鏡システム及びその作動方法を提供することを目的とする。
本発明の内視鏡システムは、内視鏡と、プロセッサを備える。内視鏡は、被写体を撮影することにより、画像信号を生成する。プロセッサは、画像信号を取得し、画像信号に基づいて内視鏡画像を生成し、内視鏡画像のうち、互いに異なる位置に複数の関心領域を設定し、内視鏡画像における複数の関心領域の位置を、領域位置情報としてそれぞれ記憶し、関心領域における画像信号に基づき、被写体の状態を示す生体指標値を算出し、それぞれの関心領域における生体指標値に基づき、生体指標値の統計値である領域指標値を関心領域ごとに算出し、複数の領域指標値をまとめて表示する指標値表示表を生成し、内視鏡画像、指標値表示表及び複数の領域位置情報を表示する表示用画像を生成し、表示用画像を表示する制御を行う。
生体指標値は、酸素飽和度及び/又はヘモグロビン指数であることが好ましい。
指標値表示表は、複数の前記領域指標値をグラフ形式で表示することが好ましい。
プロセッサは、領域位置情報と、領域指標値とを対応付けることにより、領域指標値を特定領域指標値として記憶し、特定領域指標値を保持して指標値表示表に表示することが好ましい。
プロセッサは、関心領域における最新の画像信号に基づいて生体指標値を算出し、最新の生体指標値に基づいて領域指標値を関心領域ごとに算出し、指標値表示表に表示される領域指標値を更新することが好ましい。
プロセッサは、領域位置情報と、関心領域とを対応付けることにより、関心領域の内視鏡画像における位置をロックオンエリアとして記憶し、ロックオンエリアにおける画像信号に基づき、生体指標値を算出することが好ましい。
プロセッサは、ロックオンエリアにおける画像信号に基づいて算出された領域指標値を、ロックオンエリアと対応付けることにより、特定ロックオンエリア指標値として記憶し、表示用画像に、特定ロックオンエリア指標値を表示する制御を行うことが好ましい。
ロックオンエリアの位置が、内視鏡画像に含まれない位置である視野外位置である場合、プロセッサは、ロックオンエリアの位置が視野外位置となる直前に記憶された特定ロックオンエリア指標値を、視野外ロックオンエリア指標値とし、かつ、視野外ロックオンエリア指標値を表示する指標値表示表を生成することが好ましい。
プロセッサは、内視鏡画像において少なくとも1つ以上のロックオンエリアを、追加関心領域として設定し、追加関心領域における画像信号に基づき、生体指標値を算出し、追加関心領域における生体指標値の統計値である追加領域指標値を、領域指標値として算出し、追加領域指標値及び視野外ロックオンエリア指標値をまとめて表示する拡張指標値表示表を生成し、表示用画像に、拡張指標値表示表を表示する制御を行うことが好ましい。
プロセッサは、複数の領域位置情報を内視鏡画像に重畳して表示する制御を行い、内視鏡画像に重畳表示される領域位置情報と、拡張指標値表示表に表示され、かつ、領域位置情報と対応する、視野外ロックオンエリア指標値以外の領域指標値と、を結ぶ指標値リンクラインを表示用画像に表示する制御を行うことが好ましい。
プロセッサは、表示用画像に表示される、拡張指標値表示表の表示サイズを変更する制御を行うことが好ましい。
プロセッサは、複数の領域位置情報を内視鏡画像に重畳して表示する制御を行い、内視鏡画像に重畳表示される領域位置情報と、指標値表示表に表示され、かつ、領域位置情報と対応する領域指標値と、を結ぶ指標値リンクラインを表示用画像に表示する制御を行うことが好ましい。
プロセッサは、内視鏡画像において少なくとも1つ以上のロックオンエリアを、追加関心領域として設定し、追加関心領域における画像信号に基づき、生体指標値を算出し、追加関心領域における生体指標値の統計値である追加領域指標値を、領域指標値として算出し、追加領域指標値を表示する指標値表示表を生成し、表示用画像に、追加領域指標値を表示する指標値表示表を表示する制御を行うことが好ましい。
関心領域設定用スイッチを備え、プロセッサは、関心領域設定用スイッチの押下に従って、複数の前記関心領域を設定し、再度の関心領域設定用スイッチの押下に従って、設定された関心領域における領域指標値を算出することが好ましい。
本発明の内視鏡システムの作動方法は、内視鏡が被写体を撮影することにより、生成される画像信号を取得するステップと、画像信号に基づいて内視鏡画像を生成するステップと、内視鏡画像のうち、互いに異なる位置に複数の関心領域を設定するステップと、内視鏡画像における複数の関心領域の位置を、領域位置情報としてそれぞれ記憶するステップと、関心領域における画像信号に基づき、被写体の状態を示す生体指標値を算出するステップと、それぞれの関心領域における生体指標値に基づき、生体指標値の統計値である領域指標値を関心領域ごとに算出するステップと、複数の領域指標値をまとめて表示する指標値表示表を生成するステップと、内視鏡画像、指標値表示表及び複数の領域位置情報を表示する表示用画像を生成するステップと、表示用画像を表示する制御を行うステップと、を有する。
本発明によれば、生体の状態を示す指標値の空間的変化をユーザーに視認させることができる。
[第1実施形態]
図1に示すように、内視鏡システム10は、内視鏡12、光源装置13、プロセッサ装置14、第1ユーザーインターフェース15、拡張プロセッサ装置16及び第2ユーザーインターフェース17を備える。内視鏡12は、光源装置13と光学的又は電気的に接続され、かつ、プロセッサ装置23と電気的に接続される。第1ユーザーインターフェース15は、プロセッサ装置23と電気的に接続される。拡張プロセッサ装置16は、光源装置13、プロセッサ装置14及び第2ユーザーインターフェース17と電気的に接続される。これらのそれぞれの接続は、有線に限られず、無線であってもよい。また、ネットワークを介したものでもよい。
図1に示すように、内視鏡システム10は、内視鏡12、光源装置13、プロセッサ装置14、第1ユーザーインターフェース15、拡張プロセッサ装置16及び第2ユーザーインターフェース17を備える。内視鏡12は、光源装置13と光学的又は電気的に接続され、かつ、プロセッサ装置23と電気的に接続される。第1ユーザーインターフェース15は、プロセッサ装置23と電気的に接続される。拡張プロセッサ装置16は、光源装置13、プロセッサ装置14及び第2ユーザーインターフェース17と電気的に接続される。これらのそれぞれの接続は、有線に限られず、無線であってもよい。また、ネットワークを介したものでもよい。
第1実施形態において、内視鏡システム10は、内視鏡12を、外科的治療を行うために被検者の体腔内に挿入し、漿膜側から体腔内の臓器を撮影する硬性内視鏡、特に腹腔鏡とする用途に好適である。なお、内視鏡12は、被検者の鼻、口又は肛門から挿入される軟性内視鏡であってもよい。また、本明細書では、被検者とは、内視鏡12を挿入される対象のことを意味する。被写体とは、内視鏡12の画角に含まれ、内視鏡画像に写る観察対象のことを意味する。
内視鏡12を腹腔鏡とする場合、内視鏡12は、図2に示すように、被検者の腹腔内に挿入する挿入部12aと、挿入部12aの基端部分に設けられる操作部12bとを備える。挿入部12aの先端付近の部分(これ以降、先端部と呼ぶ。)には、光学系及び撮像センサが内蔵される。光学系には、被写体に照明光を照射するための後述する照明光学系、及び、被写体の像を撮像するための後述する撮像光学系が含まれる。撮像センサは、撮像光学系を透過して入射した観察対象からの反射光を、結像面に結像することにより、画像信号を生成する。生成された画像信号は、プロセッサ装置14に出力される。
操作部12bには、モード切替え用スイッチ12c及び関心領域設定用スイッチ12dが設けられている。モード切替え用スイッチ12cは、後述する観察モードの切り替え操作に用いられる。関心領域設定用スイッチ12dは、後述する関心領域設定指示の入力、及び関心領域内の生体指標値の算出の指示入力に用いられる。なお、詳しくは後述するが、関心領域設定用スイッチ12dを操作することにより、モード切替え用スイッチ12cを用いずにモード切替えが行われるようにしてもよい。
腹腔鏡を用いる外科的治療では、図3に示すように、手術台Otで仰臥位(あおむけ)になった被検者Pの腹腔AC内に、トラカールTrを介して内視鏡12を挿入する。被検者Pの腹腔AC内は、観察野及び術野を確保するために、気腹装置によって二酸化炭素ガスが送り込まれ、膨らんだ状態になっている。また、内視鏡12を挿入するトラカールTrとは異なるトラカールTrを介し、観察野及び術野を広げるための把持鉗子、病変部を有する臓器の一部を切除するための電気メス等の処置具Toが挿入される。
光源装置13は、照明光を発生する。プロセッサ装置14は、内視鏡システム10のシステム制御を行い、さらに、内視鏡12から送信された画像信号に対する画像処理を行うことにより、内視鏡画像を生成する。本明細書において、「内視鏡画像」には、白色光画像、白色光相当画像、酸素飽和度画像、関心領域画像、表示用画像、補正用画像、報知用画像、第3照明光画像、第1青色光画像が含まれる。
第1ユーザーインターフェース15及び第2ユーザーインターフェース17は、ユーザーからの入力操作を受け付け、プロセッサ装置14又は拡張プロセッサ装置16に対して入力信号を送信する、キーボード、マウス、マイク、フットスイッチ、タッチパッド、タブレット、タッチペン等の入力装置である。また、第1ユーザーインターフェース15及び第2ユーザーインターフェース17は、プロセッサ装置14又は拡張プロセッサ装置16からの出力信号を受け、内視鏡画像、音声等の出力を行う、ディスプレイ、ヘッドマウントディスプレイ、スピーカー等の出力装置である。これ以降、特に分けて記載のない場合、第1ユーザーインターフェース15及び第2ユーザーインターフェース17をまとめて示す用語として、第1ユーザーインターフェース15又は第2ユーザーインターフェース17を示す用語として、ユーザーインターフェースと称する。
内視鏡12のモード切替え用スイッチ12c及び関心領域設定用スイッチ12dは、内視鏡12ではなく、ユーザーインターフェースに設けられてもよい。
内視鏡システム10は、通常モード、酸素飽和度モード、補正モードの3つのモードを有する。これら3つのモードは、ユーザーによるモード切替え用スイッチ12cの操作、又は関心領域設定用スイッチ12dを操作によって切り替えられる。
通常モードでは、照明光に白色光を用いて被写体を撮像することによって生成される、自然な色合いの白色光画像をユーザーインターフェースであるディスプレイに表示する。酸素飽和度モードでは、被写体の酸素飽和度を算出し、算出した酸素飽和度を画像化した酸素飽和度画像を、ディスプレイに表示する。また、酸素飽和度モードにおいては、白色光画像よりも短波長成分が少ない白色光相当画像が、ディスプレイに表示される。補正モードでは、後述する特定色素の影響を考慮した、酸素飽和度の算出に関する補正処理を行う。
図4に示すように、光源装置13は、光源部20、及び光源部20を制御する光源制御部21を有する。光源部20は、例えば、複数色のLED(Light Emitting Diode)等の半導体光源、レーザー光源、レーザダイオードと蛍光体との組み合わせ、キセノンランプ、ハロゲン光源等で構成される。光源部20は、例えば、複数の光源を有し、これらをそれぞれ点灯または消灯し、点灯する場合には、各光源の発光量が光源制御部21によって制御されることにより、観察対象を照明する照明光を発する。
第1実施形態では、光源部20は、例えば、図5に示すように、V-LED(Violet Light Emitting Diode)20a、BS-LED(Blue Short -wavelength Light Emitting Diode)20b、BL-LED(Blue Long-wavelength Light Emitting Diode)20c、G-LED(Green Light Emitting Diode)20d、及びR-LED(Red Light Emitting Diode)20eの5色のLEDを有する。なお、各色LEDの組み合わせはこれに限られない。
V-LED20aは、中心波長が410nm±10nmの紫色光Vを発する。BS-LED20bは、中心波長が450nm±10nmの第2青色光BSを発する。BL-LED20cは、中心波長が470nm±10nmの第1青色光BLを発する。G-LED20dは、緑色帯域の緑色光Gを発する。緑色光Gの中心波長は540nmであることが好ましい。R-LED20eは、赤色帯域の赤色光Rを発する。赤色光Rの中心波長は620nmであることが好ましい。なお、各LED20a~20eにおける中心波長とピーク波長は、同じであってもよく、異なっても良い。
光源制御部21は、各LED20a~20eに対して独立に制御信号を入力することによって、各LED20a~20eの点灯、消灯、点灯時の発光量等を独立に制御する。光源制御部21による点灯又は消灯制御は、各モードによって異なり、詳細は後述する。
光源部20から発せられた照明光は、ミラーやレンズなどで構成される光路結合部(図示しない)を介して、ライトガイド41に入射される。ライトガイド41は、内視鏡12及びユニバーサルコード(内視鏡12、光源装置13及びプロセッサ装置14を接続するコード)に内蔵されていてもよい。ライトガイド41は、光路結合部からの光を、内視鏡12の先端部まで伝搬する。
内視鏡12の先端部には、照明光学系42と撮像光学系43が設けられている。照明光学系42は照明レンズ42aを有し、ライトガイド41によって伝搬された照明光は、照明レンズ42aを介して被写体に照射される。なお、内視鏡12が軟性内視鏡であり、光源部20が内視鏡12の先端部に内蔵される場合は、ライトガイド41を介さずに、照明光学系42の照明レンズ42aを透過して照明光が出射される。
撮像光学系43は、対物レンズ43a及び撮像センサ44を有する。照明光が照射された被写体からの反射光は、対物レンズ43aを介して撮像センサ44に入射する。これにより、撮像センサ44に被写体の像が結像される。
撮像センサ44は、被写体からの反射光を撮像するカラー撮像センサ又はモノクロ撮像センサである。撮像センサ44がカラー撮像センサである場合、撮像センサ44の各画素には、B(青色)カラーフィルタを有するB画素(青色画素)、G(緑色)カラーフィルタを有するG画素(緑色画素)、R(赤色)カラーフィルタを有するR画素(赤色画素)のいずれかが設けられている。Bカラーフィルタ、Gカラーフィルタ、及びRカラーフィルタが透過する光の波長帯域と透過率については、後述する。なお、第1実施形態において、撮像センサ44は、B画素とG画素とR画素の画素数の比率が、1:2:1であるベイヤー配列のカラー撮像センサであることが好ましい。
また、撮像センサ44として、CCD(Charge Coupled Device)撮像センサ、CMOS(Complementary Metal-Oxide Semiconductor)撮像センサ等を適用することができる。また、青色画素、緑色画素及び赤色画素を備えるカラー撮像センサの代わりに、C(シアン)、M(マゼンタ)、Y(イエロー)及びG(グリーン)の補色フィルタを備えた補色撮像センサを用いても良い。補色撮像センサを用いる場合には、CMYGの4色の画像信号が出力される。この場合、補色-原色色変換によって、CMYGの4色の画像信号をRGBの3色の画像信号に変換することにより、青色画素、緑色画素及び赤色画素を備えるカラー撮像センサと同様の、後述するようなRGB各色の画像信号を得ることができる。各モードにおける照明光の点灯及び消灯制御、並びに各モードにおける撮像センサ44が出力する画像信号の詳細については後述する。
撮像センサ44は、撮像制御部45によって駆動制御される。撮像制御部45による撮像センサ44の、各モードにおける制御は後述する。CDS/AGC回路46(Correlated Double Sampling/Automatic Gain Control)は、撮像センサ44から得られるアナログの画像信号に相関二重サンプリング(CDS)や自動利得制御(AGC)を行う。CDS/AGC回路46を経た画像信号は、A/Dコンバータ47(Analog/Digital)により、デジタルの画像信号に変換される。A/D変換後の画像信号は、プロセッサ装置14に入力される。
プロセッサ装置14は、中央制御部50、画像信号取得部60、内視鏡画像生成部70、表示制御部80及び画像通信部90を有する。プロセッサ装置14には、各種処理に関するプログラムがプログラム用メモリ(図示しない)に組み込まれている。プロセッサによって構成される中央制御部50が、プログラム用メモリ内のプログラムを実行することによって、画像取得部60、内視鏡画像生成部70、表示制御部80及び画像通信部90の機能が実現する。
画像信号取得部60は、内視鏡12からのA/D変換された画像信号を取得し、内視鏡画像生成部70及び/又は画像通信部90に送信される。
内視鏡画像生成部70は、画像信号に基づいて内視鏡画像を生成する。具体的には、各色の画像信号に対し、デモザイク処理、3×3のマトリックス処理、階調変換処理、3次元LUT(Look Up Table)処理等の色変換処理、及び/又は色彩強調処理、空間周波数強調処理等の構造強調処理である画像処理を施すことにより、内視鏡画像を生成する。なお、デモザイク処理は、各画素の欠落した色の信号を生成する処理である。デモザイク処理により、全画素がRGB各色の信号を有するようになる。デモザイク処理は、後述する拡張プロセッサ装置16においても行われる。
内視鏡画像生成部70は、モードに応じた画像処理を行うことにより、内視鏡画像を生成する。通常モードの場合、内視鏡画像生成部70は、通常モード用の画像処理を行うことにより、白色光画像を生成する。酸素飽和度モードの場合、内視鏡画像生成部70は、白色光相当画像を生成する。
また、酸素飽和度モードの場合、画像信号取得部60は、画像通信部90を介し、画像信号を拡張プロセッサ装置16に送信する。補正モードの場合も、酸素飽和度モードの場合と同様に、内視鏡画像生成部70において白色光相当画像が生成され、また、各色の画像信号は、画像通信部90を介し、拡張プロセッサ装置16に送信される。
表示制御部80及び拡張プロセッサ装置16の拡張表示制御部200は、ユーザーインターフェースへの出力に関する制御を行う。表示制御部80は、内視鏡画像生成部70が生成する内視鏡画像を、ユーザーインターフェースであるディスプレイに表示するための表示制御を行う。また、表示制御部80は、拡張プロセッサ装置16が生成する内視鏡画像を、ユーザーインターフェースであるディスプレイに表示するための表示制御を行うようにしてもよい。
拡張プロセッサ装置16は、プロセッサ装置14から画像信号を受信し、各種の画像処理を行う。拡張プロセッサ装置16は、酸素飽和度モードにおいて、酸素飽和度を算出し、算出した酸素飽和度を画像化した酸素飽和度画像を生成する。拡張プロセッサ装置16の、後述する拡張表示制御部200は、拡張プロセッサ装置16が生成する内視鏡画像を、ユーザーインターフェースであるディスプレイに表示するための表示制御を行う。また、拡張プロセッサ装置16は、補正モードにおいて、酸素飽和度の算出に関する補正処理を行う。拡張プロセッサ装置16が行う、酸素飽和度モード及び補正モードにおける画像信号に対する処理の詳細については、後述する。なお、酸素飽和度モード及び補正モードにおいて、拡張プロセッサ装置16は、プロセッサ装置14から受信した画像信号に対するデモザイク処理を行った上で、後述する信頼度の算出、補正処理、酸素飽和度を含む生体指標値の算出、酸素飽和度画像の生成、表示用画像の生成等を行う。
通常モードの場合、プロセッサ装置14の表示制御部80は、図6に示すように、白色光画像81を第1ユーザーインターフェース15であるディスプレイに表示する。一方、第2ユーザーインターフェース17であるディスプレイには何も表示しない。図6に示す例では、第2ユーザーインターフェース17であるディスプレイに何も表示されていないことを、斜線で示している。
酸素飽和度モードの場合、プロセッサ装置14の表示制御部80は、図7に示すように、白色光相当画像201を、第1ユーザーインターフェース15であるディスプレイに表示する。また、拡張プロセッサ装置16の拡張表示制御部200は、酸素飽和度画像202を、第2ユーザーインターフェース17であるディスプレイに表示する。なお、拡張プロセッサ装置16の拡張表示制御部200は、後述する表示用画像又は関心領域画像を、第2ユーザーインターフェース17であるディスプレイに表示する。拡張表示制御部200による表示制御については後に詳述する。
また、酸素飽和度モードに切り替えた場合、プロセッサ装置14の表示制御部80は、ユーザーインターフェースであるディスプレイに、図8に示すような、「補正処理を実施して下さい」とのメッセージMS0を表示する報知用画像82を表示し、補正モードへの切り替えをユーザーに促すようにしてもよい。酸素飽和度モードでは、補正モードにおける補正処理が行われた後に、ディスプレイに酸素飽和度画像を表示することが好ましい。なお、補正処理を行わない場合にも、後述する拡張表示制御部200が、酸素飽和度画像を表示する制御を行うようにしてもよい。
補正モードの場合、プロセッサ装置14の表示制御部80は、図9に示すように、白色光相当画像を、第1ユーザーインターフェース15であるディスプレイに表示する。また、第2ユーザーインターフェース17であるディスプレイには、図9に示すように、何も表示しない(斜線で示す)か、又は報知用画像82、後述する表示用画像、後述する補正酸素飽和度を後述するベース画像に反映させた酸素飽和度画像、補正用画像、若しくは警告表示用画像を表示する。第2ユーザーインターフェース17に対する画像の表示制御は、拡張プロセッサ装置16の拡張表示制御部200によって制御される。
補正モードを経ずに酸素飽和度モードに切り替えられた場合は、酸素飽和度画像を表示せず、メッセージMS0を表示する報知用画像82をディスプレイに表示することで、補正モードへの切替えユーザーに促す。補正モードにおいて補正処理が完了された場合は、自動的又はユーザーによるモード切替えの操作により、酸素飽和度モードに切り替わる。また、補正モードにおいて補正処理が完了された場合、「補正処理が完了しました」のメッセージを表示する報知用画像82を表示することにより、補正モードから酸素飽和度モードへの切替えをユーザーに促すようにしてもよい。
以下、各モードにおける点灯又は消灯制御について説明を行う。まず、各モードにおいて発光される照明光について説明する。第1実施形態の通常モードにおいては、白色光が、光源部20から発光される。白色光は、V-LED20a、BS-LED20b、G-LED20d及びR-LED20eを同時に点灯することによって発光される、図10に示すような波長帯域をそれぞれ有する、紫色光V、第2青色光BS、緑色光G、赤色光Rを含む、広帯域の照明光である。
また、第1実施形態の酸素飽和度モードにおいては、算出用照明光(以下、第1照明光と呼ぶ。)及び白色相当光(以下、第2照明光と呼ぶ。)が、光源部20から発光される。第1照明光は、BL-LED20c、G-LED20d及びR-LED20eを同時に点灯することによって発光される、図11に示すような波長帯域をそれぞれ有する、第1青色光BL、緑色光G及び赤色光Rを含む、白色光とは波長帯域が互いに異なる広帯域の照明光である。
第2照明光は、BS-LED20b、G-LED20d及びR-LED20eを同時に点灯することによって発光される、図12に示すような波長帯域をそれぞれ有する、第2青色光BS、緑色光G、赤色光Rを含む照明光である。
また、第1実施形態の補正モードにおいては、第1照明光、第2照明光、及び補正用照明光(以下、第3照明光と呼ぶ。)が、光源部20から発光される。第3照明光は、G-LED20dを点灯することによって発光される、図13に示すような波長帯域を有する、緑色光Gからなる照明光である。本明細書において、「照明光」の文言は、白色光、第1照明光、第2照明光、第3照明光、混合光、第4照明光、紫色光V、第1青色光BL、第2青色光BS、緑色光G若しくは赤色光Rのいずれか1つ、若しくはこれらの光をまとめて意味する用語、又は光源装置13から出射される光を意味する用語として用いる。なお、図10、図11、図12及び図13では、簡単のため、各照明光の光強度を一定の値としているが、各照明光の光強度は、一定に限られない。なお、第3照明光は、図13に示すような単色の光に限られず、複数色の光を用いた照明光であってもよい。
以下、各モードにおける発光パターンについて説明を行う。第1実施形態の通常モードにおいては、通常モード用発光パターンに従い、各光源の点灯又は消灯制御が行われる。通常モード用発光パターンは、図14に示すような、1回の白色光照明期間Pcに、白色光Lcを発光するパターンを繰り返す発光パターンである。照明期間とは、照明光を点灯する一定時間のことを意味する。また、1フレームにつき、1回の照明期間が設けられる。フレームとは、照明光の発光のタイミングから、撮像センサ44による画像信号の読み出し完了までの間の期間を少なくとも含む期間の単位のことをいう。
また、第1実施形態の酸素飽和度モードにおいては、酸素飽和度モード用発光パターンに従い、各光源の点灯又は消灯制御が行われる。酸素飽和度モード用発光パターンは、図15に示すような、1回の第1照明期間P1に第1照明光L1を発光し、1回の第2照明期間P2に第2照明光L2を発光する発光パターンを繰り返す発光パターンである。
また、第1実施形態の補正モードにおいては、補正モード用発光パターンに従い、各光源の点灯又は消灯制御が行われる。補正モード用発光パターンは、図16に示すような、1回の第1照明期間P1に第1照明光L1を発光し、1回の第2照明期間P2に第2照明光L2を発光し、1回の第3照明期間P3に第3照明光L3を発光し、1回の第2照明期間P2に第2照明光L2を発光する発光パターンを繰り返す発光パターンである。すなわち、補正モード用発光パターンは、第1照明光L1、第2照明光L2、第3照明光L3、第2照明光L2、……、の順番に、照明光を発光する発光パターンである。
以下、各モードにおいて、撮像センサ44から出力される画像信号について説明する。まず、撮像センサ44が有する、Bカラーフィルタ、Gカラーフィルタ及びRカラーフィルタが透過する光の波長帯域と透過率について説明する。
図17に示すように、撮像センサ44のB画素に設けられるBカラーフィルタBFは、主として青色帯域の光、具体的には、波長帯域が380~560nm(青色透過帯域)の光を透過させる。透過率が最大となるピーク波長は460~470nm付近に存在する。撮像センサ44のG画素に設けられるGカラーフィルタGFは、主として緑色帯域の光、具体的には、波長帯域が450~630nm(緑色透過帯域)の光を透過させる。撮像センサ44のR画素に設けられるRカラーフィルタRFは、主として赤色帯域の光、具体的には580~760nm(赤色透過帯域)の光を透過させる。
以下、各モードにおいて出力される画像信号について説明する。第1実施形態の通常モードにおいて、撮像制御部45は、白色光で照明された被写体からの反射光を、1フレームごとに撮影するように、撮像センサ44を制御する。このような制御により、第1実施形態の通常モードでは、図18に示すように、紫色光V、第2青色光BS、緑色光G及び赤色光Rを含む白色光が出射される白色光照明期間Pcを含むフレームごとに、撮像センサ44のB画素からBc画像信号が、G画素からGc画像信号が、R画素からRc画像信号が、それぞれ出力される。
第1実施形態の酸素飽和度モードにおいて、撮像制御部45は、第1照明光又は第2照明光で照明された被写体からの反射光を、1フレームごとに撮影するように、撮像センサ44を制御する。このような制御により、第1実施形態の酸素飽和度モードでは、図19に示すように、第1青色光BL、緑色光G及び赤色光Rを含む第1照明光が出射される第1照明期間P1を含むフレームごとに、撮像センサ44のB画素からB1画像信号が、G画素からG1画像信号が、R画素からR1画像信号が、それぞれ出力される。また、第2青色光BS、緑色光G、及び赤色光Rを含む第2照明光が出射される第2照明期間P2を含むフレームごとに、撮像センサ44のB画素からB2画像信号が、G画素からG2画像信号が、R画素からR2画像信号が、それぞれ出力される。
第1実施形態の補正モードにおいて、撮像制御部45は、第1照明光、第2照明光又は第3照明光で照明された被写体からの反射光を、1フレームごとに撮影するように、撮像センサ44を制御する。このような制御により、第1実施形態の補正モードでは、図20に示すように、第1青色光BL、緑色光G及び赤色光Rを含む第1照明光が出射される第1照明期間P1を含むフレームごとに、撮像センサ44のB画素からB1画像信号が、G画素からG1画像信号が、R画素からR1画像信号が、それぞれ出力される。また、第2青色光BS、緑色光G、及び赤色光Rを含む第2照明光が出射される第2照明期間P2を含むフレームごとに、撮像センサ44のB画素からB2画像信号が、G画素からG2画像信号が、R画素からR2画像信号が、それぞれ出力される。さらに、緑色光Gを含む第3照明光が出射される第3照明期間P3を含むフレームごとに、撮像センサ44のB画素からB3画像信号が、G画素からG3画像信号が、R画素からR3画像信号がそれぞれ出力される。図18、図19及び図20では、1回の照明期間に発光される照明光と、1回の照明期間を含むフレームに出力される画像信号との関係について表している。
以下、各モードにおいて出力されるそれぞれの画像信号の特性、酸素飽和度算出用テーブル及び補正処理について説明する。酸素飽和度モードでは、酸素飽和度を算出するために、酸素飽和度モードにおいて出力される画像信号のうち、B1画像信号、G2画像信号及びR2画像信号が用いられる。
補正モードでは、酸素飽和度の算出精度に影響を与える特定色素の存在を考慮し、酸素飽和度算出用テーブルを補正するために、補正モードにおいて出力される画像信号のうち、B1画像信号、G2画像信号及びR2画像信号、加えて、B3画像信号及びG3画像信号が用いられる。
酸素飽和度モード及び補正モードにおいて、観察対象である生体組織に向けて出射される第1照明光が有する波長帯域と、第1照明光を用いて生体組織を照明することによって得られる反射光のうち、生体組織中の還元ヘモグロビン(Hb)及び酸化ヘモグロビン(HbO2)からの反射光の光強度との関係を示すヘモグロビン反射スペクトルは、血液濃度によって変化する。血液濃度とは、生体組織に含まれるヘモグロビン濃度(血色素量)のことを意味する。なお、還元ヘモグロビン(Hb)とは、酸素(O2)と結合していないヘモグロビンである。また、酸化ヘモグロビン(HbO2)とは、酸素(O2)と結合しているヘモグロビンである。
特定色素が生体組織中に含まれない場合のヘモグロビン反射スペクトル100は、図21に示すような曲線でそれぞれ表される。図21に示す曲線のうち、実線で示す曲線101a、101bは、血液濃度が高い場合のヘモグロビンの反射スペクトルを表している。曲線101aは、血液濃度が高い場合の還元ヘモグロビン(Hb)の反射スペクトルを表し、曲線101bは、血液濃度が高い場合の酸化ヘモグロビン(HbO2)の反射スペクトルを表している。
図21に示す曲線のうち、破線で示す曲線102a、102bは、血液濃度が低い場合のヘモグロビンの反射スペクトルを表している。曲線102aは、血液濃度が低い場合の還元ヘモグロビン(Hb)の反射スペクトルを表し、曲線102bは、血液濃度が低い場合の酸化ヘモグロビン(HbO2)の反射スペクトルを表している。
B1画像信号は、中心波長が470nm±10nmの第1青色光BLを含む第1照明光で被写体を照明することによって反射される反射光のうち、BカラーフィルタBFを透過した光を撮像センサ44が撮影することにより、B画素から出力される画像信号である。このため、第1青色光BLの波長帯域(図11参照)と、撮像センサ44のBカラーフィルタBFの透過帯域(図17参照)との関係から、B1画像信号は、図21に示す、波長帯域B1の情報を含む。なお、波長帯域B1は、図21の曲線101a、101b(血液濃度が高い場合)又は曲線102a、102b(血液濃度が低い場合)で示す、還元ヘモグロビン(Hb)と、酸化ヘモグロビン(HbO2)との反射スペクトルの差が大きい波長帯域(460nm~480nm)である。
G2画像信号は、緑色光Gを含む第2照明光で被写体を照明することによって反射される反射光のうち、GカラーフィルタGFを透過した光を撮像センサ44が撮影することにより、G画素から出力される画像信号である。このため、緑色光Gの波長帯域(図12参照)と、撮像センサ44のGカラーフィルタGFの透過帯域(図17参照)との関係から、G2画像信号は、図21に示す、波長帯域G2の情報を含む。
R2画像信号は、赤色光Rを含む第2照明光で被写体を照明することによって反射される反射光のうち、RカラーフィルタRFを透過した光を撮像センサ44が撮影することにより、R画素から出力される画像信号である。このため、赤色光Rの波長帯域(図12参照)と、撮像センサ44のRカラーフィルタRFの透過帯域(図17参照)との関係から、R2画像信号は、図21に示す、波長帯域R2の情報を含む。
観察対象には、還元ヘモグロビン(Hb)又は酸化ヘモグロビン(HbO2)以外の色素であって、酸素飽和度の算出に影響を与える色素である特定色素が含まれることがある。特定色素は、例えば、黄色色素である。特定色素が生体組織中に含まれる場合では、特定色素の吸光スペクトルがさらに考慮されるため、特定色素が生体組織中に含まれない場合(図21参照)とは、ヘモグロビンの反射スペクトルが一部異なる。特定色素が生体組織中に含まれる場合のヘモグロビン反射スペクトル103の例を、図22(A)に示す。
図22(A)には、図21に示される曲線のうち、血液濃度が高い場合の還元ヘモグロビン(Hb)の反射スペクトル(曲線101a)と、血液濃度が高い場合の酸化ヘモグロビン(HbO2)の反射スペクトルとが示されている。また、図21に示される波長帯域B1、波長帯域G2、波長帯域R2が示されている。
ここで、図22(B)に示す黄色色素の吸光スペクトル104を参照すると、図22(A)に示す、還元ヘモグロビン(Hb)と、酸化ヘモグロビン(HbO2)との反射スペクトルの差が大きい帯域である波長帯域B1において、黄色色素の吸光スペクトルが大きくなっている。このため、中心波長が470nm±10nmの第1青色光BLを含む第1照明光で観察対象を照明した場合、第1照明光(特に、第1青色光BL)の一部が、黄色色素に吸収されてしまう。
したがって、観察対象である生体組織中に黄色色素が存在する場合は、図22(A)の曲線101cで示すように、還元ヘモグロビン(Hb)の反射スペクトルが、特定色素が存在しない場合の還元ヘモグロビン(Hb)の反射スペクトル(曲線101a)よりも、特に波長帯域B1の帯域において低くなる。結果として、黄色色素が存在する場合は、B1画像信号の信号値が低下する。なお、図22(B)に示す波長帯域B3、波長帯域G3は、黄色色素によるヘモグロビン反射スペクトルへの影響が、波長帯域B1よりも小さい帯域である。波長帯域B3、波長帯域G3については後に詳説する。
酸素飽和度モード及び補正モードにおいて、撮像センサ44から出力される画像信号であるB1画像信号、G2画像信号及びR2画像信号には、図23に示すように、酸素飽和度、血液濃度、明るさに対する依存性をいずれも有する。酸素飽和度に対する依存性(酸素飽和度依存性)とは、酸素飽和度の高低に応じた信号値(又は後述する信号比)の変化の程度のことであり、図23では、酸素飽和度依存性を「大」「中」「小」で定性的に表現している。
また、血液濃度に対する依存性(血液濃度依存性)とは、血液濃度の高低に応じた信号値(又は後述する信号比)の変化の程度のことであり、図23では、血液濃度依存性を「大」「中」「小」で定性的に表現している。また、明るさに対する依存性(明るさ依存性)とは、明るさの高低に応じて信号値(又は後述する信号比)が変化するかどうかを意味しており、図23では、明るさ依存性が有る場合は「有」、明るさ依存性が無い場合は「無」と表している。
図23に示すように、B1画像信号(図23では、「B1」で示す)の酸素飽和度依存性は「大」、血液濃度依存性は「中」、明るさ依存性は「有」である。同様に、G2画像信号(図23では、「G2」で示す)の酸素飽和度依存性は「小」、血液濃度依存性は「大」、明るさ依存性は「有」である。R2画像信号(図23では、「R2」で示す)の酸素飽和度依存性は「中」、血液濃度依存性は「小」、明るさ依存性は「有」である。
上記したように、B1画像信号、G2画像信号、R2画像信号のいずれも明るさ依存性を有する。このため、酸素飽和度を算出するための酸素飽和度算出用テーブル110は、G2画像信号を規格化信号として用い、B1画像信号をG2画像信号で規格化した信号比ln(B1/G2)と、R2画像信号をG2画像信号で規格化した信号比ln(R2/G2)との関係により、作成される。なお、信号比ln(B1/G2)の「ln」は自然対数である(信号比ln(R2/G2)も同様である。)。
なお、酸素飽和度算出用テーブル110は、試験的に取得された画像信号の信号比と、酸素飽和度との相関関係を用いることにより、予め作成され、拡張プロセッサ装置17に記憶されている。酸素飽和度算出用テーブル110の生成のための画像信号は、ある酸素飽和度を有する生体を模したファントムを、複数段階の酸素飽和度に応じて複数個用意し、それぞれのファントムを撮影することによって得られる。また、シミュレーションにより、画像信号の信号比と、酸素飽和度との相関関係を予め得るようにしてもよい。
信号比ln(B1/G2)及び信号比ln(R2/G2)と、酸素飽和度との相関関係を、信号比ln(R2/G2)をX軸、信号比ln(B1/G2)をY軸の2次元座標系で表した場合、図24に示すような酸素飽和度算出用テーブル110上の等高線ELとして表される。等高線ELは、X成分の値(信号比ln(R2/G2))と、Y成分の値(信号比ln(B1/G2))との関係において、酸素飽和度が同じになる点(X1,Y1)=(ln(R2/G2)、ln(B1/G2))を繋ぐことによって描かれる線である。等高線ELHは、酸素飽和度が「100%」であることを示す等高線である。等高線ELLは、酸素飽和度が「0%」であることを示す等高線である。図24に示す酸素飽和度算出用テーブル110上において、等高線は、等高線ELHから等高線ELLに向けて、酸素飽和度が徐々に小さくなるように、等高線が分布している(図24では酸素飽和度が「80%」、「60%」、「40%」、「20%」の等高線が描かれている)。
X成分の値(信号比ln(R2/G2))及びY成分の値(信号比ln(B1/G2))は、図25に示すように、酸素飽和度依存性、血液濃度依存性をそれぞれ有する。なお、明るさ依存性に関しては、図25に示すように、X成分の値、Y成分の値はそれぞれG2画像信号で規格化されているため、明るさ依存性が「無」とされる。X成分の値については、酸素飽和度依存性は「中」、血液濃度依存性は「大」である。一方、Y成分の値については、酸素飽和度依存性は「大」であり、血液濃度依存性は「中」である。
ここで、B1画像信号、G2画像信号及びR2画像信号は、図26に示すように、酸素飽和度依存性、血液濃度依存性及び明るさ依存性に加えて、黄色色素に対する依存性(黄色色素依存性)を有する。黄色色素依存性とは、黄色色素濃度の高低に応じた信号値(又は信号比)の変化の程度のことであり、図26では、黄色色素依存性を「大」「中」「小」で定性的に表現している。
図26には、図23に示されるB1画像信号、G2画像信号及びR2画像信号の酸素飽和度依存性、血液濃度依存性及び明るさ依存性に加えて、B1画像信号、G2画像信号及びR2画像信号の黄色色素依存性について示している。図26に示すように、B1画像信号(図26では、「B1」で示す)の黄色色素依存性は「大」である。これは、図22(A)に示したように、黄色色素が存在する場合には、波長帯域B1の帯域における還元ヘモグロビン(Hb)の反射スペクトルが小さくなることにより、B1画像信号の信号値が低下するためである。また、G2画像信号(図26では、「G2」で示す)の黄色色素依存性は「小~中」である。R2画像信号(図26では、「R2」で示す)の黄色色素依存性は「小」である。
また、黄色色素の存在によってB1画像信号の信号値が低下すると、図24に示すような酸素飽和度算出用テーブル110を用いて酸素飽和度を算出する場合において、Y成分の値(信号比ln(B1/G2))も低下する。このため、図27に示すように、酸素飽和度算出用テーブル110においては、黄色色素の存在によって、黄色色素が存在しない場合の酸素飽和度StO2Aよりも、黄色色素が存在する場合の酸素飽和度StO2Bが、見かけ上、酸素飽和度が高くなるように算出されてしまう。
上記の理由により、黄色色素が存在する場合には、黄色色素の濃度に応じて、より適切な酸素飽和度を算出するための補正処理を行うことが好ましい。そこで、補正モードでは、第3照明光を被写体に照明することで得られる反射光を撮影することにより、B3画像信号及びG3画像信号をさらに取得する。
B3画像信号は、第3照明光で被写体を照明することによって得られる反射光のうち、BカラーフィルタBFを透過した光を撮像センサ44が撮影することにより、B画素から出力される画像信号である。このため、緑色光Gの波長帯域(図13参照)と、撮像センサ44のBカラーフィルタBFの透過帯域(図17参照)との関係から、B3画像信号は、図22(B)に示す、波長帯域B3の情報を含む。
G3画像信号は、緑色光Gからなる第3照明光で被写体を照明することによって得られる反射光のうち、GカラーフィルタGFを透過した光を撮像センサ44が撮影することにより、G画素から出力される画像信号である。このため、緑色光Gの波長帯域(図13参照)と、撮像センサ44のGカラーフィルタGFの透過帯域(図17参照)との関係から、G3画像信号は、図22(B)に示す、波長帯域G3の情報を含む。
B3画像信号及びG3画像信号は、図28に示すように、B1画像信号、G2画像信号及びR2画像信号と同様に、酸素飽和度依存性、血液濃度依存性及び明るさ依存性に加えて、黄色色素依存性を有する。図28に示すように、B3画像信号(図28では、「B3」で示す)の酸素飽和度依存性は「小」、血液濃度依存性は「大」、黄色色素依存性は「中」、明るさ依存性は「有」である。また、G3画像信号(図28では、「G3」で示す)については、G2画像信号と同じく、酸素飽和度依存性は「小」、血液濃度依存性は「大」、黄色色素依存性は「小~中」、明るさ依存性は「有」である。
なお、図28に示すように、B2画像信号も、黄色色素依存性が「大」であるため、補正処理に際して、B3画像信号の代わりに、B2画像信号を用いてもよい。また、図28に示すように、B2画像信号の酸素飽和度依存性は「小」、血液濃度依存性は「大」、明るさ依存性は「有」である。
特定色素の濃度を考慮した酸素飽和度の算出には、図29に示すような、補正酸素飽和度算出用テーブル120を用いる。補正酸素飽和度算出用テーブル120は、信号比ln(B1/G2)、信号比ln(R2/G2)及び信号比ln(B3/G3)と、特定色素の濃度に応じた酸素飽和度との相関関係を表すテーブルである。信号比ln(B3/G3)は、B3画像信号をG3画像信号で規格化した信号比である。なお、補正酸素飽和度算出用テーブル120は、酸素飽和度算出用テーブル110と同様に、予め作成され、拡張プロセッサ装置17に記憶されている。
補正酸素飽和度算出用テーブル120には、図29(A)に示すように、信号比ln(R2/G2)をX軸、信号比ln(B1/G2)をY軸、信号比ln(B3/G3)をZ軸とする3次元座標系に、酸素飽和度を表す曲面CV0~CV4が、黄色色素の濃度(以下、第1色素値と呼ぶ。)に応じて、Z軸方向に分布される。曲面CV0は、第1色素値が「0」である場合(黄色色素が存在しないか、存在するもののごく微量であるために酸素飽和度の算出への影響がない場合)の酸素飽和度を表している。曲面CV1~CV4は、それぞれ第1色素値が「1」~「4」の場合の酸素飽和度を表している。第1色素値は、大きくなるほど、黄色色素の濃度が大きいことを表している。なお、曲面CV0~CV4に示すように、第1色素値が大きくなるほど、Z軸の値が低くなる方向に変化する。
図29(A)に示すように、信号比ln(R2/G2)をX軸、信号比ln(B1/G2)をY軸、信号比ln(B3/G3)をZ軸とする3次元座標系において表現される、第1色素値に応じた酸素飽和度(曲面CV0~CV4)を、信号比ln(R2/G2)をX軸、信号比ln(B1/G2)をY軸とする2次元座標系122で表現した場合には、図29(B)に示すように、酸素飽和度を表す領域AR0~AR4が、それぞれ第1色素値に応じて異なる位置に分布する。領域AR0~AR4は、それぞれ第1色素値が「0」~「4」の場合の酸素飽和度の分布を表している。これら領域AR0~AR4ごとに酸素飽和度を表す等高線EL(図24参照)を定めることによって、黄色色素の濃度に対応した酸素飽和度を求めることができる。なお、領域AR0~AR4に示すように、第1色素値が大きくなるほど、X軸の値が高くなり、Y軸の値が低くなる。
なお、図30に示すように、X成分の値(信号比ln(R2/G2))、Y成分の値(信号比ln(B1/G2))及びZ成分の値(信号比ln(B3/G3))は、酸素飽和度依存性、血液濃度依存性、黄色色素依存性をそれぞれ有する。X成分の値の黄色色素依存性は「小~中」であり、Y成分の値の黄色色素依依存性は「大」であり、Z成分の値の黄色色素依存性は「中」である。また、Z軸の値については、酸素飽和度依存性が「小~中」であり、血液濃度依存性が「小~中」である。また、X成分の値及びY成分の値については、G2画像信号で規格化されていることから、また、Z成分の値については、G3画像信号で規格化されていることから、明るさ依存性は「無」である。
すなわち、第1実施形態の補正モードにおける「補正処理」とは、酸素飽和度モードにおいて取得される画像信号に加えて、黄色色素依存性を有し、酸素飽和度依存性及び血液濃度依存性が異なる画像信号をさらに取得し、3次元座標系で表される補正酸素飽和度算出用テーブル120を参照し、特定色素濃度に応じた酸素飽和度算出用テーブルを選択する処理のことである。補正処理を完了後に、再び酸素飽和度モードに切り替えることで、観察中の組織の特定色素濃度に応じた酸素飽和度算出用テーブルを用いて、より正確な酸素飽和度を算出することができる。
図31に示すように、拡張プロセッサ装置16は、酸素飽和度画像生成部130、補正酸素飽和度算出部140、テーブル補正部141、拡張中央制御部150、信頼度算出部160、補正判定部170、拡張表示制御部200、関心領域設定部210、領域位置情報記憶部240、領域指標値算出部250、指標値表示表生成部260、表示用画像生成部270を備えている。拡張プロセッサ装置16には、各種処理に関するプログラムがプログラム用メモリ(図示しない)に組み込まれている。プロセッサによって構成される拡張中央制御部150がプログラム用メモリ内のプログラムを実行することによって、酸素飽和度画像生成部130、補正酸素飽和度算出部140、テーブル補正部141、信頼度算出部160、補正判定部170、拡張表示制御部200、関心領域設定部210、領域位置情報記憶部240、領域指標値算出部250、指標値表示表生成部260及び表示用画像生成部270の機能が実現する。
酸素飽和度画像生成部130は、ベース画像生成部131、演算値算出部132、酸素飽和度算出部133及び色調調整部134を有する。ベース画像生成部131は、プロセッサ装置14の画像通信部90から送信される画像信号に基づき、ベース画像を生成する。ベース画像は、観察対象の形状など形態情報を把握することができる画像であることが好ましい。例えば、ベース画像は、B2画像信号、G2画像信号及びR2画像信号を用いて生成される白色光相当画像である。なお、ベース画像は、狭帯域光で被写体を照明することによって得られる、血管、腺管構造等を強調表示された狭帯域光画像であってもよい。
演算値算出部132は、画像通信部90から送信される画像信号に基づき、演算処理によって演算値を算出する。具体的には、演算値算出部132は、酸素飽和度の算出に用いる演算値として、B1画像信号とG2画像信号との信号比B1/G2、及びR2画像信号とG2画像信号との信号比R2/G2を算出する。また、補正モードにおいては、B3画像信号とG3画像信号との信号比B3/G3を算出する。なお、信号比B1/G2、信号比R2/G2及び信号比B3/G3については、さらにそれぞれ対数化(ln)することが好ましい。また、演算値としては、B1画像信号、G2画像信号、R2画像信号、B3画像信号又はG3画像信号を用いて変換及び算出される色差信号Cr、Cb、彩度S、色相H等を用いてもよい。
酸素飽和度算出部133は、演算値を用い、酸素飽和度算出用テーブル110を参照することにより(図24参照)、酸素飽和度を算出する。酸素飽和度算出部133は、酸素飽和度算出用テーブル110を参照し、信号比B1/G2、R2/G2に対応する酸素飽和度を画素ごとに算出する。例えば、図32に示すように、特定の画素の信号比がln(B1*/G2*)、ln(R2*/G2*)である場合には、信号比がln(B1*/G2*)、ln(R2*/G2*)に対応する酸素飽和度は「40%」である。この場合、酸素飽和度算出部133は、特定の画素の酸素飽和度を「40%」と算出する。なお、酸素飽和度は、被写体である観察対象の状態を示す値である、後述する生体指標値のひとつである。
色調調整部134は、酸素飽和度算出部133で算出した酸素飽和度を用い、色調調整処理を行うことにより、酸素飽和度画像を生成する。色調調整処理としては、例えば、酸素飽和度に応じた色を割り当てた疑似カラー処理によって、酸素飽和度画像を生成する。疑似カラー処理を行う場合には、ベース画像は不要となる。
色調調整処理の他の具体例として、酸素飽和度画像生成用閾値を予め設定し、ベース画像において、酸素飽和度が酸素飽和度画像生成用閾値以上である画素については、色調を維持し、酸素飽和度が酸素飽和度画像生成用閾値未満の画素については、酸素飽和度に応じて色調を変更する処理を行うことにより、酸素飽和度画像を生成する。このような色調調整処理を行う場合は、酸素飽和度が比較的高い(酸素飽和度画像生成用閾値以上である)領域の色調が維持される一方、酸素飽和度が比較的低い(酸素飽和度画像生成用閾値未満である)領域の色調を変化させているため、例えば、酸素飽和度が高い部位の形態情報を観察可能な状況下で、酸素飽和度が低い部位を把握することが可能となる。
外科手術後では、通常であれば、切開及び縫合を行った箇所において組織の癒合が起こり、治癒に至る。一方で、何らかの原因により、縫合箇所における組織の癒合が不完全となった場合は、縫合箇所の一部又は全体が再び解離してしまう縫合不全が生じ得る。縫合不全は、酸素飽和度が低い又は鬱血している領域において生じることが知られている。このため、酸素飽和度画像を表示することにより、ユーザーが術後に縫合不全を起こしにくい切除箇所又は吻合箇所を判断することを、サポートすることができる。また、後述する指標値表示表と、酸素飽和度画像とを並べて表示することにより、色調による酸素飽和度の表現に加えて、酸素飽和度の実数値をユーザーに示し、ユーザーがより正確に、かつ、簡便に、切開又は吻合に適した領域を判別できるようサポートすることができる。
補正酸素飽和度算出部140は、演算値を用い、補正酸素飽和度算出用テーブル120を参照することにより(図29(A)参照)、補正処理を行う。なお、演算値のうち、信号比B3/G3の算出及び対数化を、補正酸素飽和度算出部140が行うようにしてもよい。
テーブル補正部141は、補正モード時に行う補正処理として、酸素飽和度算出用テーブルを、補正酸素飽和度算出用テーブル120を参照することにより選択された酸素飽和度算出用テーブルとするテーブル補正処理を行う。テーブル補正処理としては、例えば、第1色素値が「2」の場合において、図33(A)に示す、第1色素値に応じて定められる領域AR0~AR4(補正酸素飽和度算出用テーブル120の曲面CV0~CV4)のうち、図33(B)に示すような等高線ELが描かれる、第1色素値が「2」に対応する領域AR2である酸素飽和度算出用テーブルを選択する。テーブル補正部141は、酸素飽和度算出部133において参照される酸素飽和度算出用テーブル110を、領域AR2である酸素飽和度算出用テーブルとするように、酸素飽和度算出用テーブル110を補正する。
なお、補正処理は、内視鏡画像の画素ごとに行ってもよく、後述する特定領域の画素ごとに行ってもよい。また、後述する特定領域において、画素ごとに算出される信号値の平均値である平均信号値に基づき、X成分の値(信号比ln(R2/G2))、Y成分の値(信号比ln(B1/G2))及びZ成分の値(信号比ln(B3/G3))を算出することにより、補正処理を行ってもよい。
また、補正モードにおいては、補正酸素飽和度算出用テーブル120を用いる補正処理に代えて、信号比ln(R2/G2)をX軸、信号比ln(B1/G2)をY軸、信号比ln(B3/G3)をZ軸とする3次元座標系において、X成分の値(信号比ln(R2/G2))、Y成分の値(信号比ln(B1/G2))及びZ成分の値(信号比ln(B3/G3))と、酸素飽和度のとの相関関係を予め記憶した補正酸素飽和度算出用テーブルを用いることにより、特定色素の影響が考慮された補正酸素飽和度を求めるようにしてもよい。なお、このような補正酸素飽和度算出用テーブルには、3次元座標系で、同じ酸素飽和度であることを示す等高線又は空間が3次元的に分布している。
具体的には、例えば、図34に示すような3次元座標系121において、B1画像信号、G2画像信号、R2画像信号、B3画像信号、及びG3画像信号に基づいて算出される特定の画素の信号比が、信号比ln(R2*/G2*)、ln(B1*/G2*)、ln(B3*/G3*)である場合には、信号比ln(R2*/G2*)、ln(B1*/G2*)、ln(B3*/G3*)と対応する点123における補正酸素飽和度を、酸素飽和度として算出する。
また、補正モードにおける補正処理を行うために、補正モードにおいて得られる画像信号のうち、一部の画像信号を用いるようにしてもよい。一部の画像信号とは、後述する補正用画像のうち、特定領域における画像信号のことである。この場合、特定領域は、酸素飽和度の算出精度に影響を与える外乱の影響が少ない領域とすることが好ましい。特定領域における外乱の影響の程度を判定するためには、特定領域における画像信号の信頼度を算出する。
さらに、信頼度の算出を行う前処理として、特定領域に含まれる画素が、有効画素であるかどうかの判定を行う。有効画素であるかどうかの判定は、拡張プロセッサ装置16の拡張中央制御部150が、各画素の各チャンネル(Bチャンネル、Gチャンネル、Rチャンネル)について、それぞれ下限値と上限値のチャンネル閾値を設けることで行い、すべてのチャンネルの画素値が各色のチャンネル下限値以上、かつ、チャンネル上限値未満の範囲内である場合に、その画素を有効画素と判定し、信頼度の算出対象の画素とする。
外乱とは、内視鏡12が撮影する内視鏡画像に写る観察対象のうち、特定色素以外の、酸素飽和度の算出精度を低下させる原因になり得る、ハレーション、暗部、出血、脂肪、粘膜表面の付着物等である。ハレーション及び暗部は、内視鏡画像の明るさに関係する。ハレーションとは、撮像センサ44に強い光が入射することにより、画像が白飛びしている領域のことである。暗部は、ヒダ、結腸曲等の生体内の構造物、処置具等の影があるため、又は管腔奥であるために照明光が届きにくく、画像が暗くなっている領域のことである。
出血は、漿膜外(腹腔内)又は消化管内腔への外出血、及び粘膜内での内出血を含む。脂肪は、大網、小網、腸間膜等の漿膜外(腹腔内)において観察される脂肪、及び消化管内腔の粘膜表面において観察される脂肪を含む。粘膜表面の付着物には、粘液、血液、滲出液等の生体由来の付着物、染色液、送水装置から送水された水等の生体外由来の付着物、生体由来及びの生体外由来の付着物が混合した残液又は残渣である付着物が含まれる。
補正モードにおいて、特定領域における画像信号を用いて補正処理を行う場合、補正モードに切り替わったタイミングにおいて、まず、図35に示すような、補正用画像161をディスプレイに表示する。補正用画像161の表示は、拡張表示制御部200によって制御される。補正用画像161には、特定領域162が、ユーザーが視認できる態様で表示されている。
なお、特定領域162の形状は、図35に示すような、円型に限られない。また、特定領域162の位置は、図35に示すような、画像の中心部に限られない。例えば、レンズの曲率のため歪みの影響が大きくなる補正用画像161の周縁部と、管腔奥に相当するため暗部となる補正用画像161の中心部とを除いたドーナツ状の領域を特定領域としてもよい。なお、補正用画像は、B2画像信号、G2画像信号及びR2画像信号を用いて生成されるカラーの画像(例えば、白色光相当画像)であることが好ましい。補正用画像は、その他の画像信号を用いて生成される画像であってもよい。
図35に示すような、補正用画像161がディスプレイに表示されている場合において、信頼度算出指示が入力されると、拡張プロセッサ装置16の信頼度算出部160が、特定領域162における画像信号に基づき、特定領域162に含まれる画素ごとに信頼度を算出する。なお、信頼度算出指示の入力は、ユーザーインターフェースを介した入力指示に従って行われてもよく、補正用画像161の表示を行う制御と同じタイミングで、自動的に行われるものであってもよい。
以下、信頼度の算出について説明する。信頼度には、(1)内視鏡画像の明るさについての信頼度、(2)内視鏡画像に含まれる出血の程度による信頼度、(3)内視鏡画像に含まれる脂肪の程度による信頼度等がある。
明るさについての信頼度の算出について説明する。この場合、信頼度算出部160は、G1画像信号を用い、図36に示すような、第1信頼度算出用テーブル163を参照することによって信頼度を算出する。第1信頼度算出用テーブル163は、G1画像信号の信号値と、信頼度との関係を示す、予め生成されたテーブルである。G1画像信号の信号値とは、例えば、G1画像信号を用いて変換処理を行うことによって得られる輝度値である。この場合、信頼度は0から1までの値として算出される。第1信頼度算出用テーブル163では、図36に示すように、G1画像信号の信号値が一定範囲Rx外の信頼度は、G1画像信号の輝度値が一定範囲Rx内の信頼度よりも低くなっている。G1画像信号の信号値が一定範囲Rx外である場合とは、具体的には、画素にハレーションが含まれることにより、高輝度値である場合、特定領域に暗部が含まれることにより、極小輝度値である場合等である。なお、明るさについての信頼度の算出には、G1画像信号の代わりにG2画像信号を用いてもよい(後述する図102参照)。
出血の程度による信頼度の算出について説明する。この場合、信頼度算出部160は、信号比ln(R2/G2)及び信号比ln(B2/G2)を用い、図37に示すような、第2信頼度算出用テーブル164を参照することによって信頼度を算出する。第2信頼度算出用テーブル164には、X軸をln(R2/G2)、Y軸を信号比ln(B2/G2)とする2次元座標系に、定義線DFXがプロットされている。この場合、X成分の値を信号値ln(R2/G2)、Y成分の値を信号比ln(B2/G2)として算出した座標(X2,Y2)=(ln(R2/G2),ln(B2/G2))が、第2信頼度算出用テーブル164において右下に位置するほど、信頼度が低くなるように算出される。また、座標(X2,Y2)が、定義線DFXより左上の領域に位置する場合は、出血の程度による信頼度を、高信頼度である固定値とする。なお、信号比ln(R2/G2)は、R2画像信号をG2画像信号で規格化し、対数化した値である。また、信号比ln(B2/G2)は、B2画像信号をG2画像信号で規格化し、対数化した値である。
脂肪の程度による信頼度の算出について説明する。この場合、信頼度算出部160は、信号値ln(R1/G1)及び信号比ln(B1/G1)を用い、図38に示すような、第3信頼度算出用テーブル165を参照することによって信頼度を算出する。第3信頼度算出用テーブル165には、X軸をln(R1/G1)、Y軸を信号比ln(B1/G1)とする2次元座標系に、定義線DFYがプロットされている。この場合、X成分の値を信号値ln(R1/G1)、Y成分の値を信号比ln(B1/G1)として算出した座標(X3,Y3)=(ln(R1/G1),ln(B1/G1))が第3信頼度算出用テーブル165において左下に位置するほど、信頼度が低くなるように算出される。また、座標(X3,Y3)が、定義線DFYより右上の領域に位置する場合は、脂肪の程度による信頼度を、高信頼度である固定値とする。なお、信号比ln(R1/G1)は、R1画像信号をG1画像信号で規格化し、対数化した値である。また、信号比ln(B1/G1)は、B1画像信号をG1画像信号で規格化し、対数化した値である。また、G1画像信号の代わりにG2画像信号を、また、R1画像信号の代わりにR2画像信号を用いることにより、X成分の値を信号値ln(R2/G2)、Y成分の値を信号比ln(B1/G2)として算出した座標(X3,Y3)=(ln(R2/G2),ln(B1/G2))の、信頼度算出用テーブルにおける位置によって脂肪の程度による信頼度を算出してもよい(後述する図103参照)。
信頼度算出部160は、明るさについての信頼度(第1信頼度)、出血の程度による信頼度(第2信頼度)、脂肪の程度による信頼度(第3信頼度)のうち、少なくとも1つ以上の信頼度を算出する。算出された信頼度は、特定領域に信頼度が低い領域が入らないようにするための報知、又は補正処理に用いる画像信号の信号値に対する重み付け処理に用いる。
特定領域に信頼度が低い領域が入らないようにするための報知を行う場合、算出された信頼度は、補正判定部170に送信される。補正判定部170は、予め設定された信頼度判定用閾値を用いることにより、特定領域において画素ごとに算出された信頼度に対する判定を行い、各画素が、高信頼度画素であるか、低信頼度画素であるかの判定結果を出力する。
補正判定部170は、例えば、信頼度が信頼度判定用閾値以上である画素を高信頼度画素とし、信頼度が信頼度判定用閾値未満である画素を低信頼度画素とする。補正判定部170は、各画素の信頼度に対する判定を行った判定結果を、拡張表示制御部200に送信する。拡張表示制御部200は、判定結果に応じて、ディスプレイに表示されている補正用画像161の表示態様を変更する制御を行う。
拡張表示制御部200は、例えば、図39に示すように、特定領域162のうち、低信頼度領域171aの彩度を高信頼度領域171bの彩度よりも高くする。低信頼度領域とは、低信頼度画素を有する画素の集合である。また、高信頼度領域とは、高信頼度画素有する画素の集合である。図39に示すような、低信頼度領域171aと高信頼度領域171bとの表示態様を異ならせた補正用画像161を表示することで、ユーザーに対し、特定領域に外乱を比較的多く含む低信頼度領域が含まれることを報知することができる。なお、低信頼度領域171aと高信頼度領域171bとの表示態様を異ならせる方法は、領域ごとの彩度の変更に限られない。例えば、輝度、色調等を異ならせるようにしてもよい。
なお、第1信頼度、第2信頼度及び第3信頼度のうち、複数の信頼度を算出する場合、信頼度に対する判定に用いる信頼度は、第1信頼度、第2信頼度又は第3信頼度のうち、最小の信頼度を用いるようにしてもよい。また、信頼度ごとに信頼度判定用閾値を設定してもよい。例えば、第1信頼度に対する第1信頼度判定用閾値、第2信頼度に対する第2信頼度判定用閾値及び第3信頼度に対する第3信頼度判定用閾値を予め設定し、いずれかの信頼度が信頼度判定用閾値未満の場合に、その信頼度が算出された画素を低信頼度画素と判定するようにしてもよい。
また、補正判定部170は、画素ごとに算出された信頼度に対し、さらに高信頼度画素の数に対する判定を行うようにしてもよい。この場合、拡張表示制御部200は、特定領域における高信頼度画素が、高信頼度画素数判定用閾値以上である場合と、高信頼度画素数判定用閾値未満である場合とで、特定領域の表示態様を変更する。例えば、特定領域における高信頼度画素が、高信頼度画素数判定用閾値以上である場合は、図40に示すように、特定領域を第1判定結果色の枠172で囲むことによって強調表示した補正用画像161を表示する。特定領域を第1判定結果色の枠で囲う強調表示を行うことで、外乱の影響が少ない状態で補正処理を行えることをユーザーに報知することができる。
また、特定領域における高信頼度画素が、高信頼度画素数判定用閾値未満である場合は、特定領域を第1判定結果色とは異なる、第2判定結果色の枠で囲むことによって強調表示した補正用画像161を表示するようにしてもよい。特定領域を第2判定結果色の枠で囲う強調表示を行うことで、外乱の影響が少ない画素が一定値よりも少ないことをユーザーに報知することができる。
なお、補正判定部170が、低信頼度画素の数に対する判定を行うことにより、拡張表示制御部200が、特定領域における低信頼度画素が低信頼度画素数判定用閾値以上である場合と、低信頼度画素数判定用閾値未満である場合とで、特定領域の表示態様を変更するようにしてもよい。このように、信頼度画素数判定用閾値(高信頼度画素数判定用閾値又は低信頼度画素数判定用閾値)を用い、信頼度の高い又は低い画素の数により、補正用画像の表示態様を変更することで、特定領域において外乱が含まれている程度を報知し、補正処理を適切に行うための内視鏡の操作をユーザーに促すことができる。
また、補正判定部170が、信頼度判定用閾値及び/又は信頼度画素数判定用閾値を用いて特定領域における画素ごとの信頼度を判定し、特定領域における外乱の影響が少ないと判定した場合は、補正処理が適切に行えることを示すメッセージを、補正用画像161に表示するようにしてもよい。例えば、図41に示すように、「補正処理は適正に行われます」のようなメッセージMS1を補正用画像161に重畳表示する。
さらに、補正判定部170が、信頼度判定用閾値及び/又は信頼度画素数判定用閾値を用いて特定領域における画素ごとの信頼度を判定し、特定領域に低信頼度領域が含まれる場合、又は低信頼度画素が信頼度画素数判定用閾値以上含まれる場合に、警告表示を行うようにしてもよい。例えば、図42に示すように、「補正処理のため内視鏡を操作してください」のようなメッセージMS2を補正用画像161に重畳表示する。また、明るさについての信頼度が特に影響が大きいと判定された場合に、図42に示すように、「暗部を避けて下さい」のようなメッセージMS3を補正用画像161に重畳表示してもよい。
上記のように、補正用画像161における表示態様を変更することで、ユーザーに対し、特定領域に外乱を比較的多く含む低信頼度領域が含まれることを報知し、又は補正処理が適切に行えること報知することができる。なお、ディスプレイに表示する画像の他に、音声による報知を行うようにしてもよい。
このような報知を行うことにより、ユーザーが、補正用画像161を観察しながら、外乱の影響が少ない領域が特定領域162内に入るように、内視鏡12を操作することを促すことができる。すなわち、ユーザーに対して、特定領域の内部に、低信頼度領域がなるべく入らないように、かつ、高信頼度領域がなるべく入るように内視鏡12を操作するよう促すことができる。
また、補正処理が適切に行えること報知し、補正処理の実施を指示する操作をユーザー操作により入力された場合、補正モードにおける補正処理が行われる。なお、信頼度判定用閾値及び/又は信頼度画素数判定用閾値を用いて特定領域における画素ごとの信頼度を判定し、特定領域162の外乱の影響が少ないと判定された場合、ユーザーによる入力操作なしに、自動的に補正処理を実行するようにしてもよい。
また、補正用画像161をディスプレイに表示することなく、拡張プロセッサ装置16の内部処理として特定領域における信頼度を算出し、画素ごとの信頼度に対する判定を行った上で、特定領域における画像信号を用いて補正処理を行うようにしてもよい。
補正モードにおいて補正処理が完了した場合、ユーザーに対し、酸素飽和度モードに切り替えることを促す表示制御を行う。また、このような表示を行うことなく、自動的に酸素飽和度モードに切り替えるようにしてもよい。
なお、補正処理を行う場合に、特定領域において画素ごとに算出された信頼度を用いて、B2画像信号、G2画像信号、R2画像信号、B3画像信号及び/又はG3画像信号の信号値に対する重み付け処理を行うことで、補正処理に信頼度を反映させるようにしてもよい。また、補正処理において、特定領域におけるB2画像信号、G2画像信号、R2画像信号、B3画像信号及び/又はG3画像信号の信号値の、それぞれの平均値(平均信号値)を用いてX成分の値(信号比ln(R2/G2))、Y成分の値(信号比ln(B1/G2))及びZ成分の値(信号比ln(B3/G3))を算出する場合、平均信号値に重み付け処理を行った荷重平均値を用い、X成分の値、Y成分の値及びZ成分の値を算出するようにしてもよい。
以下、関心領域内の生体指標値を表示用画像として表示する制御について説明する。拡張プロセッサ装置16は、関心領域設定部210、領域位置情報記憶部240、領域指標値算出部250、指標値表示表生成部260、表示用画像生成部270及び拡張表示制御部200を有する。また、後述する領域指標値記憶部280及び/又は指標値リンクライン生成部290を備えるようにしてもよい。
関心領域設定部210は、第1ユーザーインターフェース又は第2ユーザーインターフェースに表示される内視鏡画像において、関心領域を設定する。関心領域とは、内視鏡画像のうち、領域指標値を算出する対象となる領域である。領域指標値とは、関心領域における画像信号に基づいて算出される生体指標値の統計値である。生体指標値とは、被写体である観察対象の状態を示す値であり、具体的には、酸素飽和度、ヘモグロビン指数、組み合わせ指数である。生体指標値及び領域指標値については後述する。
以下、関心領域の設定方法について、関心領域を設定する対象となる内視鏡画像の具体例を挙げながら説明する。具体例(1)は、関心領域を設定する内視鏡画像が、酸素飽和度画像である場合である。具体例(2)は、関心領域を設定する内視鏡画像が、白色光相当画像である場合である。具体例(3)は、関心領域を設定する内視鏡画像が、白色光画像である場合である。
具体例(1)について、図を用いながら説明する。例えば、酸素飽和度モードにおいて、ディスプレイには、図43(A)に示すような酸素飽和度画像202が表示されている。この場合において、ユーザーが関心領域設定用スイッチ12dを操作すると、関心領域設定指示がプロセッサ装置13の中央制御部50を介して拡張プロセッサ装置16に入力される。関心領域設定指示を受けた関心領域設定部210は、例えば、図43(B)に示すように、内視鏡画像(酸素飽和度画像202)上において、関心領域212a、212b、212cを設定する。関心領域は、内視鏡画像上の互いに異なる位置に、複数個、設定される。なお、図43に示す酸素飽和度画像202の例には、被写体Obとして、腹腔鏡である内視鏡12を用いて漿膜側から観察される大腸を示している。これ以降の図においては、図が煩雑になることを避けるため、被写体Obの符号の表示は省略する。また、図中において、関心領域又は後述する領域位置情報は、簡単のため、一直線上に並ぶように描画しているが、設定される関心領域は、一直線上に並ばないことが好ましい。
図43(B)に示すような、関心領域212a、212b、212cが設定された内視鏡画像(以下、関心領域画像211と呼ぶ。)は、関心領域設定指示が拡張プロセッサ装置16に入力された場合に、拡張表示制御部200の表示制御によって、図44に示すように、第2ユーザーインターフェースであるディスプレイに表示される。図44では、酸素飽和度画像に関心領域を設定した関心領域画像211が、第2ユーザーインターフェース17であるディスプレイに、白色光相当画像201が、第1ユーザーインターフェース15であるディスプレイに表示されている。
関心領域設定部210は、内視鏡画像上の予め設定された位置に関心領域を表示する。内視鏡画像上における、関心領域の数と位置は、予め設定されていることが好ましい。例えば、図43(B)及び図44に示す関心領域画像の例では、「3つ」の関心領域を設定することが予め設定されている。また、3つの関心領域212a、212b、212cの「設定位置」が、予め設定されている。なお、関心領域の数は、2以上の自然数である値として、任意に設定できる。また、関心領域の位置は、任意に設定できる。関心領域が互いに異なる位置に複数設定される理由は、空間的に離れた位置にある関心領域における領域指標値を算出するためである。すなわち、空間的に離れた位置とは、生体組織の異なる位置を意味し、生体組織上の互いに異なる位置において関心領域を設定することにより、指標値の空間的変化、すなわち、生体組織の異なる位置に設定した関心領域における指標値及びこれらの指標値の変化を把握することができる。
内視鏡画像上に関心領域が設定されると、関心領域の位置が、複数の領域位置情報として、それぞれ領域位置情報記憶部240に記憶される。すなわち、関心領域画像における複数の関心領域の位置が、領域位置情報となる。関心領域の位置とは、内視鏡画像における関心領域の座標情報のことである。なお、領域位置情報記憶部240は、拡張プロセッサ装置16にあってもよく、拡張プロセッサ装置16の外部にあるストレージであってもよい。
なお、関心領域設定用スイッチ12dの操作は、内視鏡12又はユーザーインターフェースであるフットスイッチ等に備えられる関心領域設定用スイッチ12dの押下操作であってもよく、ディスプレイに表示されるGUI(Graphical User Interface)としての関心領域設定用スイッチのクリック、タップ等の選択操作であってもよい。
図43(B)及び図44に示すような、関心領域212a、212b、212cが表示される関心領域画像211がディスプレイに表示されている場合において、ユーザーが関心領域設定用スイッチ12dを再度操作すると、関心領域212a、212b、212c内の画像信号に基づき、生体指標値が算出される。算出された関心領域における生体指標値は、領域指標値算出部250に送信される。
なお、図43(B)及び図44に示すような関心領域画像211においては、関心領域におけるB1画像信号、B2画像信号、G2画像信号及びR2画像信号等に基づいて、酸素飽和度をほぼリアルタイムに算出してもよく、生体指標値として、ヘモグロビン指数又は組み合わせ指数を算出するようにしてもよい。
例えば、血液濃度依存性を有するB1画像信号、B2画像信号、G2画像信号及びR2画像信号等に基づいて、被写体の血液濃度を示すヘモグロビン指数を算出してもよい。また、酸素飽和度とヘモグロビン指数を組み合わせた生体指標値である、組み合わせ指数を算出してもよい。
組み合わせ指数は、図45に示すような、組み合わせ指数算出用テーブル350を用いて算出する。組み合わせ指数算出用テーブル350では、酸素飽和度とヘモグロビン指数とにそれぞれ閾値が設けられているため、酸素飽和度及びヘモグロビン指数の高低に応じて、「1」「2」「3」又は「4」の値である組み合わせ指数を決定することができる。
図45に示す組み合わせ指数算出用テーブル350では、酸素飽和度(縦軸)が酸素飽和度用閾値Th1以上、かつ、ヘモグロビン指数(横軸)がヘモグロビン指数用閾値Th2以上である場合、組み合わせ指数は「1」となる。また、組み合わせ指数が「2」となる場合は、酸素飽和度が酸素飽和度用閾値Th1未満、かつ、ヘモグロビン指数用閾値がヘモグロビン指数用閾値Th2以上である場合である。組み合わせ指数が「3」となる場合は、酸素飽和度が酸素飽和度用閾値Th1未満、かつ、ヘモグロビン指数用閾値がヘモグロビン指数用閾値Th2未満である場合である。組み合わせ指数が「4」となる場合は、酸素飽和度が酸素飽和度用閾値Th1以上、かつ、ヘモグロビン指数用閾値がヘモグロビン指数用閾値Th2未満である場合である。
組み合わせ指数が「1」「2」又は「3」である画素又は領域は、酸素飽和度が低い又は鬱血している、縫合不全を起こすリスクを有する。一方、組み合わせ指数が「4」である画素又は領域は、酸素飽和度が高く、かつ、ヘモグロビン指数が低い鬱血していない、縫合不全を起こすリスクが低い領域である。
いずれの生体指標値を算出するかは、ユーザー設定により変更できることが好ましい。例えば、図46に示すような、生体指標値選択用画面351をディスプレイに表示し、GUIであるラジオボタン352を操作することにより、算出する生体指標値を選択してもよい。図46に示す例では、算出する生体指標値として、酸素飽和度及びヘモグロビン指数が選択されている。
なお、酸素飽和度を生体指標値として算出する場合、酸素飽和度は、酸素飽和度算出部133において算出される。また、ヘモグロビン指数又は組み合わせ指数を算出する場合、拡張プロセッサ装置16に生体指標値算出部(図示しない)を設け、生体指標値算出部においてこれらの生体指標値を算出するようにしてもよい。
領域指標値算出部250は、関心領域における生体指標値に基づき、関心領域内の生体指標値の統計値として、領域指標値を算出する。統計値は、平均値、中央値、最頻値、最大値、最小値等である。領域指標値は、関心領域ごとに算出される。図43(B)に示す例においては、関心領域212a、関心領域212b及び関心領域212cのそれぞれについて、領域指標値が算出される。算出された領域指標値は、指標値表示表生成部260に送信される。また、後述する領域指標値記憶部280に送信してもよい。
指標値表示表生成部260は、表示用画像に表示するための、複数の領域指標値をまとめた指標値表示表を生成する。例えば、指標値表示表生成部260は、図47に示すような、複数の領域指標値をグラフ形式で表した指標値表示表261を生成する。図47に示す指標値表示表261の例では、縦軸を領域指標値、横軸を関心領域の別とした指標値表示表261の例を示している。図47に示す指標値表示表261では、関心領域212aを「ROI1」、関心領域212bを「ROI2」、関心領域212cを「ROI3」と示し、それぞれの領域指標値251a、251b、251cを示す折れ線スパークライン262が表示されている(図43(B)参照)。なお、「ROI」とは、Region Of Interestの略称であり、「関心領域」を意味する。
また、領域指標値をグラフ形式で表した指標値表示表を生成する場合、縦棒グラフによってスパークラインを表示するようにしてもよい。図47に示す指標値表示表261の例では、関心領域212a(ROI1)の領域指標値251aが「60」、関心領域212b(ROI2)の領域指標値251bが「90」、関心領域212c(ROI3)の領域指標値251cが「90」と算出されている。算出した領域指標値251a、251b、251cを、スパークライン262とともに表示してもよい。なお、図47に示す具体例では、生体指標値を酸素飽和度として算出されている例を想定している。
なお、指標値表示表生成部260は、図48に示すような、複数の領域指標値を表形式で表した指標値表示表263を生成してもよい。図48では、関心領域212aの領域指標値が「60」、関心領域212bの領域指標値が「90」、関心領域212cの領域指標値が「90」と算出された場合の、領域指標値を表形式で表した指標値表示表263を示している。
指標値表示表生成部260において、グラフ形式又は表形式のいずれの指標値表示表を生成するか、また、グラフ形式の場合に、折れ線スパークライン又は縦棒スパークラインのいずれのスパークラインを生成するかは、予め設定されていてもよく、ユーザーによって設定できるようにしてもよい。ユーザーによってこれらの設定を行う場合、指標値表示表用設定画面(図示しない)をディスプレイに表示し、GUIを操作することで設定が行われるようにしてもよい。指標値表示表生成部260において生成された指標値表示表は、表示用画像生成部270に送信される。
表示用画像生成部270は、指標値表示表、内視鏡画像及び領域位置情報を表示するための表示用画像を生成する。例えば、図47に示すような指標値表示表を表示する表示用画像を生成する場合、表示用画像生成部270は、図49に示すような表示用画像271を生成する。図49に示す表示用画像271の例では、内視鏡画像(酸素飽和度画像201に関心領域を設定した関心領域画像211、図43(B)参照)及び指標値表示表261が表示されている。また、表示用画像271には、領域指標値の算出対象となった関心領域の位置の情報である領域位置情報272a、272b、272cが、内視鏡画像上に重畳表示されている。
表示用画像生成部270は、領域位置情報記憶部240に記憶された、内視鏡画像における関心領域の位置である領域位置情報を読み出すことにより、表示用画像に表示する内視鏡画像に、領域指標値の算出対象となった関心領域の位置を、領域位置情報として重畳表示する。図49に示す表示用画像271の例では、領域位置情報272aは、関心領域212aに相当し、領域位置情報272bは、関心領域212bに相当し、領域位置情報272cは、関心領域212cに相当する(図43(B)及び図44参照)。
生成された表示用画像は、拡張表示制御部200に送信される。拡張表示制御部200は、ディスプレイに表示用画像を表示するための信号処理を行うことにより、表示用画像を第2ユーザーインターフェースであるディスプレイに表示する。酸素飽和度画像211に関心領域を設定した場合、例えば、図50に示すように、第1ユーザーインターフェース15であるディスプレイには白色光相当画像201を表示し、第2ユーザーインターフェース17であるディスプレイには表示用画像271を表示する。
上記のように、酸素飽和度画像において複数箇所の関心領域に関する領域指標値を表示する指標値表示表を表示することにより、ユーザーに対し、ユーザーが観察中の酸素飽和度画像における生体指標値の空間的変化を報知することができる。また、具体例(1)のように、酸素飽和度モードにおいて、白色光相当画像と表示用画像を並べて表示することにより、白色光に近い画像と、酸素飽和度画像上の複数箇所の領域指標値とを、ユーザーが簡単に見比べられるように表示することができる。結果として、生体指標値に基づく適切な切開箇所の候補となる部分、また、生体指標値に基づく切開には不適切な部分のユーザーによる判断をサポートすることができる。
以下、具体例(2)について説明する。具体例(2)は、酸素飽和度画像に関心領域を設定する具体例(1)とは異なり、酸素飽和度モードにおいて、白色光相当画像上に複数個の関心領域を設定する。また、最終的に表示用画像を表示する際に、表示用画像生成部270が生成した表示用画像を、プロセッサ装置15の表示制御部80に送信し、表示用画像を第1ユーザーインターフェースであるディスプレイに表示する。
具体例(2)では、図51に示すように、第1ユーザーインターフェース15であるディスプレイには表示用画像273が表示され、第2ユーザーインターフェース17であるディスプレイには酸素飽和度画像202が表示される。図51に示す表示用画像273の例では、白色光相当画像213に、設定された関心領域の位置を示す領域位置情報274a、274b、274cが重畳表示されている。また、白色光相当画像213に設定された関心領域における領域指標値をまとめて表示する指標値表示表264が、表示されている。
具体例(2)における、具体的な流れについて説明する。まず、酸素飽和度モードにおいて、ユーザーが関心領域設定用スイッチ12dを操作することにより、関心領域設定指示が拡張プロセッサ装置16に入力された場合、白色光相当画像上に、複数個の関心領域を設定する。
具体例(2)において、関心領域が白色光相当画像上に設定された後、表示用画像を生成するまでの流れは、具体例(1)と同様であるため、詳しい説明は省略する。以下、簡単に説明する。白色光相当画像上に設定された複数の関心領域の位置は、領域位置情報としてそれぞれ領域位置情報記憶部240に記憶される。白色光相当画像上に関心領域が表示された関心領域画像がディスプレイに表示されている場合において、再度、関心領域設定用スイッチ12dが操作されると、関心領域における画像信号に基づき、生体指標値が算出される。次いで、領域指標値算出部250は、関心領域における生体指標値に基づき、領域指標値を算出する。次いで、指標値表示表生成部260は、算出された関心領域ごとの領域指標値を用いて、複数の領域指標値をまとめた指標値表示表263を生成する。最終的に、領域位置情報274a、274b、274cを重畳表示した白色光相当画像213、及び指標値表示表263を表示するための表示用画像が、表示用画像生成部270によって生成される。
上記の具体例(2)のように、酸素飽和度モードにおいて、表示用画像と酸素飽和度画像とを並べて表示することにより、白色光相当画像上の複数箇所の領域指標値と、酸素飽和度画像とを、ユーザーが簡単に見比べられるように表示することができる。
以下、具体例(3)について説明する。具体例(3)は、具体例(1)及び具体例(2)とは異なり、通常モードにおいて、白色光画像に複数の関心領域を設定する。また、関心領域設定用スイッチ12dではなく、モード切替え用スイッチ12cによるモード切替えの操作により、関心領域設定指示が入力される。
具体例(3)における、具体的な流れについて説明する。まず、通常モードにおいて、ユーザーが、モード切替え用スイッチ12cを操作することにより、白色光画像に複数の関心領域が設定される。この場合、モード切替え用スイッチ12cの操作をトリガーとして、関心領域設定指示が拡張プロセッサ装置16に入力され、関心領域設定部210がプロセッサ装置の表示制御部200に、内視鏡画像を白色光画像とする関心領域画像を、第1ユーザーインターフェースであるディスプレイに表示させる指示信号を送信する。
この場合、図52に示すように、内視鏡画像を白色光画像とする関心領域画像214を、第1ユーザーインターフェース15であるディスプレイに表示し、第2ユーザーインターフェース17であるディスプレイには、何も表示しない(何も表示しないことを斜線で示す)。なお、図52に示す例では、第2ユーザーインターフェース17であるディスプレイには、何も表示しないが、白色光相当画像201又は酸素飽和度画像202を表示するようにしてもよい。また、この場合、モード切替えとほぼ同時に、白色光画像上に関心領域を設定する。
具体例(3)において、関心領域が白色光画像上に設定された後、表示用画像を生成するまでの流れは、具体例(1)と同様であるため、詳しい説明は省略する。以下、簡単に説明する。白色光画像上に設定された複数の関心領域の位置は、領域位置情報としてそれぞれ領域位置情報記憶部240に記憶される。白色光画像上に関心領域が表示された関心領域画像211がディスプレイに表示されている場合において、関心領域設定用スイッチ12dが操作されると、関心領域における画像信号に基づき、生体指標値が算出される。次いで、領域指標値算出部250は、関心領域における生体指標値に基づき、領域指標値を算出する。次いで、指標値表示表生成部260は、算出された関心領域ごとの領域指標値を用いて、複数の領域指標値をまとめた指標値表示表を生成する。最終的に、領域位置情報を重畳表示した白色光画像、及び指標値表示表を表示するための表示用画像が、表示用画像生成部270によって生成される。
具体例(3)では、図53に示すように、第1ユーザーインターフェース15であるディスプレイには表示用画像275が表示され、第2ユーザーインターフェース17であるディスプレイには何も表示されていない。図53に示す表示用画像275の例では、内視鏡画像を白色光画像とする関心領域画像214に、設定された関心領域の位置を示す領域位置情報276a、276b、276cが重畳表示されている。また、関心領域画像214に設定された関心領域における領域指標値をまとめて表示する指標値表示表265が、表示されている。なお、図53に示す例では、第2ユーザーインターフェース17であるディスプレイには、何も表示しないが、白色光相当画像201又は酸素飽和度画像202を表示するようにしてもよい。
上記の具体例(1)、(2)及び(3)に示すように、関心領域が表示される画像、すなわち、関心領域画像の背景となる内視鏡画像は、酸素飽和度画像(具体例(1))でもよく、白色光相当画像でもよく(具体例(2))、白色光画像でもよい(具体例(3))。また、第1照明光、第2照明光及び第3照明光以外の特殊光を被写体に照射することにより得られる反射光を用いて撮影された特殊光画像であってもよい。
白色光画像又は特殊光画像に関心領域を設定し、指標値表示表が表示された表示用画像を生成する場合、領域位置情報を表示する内視鏡画像(すなわち、関心領域画像の背景となる白色光画像又は特殊光画像)は、リアルタイムに取得される画像信号に基づいて生成される画像であってもよく、モード切替えの直前に取得された画像信号に基づいて生成された静止画であってもよい。
関心領域画像の背景となる白色光画像又は特殊光画像を、リアルタイムに取得される画像信号に基づいて生成される画像とする場合、酸素飽和度モードにおいて、発光される照明光として、第1照明光及び第2照明光に加えて、白色光又は特殊光を追加する。これに伴い、酸素飽和度モードにおける発光パターン(図15参照)に、白色光又は特殊光を発光する照明期間を設けるように、発光パターンを変更する。
また、具体例(1)、(2)及び(3)では、関心領域画像がディスプレイに表示されている状態において、ユーザーが関心領域設定用スイッチ12dを操作することにより、生体指標値及び領域指標値を算出する例について記載したが、関心領域設定指示が入力された場合、関心領域画像をディスプレイに表示することなく、表示用画像を表示するようにしてもよい。例えば、酸素飽和度モードにおいて、図7に示すように、白色光相当画像201及び酸素飽和度画像202を表示している場合において、関心領域設定用スイッチ12dを操作することにより、(図44に示すような表示態様を経ることなく、)図50又は図51に示すような表示態様で、表示用画像を表示するようにしてもよい。
また、複数の関心領域について、複数種類の生体指標値を算出する場合、複数種類の生体指標値に関する領域指標値を算出し、指標値表示表を生成するようにしてもよい。例えば、生体指標値として酸素飽和度及びヘモグロビン指数を算出する場合、図54に示すように、生体指標値を酸素飽和度(StO2)とする折れ線スパークライン262(実線で示す)と、生体指標値をヘモグロビン指数(HbI:Hemoglobin Index)とする折れ線スパークライン266(破線で示す)とを表示する指標値表示表を生成してもよい。
上記のように、複数箇所の関心領域に関する領域指標値を表示する指標値表示表を表示することにより、ユーザーに対し、観察中の内視鏡画像における生体指標値の実数値の空間的変化を報知することができる。このような実数値をまとめて表示する指標値表示表は、生体指標値の変化を色調によってのみ表示する場合と比較して、より信頼性の高い情報を、見比べやすい態様でユーザーに示すことができるものである。
がん等に対する手術において、大腸等の臓器を部分的に切除する際、血流が悪い部分を生体組織に残したまま臓器を縫合してしまうと、縫合部分の治癒が不十分なものとなり、縫合不全が起きる可能性が高くなる。上記構成のように、生体指標値が高い部分と低い部分とを、簡単、かつ、正確に判別することができる指標値表示表を表示することは、縫合不全を防ぐことに役立つ。
第1実施形態における、内視鏡画像及び指標値表示表が表示された表示用画像の表示制御を行う一連の流れについて、図55に示すフローチャートを用いて説明する。まず、内視鏡12が、被写体からの反射光を撮影することにより、画像信号を生成する(ST101)。次に、プロセッサ装置14の画像信号取得部60が、内視鏡12で生成された画像信号を取得する(ST102)。次に、プロセッサ装置14の内視鏡画像生成部70及び/又は拡張プロセッサ装置16の酸素飽和度画像生成部130が、画像信号に基づき、内視鏡画像を生成する(ST103)。次に、関心領域設定部210が、内視鏡画像に複数の関心領域を設定する(ST104)。次に、内視鏡画像における複数の関心領域の位置を、複数の領域位置情報としてそれぞれ領域位置情報記憶部240に記憶する(ST105)。
次に、それぞれの関心領域における画像信号に基づき、生体指標値を算出する(ST106)。次に、領域指標値算出部250が、それぞれの関心領域における生体指標値に基づき、領域指標値を関心領域ごとに算出する(ST107)。次に、指標値表示表生成部260が、複数の領域指標値をまとめて表示する指標値表示表を生成する(ST108)。次に、表示用画像生成部270が、複数の領域位置情報が重畳表示された内視鏡画像と、指標値表示表とを表示する、表示用画像を生成する(ST109)。最終的に、拡張表示制御部200が、表示用画像を表示する制御を行う(ST110)。この結果、ユーザーインターフェースであるディスプレイに、表示用画像が表示される。
なお、ディスプレイに表示される関心領域画像において、複数の関心領域を、まとめて1つの表示用関心領域として表示するようにしてもよい。例えば、図43(B)に示すような、複数の関心領域212a、212b、212cが表示される関心領域画像211の代わりに、図56に示すような、表示用関心領域212dを表示してもよい。図56に示す表示用関心領域212dには、複数の関心領域212a、212b、212cが含まれているが、実際に表示はされないことを破線で示している。
図56に示すような関心領域画像211を表示する場合においても、複数の関心領域212a、212b、212cにおける領域指標値がそれぞれ算出される。表示用画像としては、例えば、図57に示すように、内視鏡画像211には、実際には表示されない、破線で示す領域位置情報272a、272b、272cを含むように、表示用領域位置情報272dが表示される。複数の関心領域をまとめて表示することで、表示用画像に含まれる見かけ上の情報量を減らし、表示用画像の視認性を向上させることができる。なお、図57に示す表示用画像271の例では、折れ線スパークライン262の符号と引き出し線を省略している。これ以降の図においても、折れ線スパークライン262の符号と引き出し線は、図を見やすくするために省略している。
拡張プロセッサ装置16において、図58に示すように、領域指標値記憶部280をさらに設けてもよい。領域指標値記憶部280には、領域位置情報と、領域位置情報が示す関心領域において算出された領域指標値とを対応付けることにより、領域位置情報と、領域指標値とが対応付けされた特定領域指標値を記憶し、表示用画像の指標値表示表には、特定領域指標値を保持して表示することが好ましい。
特定領域指標値を指標値表示表に保持して表示する場合、領域指標値は、生体指標値が算出された後、1回のみ算出する。領域指標値算出部250は、それぞれの関心領域における生体指標値に基づき、領域指標値を関心領域ごとに算出するが(図55のST106、ST107参照)、この際に算出された領域指標値を、領域位置情報と対応付けて特定領域指標値とし、領域指標値記憶部280に記憶する。なお、領域指標値記憶部280は、拡張プロセッサ装置16に備えられてもよく、拡張プロセッサ装置16の外部にあるストレージであってもよい。
指標値表示表生成部260は、それぞれの関心領域において算出された特定領域指標値をまとめて表示する指標値表示表を生成し、表示用画像生成部270は、特定領域指標値が表示される指標値表示表を表示する表示用画像を生成する。この場合、拡張表示制御部200によってユーザーインターフェースに表示される表示用画像の特定領域指標値は、固定の値として保持して表示される。
固定の値として複数の特定領域指標値を表示することにより、被検者のバイタルが安定し、生体指標値の変化が少ない場合に、ユーザーは、指標値表示表を注視して複数の領域指標値を見比べることができる。
また、表示用画像の指標値表示表に表示する領域指標値は、更新されるようにしてもよい。領域指標値算出部250は、それぞれの関心領域における生体指標値に基づき、領域指標値を関心領域ごとに算出する(図55のST106、ST107参照)。指標値表示表生成部260は、それぞれの関心領域において算出された特定領域指標値をまとめて表示する指標値表示表を生成する(図55のST108参照)。指標値表示表生成部260は、領域指標値が算出される度に、新しく算出された最新の領域指標値を反映させた指標値表示表を生成することにより、指標値表示表に表示される複数の領域指標値をそれぞれ更新する。
図59には、指標値表示表261に表示される領域指標値を更新する場合の、表示用画像271の具体例を示している。指標値表示表生成部260は、領域指標値が新しく算出されると、時系列的に前時点において生成された折れ線スパークライン267(図59では一点鎖線で示す)を、時系列的に後時点において生成された折れ線スパークライン268(図59では実線で示す)に更新する。
領域指標値の更新について詳しく説明する。具体例として、領域位置情報272aで示される関心領域において、領域指標値を時系列的に算出する場合について説明する。例えば、酸素飽和度モード用発光パターンで照明光を発光する場合、図60に示すように、第1照明光L1及び第2照明光L2が1回ずつ発光される照明期間を含むフレームセット(図60では「1Set」)ごとに、第1時点領域指標値252a、第2時点領域指標値252b、第3時点領域指標値252cが、それぞれ時系列的に算出される。指標値表示表生成部260は、領域位置情報272aで示される関心領域において、第1時点領域指標値252a、第2時点領域指標値252b、第3時点領域指標値252cと、新しい領域指標値が算出されるごとに、指標値表示表を更新するように生成する。
指標値表示表を更新して表示することにより、ユーザーに対し、ほぼリアルタイムに更新される領域指標値を示すことができる。ユーザーは、処置中、処置の直後等、血流の変化が大きいシーンにおいて、ほぼリアルタイムに複数箇所における生体指標値の実数値を確認することができる。
図60では、1フレームセットごとに領域指標値を算出するが、領域指標値を算出するフレームセットは、任意に設定することができる。例えば、あるフレームセットでは領域指標値を算出し、次のフレームセットでは領域指標値を算出せず、次のフレームセットでは領域指標値を算出する、というように、1フレームセットおきに領域指標値を算出するよう設定することができる。また、表示用画像に表示する領域指標値を保持するか、又は更新するかは、ユーザー操作によって設定できることが好ましい。
関心領域設定部210は、内視鏡画像上の、予め設定された互いに異なる複数の位置に関心領域を設定するが、一度設定された関心領域をロックオンエリアとして記憶し、内視鏡12の動きに追従してロックオンエリアを表示してもよい。さらに、領域指標値を更新する場合は、ロックオンエリアとして記憶された関心領域において、新しい領域指標値を算出するようにしてもよい。
ロックオンエリアを記憶する場合、一度設定された関心領域と、その関心領域の領域位置情報とを対応付けすることにより、ロックオンエリアの位置を示すロックオンエリア位置情報として記憶する。ロックオンエリア位置情報は、内視鏡画像上におけるロックオンエリアの座標情報である。一度設定された関心領域と、その関心領域の領域位置情報との対応付けは、例えば、関心領域設定部210に領域位置対応付け部(図示しない)を設け、領域位置対応付け部が行うようにしてもよい。
現在の観察位置から内視鏡12を動かす場合、内視鏡12の観察倍率を変更する場合等の、内視鏡12の画角に入る範囲が変更されるシーンにおいて、関心領域設定部210が最初に設定した関心領域を含む位置から、撮影される範囲が大きくずれてしまうことがある。例えば、図61(A)に示すような関心領域画像211において、領域指標値は、関心領域212a、212b、212cにおいて取得される画像信号に基づいて算出される。ここで、内視鏡12を動かし、さらに、観察倍率を高倍率とすることにより、ディスプレイに表示される内視鏡画像が、図61(A)に示すような関心領域画像211から、図61(B)に示すような関心領域画像215に変更されたとする。
この場合、図61(A)に示す関心領域212a、212b、212cの領域位置情報を、ロックオンエリア位置情報として記憶する。図61(B)に示すような関心領域画像215では、関心領域が、図61(B)に示す領域212a、212b、212c(一点鎖線で示す)から、ロックオンエリア220a、220b、220c(実線で示す)に追従して移動する。この場合、領域指標値算出部250は、ロックオンエリア220a、220b、220cにおける生体指標値に基づき、領域指標値を算出する。
なお、図61(A)に示す関心領域212aは、図61(B)に示すロックオンエリア220aに移動し、図61(A)に示す関心領域212bは、図61(B)に示すロックオンエリア220bに移動し、図61(A)に示す関心領域212cは、図61(B)に示すロックオンエリア220cに移動することを示している。複数の関心領域212a、212b、212cは、複数のロックオンエリア220a、220b、220cの位置であるロックオンエリア位置情報として、領域位置情報記憶部240にそれぞれ記憶される。
図61(A)に示す関心領域212a、212b、212cから、図61(B)に示すロックオンエリア220a、220b、220cへの移動量は、内視鏡12の移動量、回転量、観察倍率の変化率等に基づいて算出される。なお、ロックオンエリア位置情報を記憶しない場合は、図61(B)においても、領域212a、212b、212cにおける生体指標値に基づき、領域指標値が算出される。このため、内視鏡12を大きく移動させようとする場合は、一度設定された関心領域を、ロックオンエリアとして記憶することにより、内視鏡12の移動に追従して領域指標値を算出することができる。
なお、表示用画像においては、表示用画像に表示される内視鏡画像が、内視鏡12の操作に伴い、図61(A)に示す関心領域画像211から、図61(B)に示すようなロックオンエリア220a、220b、220cが表示される関心領域画像215に変更される。また、表示用画像に表示される内視鏡画像に、図62(A)に示すような、複数の関心領域212a、212b、212cを含む表示用関心領域212dを表示する場合は、内視鏡12の操作に伴い、図62(B)に示すような、複数のロックオンエリア220a、220b、220cを含む表示用ロックオンエリア220dを表示する。
検査中、手術中等のリアルタイムに内視鏡画像を観察する場合において、現在観察中の位置から内視鏡12を動かして、他の位置において観察対象を観察したい場合がある。例えば、ユーザーが、観察対象において切開に適した位置を探す場合である。また、内視鏡画像の観察倍率を変更する場合、ディスプレイに表示される内視鏡画像は、遠景画像から近景画像に、又は近景画像から遠景画像に切り替わる。なお、遠景画像は、広い範囲の観察に適した低倍率観察されている内視鏡画像である。また、近景画像は、細かい構造の観察に適した高倍率観察されている内視鏡画像である。このように、内視鏡12を動かす場合、内視鏡12の観察倍率を変更する場合は、最初に設定した関心領域の位置と、実際に領域指標値を算出したい位置がずれてしまうことがある。このため、最初に設定した関心領域をロックオンエリアとすることにより、内視鏡12が動いた場合でも、最初に設定した関心領域における領域指標値を算出することができる。
なお、一度設定された関心領域をロックオンエリアとして記憶する場合、ロックオンエリア記憶指示が、ロックオンエリア設定用スイッチ(図示しない)を操作することにより入力され、ロックオンエリア位置情報を記憶することが好ましい。
ロックオンエリアにおける画像信号に基づいて算出された領域指標値(ロックオンエリア指標値)は、ロックオンエリア位置情報と対応付けられることにより、ロックオンエリア位置情報と、ロックオンエリア指標値とが対応付けられた特定ロックオンエリア指標値として記憶されることが好ましい。特定ロックオンエリア指標値は、領域指標値記憶部280に記憶される。また、特定ロックオンエリア指標値は、複数のロックオンエリアにつき、それぞれ記憶される。
特定ロックオンエリア指標値は、1回のみ記憶されてもよく、ロックオンエリア指標値が算出されるごとに、毎回更新されてもよい。また、ロックオンエリアにおける領域指標値が算出されるごとに時系列を示す時系列データと対応付け、それぞれの特定ロックオンエリア指標値が、いつ算出されたかを判別可能な情報として記憶されてもよい。
特定ロックオンエリア指標値を記憶することにより、表示用画像の指標値表示表に表示するロックオンエリア指標値(この場合、特定ロックオンエリア指標値)を、1回算出されたロックオンエリア指標値を保持して表示することができる。また、ロックオンエリア指標値が算出されるごとに、表示用画像の指標値表示表に表示するロックオンエリア指標値(この場合、特定ロックオンエリア指標値)を更新することができる。
検査中、手術中等のリアルタイムに内視鏡画像を観察する場合において、内視鏡12の移動、観察倍率の変更等の操作により、観察中の内視鏡画像にロックオンエリアが含まれなくなる場合がある。このように、ロックオンエリアの位置が、観察中の内視鏡画像に含まれない位置である視野外位置となる場合に、視野外位置となったロックオンエリアにおけるロックオンエリア指標値を、表示用画像の指標値表示表に継続して表示し続けることが好ましい。
この場合、指標値表示表生成部260は、ロックオンエリアの位置が前記視野外位置となる直前に記憶された特定ロックオンエリア指標値を、視野外ロックオンエリア指標値とし、視野外ロックオンエリア指標値を表示する指標値表示表を生成する。
視野外ロックオンエリア指標値を表示する指標値表示表の具体例について、図63を用いて説明する。図63(A)は、内視鏡12を移動する前の表示用画像271を示している。図63(A)には、領域位置情報272a、272b、272cとして表示されている3つのロックオンエリアにおいて算出された領域指標値を表示する指標値表示表261が表示されている。図63(B)は、内視鏡12を移動した後の表示用画像271を示している。
図63(B)では、内視鏡12の移動により、領域位置情報272aとして表示されていたロックオンエリアの位置は、視野外位置になっている。このため、図63(B)には、領域位置情報272b、272cとして表示されている2つのロックオンエリアが表示されている。この場合、領域位置情報272aとして表示されていたロックオンエリアの領域指標値は、視野外ロックオンエリア指標値として記憶されている。また、この場合、指標値表示表生成部260は、視野外ロックオンエリア指標値281を表示する指標値表示表261を生成する。拡張表示制御部200は、表示用画像生成部270によって生成された、視野外ロックオンエリア指標値281を表示する指標値表示表261を表示する表示用画像を表示する制御を行うことにより、図63(B)に示すような表示用画像を表示する。
視野外ロックオンエリア指標値を表示する場合、図63(B)に示すように、指標値表示表261に視野外ロックオンエリア指標値が表示されていることをユーザーに分かりやすくするため、視野外ロックオンエリア指標値が表示されている指標値表示表261の一部分を、表示用画像上に表示されている内視鏡画像211よりもずらして表示することが好ましい。なお、後述するように、指標値表示表261の表示サイズを変更する場合は、この限りではない。
上記のように、視野外ロックオンエリア指標値を表示用画像に表示することにより、視野外位置となった関心領域をユーザーに提示することができる。観察中の内視鏡画像の外の領域指標値を表示することにより、ユーザーに対し、被写体の広い範囲における情報を提示することができる。結果として、ユーザーは、観察中の内視鏡画像の外の情報を参照しながら、切開に適した領域を探すことができる。
図63(B)に示すような、視野外ロックオンエリア指標値が表示用画像に表示されている場合において、内視鏡画像上に、関心領域をさらに追加できることが好ましい。以下、関心領域をさらに追加する例について図64を用いて説明する。
図63(B)に示すような、視野外ロックオンエリア指標値が表示用画像に表示されている場合において、ユーザー操作によって関心領域設定指示が入力されることにより、関心領域設定部210は、図64に示すような、追加関心領域277を設定する。図64に示す表示用画像の例における追加関心領域277は、正確には、表示用画像に重畳表示される追加関心領域277の領域位置情報である。なお、追加関心領域277は、ロックオンエリアとすることが好ましい。
関心領域設定指示が入力されることにより、追加関心領域277が設定されると、設定領域位置情報記憶部240には、追加関心領域277の領域位置情報が記憶される。領域指標値算出部250は、追加関心領域277における画像信号に基づいて算出された生体指標値の統計値として、追加領域指標値を算出する。追加領域指標値とは、追加関心領域277における画像信号に基づいて算出された生体指標値の統計値である領域指標値のことである。
指標値表示表生成部260は、視野外ロックオンエリア指標値281、領域位置情報272b、272cとして表示されている2つのロックオンエリアのそれぞれの領域指標値282a、282b、及び追加領域指標値283をまとめて表示する指標値表示表である拡張指標値表示表269を生成する。拡張表示制御部200は、表示用画像生成部270によって生成された、拡張指標値表示表269を表示する表示用画像を表示する制御を行うことにより、図64に示すような表示用画像271を表示する。なお、拡張指標値表示表とは、追加領域指標値を表示する指標値表示表のことであり、「指標値表示表」の一態様である。拡張指標値表示表には、一度算出された追加領域指標値を保持して表示してもよく、追加領域指標値が算出される度に更新して表示してもよい。
なお、図64に示す例では、1つの追加関心領域277が新たに設定されているが、複数の追加関心領域を設定し、追加関心領域ごとに領域指標値を算出し、複数の領域指標値を指標値表示表に追加表示するようにしてもよい。
上記のように、追加関心領域を設定し、追加領域指標値を表示することにより、ユーザーに対し、被写体の広い範囲における情報を提示することができる。さらに、追加関心領域を設定するよりも、時系列的に前に算出された視野外ロックオンエリア指標値に加えて、追加領域指標値を表示することにより、ユーザーに対し、被写体のより広い範囲における情報を提示することができる。
図64に示すような表示用画像271を表示する場合において、表示用画像に表示されている領域位置情報と、これらの領域位置情報と対応する領域指標値と、を結ぶ指標値リンクラインを表示することが好ましい。この場合、図65に示すように、表示用画像生成部270に、指標値リンクライン生成部290を設ける。以下、指標値リンクラインを表示する例について、図66を用いて説明する。
図66に示す表示用画像の例では、図64に例示する表示用画像271において、指標値リンクライン291a、291b、291cが表示されている。指標値リンクライン291aは、領域指標値282aと、領域位置情報272bとを結ぶように表示されている。指標値リンクライン生成部290は、領域指標値記憶部280に記憶されている、領域指標値282a(ロックオンエリア指標値)と、領域位置情報272b(ロックオンエリア位置情報)との対応付けを読み出すことにより、これらを結ぶ指標値指標値リンクライン291aを生成し、拡張表示制御部200が表示制御を行うように制御する。
指標値リンクライン291bは、領域指標値282bと、領域位置情報272cとを結ぶ指標値リンクラインである。指標値リンクライン291cは、追加領域指標値283と、領域位置情報として表示されている追加関心領域277とを結ぶ指標値リンクラインである。指標値リンクライン291b及び指標値リンクライン291cは、指標値リンクライン291aと同様に、領域指標値記憶部280に記憶されている対応付けに基づき、指標値リンクライン生成部290によって生成される。
上記のように、指標値表示表に表示される領域指標値と、内視鏡画像に重畳表示される領域位置情報とを結ぶ指標値リンクラインを表示することで、領域指標値と領域位置情報との対応関係を、ユーザーが簡単に理解できる態様で表示することができる。特に、指標値表示表に表示される領域指標値が多い場合において、切開に適した領域の判別を助ける情報の視認性を向上することができる。
また、図66に示す表示用画像の例のように、視野外ロックオンエリア指標値である領域指標値281には、指標値リンクラインを表示しない。領域指標値281と対応するロックオンエリアの位置が視野外位置であることを、ユーザーが簡単に理解できるようにするためである。
拡張表示制御部200は、表示用画像に表示される、指標値表示表の表示サイズを変更するようにしてもよい。「表示サイズの変更」には、指標値表示表の縦横比を維持して、拡大又は縮小する変更と、指標値表示表の縦横比を維持せずに拡大又は縮小する変更とが含まれる。指標値表示表の縦横比を維持せずに拡大又は縮小する変更には、指標値表示表に表示される、隣接する領域指標値の距離を大きくする、又は小さくする変更が含まれる。
隣接する領域指標値の距離を小さくして表示する、指標値表示表の表示サイズの変更の具体例を、図67を用いて説明する。図67には、図66に示す表示用画像271において表示されている拡大指標値表示表269を、隣接する領域指標値の距離を小さくすることで縮小した拡大指標値表示表269aを示している。上記のように、指標値表示表の表示サイズを変更することにより、指標値表示表の視認性を向上させることができる。また、ディスプレイのインチサイズが小さい場合、表示用画像に他の情報を表示したい場合等の、指標値表示表の表示範囲を小さくすることができる。また、ディスプレイ上で指標値表示表を大きく表示したい場合に好適である。なお、表示用画像における指標値表示表の表示サイズを変更する制御は、ユーザーによる操作入力を介して行われてもよく、自動的に行われてもよい。
図66には、視野外ロックオンエリア指標値及び追加関心領域が表示される表示用画像において、指標値リンクラインを表示する例を示したが、指標値リンクラインは、視野外ロックオンエリア指標値及び追加関心領域が表示されていない表示用画像において、表示してもよい。以下、具体例について説明する。
例えば、図49に例示する表示用画像271において、指標値リンクラインを表示する場合、ディスプレイには、図68に示すような表示用画像271を表示する。図68に示す表示用画像の例では、図49に例示する表示用画像271において、指標値リンクライン292a、292b、292cが表示されている。
指標値リンクライン292aは、領域指標値284と、領域位置情報272aとを結ぶ指標値リンクラインである。指標値リンクライン292bは、領域指標値282bと、領域位置情報272bとを結ぶ指標値リンクラインである。指標値リンクライン292cは、領域指標値282bと、領域位置情報272cとを結ぶ指標値リンクラインである。
指標値リンクライン292a、指標値リンクライン292b及び指標値リンクライン292cは、領域指標値記憶部280に記憶されている対応付けに基づき、指標値リンクライン生成部290によって生成される。図68に示す表示用画像の例の場合、領域指標値284及び領域位置情報272a、領域指標値282b及び領域位置情報272b並びに領域指標値282b及び領域位置情報272cが、それぞれ対応付けされて領域指標値記憶部280に記憶されている。なお、領域位置情報272a、領域位置情報272b及び領域位置情報272cはロックオンエリア位置情報であり、領域指標値284、領域指標値282b及び領域指標値282bはロックオンエリア指標値である。
図68に示すような表示用画像271において、内視鏡12を動かすことにより、領域位置情報272a(ロックオンエリア位置情報)が視野外位置とした場合、図69に示すような、視野外ロックオンエリア指標値281を表示する拡張指標値表示表269を表示する表示用画像271が表示される。この場合、領域位置情報272aが視野外位置となるため、図68において表示されていた指標値リンクライン292aは、図69に示す表示用画像271には表示されない。
また、図69に示すような表示用画像271において、隣接する領域指標値の距離を小さくすることで拡大指標値表示表269aを縮小する、指標値表示表の表示サイズの変更を行う場合、図70に示すような、拡大指標値表示表269aが縮小された拡大指標値表示表269bを、表示用画像271に表示する。
また、図68、図69、図70に例示するような表示用画像271において、図71、図72、図73にそれぞれ示すような、破線で示す領域位置情報272a、272b、272cのいずれか1つ以上を含む、実線で示す表示用領域位置情報272dを表示するようにしてもよい。なお、図72、図73にそれぞれ示すように、内視鏡12の動きに追従し、ロックオンエリア位置情報272aが視野外位置となった場合には、表示用領域位置情報272dの表示態様を変更することが好ましい。
また、追加関心領域は、視野外ロックオンエリア指標値が表示されていない表示用画像においても、追加設定されてもよい。また、表示用画像の指標値表示表には、視野外ロックオンエリア指標値を表示せず、表示用画像に表示されている領域位置情報と対応付けされて記憶されている領域指標値のみを表示するようにしてもよい。以下、具体例について説明する。
例えば、図49に例示する表示用画像271において、内視鏡12を動かすことにより、領域位置情報272a、272b(ロックオンエリア位置情報)を視野外位置とし、図74に示すように、領域位置情報272c(ロックオンエリア位置情報)のみが表示用画像に表示されている場合、領域位置情報272cと対応付けられた領域指標値282bのみを、表示用画像271の指標値表示表261に表示してもよい。
図74に示すような表示用画像271が表示されている場合において、ユーザー操作によって関心領域設定指示が入力されることにより、関心領域設定部210は、図75に示すような、追加関心領域278a、278bを設定する。図75に示す例では、追加関心領域を2つ設定するように予め設定されている。なお、設定される追加関心領域の数は、任意に設定されてよく、1つであっても、3つ以上であってもよい。また、図75に示す表示用画像の例における追加関心領域278a、278bは、正確には、表示用画像に重畳表示される追加関心領域278a、278bの領域位置情報である。
追加関心領域278a、278bが設定されると、領域位置情報記憶部240には、追加関心領域278a、278bの領域位置情報が記憶される。領域指標値算出部250は、追加関心領域278a、278bにおける画像信号に基づいて算出された生体指標値の統計値として、追加領域指標値285a、285bを算出する(図76参照)。追加領域指標値285aは、追加関心領域278aにおける画像信号に基づいて算出された領域指標値である。追加領域指標値285bは、追加関心領域278bにおける画像信号に基づいて算出された領域指標値である。
指標値表示表生成部260は、領域位置情報272c、追加関心領域278a及び追加関心領域278bとして表示されている2つのロックオンエリアのそれぞれの領域指標値282b、追加領域指標値285a、285bをまとめて表示する指標値表示表である拡張指標値表示表269を生成する。拡張表示制御部200は、表示用画像生成部270によって生成された、拡張指標値表示表269を表示する表示用画像を表示する制御を行うことにより、図76に示すような表示用画像271を表示する。なお、図76に示すような表示用画像271においても、指標値リンクラインを表示するようにしてもよい。
また、図76では、領域指標値282bと、追加領域指標値、285a、285bとをまとめて表示する拡張指標値表示表269を表示する例を示したが、領域指標値282bを表示する指標値表示表と、追加領域指標値285a、285bを表示する指標値表示表とを、異なる複数の指標値表示表として、分けて表示するようにしてもよい。
また、図74、図75、図76に例示するような表示用画像271において、図77、図78、図79にそれぞれ示すような、破線で示す領域位置情報272c、278a、278bのいずれか1つ以上を含む、実線で示す表示用領域位置情報278cを表示するようにしてもよい。なお、図78、図79に示すように、追加関心領域が設定された場合には、表示用領域位置情報278cの表示態様を変更することが好ましい。
上記のように、追加領域指標値を表示することにより、ユーザーに対し、被写体の広い範囲における情報を提示することができる。このように、複数の関心領域における領域指標値を表示し、また、関心領域を追加できるようにすることで、生体組織における生体指標値の空間的な情報を表示することにより、ユーザーが切開に適した領域を判別できるようサポートすることができる。
[第2実施形態]
第2実施形態においては、光源部20を、第1実施形態に示す各色LED20a~20eの代わりに、白色LED、キセノンランプ、ハロゲン光源等の広帯域光を発光する広帯域光源400とし、広帯域光源400と、回転フィルタ410とを組み合わせることによって光源装置13から出射される光を、被写体を照明する照明光とする。以下、内視鏡システム10において、第1実施形態と相違する部分を説明し、共通する部分については、説明を省略する。
第2実施形態においては、光源部20を、第1実施形態に示す各色LED20a~20eの代わりに、白色LED、キセノンランプ、ハロゲン光源等の広帯域光を発光する広帯域光源400とし、広帯域光源400と、回転フィルタ410とを組み合わせることによって光源装置13から出射される光を、被写体を照明する照明光とする。以下、内視鏡システム10において、第1実施形態と相違する部分を説明し、共通する部分については、説明を省略する。
第2実施形態では、図80に示すように、内視鏡システム10の光源装置13には、広帯域光源400、回転フィルタ410、フィルタ切替え部420が設けられる。フィルタ切替え部420は、光源制御部21によって制御される。それ以外の構成については、第1実施形態の内視鏡システム10と同様である。なお、第2実施形態においては、撮像センサ44を、モノクロの撮像センサとすることが好ましい。
広帯域光源400は、青色から赤色に及ぶ波長帯域を有する広帯域光を発する。広帯域光は、例えば、白色光である。回転フィルタ410は、図81に示すように、内側に設けられた内側フィルタ411と、外側に設けられた外側フィルタ412とを備える。フィルタ切替え部420は、回転フィルタ410を径方向に移動させるものである。フィルタ切替え部420は、通常モードの場合には、回転フィルタ410の内側フィルタ411を白色光の光路に挿入する。また、フィルタ切替え部420は、酸素飽和度モード又は補正モードの場合には、回転フィルタ410の外側フィルタ412を白色光の光路に挿入する。
図81に示すように、内側フィルタ411には、周方向に沿って、白色光のうち紫色光V及び第2青色光BSが有する波長帯域を透過させるB1フィルタ411a、白色光のうち緑色光Gが有する波長帯域を透過させるGフィルタ411b、及び白色光のうち赤色光Rが有する波長帯域を透過させるRフィルタ411cが設けられている。したがって、通常モードの場合、紫色光V及び第2青色光BSの波長帯域を有する照明光、緑色光Gの波長帯域を有する照明光、赤色光Rの波長帯域を有する照明光が、回転フィルタ410の回転に合わせて光源装置13から出射される。
また、図81に示すように、外側フィルタ412には、周方向に沿って、白色光のうち波長帯域B1を有する第1青色光BLを透過させるB1フィルタ412a、白色光のうち第2青色光BSが有する波長帯域の光を透過させるB2フィルタ412b、白色光のうち波長帯域G2を有する緑色光Gを透過させるGフィルタ412c、白色光のうち波長帯域R2を有する赤色光Rを透過させるRフィルタ412d、及び白色光のうち波長帯域B3の光である青緑光BGを透過させるB3フィルタ412eが設けられている(図21、図22参照)。したがって、酸素飽和度モード又は補正モードの場合、第1青色光BL、第2青色光BS、緑色光G、赤色光R、青緑光BGの波長帯域を有する照明光が、回転フィルタ410の回転に合わせて光源装置13から出射される。
内視鏡システム10では、通常モードの場合、紫色光V及び第2青色光BSの波長帯域を有する照明光を被写体に照明することで得られる反射光を、モノクロ撮像センサで撮影することにより、Bc画像信号が出力される。また、緑色光Gの波長帯域を有する照明光を被写体に照明することで得られる反射光を、モノクロ撮像センサで撮影することにより、Gc画像信号が出力される。また、赤色光Rの波長帯域を有する照明光を被写体に照明することで得られる反射光を、モノクロ撮像センサで撮影することにより、Rc画像信号が出力される。次いで、Bc画像信号、Gc画像信号、Rc画像信号に基づき、第1実施形態と同様の方法により、白色光画像が生成される。
一方、酸素飽和度モード又は補正モードの場合、第1青色光BLの波長帯域を有する照明光を被写体に照明することで得られる反射光を、モノクロ撮像センサで撮影することにより、B1画像信号が出力される。また、第2青色光BSの波長帯域を有する照明光を被写体に照明することで得られる反射光を、モノクロ撮像センサで撮影することにより、B2画像信号が出力される。また、緑色光Gの波長帯域を有する照明光を被写体に照明することで得られる反射光を、モノクロ撮像センサで撮影することにより、G2画像信号が出力される。また、赤色光Rの波長帯域を有する照明光を被写体に照明することで得られる反射光を、モノクロ撮像センサで撮影することにより、R2画像信号が出力される。また、青緑光BGの波長帯域を有する照明光を被写体に照明することで得られる反射光を、モノクロ撮像センサで撮影することにより、B3画像信号が出力される。次いで、プロセッサ装置14から送信されたB1画像信号、B2画像信号、G2画像信号、R2画像信号、B3画像信号に基づき、第1実施形態と同様の方法により、拡張プロセッサ装置16において酸素飽和度画像が生成され、また、補正処理が行われる。ただし、第2実施形態では、信号比ln(B3/G3)に代えて、B3画像信号をG2画像信号で規格化した信号比ln(B3/G2)が用いられる。
補正モードにおける酸素飽和度の算出に関する補正処理としては、補正酸素飽和度算出用テーブル120を参照することにより、特定色素濃度に応じた酸素飽和度算出用テーブルを選択し、酸素飽和度算出用テーブルを選択された酸素飽和度算出用テーブルとするテーブル補正処理を行ってもよく図24に示すような酸素飽和度算出用テーブル110を参照することによって算出された酸素飽和度に対し、特定演算値から得られる補正値を加算又は減算する算出値補正処理を行ってもよい。
算出値補正処理を行う場合、図82に示す2次元座標系430を参照することにより、酸素飽和度の補正に用いる補正値を算出する。2次元座標系430の縦軸は、B1画像信号、G2画像信号、R2画像信号、及びB3画像信号に基づいて得られる特定演算値であり、横軸はln(R2/G2)である。特定演算値は、下記式A)により定められる。
式A)B1/G2×cosφ-B3/G2×sinφ
式A)B1/G2×cosφ-B3/G2×sinφ
2次元座標系430では、予め定められた基準ベースライン情報の分布を示す基準線431aと、実際の観察対象の撮影によって得られた実測ベースライン情報の分布を示す実測線431bとが示されている。基準線431aと実測線431bとの差分値ΔZが、補正値として算出される。なお、基準ベースライン情報は、特定色素が無い状態で得られ、かつ、酸素飽和度に依存しない情報として定められている。具体的には、上記式A)が、酸素飽和度が変化しても一定になるように、φを調整した値を、基準ベースライン情報としている。
また、酸素飽和度を算出するために、図34に示す3次元座標121を参照してもよい。なお、第2実施形態においては、図34に示す3次元座標121のZ軸を、信号比ln(B3/G2)とし、また、Z成分の値として、信号比ln(B3/G2)を用いる。
[第3実施形態]
第3実施形態においては、内視鏡12を、図83に示すような、挿入部12aの基端部分にカメラヘッド500を備える硬性内視鏡とする。カメラヘッド500には、撮像光学系43が備えられる。第1実施形態及び第2実施形態においては、内視鏡12の先端部に、対物レンズ43a及び撮像センサ44を有する撮像光学系43が設けられているが、第3実施形態では、撮像光学系43のうち撮像センサが、先端部ではなくカメラヘッド500に備えられる。カメラヘッド500では、内視鏡12の先端部から導光された反射光が撮影される。カメラヘッド500において撮影された画像信号は、プロセッサ装置14に送信される。なお、図83では、モード切替え用スイッチ12c及び関心領域設定用スイッチ12dは省略している。以下、内視鏡システム10において、第1実施形態及び第2実施形態と相違する部分を説明し、共通する部分については、説明を省略する。
第3実施形態においては、内視鏡12を、図83に示すような、挿入部12aの基端部分にカメラヘッド500を備える硬性内視鏡とする。カメラヘッド500には、撮像光学系43が備えられる。第1実施形態及び第2実施形態においては、内視鏡12の先端部に、対物レンズ43a及び撮像センサ44を有する撮像光学系43が設けられているが、第3実施形態では、撮像光学系43のうち撮像センサが、先端部ではなくカメラヘッド500に備えられる。カメラヘッド500では、内視鏡12の先端部から導光された反射光が撮影される。カメラヘッド500において撮影された画像信号は、プロセッサ装置14に送信される。なお、図83では、モード切替え用スイッチ12c及び関心領域設定用スイッチ12dは省略している。以下、内視鏡システム10において、第1実施形態及び第2実施形態と相違する部分を説明し、共通する部分については、説明を省略する。
光源装置13は、通常モードの場合、紫色光V、第2青色光BS、緑色光G及び赤色光Rを含む白色光を出射する。また、光源装置13は、酸素飽和度モード及び補正モードの場合、図84に示すような、第1青色光BL、第2青色光BS、緑色光G及び赤色光Rを含む混合光である照明光を出射する。
カメラヘッド500は、図85に示すように、ダイクロイックミラー501、502、503と、モノクロ撮像センサである撮像センサ511、512、513、514とを備える。ダイクロイックミラー501は、被写体からの反射光のうち、紫色光V及び第2青色光BSが有する波長帯域の光を反射し、かつ、第1青色光BL、緑色光G及び赤色光Rが有する波長帯域の光を透過する。ダイクロイックミラー501が反射し、撮像センサ511に入射する光は、図86に示すように、紫色光V又は第2青色光BSの波長帯域を有する。撮像センサ511は、通常モードではBc画像信号を出力し、酸素飽和度又は補正モードではB2画像信号を出力する。
ダイクロイックミラー502は、ダイクロイックミラー501を透過した光のうち、第1青色光BLが有する波長帯域の光を反射し、かつ、緑色光G及び赤色光Rが有する波長帯域の光を透過させる。ダイクロイックミラー502が反射し、撮像センサ512に入射する光は、図87に示すように、第1青色光BLの波長帯域を有する。撮像センサ512は、通常モードでは画像信号の出力を停止し、酸素飽和度モード又は補正モードではB1画像信号を出力する。
ダイクロイックミラー503は、ダイクロイックミラー502を透過した光のうち、緑色光Gが有する波長帯域の光を反射し、かつ、赤色光Rが有する波長帯域の光を透過させる。ダイクロイックミラー503が反射し、撮像センサ513に入射する光は、図88に示すように、緑色光Gの波長帯域を有する。撮像センサ513は、通常モードではGc画像信号を出力し、酸素飽和度又は補正モードではG2画像信号を出力する。
ダイクロイックミラー503で透過し、かつ、撮像センサ514に入射する光は、図89に示すように、赤色光Rの波長帯域を有する。撮像センサ514は、通常モードではRc画像信号を出力し、酸素飽和度モード又は補正モードではR2画像信号を出力する。
すなわち、第3実施形態においては、通常モードでは、Bc画像信号、Gc画像信号及びRc画像信号が、酸素飽和度モード又は補正モードでは、B1画像信号、B2画像信号、G2画像信号及びR2画像信号が、カメラヘッドから出力される。カメラヘッドから出力されたBc画像信号、Gc画像信号及びRc画像信号は、プロセッサ装置14の画像信号取得部60に取得され、白色光画像を生成するために、内視鏡画像生成部70に送信される。カメラヘッドから出力されたB1画像信号、B2画像信号、G2画像信号及びR2画像信号は、プロセッサ装置14の画像信号取得部60に取得される。このうち、B2画像信号、G2画像信号及びR2画像信号は、白色光相当画像を生成するために、内視鏡画像生成部70に送信される。また、B1画像信号、B2画像信号、G2画像信号及びR2画像信号は、酸素飽和度画像を生成するために、画像通信部90を介して拡張プロセッサ装置16に送信される。
なお、第1及び第2実施形態においては、酸素飽和度の算出に、波長帯域B1の情報を含むB1画像信号を用いているが、B1画像信号に代えて、その他の画像信号を用いてもよい。例えば、図90(図22(A)参照)に示すように、還元ヘモグロビン(Hb)と、酸化ヘモグロビン(HbO2)との反射スペクトルの差が大きい波長帯域Rkの情報を含むRk画像信号を用いてもよい。波長帯域Rxは、図90に示すように、680nm±10nmの範囲の波長帯域である。図91に示すように、Rk画像信号(図91では、「Rk」で示す)は、の酸素飽和度依存性は「中~小」、血液濃度依存性は「小」、黄色色素依存性は「小」、明るさ依存性は「有」である。Rk画像信号を出力する場合、波長帯域Rkを検出することができる撮像センサと、ダイクロイックミラー503を透過した赤色光Rが有する波長帯域の光を反射し、かつ、波長帯域Rkを有する光を透過させるダイクロイックミラーとが、カメラヘッド500に備えられる。
[第4実施形態]
第4実施形態においては、第3実施形態と同じく、内視鏡12を、挿入部12aの基端部分にカメラヘッドを備える硬性内視鏡とする。以下、第1実施形態、第2実施形態、第3実施形態とは異なる部分について説明し、共通する部分については省略する。第4実施形態においては、第3実施形態のカメラヘッド500に代えて、図92に示すような、カメラヘッド600を備える。
第4実施形態においては、第3実施形態と同じく、内視鏡12を、挿入部12aの基端部分にカメラヘッドを備える硬性内視鏡とする。以下、第1実施形態、第2実施形態、第3実施形態とは異なる部分について説明し、共通する部分については省略する。第4実施形態においては、第3実施形態のカメラヘッド500に代えて、図92に示すような、カメラヘッド600を備える。
カメラヘッド600は、図92に示すように、ダイクロイックミラー601と、撮像センサ611、612とを備える。ダイクロイックミラー601は、被写体からの反射光のうち、紫色光V、第2青色光BS、緑色光G及び赤色光Rが有する波長帯域の光を反射し、かつ、第1青色光BLが有する波長帯域の光を透過する。
ダイクロイックミラー601が反射した光を受光する撮像センサ611は、B画素にBカラーフィルタBFが、G画素にGカラーフィルタGFが、R画素にRカラーフィルタRFが、それぞれ設けさられるカラー撮像センサである。また、ダイクロイックミラー601が透過した光を受光する撮像センサ612は、モノクロ撮像センサである。
通常モードの場合、光源装置13から白色光が出射され(図10参照)、ダイクロイックミラー601が反射した被写体からの反射光を、カラー撮像センサである撮像センサ611が受光することにより、Bc画像信号、Gc画像信号及びRc画像信号が、それぞれ撮像センサ611から出力される。通常モードでは、モノクロ撮像センサである撮像センサ612は、画像信号の出力を停止する。
酸素飽和度モードの場合、光源装置13からは、図93(A)に示すような、第2青色光BS、第1青色光BL、緑色光G及び赤色光Rを含む観察用照明光(以下、第4照明光と呼ぶ。)が出射される。ダイクロイックミラー601は、第4照明光で照明された被写体からの反射光を、反射及び透過することによって分光する。図93(B)は、ダイクロイックミラー601に入射した光の反射率(破線601a)及び透過率(実線601b)と、光の波長との関係を示している。
第4照明光で照明された被写体からの反射光のうち、ダイクロイックミラー601に反射される光は、カラー撮像センサである撮像センサ611に受光される。撮像センサ611のB画素B、G画素G、R画素Rの感度と、光の波長とは、図93(C)に示すような関係を有する。このため、撮像センサ611のB画素Bは、第2青色光BSが有する波長帯域B2の光を感知することにより、B2画像信号を出力する。また、撮像センサ611のG画素Gは、緑色光Gが有する波長帯域G2の光を感知することにより、G2画像信号を出力する。さらに、撮像センサ611のR画素Rは、赤色光Rが有する波長帯域R2の光を感知することにより、R2画像信号を出力する。
一方、第4照明光で照明された被写体からの反射光のうち、ダイクロイックミラー601に透過される光は、モノクロ撮像センサである撮像センサ612に受光される。撮像センサ612の感度と、光の波長とは、図94(C)に示すような関係を有する。このため、撮像センサ612は、ダイクロイックミラー601が透過する、第1青色光BLが有する波長帯域BLの光を感知することにより、B1画像信号を出力する。なお、図94(A)は、図93(A)と同じく、第4照明光に含まれる光の波長帯域を示している。また、図94(B)は、図93(B)と同じく、ダイクロイックミラー601に入射した光の反射率(破線601a)及び透過率(実線601b)と、光の波長との関係を示している。
第4実施形態の酸素飽和度モードでは、図95に示すように、1フレームFにつき1回ずつ、第4照明光L4が発光される発光パターンを繰り返す。したがって、第4実施形態の酸素飽和度モードでは、1フレームにつき、カラー撮像センサである撮像センサ611からB2画像信号、G2画像信号及びR2画像信号が出力され、かつ、モノクロ撮像センサである撮像センサ612からB1画像信号が出力される。酸素飽和度モードにおいて撮像センサ611又は撮像センサ612から出力されたB1画像信号、B2画像信号、G2画像信号及びR2画像信号は、プロセッサ装置14に送信される。酸素飽和度モードにおける酸素飽和度を含む生体指標値の算出方法は、第1実施形態と同様である。
第4実施形態の補正モードでは、図96に示すように、第4照明光L4が発光されている場合に、ユーザー操作によって発光切替え指示が入力されると、2フレームF分の無発光状態NLを経て、第3照明光L3を2フレームF分発光し、さらに複数フレーム分の無発光状態NLを経て、2フレームF分の第4照明光L4を発光する発光パターンの態様をとる。無発光状態NLのフレームは、第4照明光L4と第3照明光とを切替えるための期間であり、いずれの照明光も発光されない。発光切替え指示は、内視鏡12又はユーザーインターフェースに設けられる照明光切替え用スイッチ(図示しない)の操作によって入力されてもよく、モード切替えスイッチ12cのトグル操作によって入力されてもよい。
補正モードにおいて、第4照明光L4が発光されるフレームでは、酸素飽和度モードと同じく、撮像センサ611からB2画像信号、G2画像信号及びR2画像信号が出力され、かつ、撮像センサ612からB1画像信号が出力される。
補正モードにおいて、第3照明光L3が発光されるフレームでは、光源装置13から、図97(A)に示すような、緑色光Gを含む第3照明光(補正用照明光)が出射される。また、ダイクロイックミラー601が反射した被写体からの反射光(図97(B)参照)をカラー撮像センサである撮像センサ611が受光する。結果として、図97(C)に示すように、撮像センサ611のB画素Bは、緑色光Gが有する波長帯域B3の光を感知することにより、B3画像信号を出力する。加えて、図98(C)に示すように、撮像センサ611のG画素Gは、緑色光Gが有する波長帯域G3の光を感知することにより、G3画像信号を出力する。また、撮像センサ611のR画素Rは、緑色光Gが有する波長帯域の光を感知することにより、R3画像信号を出力する(図示しない)。
なお、図98(A)は、図97(A)と同じく、第3照明光に含まれる光の波長帯域を示している。また、図97(B)及び図98(B)は、図93(B)と同じく、ダイクロイックミラー601に入射した光の反射率(破線601a)及び透過率(実線601b)と、光の波長との関係を示している。また、図97(C)及び図98(C)には、図93(C)と同じく、撮像センサ611のB画素B、G画素G、R画素Rの感度と、光の波長との関係を示している。
酸素飽和度モードにおいて撮像センサ611又は撮像センサ612から出力されたB1画像信号、B2画像信号、G2画像信号及びR2画像信号は、プロセッサ装置14に送信され、画像信号取得部60に取得される。第4実施形態では、第1、第2実施形態と異なり、画像信号取得部60が、通常モードで取得されるBc画像信号、Gc画像信号及びRc画像信号、酸素飽和度モード及び補正モードで取得されるB2画像信号、G2画像信号及びR2画像信号、並びに補正モードで取得されるB3画像信号、G3画像信号及びR3画像信号に対するデモザイク処理を行う。以下、第4実施形態における信頼度の算出について説明する。
第1実施形態では、補正用画像161を表示し、補正用画像161に含まれる特定領域162について、特定領域162に含まれる画素ごとに信頼度を算出する。第4実施形態では、第1実施形態と異なり、第4照明光L4が発光されるフレームにおいて得られる画像(白色光相当画像及び第1青色光画像)と、第3照明光L3が発光されるフレームとにおいて得られる画像(第3照明光画像)とを用い、補正用領域ごとに信頼度を算出する。補正用領域は、第1実施形態における特定領域に相当する。また、「補正用領域」の用語は、後述するように、「複数に分割された小領域の集合」又は「小領域そのもの(第N補正用領域、Nは1以上の自然数)」を指す用語として用いる。
白色光相当画像は、第4照明光L4が発光されるフレームにおいて出力される、B2画像信号、G2画像信号及びR2画像信号を用いて生成される内視鏡画像である。第1青色光画像は、第4照明光L4が発光されるフレームにおいて出力されるB1画像信号を用いて生成される内視鏡画像である。第3照明光画像は、第3照明光L3が発光されるフレームにおいて出力される、B3画像信号、G3画像信号及びR3画像信号を用いて生成される内視鏡画像である。なお、第4実施形態においては、白色光相当画像及び第3照明光画像は、画像信号取得部60において、デモザイク処理が行われることによって生成される、全画素が画素値を有する内視鏡画像である。第1青色光画像は、モノクロ画像センサから出力されるため、画像信号取得部60がB1画像信号を取得する時点において、全画素が画素値を有している。
白色光相当画像及び第3照明光画像は、図99に示す、プロセッサ装置14の特徴量算出部620に送信される。特徴量算出部620は、プロセッサ装置14において、中央制御部50とは異なるプロセッサによって構成されることが好ましい。例えば、特徴量算出部620は、FPGA(Field Programmable Gate Array)によって構成されることが好ましい。
特徴量算出部620は、白色光相当画像、第1青色光画像及び第3照明光画像のうち、図100に示す、複数の補正用領域について、それぞれ領域特徴量を算出する。領域特徴量については後述する。補正用領域622は、図100に示すように、白色光相当画像621において、複数個の領域に分割された小領域である。図100に示す例では、補正用領域622は、白色光相当画像621の横の長さaを、a1、a2及びa3に、縦の長さbを、b1、b2及びb3に、それぞれ3等分し、a2の列とb2の行とが交差する領域を、さらに16等分に分けた領域である(図100(A)参照)。補正用領域622とする領域の位置、補正用領域622とする領域を分ける数はこれに限らない。例えば、補正用領域622を9等分としてもよく、25等分としてもよい。
図100(B)は、図100(A)に示す補正用領域622を、拡大した図である。図100(B)に示すように、補正用領域622は、第1補正用領域622aから第16補正用領域622pまでの16個に分けた領域である。図100(B)では、補正用領域622が第1補正用領域622aから第16補正用領域622pまでの16個に分けられていることを、1から16までの数字を付して示している。
特徴量算出部620は、第N補正用領域(図100に示す例の場合は、第1補正用領域から第16補正用領域まで)のそれぞれの補正用領域について、各補正用領域を構成する画素が、有効画素であるかどうかの判定を行う。有効画素であるかどうかの判定は、各画素の各チャンネル(Bチャンネル、Gチャンネル、Rチャンネル)について、それぞれ下限値と上限値のチャンネル閾値を設けることで行う。
Bチャンネルについては、Bチャンネル下限閾値及びBチャンネル上限閾値が設けられる。Gチャンネルについては、Gチャンネル下限閾値及びGチャンネル上限閾値が設けられる。Rチャンネルについては、Rチャンネル下限閾値及びRチャンネル上限閾値が設けられる。
特徴量算出部620は、白色光相当画像、第1青色光画像及び第3照明光画像について、各補正用領域の各画素について、すべての色のチャンネルの画素値が、各色のチャンネル下限閾値以上チャンネル上限閾値未満の範囲内である場合に、その画素を有効画素と判定する。
白色光相当画像及び第3照明光画像については、白色光相当画像及び第3照明光画像を構成する各画素の、Bチャンネルの画素値がBチャンネル下限閾値以上Bチャンネル上限閾値未満の範囲内、かつ、Gチャンネルの画素値がGチャンネル下限閾値以上Gチャンネル上限閾値未満の範囲内、かつ、Rチャンネルの画素値がRチャンネル下限閾値以上Rチャンネル上限閾値未満の範囲内である場合に、その画素を有効画素と判定する。
第1青色光画像については、各画素の画素値が、モノクロ画像用チャンネル下限値以上モノクロ画像用チャンネル上限値未満の範囲内である場合に、その画素を有効画素と判定する。
次いで、特徴量算出部620は、白色光相当画像、第3照明光画像及び第1青色光画像における、各補正用領域について、領域特徴量を算出する。領域特徴量は、有効画素数、有効画素の画素値の総和、有効画素の画素値の2乗総和、有効画素の画素値の分散等である。
すなわち、特徴量算出部620は、白色光相当画像の各チャンネルの各補正用領域について領域特徴量をそれぞれ算出する。また、第3照明光画像の各チャンネルの各補正用領域について領域特徴量をそれぞれ算出する。また、第1青色光画像の各補正用領域についてそれぞれ領域特徴量を算出する。特徴量算出部620が算出したそれぞれの内視鏡画像の、各チャンネルの各補正用領域の領域特徴量は、拡張プロセッサ装置16の信頼度算出部160に送信される。
第4実施形態において、信頼度算出部160は、補正用領域における外乱の影響の程度を判定するための信頼度を算出する。また、信頼度算出部160は、内視鏡12の動きの程度を判定するための第2色素値を算出する。内視鏡12の動きの程度とは、第4実施形態の補正モードにおける照明光の切替え中(つまり、無発光状態NL)において、内視鏡12が動かされたかどうかを判定するための程度である。無発光状態NLにおいて内視鏡12が動くと、内視鏡画像に写る観察対象も動くため、補正処理が適切に行われない場合がある。このため、補正用領域における内視鏡12の動きの程度を算出することにより、後述のように、内視鏡12の動きの程度によって内視鏡12の動きに関する判定を行い、内視鏡12の動きの程度が大きい場合は、内視鏡12を動かさないよう、ユーザーに報知を行うことができる。第2色素値の算出については後述する。
また、第4実施形態において、拡張プロセッサ装置16の補正判定部170は、信頼度を用いて外乱の影響の程度を判定し、及び/又は第2色素値を用いて内視鏡12の動きの程度を判定する。
以下、第4実施形態において、外乱の影響の程度を判定する方法と、内視鏡12の動きの程度を判定する方法とについて説明する。第4実施形態において、図101に示すように、信頼度算出部160は、領域信頼度算出部630及び第2色素値算出部650を有する。また、補正判定部170は、領域信頼度判定部640及び第2色素値判定部660を有する。
信頼度算出部160の領域信頼度算出部630は、各フレームにおいて出力された画像信号から生成される白色光相当画像、第1青色光画像及び第3照明光画像の、各チャンネルの各補正用領域の領域特徴量を用いて、領域信頼度を算出する。領域信頼度には、補正用領域内の画素値の平均値、補正用領域内の画素値の標準偏差、補正用領域内の有効画素率、補正用領域内の明るさについての信頼度、補正用領域内に含まれる出血の程度による信頼度、補正用領域内に含まれる脂肪の程度による信頼度等がある。なお、領域信頼度は、第1実施形態における「信頼度」の一態様である。
補正用領域内の画素値の平均値は、補正用領域内の画素数と、補正用領域内の有効画素の画素値を用いて算出する。補正用領域内の画素値の標準偏差は、補正用領域内の画素数と、有効画素の画素値の分散を用いて算出する。補正用領域内の有効画素率は、補正用領域内の画素数と、有効画素数とを用いて算出する。補正用領域内の明るさについての信頼度は、補正用領域内のG2画像信号の平均値(すなわち、白色光相当画像のGチャンネルの、補正用領域内の画素値を変換することによって得られる信号値)を、図102に示すような、第1信頼度算出用テーブル163(図36参照)の横軸を、G2画像信号の信号値とした第1信頼度算出用テーブル763に適用して算出する。なお、G2画像信号の信号値は、G2画像信号を用いて変換処理を行うことによって得られる輝度値の平均値とすることが好ましい。
補正用領域内に含まれる出血の程度による信頼度は、白色光相当画像の各補正用領域内における、B2画像信号の平均値、G2画像信号の平均値及びR2画像信号の平均値(すなわち、白色光相当画像の各色チャンネルの、各補正用領域内の画素値の平均)を用いて、領域平均信号比ln(R2/G2)及び領域平均信号比ln(B2/G2)を算出し、これらの信号比を、第2信頼度算出用テーブル164に適用して算出する(図37参照)。
補正用領域内に含まれる脂肪の程度による信頼度は、白色光相当画像の、各補正用領域内における、G2画像信号の平均値及びR2画像信号の平均値(すなわち、白色光相当画像のGチャンネル及びRチャンネルの、各補正用領域内の画素値の平均)と、第1青色光画像の各補正用領域内における、B1画像信号の平均値とを用いて、領域平均信号比ln(R2/G2)及び領域平均信号比ln(B1/G2)を算出し、これらの信号比を、図103に示すような、第3信頼度算出用テーブル165(図38参照)の縦軸を、信号比ln(B1/G2)とした第3信頼度算出用テーブル765に適用して算出する。領域信頼度算出部630が算出した領域信頼度は、補正判定部170の領域信頼度判定部640に送信される(図101参照)。
以下、第4実施形態において、外乱の影響の程度を判定し、報知を行う方法について説明する。領域信頼度判定部640は、予め設定されている領域信頼度判定用閾値を用いて、白色光相当画像、第1青色光画像及び第3照明光画像における各補正用領域について、高信頼度補正用領域であるか、又は低信頼度補正用領域であるかの判定結果を出力する。
領域信頼度判定用閾値は、領域信頼度の種類に応じて設定してもよい。例えば、「補正用領域内の画素値の平均値」に対して第1領域信頼度判定用閾値を設定し、「補正用領域内の画素値の平均値」が第1領域信頼度判定用閾値以上である場合は、その補正用領域を「高信頼度補正用領域」であると判定する。一方、「補正用領域内の画素値の平均値」が第1領域信頼度判定用閾値未満である場合は、その補正用領域を「低信頼度補正用領域」であると判定する。
同様に、「補正用領域内の画素値の標準偏差」に対して第2領域信頼度判定用閾値を、「補正用領域内の有効画素率」に対して第3領域信頼度判定用閾値を、「補正用領域内の明るさについての信頼度」に対して第4領域信頼度判定用閾値を、「補正用領域内に含まれる脂肪の程度による信頼度」に対して第5領域信頼度判定用閾値を、それぞれ設定し、判定結果を出力する。
領域信頼度判定部640は、各補正用領域についての、高信頼度補正用領域であるか、低信頼度補正用領域であるかの判定結果を用いて、さらに、白色光相当画像、第1青色光画像及び第3照明光画像における信頼度の判定を行う。この場合、白色光相当画像、第1青色光画像及び第3照明光画像におけるすべての補正用領域のうち、「低信頼度補正用領域」と判定された補正用領域の数に応じて、画像判定結果を出力する。画像判定結果は、例えば、第1画像判定結果出力用閾値を予め設定することにより、出力される。
例えば、第1画像判定結果出力用閾値を「10個」とする場合であって、白色光相当画像の補正用領域を16個とする場合、白色光相当画像の低信頼度補正用領域が10個以上であれば、補正用領域全体として信頼度が高い、すなわち、外乱の影響が少なく、補正処理を適切に行えるとする画像判定結果を出力する。一方、白色光相当画像の低信頼度補正用領域が10個未満であれば、補正用領域全体として信頼度が低い、すなわち、何らかの外乱の影響があり、補正処理を適切に行えないとする画像判定結果を出力する。
なお、領域信頼度の算出及び画像判定結果の出力は、すべての白色光相当画像、第1青色光画像及び第3照明光画像に対して行ってもよく、一部の白色光相当画像、第1青色光画像及び第3照明光画像に対して行ってもよい。計算処理を早く行うためである。
領域信頼度判定部640が出力する画像判定結果は、拡張表示制御部200に送信される。拡張表示制御部200は、画像判定結果に応じて、ディスプレイにおける表示態様を変更することが好ましい。例えば、「補正用領域全体として信頼度が高い」画像判定結果が出力された場合、拡張表示制御部200は、補正処理が適切に行えることを示すメッセージをディスプレイに表示する(図41参照)。一方、「補正用領域全体として信頼度が低い」画像判定結果が出力された場合、「補正処理のため内視鏡を操作してください」のようなメッセージを、警告表示としてディスプレイに表示する(図42参照)。なお、このようなメッセージは、ディスプレイに表示される白色光相当画像に重畳表示されてもよい。
また、領域信頼度判定部640は、白色光相当画像、第1青色光画像及び第3照明光画像における各補正用領域を用いて、画像判定用平均信頼度を算出してもよい。画像判定用平均信頼度は、例えば、白色光相当画像のすべての補正用領域の信頼度の総和を、補正用領域の数で除算することで算出する。この場合、領域信頼度判定部640は、画像判定用平均信頼度に対して第2画像判定結果出力用閾値を予め設定し、画像判定用平均信頼度が第2画像判定結果出力用閾値以上であれば、「補正用領域全体として信頼度が高い」と画像判定結果を出力する。一方、画像判定用平均信頼度が第2画像判定結果出力用閾値未満であれば、「補正用領域全体として信頼度が低い」と画像判定結果を出力する。この場合においても、拡張表示制御部200は、画像判定結果に応じて、ディスプレイにおける表示態様を変更することが好ましい。
以下、第4実施形態において、内視鏡12の動きの程度を判定し、報知を行う方法について説明する。この場合、領域信頼度判定部640が出力する、白色光相当画像、第1青色光画像及び第3照明光画像における各補正用領域についての、高信頼度補正用領域であるか、低信頼度補正用領域であるかの判定結果を、第2色素値算出部650に送信する(図101参照)。
第2色素値算出部650は、白色光相当画像、第1青色光画像及び第3照明光画像における各補正用領域のうち、「低信頼度補正用領域」と判定された補正用領域を、第2色素値の算出から除外する、除外処理を行うことが好ましい。
また、第2色素値算出部650は、除外処理を行う画像を、白色光相当画像、第1青色光画像及び第3照明光画像の一部とすることが好ましい。具体的には、例えば、図104に示すように、第4実施形態の補正モードにおける発光パターンにおいて(図96参照)、第4照明光L4又は第3照明光L3が発光される各フレーム651a、651b、651c、651d、651e、651fのうち、フレーム651bにおいて出力される画像信号に基づいて生成される白色光相当画像652a及び第1青色光画像652b、フレーム651cにおいて出力される画像信号に基づいて生成される第3照明光画像652c、フレーム651dにおいて出力される画像信号に基づいて生成される第3照明光画像653c、並びにフレーム651eにおいて出力される画像信号に基づいて生成される白色光相当画像653a及び第1青色光画像653bである。
このうち、白色光相当画像652a、第1青色光画像652b及び第3照明光画像652cを第1画像セット652dと呼ぶ。また、白色光相当画像653a、第1青色光画像653b及び第3照明光画像653cを、第2画像セット653dと呼ぶ。第2色素値算出部650は、第1画像セット652dに含まれる画像及び第2画像セット653dに含まれる画像に対し、除外処理を行うことが好ましい。以降、除外処理の対象とされない、「高信頼度補正用領域」と判定された補正用領域を、有効領域と呼ぶ。一方、除外処理の対象となる、「低信頼度補正用領域」と判定された補正用領域を、除外領域と呼ぶ。
第2色素値算出部650は、第1画像セット652dに含まれる各有効領域の位置と、各除外領域の位置とは、白色光相当画像652a、第1青色光画像652b及び第3照明光画像652cの間で対応するように除外処理を行う。
具体的には、例えば、図105に示すように、白色光相当画像652aの除外領域を補正用領域654d、654hとし、全体の補正用領域654のうち、補正用領域654d、654h以外の補正用領域を有効領域とする。同様に、第1青色光画像652bの除外領域を補正用領域655d、655hとし、全体の補正用領域655のうち、補正用領域655d、655h以外の補正用領域を有効領域とする。また、第3照明光画像652cの除外領域を補正用領域656d、656hとし、全体の補正用領域656のうち、補正用領域656d、656h以外の補正用領域を有効領域とする。このような除外処理を行うことで、第1画像セット652dに含まれる画像間で、有効領域の位置を対応させることができる。
除外処理の方法について説明する。第2色素値算出部650は、予め設定された除外処理用閾値を用い、各画像セットに対する除外処理を行う。除外処理用閾値は、各補正用領域の領域信頼度を「1」から「5」までの5段階で評価して算出できるように、複数の値として設定される。なお、除外処理用閾値は、領域信頼度の種類に応じて設定することが好ましい。
第2色素値算出部650は、まず、画像セットに含まれる白色光相当画像、第1青色光画像、第3照明光画像の各補正用領域について、5段階の領域判定用信頼度を算出する。次に、画像セットに含まれる白色光相当画像、第1青色光画像、第3照明光画像の、対応する各補正用領域のうち、最小の領域判定用信頼度を有する補正用領域を選択する。
次に、最小の領域判定用信頼度を有する補正用領域に、「高信頼度補正用領域」又は「低信頼度補正用領域」と判定するための領域信頼度判定用閾値を適用し、「低信頼度補正用領域」と判定された補正用領域を、除外領域とする。この場合、「低信頼度補正用領域」と判定された補正用領域と対応する、白色光相当画像、第1青色光画像及び第3照明光画像のすべての補正用領域を、除外領域とする。
第2色素値算出部650は、第1画像セット652d及び第2画像セット653dから、それぞれ第2色素値を算出する。以下、第2色素値の算出について、具体的に説明する。第1画像セット652dの第2色素値を算出する場合、白色光相当画像652a、第1青色光画像652b及び第3照明光画像652cにおいて、互いに対応する位置にある各有効領域における信号値に基づき、X成分の値として領域平均信号比ln(R2/G2)、Y成分の値として領域平均信号比ln(B1/G2)、Z成分の値として領域平均信号比ln(B3/G3)を、有効領域ごとに算出する。
領域平均信号比ln(R2/G2)は、白色光相当画像652aの、各有効領域内のR2画像信号の平均値と、各有効領域内のG2画像信号の平均値(すなわち、白色光相当画像のRチャンネルの各有効領域内の画素値の平均と、Gチャンネルの各有効領域内の画素値の平均)とを用いて算出される。
領域平均信号比ln(B1/G2)は、第1青色光画像652bの各有効領域内のB1画像信号の平均値(すなわち、第1青色光画像の各有効領域内の画素値の平均)と、白色光相当画像652aの各有効領域内のG2画像信号の平均値とを用いて算出される。
領域平均信号比ln(B3/G3)は、第3照明光画像652cの、各有効領域内のB3画像信号の平均値と、各有効領域内のG3画像信号の平均値(すなわち、第3照明光画像のBチャンネルの各有効領域内の画素値の平均と、Gチャンネルの各有効領域内の画素値の平均)とを用いて算出される。
第2色素値算出部650は、第1画像セット652dの対応する各有効領域について算出した、領域平均信号比ln(R2/G2)、領域平均信号比ln(B1/G2)及び領域平均信号比ln(B3/G3)を、補正酸素飽和度算出用テーブル120を参照することによって算出する(図29(A)参照)。補正酸素飽和度算出用テーブル120には、信号比ln(R2/G2)をX軸、信号比ln(B1/G2)をY軸、信号比ln(B3/G3)をZ軸とする3次元座標系に、黄色色素の濃度に応じて曲面CV0~CV4が分布する。
第2色素値算出部650は、3次元座標系である補正酸素飽和度算出用テーブル120を参照し、曲面CV0~CV4のうち、座標(X4,Y4,Z4)=(領域平均信号比ln(R2/G2),領域平均信号比ln(B1/G2),領域平均信号比ln(B3/G3))が、重なる、又は距離が最も近くなる曲面によって、第2色素値を算出する。曲面CV0~CV4は、それぞれ第2色素値が「0」~「4」であることを示している。例えば、座標(X4,Y4,Z4)が、曲面CV2と重なる場合は、第2色素値を「2」と算出する。第2色素値算出部650は、第2色素値を第1画像セット652dの有効領域ごとに算出する。同様にして、第2画像セット653dの第2色素値も、有効領域ごとに算出する。
第1画像セット652dの有効領域ごとに算出された第2色素値と、第2画像セット653dの有効領域ごとに算出された第2色素値とは、補正判定部170の第2色素値判定部660に送信される。また、第1画像セット652dの有効領域ごとに算出されたX成分の値、Y成分の値及びZ成分の値と、第2画像セット653dの有効領域ごとに算出されたX成分の値、Y成分の値及びZ成分の値とを第2色素値判定部660に送信することが好ましい。
第2色素値判定部660は、図106において説明するように、第1画像セット652dの有効領域ごとに算出された第2色素値661と、第2画像セット653dの有効領域ごとに算出された第2色素値662との相関係数663を求める。図106では、説明のため、有効領域ごとに算出された第2色素値661、662を、縦軸を第2色素値、横軸を有効領域に割り当てられた補正用領域の番号(すなわち、第N補正用領域の「N」の番号)を示している。
第2色素値判定部660は、相関係数が、予め設定されている動き判定用閾値より小さい場合、「内視鏡の動きの程度が大きい」と判定される。一方、相関係数が、動き判定用閾値より大きい場合、「内視鏡の動きの程度が小さい」と判定する。この場合、第2色素値判定部660は、「内視鏡の動きの程度が大きい」又は「内視鏡の動きの程度が小さい」の判定結果を、動き判定結果として出力し、拡張表示制御部200に送信する。
拡張表示制御部200は、動き判定結果に応じて、ディスプレイにおける表示態様を変更することが好ましい。例えば、「内視鏡の動きの程度が小さい」動き判定結果が出力された場合、拡張表示制御部200は、補正処理が適切に行えることを示すメッセージをディスプレイに表示する(図41参照)。一方、「内視鏡の動きの程度が大きい」動き判定結果が出力された場合、図107に示すような、「補正処理のため内視鏡を静止させてください」のようなメッセージMS4を、警告表示としてディスプレイに表示する。なお、このようなメッセージは、白色光相当画像201に重畳表示してもよい。
手動入力によって発光切替え指示を入力し、照明光を切り替える場合は、切替え中に内視鏡12の動きが大きくなる場合がある。このような場合は、特定色素の濃度の影響に応じた補正処理を適切に行うことができない可能性がある。そこで、内視鏡12の動きの程度を判定し、動きの程度が大きい場合にはユーザーに報知を行うことで、ユーザーが内視鏡12を動かさないように促すことができる。結果として、内視鏡12の動きの程度を小さくした場合は、補正処理を適切に行うことができる。
上記のように、外乱の影響の程度を判定した画像判定結果及び/又は内視鏡12の動きの程度を判定した動き判定結果を報知することで、補正処理を適切に行うための操作を、ユーザーに促すことができる。補正処理において、第1色素値に応じたテーブル補正処理を行うために、第1画像セット及び第2画像セットを用いて算出された、補正用領域ごとの第2色素値に基づき、ロバスト推定法によって第1色素値を求め、第1色素値に対応する領域AR0~4である酸素飽和度算出用テーブルを選択することが好ましい。また、「内視鏡の動きの程度が小さい」動き判定結果が出力された場合であって、「補正用領域全体として信頼度が高い」の画像判定結果が出力された場合に、「高信頼度補正用領域」と判定された補正用領域における領域平均信号比を用い、第1色素値を求めることにより、補正処理を行ってもよい。
上記実施形態において、画像取得部60、内視鏡画像生成部70、表示制御部80、画像通信部90、酸素飽和度画像生成部130、補正酸素飽和度算出部140、テーブル補正部141、拡張中央制御部150、信頼度算出部160、補正判定部170、拡張表示制御部200、関心領域設定部210、領域指標値算出部250、指標値表示表生成部260、表示用画像生成部270及び指標値リンクライン生成部290といった各種の処理を実行する処理部(processing unit)のハードウェア的な構造は、次に示すような各種のプロセッサ(processor)である。各種のプロセッサには、ソフトウエア(プログラム)を実行して各種の処理部として機能する汎用的なプロセッサであるCPU(Central Processing Unit)、FPGAなどの製造後に回路構成を変更可能なプロセッサであるプログラマブルロジックデバイス(Programmable Logic Device:PLD)、各種の処理を実行するために専用に設計された回路構成を有するプロセッサである専用電気回路などが含まれる。
1つの処理部は、これら各種のプロセッサのうちの1つで構成されてもよいし、同種または異種の2つ以上のプロセッサの組み合せ(例えば、複数のFPGAや、CPUとFPGAの組み合わせ)で構成されてもよい。また、複数の処理部を1つのプロセッサで構成してもよい。複数の処理部を1つのプロセッサで構成する例としては、第1に、クライアントやサーバなどのコンピュータに代表されるように、1つ以上のCPUとソフトウエアの組み合わせで1つのプロセッサを構成し、このプロセッサが複数の処理部として機能する形態がある。第2に、システムオンチップ(System On Chip:SoC)などに代表されるように、複数の処理部を含むシステム全体の機能を1つのIC(Integrated Circuit)チップで実現するプロセッサを使用する形態がある。このように、各種の処理部は、ハードウェア的な構造として、上記各種のプロセッサを1つ以上用いて構成される。
さらに、これらの各種のプロセッサのハードウェア的な構造は、より具体的には、半導体素子などの回路素子を組み合わせた形態の電気回路(circuitry)である。また、記憶部のハードウェア的な構造はHDD(hard disc drive)やSSD(solid state drive)等の記憶装置である。
10 内視鏡システム
12 内視鏡
12a 挿入部
12b 操作部
12c モード切替え用スイッチ
12d 関心領域設定用スイッチ
13 光源装置
14 プロセッサ装置
15 第1ユーザーインターフェース
16 拡張プロセッサ装置
17 第2ユーザーインターフェース
20 光源部
20a V-LED
20b BS-LED
20c BL-LED
20d G-LED
20e R-LED
21 光源制御部
41 ライトガイド
42 照明光学系
42a 照明レンズ
43 撮像光学系
43a 対物レンズ
44、511、512、513、514、611、612 撮像センサ
45 撮像制御部
46 CDS/AGC回路
47 A/Dコンバータ
50 中央制御部
60 画像信号取得部
70 内視鏡画像生成部
80 表示制御部
81 白色光画像
82 報知用画像
90 画像通信部
100、103 ヘモグロビン反射スペクトル
101a、101b、101c、102a、102b 曲線
104 黄色色素の吸光スペクトル
110 酸素飽和度算出用テーブル
120 補正酸素飽和度算出用テーブル
121 3次元座標系
122、430 2次元座標系
130 酸素飽和度画像生成部
131 ベース画像生成部
132 演算値算出部
133 酸素飽和度算出部
134 色調調整部
140 補正酸素飽和度算出部
141 テーブル補正部
150 拡張中央制御部
160 信頼度算出部
161 補正用画像
162 特定領域
163、763 第1信頼度算出用テーブル
164 第2信頼度算出用テーブル
165、765 第3信頼度算出用テーブル
170 補正判定部
171a 低信頼度領域
171b 高信頼度領域
172 枠
200 拡張表示制御部
201、213、621、652a、653a 白色光相当画像
202 酸素飽和度画像
210 関心領域設定部
211、214、215 関心領域画像
212a、212b、212c 関心領域
212d 表示用関心領域
220a、220b、220c ロックオンエリア
220d 表示用ロックオンエリア
240 領域位置情報記憶部
250 領域指標値算出部
251a、251b、251c、282a、282b 領域指標値
252a 第1時点領域指標値
252b 第2時点領域指標値
252c 第3時点領域指標値
260 指標値表示表生成部
261、263、264、265 指標値表示表
262、266、267、268 折れ線スパークライン
269、269a、269b 拡張指標値表示表
270 表示用画像生成部
271、273、275 表示用画像
272a、272b、272c、274a、274b、274c、276a、276b、276c 領域位置情報
272d、278c 表示用領域位置情報
277、278a、278b 追加関心領域
280 領域指標値記憶部
281 視野外ロックオンエリア指標値
283、285a、285b 追加領域指標値
290 指標値リンクライン生成部
291a、291b、291c、292a、292b、292c 指標値リンクライン
350 組み合わせ指数算出用テーブル
351 生体指標値選択用画面
352 ラジオボタン
400 広帯域光源
410 回転フィルタ
411 内側フィルタ
411a、412a B1フィルタ
411b、412c Gフィルタ
411c、412d Rフィルタ
412 外側フィルタ
412b B2フィルタ
412e B3フィルタ
420 フィルタ切替え部
431a 基準線
431b 実測線
500、600 カメラヘッド
501、502、503、601 ダイクロイックミラー
620 特徴量算出部
622、654、654d、654h、655、655d、655h、656、656d、656h 補正用領域
622a 第1補正用領域
622p 第16補正用領域
630 領域信頼度算出部
640 領域信頼度判定部
650 第2色素値算出部
651a、651b、651c、651d、651e、651f フレーム
652b、653b 第1青色光画像
652c、653c 第3照明光画像
652d 第1画像セット
653d 第2画像セット
660 第2色素値判定部
661、662 第2色素値
663 相関係数
Ot 手術台
P 被検者
AC 腹腔
Tr トラカール
To 処置具
V 紫色光
BS 第2青色光
BL 第1青色光
DFX、DFY 定義線
G 緑色光
R 赤色光
Lc 白色光
L1 第1照明光
L2 第2照明光
L3 第3照明光
Pc 白色光照明期間
P1 第1照明期間
P2 第2照明期間
P3 第3照明期間
BF Bカラーフィルタ
GF Gカラーフィルタ
RF Rカラーフィルタ
EL、ELH、ELL、 等高線
MS0、MS1、MS2、MS3、MS4 メッセージ
CV0、CV1、CV2、CV3、CV4 曲面
AR0、AR1、AR2、AR3、AR4 領域
Claims (15)
- 被写体を撮影することにより、画像信号を生成する内視鏡と、
プロセッサを備え、
前記プロセッサは、
前記画像信号を取得し、
前記画像信号に基づいて内視鏡画像を生成し、
前記内視鏡画像のうち、互いに異なる位置に複数の関心領域を設定し、
前記内視鏡画像における複数の前記関心領域の位置を、領域位置情報としてそれぞれ記憶し、
前記関心領域における前記画像信号に基づき、前記被写体の状態を示す生体指標値を算出し、
それぞれの前記関心領域における前記生体指標値に基づき、前記生体指標値の統計値である領域指標値を前記関心領域ごとに算出し、
複数の前記領域指標値をまとめて表示する指標値表示表を生成し、
前記内視鏡画像、前記指標値表示表及び複数の前記領域位置情報を表示する表示用画像を生成し、
前記表示用画像を表示する制御を行う内視鏡システム。 - 前記生体指標値は、酸素飽和度及び/又はヘモグロビン指数である請求項1に記載の内視鏡システム。
- 前記指標値表示表は、複数の前記領域指標値をグラフ形式で表示する請求項2に記載の内視鏡システム。
- 前記プロセッサは、
前記領域位置情報と、前記領域指標値とを対応付けることにより、前記領域指標値を特定領域指標値として記憶し、
前記特定領域指標値を保持して前記指標値表示表に表示する請求項3に記載の内視鏡システム。 - 前記プロセッサは、
前記関心領域における最新の前記画像信号に基づいて前記生体指標値を算出し、
最新の前記生体指標値に基づいて前記領域指標値を前記関心領域ごとに算出し、
前記指標値表示表に表示される前記領域指標値を更新する請求項3に記載の内視鏡システム。 - 前記プロセッサは、
前記領域位置情報と、前記関心領域とを対応付けることにより、前記関心領域の前記内視鏡画像における位置をロックオンエリアとして記憶し、
前記ロックオンエリアにおける前記画像信号に基づき、前記生体指標値を算出する請求項4又は5に記載の内視鏡システム。 - 前記プロセッサは、
前記ロックオンエリアにおける前記画像信号に基づいて算出された前記領域指標値を、前記ロックオンエリアと対応付けることにより、特定ロックオンエリア指標値として記憶し、
前記表示用画像に、前記特定ロックオンエリア指標値を表示する制御を行う請求項6に記載の内視鏡システム。 - 前記ロックオンエリアの位置が、前記内視鏡画像に含まれない位置である視野外位置である場合、
前記プロセッサは、
前記ロックオンエリアの位置が前記視野外位置となる直前に記憶された前記特定ロックオンエリア指標値を、視野外ロックオンエリア指標値とし、かつ、前記視野外ロックオンエリア指標値を表示する前記指標値表示表を生成する請求項7に記載の内視鏡システム。 - 前記プロセッサは、
前記内視鏡画像において少なくとも1つ以上の前記ロックオンエリアを、追加関心領域として設定し、
前記追加関心領域における前記画像信号に基づき、前記生体指標値を算出し、
前記追加関心領域における前記生体指標値の統計値である追加領域指標値を、前記領域指標値として算出し、
前記追加領域指標値及び前記視野外ロックオンエリア指標値をまとめて表示する拡張指標値表示表を生成し、
前記表示用画像に、前記拡張指標値表示表を表示する制御を行う請求項8に記載の内視鏡システム。 - 前記プロセッサは、
複数の前記領域位置情報を前記内視鏡画像に重畳して表示する制御を行い、
前記内視鏡画像に重畳表示される前記領域位置情報と、前記拡張指標値表示表に表示され、かつ、前記領域位置情報と対応する、前記視野外ロックオンエリア指標値以外の前記領域指標値と、を結ぶ指標値リンクラインを前記表示用画像に表示する制御を行う請求項9に記載の内視鏡システム。 - 前記プロセッサは、
前記表示用画像に表示される、前記拡張指標値表示表の表示サイズを変更する制御を行う請求項10に記載の内視鏡システム。 - 前記プロセッサは、
複数の前記領域位置情報を前記内視鏡画像に重畳して表示する制御を行い、
前記内視鏡画像に重畳表示される前記領域位置情報と、前記指標値表示表に表示され、かつ、前記領域位置情報と対応する前記領域指標値と、を結ぶ指標値リンクラインを前記表示用画像に表示する制御を行う請求項7に記載の内視鏡システム。 - 前記プロセッサは、
前記内視鏡画像において少なくとも1つ以上の前記ロックオンエリアを、追加関心領域として設定し、
前記追加関心領域における前記画像信号に基づき、前記生体指標値を算出し、
前記追加関心領域における前記生体指標値の統計値である追加領域指標値を、前記領域指標値として算出し、
前記追加領域指標値を表示する前記指標値表示表を生成し、
前記表示用画像に、前記追加領域指標値を表示する前記指標値表示表を表示する制御を行う請求項7に記載の内視鏡システム。 - 関心領域設定用スイッチを備え、
前記プロセッサは、
前記関心領域設定用スイッチの押下に従って、複数の前記関心領域を設定し、
再度の前記関心領域設定用スイッチの押下に従って、設定された前記関心領域における前記領域指標値を算出する請求項1に記載の内視鏡システム。 - 内視鏡が被写体を撮影することにより、生成される画像信号を取得するステップと、
前記画像信号に基づいて内視鏡画像を生成するステップと、
前記内視鏡画像のうち、互いに異なる位置に複数の関心領域を設定するステップと、
前記内視鏡画像における複数の前記関心領域の位置を、領域位置情報としてそれぞれ記憶するステップと、
前記関心領域における前記画像信号に基づき、前記被写体の状態を示す生体指標値を算出するステップと、
それぞれの前記関心領域における前記生体指標値に基づき、前記生体指標値の統計値である領域指標値を前記関心領域ごとに算出するステップと、
複数の前記領域指標値をまとめて表示する指標値表示表を生成するステップと、
前記内視鏡画像、前記指標値表示表及び複数の前記領域位置情報を表示する表示用画像を生成するステップと、
前記表示用画像を表示する制御を行うステップと、を有する内視鏡システムの作動方法。
Applications Claiming Priority (2)
| Application Number | Priority Date | Filing Date | Title |
|---|---|---|---|
| JP2022129056 | 2022-08-12 | ||
| JP2022-129056 | 2022-08-12 |
Publications (1)
| Publication Number | Publication Date |
|---|---|
| WO2024034253A1 true WO2024034253A1 (ja) | 2024-02-15 |
Family
ID=89851329
Family Applications (1)
| Application Number | Title | Priority Date | Filing Date |
|---|---|---|---|
| PCT/JP2023/021964 WO2024034253A1 (ja) | 2022-08-12 | 2023-06-13 | 内視鏡システム及びその作動方法 |
Country Status (1)
| Country | Link |
|---|---|
| WO (1) | WO2024034253A1 (ja) |
Citations (8)
| Publication number | Priority date | Publication date | Assignee | Title |
|---|---|---|---|---|
| JP2012235926A (ja) * | 2011-05-12 | 2012-12-06 | Fujifilm Corp | 医療装置システム及び生体情報監視方法 |
| WO2012165505A1 (ja) * | 2011-06-02 | 2012-12-06 | オリンパス株式会社 | 蛍光観察装置 |
| WO2014073331A1 (ja) * | 2012-11-08 | 2014-05-15 | 富士フイルム株式会社 | 内視鏡システム |
| WO2017061256A1 (ja) * | 2015-10-07 | 2017-04-13 | 富士フイルム株式会社 | 内視鏡システム及び内視鏡システムの作動方法 |
| WO2017154292A1 (ja) * | 2016-03-07 | 2017-09-14 | 富士フイルム株式会社 | 内視鏡システム、プロセッサ装置、及び、内視鏡システムの作動方法 |
| WO2019012911A1 (ja) * | 2017-07-14 | 2019-01-17 | 富士フイルム株式会社 | 医療画像処理装置、内視鏡システム、診断支援装置、並びに医療業務支援装置 |
| WO2019065111A1 (ja) * | 2017-09-26 | 2019-04-04 | 富士フイルム株式会社 | 医療画像処理システム、内視鏡システム、診断支援装置、及び医療業務支援装置 |
| WO2019172231A1 (ja) * | 2018-03-06 | 2019-09-12 | 富士フイルム株式会社 | 医療画像処理システム及び内視鏡システム |
-
2023
- 2023-06-13 WO PCT/JP2023/021964 patent/WO2024034253A1/ja unknown
Patent Citations (8)
| Publication number | Priority date | Publication date | Assignee | Title |
|---|---|---|---|---|
| JP2012235926A (ja) * | 2011-05-12 | 2012-12-06 | Fujifilm Corp | 医療装置システム及び生体情報監視方法 |
| WO2012165505A1 (ja) * | 2011-06-02 | 2012-12-06 | オリンパス株式会社 | 蛍光観察装置 |
| WO2014073331A1 (ja) * | 2012-11-08 | 2014-05-15 | 富士フイルム株式会社 | 内視鏡システム |
| WO2017061256A1 (ja) * | 2015-10-07 | 2017-04-13 | 富士フイルム株式会社 | 内視鏡システム及び内視鏡システムの作動方法 |
| WO2017154292A1 (ja) * | 2016-03-07 | 2017-09-14 | 富士フイルム株式会社 | 内視鏡システム、プロセッサ装置、及び、内視鏡システムの作動方法 |
| WO2019012911A1 (ja) * | 2017-07-14 | 2019-01-17 | 富士フイルム株式会社 | 医療画像処理装置、内視鏡システム、診断支援装置、並びに医療業務支援装置 |
| WO2019065111A1 (ja) * | 2017-09-26 | 2019-04-04 | 富士フイルム株式会社 | 医療画像処理システム、内視鏡システム、診断支援装置、及び医療業務支援装置 |
| WO2019172231A1 (ja) * | 2018-03-06 | 2019-09-12 | 富士フイルム株式会社 | 医療画像処理システム及び内視鏡システム |
Similar Documents
| Publication | Publication Date | Title |
|---|---|---|
| US12082769B2 (en) | Endoscope system | |
| US20210177248A1 (en) | Endoscope system | |
| WO2018159083A1 (ja) | 内視鏡システム、プロセッサ装置、及び、内視鏡システムの作動方法 | |
| US11969148B2 (en) | Medical image processing device | |
| US10617339B2 (en) | Endoscope system | |
| JP6839773B2 (ja) | 内視鏡システム、内視鏡システムの作動方法及びプロセッサ | |
| JP7590607B2 (ja) | 内視鏡システム、プロセッサ装置、及び内視鏡システムの作動方法 | |
| US20240320877A1 (en) | Image processing apparatus | |
| US20230237659A1 (en) | Image processing apparatus, endoscope system, operation method of image processing apparatus, and non-transitory computer readable medium | |
| CN113905653B (zh) | 内窥镜系统、内窥镜系统的工作方法、图像处理装置及计算机可读介质 | |
| WO2024034253A1 (ja) | 内視鏡システム及びその作動方法 | |
| US20220375117A1 (en) | Medical image processing device, endoscope system, and medical image processing device operation method | |
| US20230101620A1 (en) | Medical image processing apparatus, endoscope system, method of operating medical image processing apparatus, and non-transitory computer readable medium | |
| US11998165B2 (en) | Image processing device and method of operating same | |
| US20240335092A1 (en) | Endoscope system and method for operating the same | |
| US20240108198A1 (en) | Medical image processing device, endoscope system, and operation method of medical image processing device | |
| WO2023132138A1 (ja) | プロセッサ装置及びその作動方法並びに内視鏡システム | |
| WO2022059233A1 (ja) | 画像処理装置、内視鏡システム、画像処理装置の作動方法、及び画像処理装置用プログラム | |
| WO2023132188A1 (ja) | 内視鏡システム及びその作動方法 | |
| JP2024052487A (ja) | プロセッサ装置及び内視鏡システム並びにその作動方法 | |
| CN115500766A (zh) | 医疗图像处理装置及其工作方法以及内窥镜系统 |
Legal Events
| Date | Code | Title | Description |
|---|---|---|---|
| 121 | Ep: the epo has been informed by wipo that ep was designated in this application |
Ref document number: 23852237 Country of ref document: EP Kind code of ref document: A1 |