WO2024023979A1 - Procédé d'analyse et dispositif d'électrophorèse capillaire - Google Patents
Procédé d'analyse et dispositif d'électrophorèse capillaire Download PDFInfo
- Publication number
- WO2024023979A1 WO2024023979A1 PCT/JP2022/028984 JP2022028984W WO2024023979A1 WO 2024023979 A1 WO2024023979 A1 WO 2024023979A1 JP 2022028984 W JP2022028984 W JP 2022028984W WO 2024023979 A1 WO2024023979 A1 WO 2024023979A1
- Authority
- WO
- WIPO (PCT)
- Prior art keywords
- analysis
- sample
- capillary
- signal
- electrophoresis
- Prior art date
Links
- 238000004458 analytical method Methods 0.000 title claims abstract description 174
- 238000005251 capillar electrophoresis Methods 0.000 title claims description 28
- 238000001962 electrophoresis Methods 0.000 claims abstract description 68
- 238000002347 injection Methods 0.000 claims abstract description 53
- 239000007924 injection Substances 0.000 claims abstract description 53
- 230000005856 abnormality Effects 0.000 claims abstract description 36
- 230000005012 migration Effects 0.000 claims abstract description 23
- 238000013508 migration Methods 0.000 claims abstract description 23
- 238000000034 method Methods 0.000 claims abstract description 20
- 238000002360 preparation method Methods 0.000 claims abstract description 15
- 230000002159 abnormal effect Effects 0.000 claims description 31
- 238000001514 detection method Methods 0.000 claims description 30
- 230000008569 process Effects 0.000 claims description 17
- 229920006395 saturated elastomer Polymers 0.000 claims description 16
- 230000001678 irradiating effect Effects 0.000 claims 1
- 239000000523 sample Substances 0.000 description 109
- 238000003556 assay Methods 0.000 description 54
- 239000000872 buffer Substances 0.000 description 25
- 238000012950 reanalysis Methods 0.000 description 21
- 238000004140 cleaning Methods 0.000 description 12
- 239000007788 liquid Substances 0.000 description 12
- 239000002699 waste material Substances 0.000 description 8
- 239000007853 buffer solution Substances 0.000 description 7
- 230000007246 mechanism Effects 0.000 description 6
- 230000007547 defect Effects 0.000 description 4
- 238000010586 diagram Methods 0.000 description 3
- 239000012634 fragment Substances 0.000 description 3
- 239000000243 solution Substances 0.000 description 3
- 229920000642 polymer Polymers 0.000 description 2
- 238000012163 sequencing technique Methods 0.000 description 2
- 230000008859 change Effects 0.000 description 1
- 230000002950 deficient Effects 0.000 description 1
- 238000010790 dilution Methods 0.000 description 1
- 239000012895 dilution Substances 0.000 description 1
- 230000000694 effects Effects 0.000 description 1
- 238000005429 filling process Methods 0.000 description 1
- 238000009434 installation Methods 0.000 description 1
- 238000012986 modification Methods 0.000 description 1
- 230000004048 modification Effects 0.000 description 1
- 239000012723 sample buffer Substances 0.000 description 1
- 238000005070 sampling Methods 0.000 description 1
- 238000000926 separation method Methods 0.000 description 1
- 238000007873 sieving Methods 0.000 description 1
Images


Classifications
-
- G—PHYSICS
- G01—MEASURING; TESTING
- G01N—INVESTIGATING OR ANALYSING MATERIALS BY DETERMINING THEIR CHEMICAL OR PHYSICAL PROPERTIES
- G01N27/00—Investigating or analysing materials by the use of electric, electrochemical, or magnetic means
- G01N27/26—Investigating or analysing materials by the use of electric, electrochemical, or magnetic means by investigating electrochemical variables; by using electrolysis or electrophoresis
- G01N27/416—Systems
- G01N27/447—Systems using electrophoresis
Definitions
- the present invention relates to a capillary electrophoresis device and an analysis method using the same.
- capillary electrophoresis devices in which a capillary is filled with a migration medium such as a polymer gel or a polymer solution have been widely used as electrophoresis devices.
- This capillary electrophoresis device is capable of automatic filling of the electrophoresis medium and automatic injection of samples, allowing for continuous analysis, and has been used to preset multiple electrophoresis runs and analyze large amounts of samples overnight. There is.
- a laser is irradiated onto the sample electrophoresing inside the capillary, and the signal at that time is detected by a detection unit such as a CCD camera.
- a detection unit such as a CCD camera.
- the concentration of the sample injected into the capillary is high, the detected signal will become high, and if it exceeds the count threshold of the CCD camera (for example, 65,535 counts), the signal will become saturated, making it impossible to distinguish the peak of the signal. become.
- the user re-prepares the sample, such as dilution, and adjusts the assay (information for setting analysis operating conditions and analysis conditions) based on experience.
- errors may occur in which the detection unit detects no signal or only detects a very low signal. Even when such an error occurs, users have conventionally dealt with it based on their experience, and the most commonly chosen countermeasure is to re-prepare the sample.
- errors such as no signal being detected may be caused not only by a sample defect but also by a sample injection defect. If the error is caused by poor sample injection, an appropriate signal can be detected if the sample is electrophoresed immediately before it deteriorates, thereby avoiding sample re-preparation, which is a huge burden on the user.
- Patent Document 1 discloses an electrophoresis apparatus that prompts the user to change sample concentration, sample injection parameters, etc. when the signal becomes off-scale (saturated) or when the signal-to-noise ratio is low. Furthermore, Patent Document 1 also discloses that when the signal-to-noise ratio is low, there is a possibility of sample injection failure, etc., and that adjustment of sample injection parameters is encouraged.
- Patent Document 1 also discloses that the device changes the sample injection parameters etc. when the signal becomes off-scale (saturated) or when the signal-to-noise ratio is low. It did not disclose how the changes would be made.
- sample injection defects, etc. are determined only by the signal-to-noise ratio, that is, only by the signal height. Electrophoresis will be performed again with the following injection parameters. However, if the signal-to-noise ratio is low for all data, the possibility of sample failure or forgetting to insert the sample is higher than the possibility of sample injection failure, so it is often not possible to solve the problem simply by performing electrophoresis again. As a result, unnecessary electrophoresis may be performed, resulting in wasted electrophoresis medium and time.
- An object of the present invention is to provide an analysis method that suppresses unnecessary re-electrophoresis and sample re-preparation.
- the present invention provides an analysis method for analyzing the characteristics of a sample by electrophoresing the sample using a capillary and a migration medium, the method comprising a reading step of reading analysis conditions; , a migration medium filling step of filling the capillary with the migration medium; a sample injection step of injecting the sample into the capillary filled with the migration medium in the migration medium filling step; An electrophoresis process in which the sample is electrophoresed in the electrophoresis medium and the analysis results obtained in the electrophoresis process are compared with other analysis results under the same analysis conditions to statistically determine whether or not there is an abnormality. and an analysis condition adjustment step to adjust the analysis conditions. If it is determined that there is an abnormality in the abnormality determination step, the process returns to the reading step after the analysis condition adjustment step.
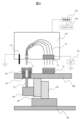
- FIG. 1 is a perspective view showing an outline of the configuration of a capillary electrophoresis device.
- FIG. 2 is a top view of the capillary electrophoresis device shown in FIG. 1.
- AA sectional view in FIG. 2. Flowchart showing the analysis method of Example 1.
- Flowchart showing the analysis method of Example 2. A graph showing an example of a signal waveform when it is saturated.
- a graph showing an image when estimating the peak of a signal A graph showing an example of a signal waveform in the case of sample injection failure.
- FIG. 3 is a diagram showing an example of a quality data (EQ) table when a sample injection failure occurs.
- FIG. 1 is a perspective view showing the outline of the configuration of a capillary electrophoresis device.
- the capillary electrophoresis device is divided into two units: a detection/incubator unit 150 at the top and an autosampler unit 160 at the bottom.
- the autosampler unit 160 has a Y-axis driver 85 mounted on the sampler base 80, and can drive in the Y-axis.
- a Z-axis driver 90 is mounted on the Y-axis driver 85 and can drive in the Z-axis.
- a sample tray 100 is mounted on the Z-axis driver 90, and a migration medium container 20, an anode buffer container 30, a cathode buffer container 40, and a sample container 50 are set on the sample tray 100 by the user. be done.
- the sample container 50 is set on an X-axis driver 95 mounted on the sample tray 100 and can be moved on the sample tray 100 in the X-axis.
- a liquid feeding mechanism 60 is also mounted on the Z-axis drive body 90. This liquid feeding mechanism 60 is arranged below the migration medium container 20.
- the detection/thermal oven unit 150 has a thermostatic oven unit 110 and a thermostatic oven door 120, and can maintain the inside of the thermostatic oven unit 110 at a constant temperature. Further, the detection/thermal oven unit 150 further includes a detection unit 130 behind the thermostatic oven unit 110, and can irradiate a laser and detect a signal at that time.
- the detection unit 130 uses a CCD camera or the like to detect a signal when the sample electrophoresing within the capillary array 10 is irradiated with a laser.
- the constant temperature bath unit 110 is also equipped with an electrode 115 for dropping to GND when applying a high voltage for electrophoresis.
- the capillary array 10 is fixed to the thermostatic chamber unit 110.
- the electrophoresis medium container 20, the anode buffer container 30, the cathode buffer container 40, and the sample container 50 can be driven in the Y-axis and the Z-axis by the autosampler unit 160, and only the sample container 50 can be driven in the X-axis as well. Can be driven.
- the autosampler unit 160 By driving the autosampler unit 160, the electrophoresis medium container 20, the anode buffer container 30, the cathode buffer container 40, and the sample container 50 are automatically connected to the fixed capillary array 10.
- FIG. 2 is a top view of the capillary electrophoresis device shown in FIG. 1.
- anode buffer container 30 set on the sample tray 100
- anode cleaning tank 31 an anode electrophoresis buffer tank 32
- a sample introduction buffer tank 33 an anode electrophoresis buffer tank 33
- cathode buffer container 40 set on the sample tray 100
- waste liquid tank 41 a cathode cleaning tank 42
- a cathode electrophoresis buffer tank 43 there are a waste liquid tank 41, a cathode cleaning tank 42, and a cathode electrophoresis buffer tank 43.
- the electrophoresis medium container 20, the anode buffer container 30, the cathode buffer container 40, and the sample container 50 are arranged on the sample tray 100 in a positional relationship as shown in FIG.
- the combinations of anode side and cathode side connected to the capillary array 10 are "phoresis medium container 20 - waste liquid tank 41", “anode side cleaning tank 31 - cathode side cleaning tank 42", and “anode side electrophoresis buffer solution tank 32 - cathode side electrophoresis buffer tank 43'', and "sample introduction buffer tank 33 - sample container 50".
- FIG. 3 is a sectional view taken along the line AA in FIG. 2, and shows a cross section of the capillary electrophoresis device when the combination of anode side and cathode side connected to the capillary array 10 is "phoresis medium container 20 - waste liquid tank 41". It shows.
- the electrophoresis medium container 20 is inserted and set into the guide 101 embedded in the sample tray 100.
- the liquid feeding mechanism 60 is arranged such that the plunger 61 built into the liquid feeding mechanism 60 is located below the electrophoretic medium container 20 .
- the right side of the capillary array 10 in FIG. 3 is the cathode side
- the left side is the anode side.
- the capillary electrophoresis device is controlled by a control section.
- the control unit includes a control board 122 and a computer 123 connected to the control board 122.
- FIG. 1 shows an example in which the control board 122 is installed on the back side of the thermostatic oven unit 110 and the computer 123 is installed on the outside (front side) of the thermostatic oven door 120, the installation location is not limited to this.
- the control board 122 controls the operations of the high voltage power supply 121, the constant temperature oven unit 110, the detection unit 130, etc. according to instructions from the computer 123.
- the computer 123 calculates analysis results based on signals etc.
- the detection unit 130 detects whether the analysis result has been performed by the control board 122.
- an input section for inputting capillary electrophoresis device settings (including assays described below), etc., and an input section for inputting analysis results etc. It also has an output section (display section) for displaying information. Note that the calculation of the analysis result may be performed by the control board 122.
- FIG. 4 is a flowchart showing the analysis method of Example 1.
- An assay is information that defines the operating and analysis conditions for an analysis.
- the operating conditions include the power of the laser of the detection unit 130, the temperature of the constant temperature chamber unit 110, the type of migration medium, the voltage and time applied in the pre-run described below, the voltage and time applied in the sample injection process described later, and the electrophoresis. These include the voltage and time applied during the process, the laser irradiation time and sampling period during data acquisition, etc.
- Analysis conditions include the analysis width specified by the data point or base size, the signal height threshold, the base call mobility file set for reading the sequence in the case of sequencing analysis, and the analysis width specified in the case of fragment analysis. such as the fragment size used.
- the user sets a function (reanalysis function) that performs reanalysis when the analysis result is determined to be abnormal (reanalysis function).
- the control unit determines whether the reanalysis function is valid (step S201), and if it is not valid, executes steps S102 to S110. On the other hand, if the reanalysis function is enabled in step S201, the control unit executes steps S202 to S212. Since steps S102 to S110 are the same as steps S202 to S210, only steps S202 to S210 will be described below.
- a series of analyzes is performed.
- one analysis is defined as the period from sample injection until one electrophoresis is performed by voltage application. That is, the user can preset not only one analysis but also a series of multiple analyses.
- three analyzes of analysis A, analysis B, and analysis C are set in advance, but the number of analyzes is not limited to this.
- control unit executes a step of reading the assay set in step S200 (assay reading step) (step S203).
- control unit controls the constant temperature bath unit 110 to execute a step of keeping the capillary array 10 at a constant temperature (capillary temperature adjustment step) (step S204).
- control section starts the laser of the detection unit 130 (step S205).
- control unit controls the autosampler unit 160 and the plunger 61 to execute a step of filling the capillary array 10 with the electrophoresis medium contained in the electrophoresis medium container 20 (a step of filling the electrophoresis medium). S206).
- the electrophoresis medium filling step will be explained in more detail.
- the autosampler unit 160 is moved, and the anode-cathode combination connected to the capillary array 10 becomes "migration medium container 20-waste tank 41.”
- the capillary head 11, which is the anode end of the capillary array 10 is inserted into the migration medium container 20, and the load header 12, which is the cathode end of the capillary array 10, is inserted into the waste liquid tank 41.
- the plunger 61 built into the liquid feeding mechanism 60 moves upward, and the electrophoretic medium contained in the electrophoretic medium container 20 is fed into the capillary array 10 through the capillary head 11.
- the capillary array 10 has already been filled with electrophoretic medium before the liquid is sent, or if the electrophoretic medium has been sufficiently fed into the capillary array 10 and there is a surplus, the electrophoretic medium is transferred from the load header 12 to the waste liquid tank 41. The running medium is drained.
- the control unit executes a pre-run (step S207). Specifically, first, the autosampler unit 160 is moved, and the combination of the anode side and the cathode side connected to the capillary array 10 is "anode side electrophoresis buffer tank 32 - cathode side electrophoresis buffer tank 43". ”. Next, the capillary head 11 is inserted into the anode-side electrophoresis buffer tank 32, and the load header 12 is inserted into the cathode-side electrophoresis buffer tank 43. In this state, the high voltage power supply 121 applies a high voltage to the capillary array 10. Pre-run is an operation similar to electrophoresis after sample injection, which will be described later, but is performed before sample injection, thereby serving to stabilize the performance of electrophoresis.
- the control unit executes a step (sample injection step) of injecting the sample set in the sample container 50 into the capillary array 10 (step S208). Specifically, first, the autosampler unit 160 moves, and the combination of the anode side and the cathode side connected to the capillary array 10 becomes "sample introduction buffer tank 33-sample container 50." Next, the capillary head 11 is inserted into the sample introduction buffer tank 33, and the load header 12 is inserted into the sample container 50. In this state, the high voltage power supply 121 applies a high voltage to the capillary array 10. As a result, a negatively charged sample is injected from the load header 12 into the capillary array 10.
- a cleaning process for cleaning the capillary head 11 and the load header 12, which are both ends of the capillary array 10 may be performed before and after the electrophoresis medium filling process and the sample injection process.
- the autosampler unit 160 moves, and the combination of anode side and cathode side connected to the capillary array 10 becomes "anode side cleaning tank 31 - cathode side cleaning tank 42".
- the capillary head 11 is inserted into the anode side cleaning tank 31 and the load header 12 is inserted into the cathode side cleaning tank 42.
- the control unit executes a step (electrophoresis step) of applying a voltage to the capillary array 10 into which the sample has been injected to cause the sample to undergo electrophoresis (step S209).
- the autosampler unit 160 is moved, and the combination of the anode side and the cathode side connected to the capillary array 10 is "anode side electrophoresis buffer tank 32 - cathode side electrophoresis buffer tank 43". ”.
- the capillary head 11 is inserted into the anode-side electrophoresis buffer tank 32, and the load header 12 is inserted into the cathode-side electrophoresis buffer tank 43.
- the high voltage power supply 121 applies a high voltage to the capillary array 10.
- a high voltage is applied to the capillary array 10 on the cathode side, and the voltage is applied to GND at the electrode 115 via the buffer solution container 40 on the cathode side and the buffer solution container 30 on the anode side, thereby performing electrophoresis.
- samples flowing in the capillary array 10 in order of size due to the molecular sieving effect of the electrophoresis medium are detected by the detection unit 130.
- the voltage application by the high voltage power supply 121 and the signal detection by the detection unit 130 are continued until the predetermined time defined in the assay set in step S200.
- step S209 When electrophoresis is performed for a predetermined time in step S209, analysis A, which is the first analysis, is completed, and analysis B, which is the second analysis, is started. In this analysis B, as in the previous analysis A, steps S203 to S209 are executed. When analysis B is completed, analysis C, which is the third analysis, is started. In analysis C as well, steps S203 to S209 are executed similarly to analysis A and analysis B.
- step S210 When a series of analyzes consisting of analysis A, analysis B, and analysis C are all completed, the control unit calculates all analysis results (step S210). Note that if the reanalysis function is not valid in step S201, the analysis ends when all analysis results are calculated (step S213).
- step S201 the control unit can display the analysis results of the series of calculations and the analysis results of past analyzes performed under the same conditions (assays). Based on the analysis results and the like, a step of statistically determining whether an abnormal analysis result is included (an abnormality determination step) is executed (step S211). For example, if the analysis result of Analysis B is a significantly smaller value than the analysis results of other Analysis A or Analysis C, the analysis result of Analysis B is determined to be statistically abnormal. Note that a significantly small value among the plurality of analysis results may be determined using an outlier value obtained by, for example, the Smirnov-Grubbs test.
- the analysis results used for the determination in step S211 include not only signal height data detected by the detection unit 130 but also quality data.
- quality data is EQ, etc., which indicates the maximum base length within the range in which single base separation is possible, and in sequencing analysis, a window of 20 bp of the decoded sequence is slid from the short base side to the long base side.
- QV20CRL, etc. which exhibits the maximum continuous base length with an average QV value (reliability of base call) in the window of over 99%.
- step S211 If it is determined in step S211 that a statistically abnormal analysis result is included, the control unit executes a step (first assay adjustment step) of creating a new assay for the target analysis (step S212). ). Note that creating a new assay also means adjusting the initially set assay.
- control unit returns to step S202 and starts re-analysis for the analysis for which the analysis result was abnormal.
- the control unit operates the high voltage power supply 121 etc. based on the adjusted assay of analysis B, injects the sample corresponding to analysis B into the capillary array 10, and performs analysis. Reanalysis is performed only for B.
- the analysis result is calculated again in step S210, and it is determined in step S211 whether or not it is statistically abnormal. If no abnormality is determined in step S211, the analysis ends (step S213).
- the capillary electrophoresis device adjusts the assay by itself and performs the reanalysis. Therefore, even if a sample injection failure occurs, an appropriate signal can be detected by immediately performing electrophoresis before the sample deteriorates. Therefore, sample re-preparation, which imposes a heavy burden on the user, can be avoided.
- Example 1 when there was a statistically abnormal analysis result in the abnormality determination step, the first assay adjustment step was executed, but in Example 2, when there was a statistically abnormal analysis result in the abnormality determination step, the first assay adjustment step was performed. Even if there is, do not perform the first assay adjustment step and re-analyze the same assay. Further, in Example 2, unlike Example 1, signal saturation is determined based on signal height data detected by the detection unit 130, and if the signal is saturated, the second assay adjustment step is executed. , re-analyze with a new assay. Furthermore, in Example 1, sample injection failure was determined only in the abnormality determination process, but in Example 2, in addition to the abnormality determination process, a process of comparing signal height data with a threshold value (signal height determination process) was also performed. to determine sample injection failure.
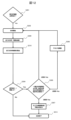
- FIG. 5 is a flowchart showing the analysis method of Example 2.
- the user sets the assay to be used in a series of analyzes using the input unit (step S200).
- the control unit determines whether or not the reanalysis function is valid (step S201), and if it is not valid, when the analysis is started (step S102), all steps S103 to S109 in FIG. 4 of the first embodiment are performed. (Step S100). On the other hand, if the reanalysis function is enabled in step S201, the control unit executes steps S202 to S209 in FIG. 4 of Example 1 for all analyzes when analysis is started (step S202). Step S300). When all series of analyzes are completed, the control unit calculates all analysis results (step S210). Note that if the reanalysis function is not valid in step S201, the analysis ends when all analysis results are calculated (step S213).
- step S301 the control unit executes a step of determining whether the signal is saturated.
- signal saturation determination step signal height data detected by the detection unit 130 in the electrophoresis step is used.
- FIG. 6 is a graph showing an example of a signal waveform in the case of saturation
- FIG. 7 is an enlarged graph of the dotted line portion in FIG. 6.
- the units of the horizontal axis are the number of data points of the CCD camera
- the units of the vertical axis are RFU regarding signal height (signal intensity).
- signal height signal intensity
- step S301 if it is determined in step S301 that the signal is saturated, the control unit executes a step of estimating the apex of the signal waveform (signal apex estimation step) (step S302). At this time, the control unit approximates the peak by fitting a Gaussian function, a Lorentz function, etc. from the tail of the signal-saturated waveform and the waveform before and after the peak.
- FIG. 8 is a graph showing an image when estimating the peak of a signal. As shown by the dotted line in FIG. 8, by approximating the vertices, the signal height that was not visible due to saturation can be estimated.
- control unit executes a step (second assay adjustment step) of adjusting the assay to one that does not saturate the signal, based on the peak of the saturation signal estimated in step S302 (step S303).
- the second assay adjustment step will be explained using a specific example. It is assumed that the signal is saturated when the original sample injection voltage from the assay before adjustment is 1.6 kV. Further, it is assumed that the signal strength of the vertex estimated by fitting using a Gaussian function in step S302 is 50,000 RFU. Assume that the user has set a target value of 20,000 RFU as a signal height that does not saturate. In addition, when the detection unit 130 is a CCD camera, the signal height that does not saturate should be about half or less of the count threshold (for example, about 30,000 or less when the count threshold is 65,535 counts), and within this range. If so, the user can arbitrarily set it as a target value.
- the control unit calculates an adjustment coefficient of 0.4 by dividing 20,000RFU by 50,000RFU. Furthermore, the control unit multiplies the original sample injection voltage by this adjustment coefficient, that is, by 0.4 ⁇ 1.6 kV, to obtain 0.64 kV as a new sample injection voltage after adjustment. As a result, the control unit creates a new assay with the sample injection voltage changed to 0.64 kV.
- the assay was adjusted by changing the sample injection voltage, but in addition to the sample injection voltage, the assay could also be performed by changing analysis conditions such as sample injection time (voltage application time), laser irradiation time, and laser power. may be adjusted. In either case, the controller adjusts the assay by multiplying the parameter values of the original analysis conditions by the same adjustment factor.
- step S202 the process returns to step S202, and the control unit performs reanalysis based on the adjusted assay.
- the peak is automatically estimated and reanalysis is performed based on a new assay, so there is no need to repeat electrophoresis. It is possible to obtain data that avoids signal saturation. As a result, it becomes possible to prevent waste of migration medium and time.
- step S301 determines whether the signal height is less than a predetermined threshold. If the signal height is less than the threshold, sample injection failure may have occurred.
- FIG. 9 is a graph showing an example of a signal waveform in the case of sample injection failure.
- the unit of the horizontal axis is the number of data points, and the unit of the vertical axis is RFU.
- the threshold value used in the signal height determination step is set to, for example, 100 RFU in consideration of noise. Note that instead of threshold determination based on signal height, threshold determination may be performed based on signal-to-noise ratio.
- step S304 If it is determined in step S304 that the signal height is less than the threshold, the control unit performs a step (abnormality determination) of statistically determining whether or not an abnormal analysis result is included based on a series of analysis results. step) is executed (step S305).
- FIG. 10 is a diagram showing an example of a plot of quality data (EQ) when a sample injection failure occurs
- FIG. 11 shows an example of a quality data (EQ) table when a sample injection failure occurs. It is a diagram.
- FIG. 11 shows data obtained by repeating analysis 24 times using a capillary array 10 with four load headers 12.
- the four load headers 12 are represented as CH1, CH2, CH3, and CH4.
- FIG. 10 using the same data as in FIG. 11, all data is plotted uniformly regardless of the four load headers 12. While most of the data from Analysis-1 to Analysis-24 has an EQ of about 450 to 535, there are some data where the EQ is 0.
- 0 is an example of an outlier
- the data for CH4 in analysis-2, CH2 in analysis-9, and CH3 in analysis-22 are significantly smaller values compared to other data in the series, so it may be due to sample injection failure. Statistically determined to be highly likely. Note that the Smirnov-Grubbs test may be used to determine outliers.
- error determination accuracy is increased by comparing individual data with other data to determine whether it is statistically abnormal, rather than comparing it with a single threshold. For example, if the signal height of all the data is low, it is possible that there is not a sample injection failure, but another error such as a sample failure or forgetting to insert a sample, so repeating electrophoresis is not an effective countermeasure. However, if only part of the data has a low signal height, it is considered that there is a high possibility of sample injection failure, and an effective countermeasure is to perform electrophoresis again. Therefore, the control unit reanalyzes only the samples of analysis-2, analysis-9, and analysis-22. The assay used at this time may be the same as the initially set assay. This is because if the cause of sample injection failure is air bubbles, the air bubbles may be removed and the sample may be successfully injected even if electrophoresis is performed again under the same conditions.
- the results of a certain analysis are compared with the results of other analyzes included in a series of analyzes (Analysis-1 to Analysis-24) executed 24 times to statistically determine whether or not they are abnormal.
- a series of analyses it is also possible to compare the results of past analyzes performed under the same conditions (assays) to statistically determine whether or not there is an abnormality.
- step S304 if it is determined in step S304 that the signal height is greater than or equal to the threshold value, the analysis ends (step S213).
- Example 2 if there is a statistically abnormal analysis result in the abnormality determination step, reanalysis is performed using the same assay, and if there is a similarly abnormal analysis result in the abnormality determination step after reanalysis, Repeat reanalysis with the same assay. However, in Example 3, if there is a statistically abnormal analysis result in the first abnormality determination step, re-analysis is performed using the same assay, and the second abnormality determination step also has a statistically abnormal analysis result. If so, perform the first assay preparation step.
- Example 3 if re-analysis is performed using the adjusted assay and there is a statistically abnormal analysis result in the third abnormality determination step, a step (re-run) of outputting a display prompting re-preparation of the sample is provided. Preparation display step).
- FIG. 12 is a flowchart showing the analysis method of Example 3. However, in FIG. 12, illustration of Step S200, Step S102, Step S100, Step S110, Step S302, and Step S303 in FIG. 5 (Example 2) is omitted. In the following, only the parts different from the second embodiment will be explained.
- step S305 if there is a statistically abnormal analysis result in the first abnormality determination step, the control unit returns to step S202 without adjusting the assay, and the control unit adjusts the initially set assay. Perform re-analysis based on the results.
- step S305 if there is a statistically abnormal analysis result in the second abnormality determination step, the control unit executes the first assay adjustment step (step S306).
- the first assay adjustment step will be explained using a specific example.
- a statistically abnormal analysis result is obtained when the original sample injection voltage from the assay before adjustment is 1.6 kV.
- a value of 10 is set as the adjustment coefficient for increasing the signal strength.
- the control unit multiplies the original sample injection voltage by the adjustment coefficient, that is, 10 ⁇ 1.6 kV, to obtain 16 kV as the new adjusted sample injection voltage.
- the controller creates a new assay with the sample injection voltage updated to 16 kV.
- the assay was adjusted by changing the sample injection voltage, but in addition to the sample injection voltage, the assay could also be performed by changing analysis conditions such as sample injection time (voltage application time), laser irradiation time, and laser power. may be adjusted. In either case, the controller adjusts the assay by multiplying the parameter values of the original analysis conditions by the same adjustment factor.
- step S305 if there is a statistically abnormal analysis result in the third abnormality determination step, it is considered that a sample failure rather than a sample injection failure has occurred. Therefore, the control section executes a step of outputting a display prompting re-preparation of the sample to the display section (re-preparation display step) (step S307), and ends the analysis (step S213). Although not shown in FIG. 12, if there is no statistically abnormal analysis result in step S305, the analysis ends (step S213).
- sample injection failure can be dealt with by automatically performing reanalysis while avoiding sample re-preparation as much as possible.
- re-analysis using the same assay and re-analysis using the adjusted assay were performed once, but each may be performed multiple times as long as the sample does not deteriorate. .
- EQ quality data
- signal height data a signal height data of approximately 300 RFU is determined to be abnormal when each other signal height data is approximately 10,000 RFU.
- statistical determination may be performed using both quality data and signal height data.
- Example 1 is a capillary electrophoresis device that determines statistical abnormalities and performs reanalysis to deal with defective sample injection. It was a capillary electrophoresis device that also performs reanalysis to address this issue. However, a capillary electrophoresis device that does not deal with sample injection failure but only deals with signal saturation may also be used.
- SYMBOLS 10 Capillary array, 11... Capillary head, 12... Load header, 20... Electrophoresis medium container, 30... Anode side buffer solution container, 31... Anode side cleaning tank, 32... Anode side buffer solution tank for electrophoresis, 33... Sample Buffer solution tank for introduction, 40... Cathode side buffer solution container, 41... Waste solution tank, 42... Cathode side cleaning tank, 43... Cathode side buffer solution tank for electrophoresis, 50... Sample container, 60... Liquid feeding mechanism, 61... Plunger, 80... Sampler base, 85... Y-axis driver, 90... Z-axis driver, 95... X-axis driver, 100... Sample tray, 101...
Landscapes
- Health & Medical Sciences (AREA)
- Life Sciences & Earth Sciences (AREA)
- Molecular Biology (AREA)
- Chemical & Material Sciences (AREA)
- Chemical Kinetics & Catalysis (AREA)
- Electrochemistry (AREA)
- Physics & Mathematics (AREA)
- Analytical Chemistry (AREA)
- Biochemistry (AREA)
- General Health & Medical Sciences (AREA)
- General Physics & Mathematics (AREA)
- Immunology (AREA)
- Pathology (AREA)
- Investigating Or Analysing Biological Materials (AREA)
Abstract
Le but de la présente invention est de fournir un procédé d'analyse qui supprime une répétition inutile d'électrophorèse ou de préparation d'échantillon. Un procédé d'analyse selon la présente invention comprend l'analyse des caractéristiques d'un échantillon par électrophorèse de l'échantillon à l'aide d'un capillaire et d'un milieu de migration et comprend une étape de lecture destinée à lire des conditions d'analyse, une étape de remplissage de milieu de migration destinée à remplir le capillaire avec le milieu de migration, une étape d'injection d'échantillon destinée à injecter l'échantillon dans le capillaire rempli avec le milieu de migration à l'étape de remplissage de milieu de migration, une étape d'électrophorèse destinée à réaliser l'électrophorèse de l'échantillon injecté à l'étape d'injection d'échantillon à travers le milieu de migration, une étape de détermination d'anomalie destinée à comparer des résultats d'analyse obtenus à l'étape d'électrophorèse avec d'autres résultats d'analyse pour les mêmes conditions d'analyse afin de déterminer statistiquement s'il existe une anomalie, et une étape de réglage de conditions d'analyse destinée à ajuster les conditions d'analyse. Lorsqu'il a été déterminé qu'il existe une anomalie à l'étape de détermination d'anomalie, le procédé retourne à l'étape de lecture par l'intermédiaire de l'étape de réglage de conditions d'analyse.
Priority Applications (1)
| Application Number | Priority Date | Filing Date | Title |
|---|---|---|---|
| PCT/JP2022/028984 WO2024023979A1 (fr) | 2022-07-27 | 2022-07-27 | Procédé d'analyse et dispositif d'électrophorèse capillaire |
Applications Claiming Priority (1)
| Application Number | Priority Date | Filing Date | Title |
|---|---|---|---|
| PCT/JP2022/028984 WO2024023979A1 (fr) | 2022-07-27 | 2022-07-27 | Procédé d'analyse et dispositif d'électrophorèse capillaire |
Publications (1)
| Publication Number | Publication Date |
|---|---|
| WO2024023979A1 true WO2024023979A1 (fr) | 2024-02-01 |
Family
ID=89705679
Family Applications (1)
| Application Number | Title | Priority Date | Filing Date |
|---|---|---|---|
| PCT/JP2022/028984 WO2024023979A1 (fr) | 2022-07-27 | 2022-07-27 | Procédé d'analyse et dispositif d'électrophorèse capillaire |
Country Status (1)
| Country | Link |
|---|---|
| WO (1) | WO2024023979A1 (fr) |
Citations (7)
| Publication number | Priority date | Publication date | Assignee | Title |
|---|---|---|---|---|
| JPS62251651A (ja) * | 1986-04-24 | 1987-11-02 | Olympus Optical Co Ltd | 電気泳動分析における正常値範囲の設定方法 |
| JP2003344356A (ja) * | 2002-05-31 | 2003-12-03 | Hitachi High-Technologies Corp | 電気泳動装置、及び電気泳動方法 |
| JP2004325191A (ja) * | 2003-04-23 | 2004-11-18 | Japan Science & Technology Agency | キャピラリー電気泳動方法、キャピラリー電気泳動プログラム、そのプログラムを記憶した記録媒体及びキャピラリー電気泳動装置 |
| JP2005351690A (ja) * | 2004-06-09 | 2005-12-22 | Hitachi Sci Syst Ltd | マルチレーン電気泳動分析方法、それに用いる電気泳動分析装置、マルチレーン電気泳動分析プログラム、及び媒体 |
| JP2008122169A (ja) * | 2006-11-10 | 2008-05-29 | Hitachi High-Technologies Corp | 電気泳動装置、及び電気泳動分析方法 |
| JP2012068234A (ja) * | 2010-08-10 | 2012-04-05 | Arkray Inc | 電気泳動装置、および電気泳動装置の制御方法 |
| JP2020510822A (ja) * | 2017-02-17 | 2020-04-09 | ライフ テクノロジーズ コーポレーション | サンプル分析機器の自動品質管理およびスペクトル誤差補正 |
-
2022
- 2022-07-27 WO PCT/JP2022/028984 patent/WO2024023979A1/fr unknown
Patent Citations (7)
| Publication number | Priority date | Publication date | Assignee | Title |
|---|---|---|---|---|
| JPS62251651A (ja) * | 1986-04-24 | 1987-11-02 | Olympus Optical Co Ltd | 電気泳動分析における正常値範囲の設定方法 |
| JP2003344356A (ja) * | 2002-05-31 | 2003-12-03 | Hitachi High-Technologies Corp | 電気泳動装置、及び電気泳動方法 |
| JP2004325191A (ja) * | 2003-04-23 | 2004-11-18 | Japan Science & Technology Agency | キャピラリー電気泳動方法、キャピラリー電気泳動プログラム、そのプログラムを記憶した記録媒体及びキャピラリー電気泳動装置 |
| JP2005351690A (ja) * | 2004-06-09 | 2005-12-22 | Hitachi Sci Syst Ltd | マルチレーン電気泳動分析方法、それに用いる電気泳動分析装置、マルチレーン電気泳動分析プログラム、及び媒体 |
| JP2008122169A (ja) * | 2006-11-10 | 2008-05-29 | Hitachi High-Technologies Corp | 電気泳動装置、及び電気泳動分析方法 |
| JP2012068234A (ja) * | 2010-08-10 | 2012-04-05 | Arkray Inc | 電気泳動装置、および電気泳動装置の制御方法 |
| JP2020510822A (ja) * | 2017-02-17 | 2020-04-09 | ライフ テクノロジーズ コーポレーション | サンプル分析機器の自動品質管理およびスペクトル誤差補正 |
Similar Documents
| Publication | Publication Date | Title |
|---|---|---|
| EP2470891B1 (fr) | Electrophorèse sur gel, imagerie et procédés, dispositifs, systèmes et matériaux d'analyse | |
| JP4991252B2 (ja) | 電気泳動装置、及び電気泳動分析方法 | |
| US20200003728A1 (en) | Automated quality control and spectral error correction for sample analysis instruments | |
| WO2024023979A1 (fr) | Procédé d'analyse et dispositif d'électrophorèse capillaire | |
| WO2021210144A1 (fr) | Système d'électrophorèse | |
| JP7239496B2 (ja) | パルスフィールド多重化キャピラリ電気泳動システム | |
| JP2019035753A (ja) | Uv−吸収マルチチャネルキャピラリ電気泳動システム | |
| EP3474007B1 (fr) | Procédé de détermination, procédé d'analyse et système d'analyse | |
| JPH11108889A (ja) | キャピラリー電気泳動装置 | |
| US11016057B2 (en) | Pulse-field multiplex capillary electrophoresis system | |
| JP4566800B2 (ja) | 質量分析装置 | |
| JPWO2021166210A5 (fr) | ||
| WO2021166210A1 (fr) | Dispositif d'électrophorèse | |
| Vigh et al. | Evolution of the theoretical description of the isoelectric focusing experiment: III. Carrier ampholyte behavior in transient, bidirectional isotachophoresis | |
| WO2023195077A1 (fr) | Procédé d'analyse d'une séquence de bases et analyseur de gènes | |
| WO2024034098A1 (fr) | Procédé d'utilisation continue d'un milieu de séparation | |
| JP6805361B2 (ja) | 電気泳動装置及び電気泳動方法 | |
| WO2023026366A1 (fr) | Procédé d'aide à l'électrophorèse | |
| JP2002228586A (ja) | 蛍光測定装置及び蛍光測定方法 | |
| JP4994250B2 (ja) | キャピラリ電気泳動装置及び電気泳動媒体のリーク検査方法 | |
| US20240132951A1 (en) | Analysis method of base sequence and gene analyzer | |
| EP3754330A1 (fr) | Procédé d'analyse de séparation de composants d'échantillons | |
| KR20120080877A (ko) | 생체물질 검사장치 및 그 제어방법 | |
| Coope et al. | Contaminant‐induced current decline in capillary array electrophoresis | |
| JP4406651B2 (ja) | 電気泳動装置、及び電気泳動方法 |
Legal Events
| Date | Code | Title | Description |
|---|---|---|---|
| 121 | Ep: the epo has been informed by wipo that ep was designated in this application |
Ref document number: 22952164 Country of ref document: EP Kind code of ref document: A1 |