WO2023276113A1 - 触覚提示装置及び触覚提示方法 - Google Patents
触覚提示装置及び触覚提示方法 Download PDFInfo
- Publication number
- WO2023276113A1 WO2023276113A1 PCT/JP2021/024964 JP2021024964W WO2023276113A1 WO 2023276113 A1 WO2023276113 A1 WO 2023276113A1 JP 2021024964 W JP2021024964 W JP 2021024964W WO 2023276113 A1 WO2023276113 A1 WO 2023276113A1
- Authority
- WO
- WIPO (PCT)
- Prior art keywords
- drive voltage
- frequency
- voltage signal
- vibration
- preset
- Prior art date
- Legal status (The legal status is an assumption and is not a legal conclusion. Google has not performed a legal analysis and makes no representation as to the accuracy of the status listed.)
- Ceased
Links
Images






Classifications
-
- G—PHYSICS
- G06—COMPUTING OR CALCULATING; COUNTING
- G06F—ELECTRIC DIGITAL DATA PROCESSING
- G06F3/00—Input arrangements for transferring data to be processed into a form capable of being handled by the computer; Output arrangements for transferring data from processing unit to output unit, e.g. interface arrangements
- G06F3/01—Input arrangements or combined input and output arrangements for interaction between user and computer
- G06F3/016—Input arrangements with force or tactile feedback as computer generated output to the user
-
- G—PHYSICS
- G06—COMPUTING OR CALCULATING; COUNTING
- G06F—ELECTRIC DIGITAL DATA PROCESSING
- G06F3/00—Input arrangements for transferring data to be processed into a form capable of being handled by the computer; Output arrangements for transferring data from processing unit to output unit, e.g. interface arrangements
- G06F3/01—Input arrangements or combined input and output arrangements for interaction between user and computer
-
- G—PHYSICS
- G06—COMPUTING OR CALCULATING; COUNTING
- G06F—ELECTRIC DIGITAL DATA PROCESSING
- G06F3/00—Input arrangements for transferring data to be processed into a form capable of being handled by the computer; Output arrangements for transferring data from processing unit to output unit, e.g. interface arrangements
- G06F3/01—Input arrangements or combined input and output arrangements for interaction between user and computer
- G06F3/03—Arrangements for converting the position or the displacement of a member into a coded form
- G06F3/041—Digitisers, e.g. for touch screens or touch pads, characterised by the transducing means
-
- G—PHYSICS
- G06—COMPUTING OR CALCULATING; COUNTING
- G06F—ELECTRIC DIGITAL DATA PROCESSING
- G06F3/00—Input arrangements for transferring data to be processed into a form capable of being handled by the computer; Output arrangements for transferring data from processing unit to output unit, e.g. interface arrangements
- G06F3/01—Input arrangements or combined input and output arrangements for interaction between user and computer
- G06F3/03—Arrangements for converting the position or the displacement of a member into a coded form
- G06F3/041—Digitisers, e.g. for touch screens or touch pads, characterised by the transducing means
- G06F3/044—Digitisers, e.g. for touch screens or touch pads, characterised by the transducing means by capacitive means
Definitions
- the present disclosure relates to a tactile presentation device and a tactile presentation method.
- Patent Literature 1 discloses a tactile sense presentation device that uses a plurality of actuators to present individual vibration waveforms to a plurality of touch positions on a touch panel.
- the inverse matrix of the transfer characteristics from each actuator to each touch position is calculated, and the actuator is driven with a drive voltage signal obtained by multiplying the target vibration waveform by this inverse matrix. As a result, a target vibration waveform is presented at each touch position.
- the present disclosure has been made to solve the above-described problems, and provides a tactile sense presentation device and a tactile sense presentation method that can generate vibrations that present appropriate tactile stimuli to a user within a preset voltage range. It is intended to provide
- a tactile presentation device includes a touch panel, a housing that supports the touch panel, an actuator that is installed on the touch panel and vibrates the touch panel, a touch sensor that detects a touch position on the touch panel, and a touch sensor that corresponds to the touch position.
- the first drive voltage signal is calculated using the preset target vibration and the vibration transfer characteristics until the touch position is reached via the actuator, and the first drive voltage signal is within the preset voltage range.
- the first drive voltage signal is used as the second drive voltage signal, and when the first drive voltage signal exceeds the preset voltage range, the calculated frequency of the first drive voltage signal is less than the preset frequency.
- a signal calculation section for reducing components in the first frequency band and calculating a second drive voltage signal within a preset voltage range; and an output section for outputting the second drive voltage signal to the actuator. .
- the tactile sensation presentation method includes the step of detecting a touch position on the touch panel, the target vibration set in advance corresponding to the detected touch position, and the vibration transmission until the touch position is reached via the actuator. calculating a first drive voltage signal using the characteristic; if the first drive voltage signal is within a preset voltage range, the first drive voltage signal is used as the second drive voltage signal; When the drive voltage signal exceeds the preset voltage range, the component of the first frequency band below the preset frequency of the first drive voltage signal is reduced, and the second drive voltage signal within the preset voltage range is reduced. It comprises the steps of calculating a drive voltage signal and outputting a second drive voltage signal to the actuator.
- FIG. 1 is a schematic diagram of a tactile sense presentation device according to Embodiment 1.
- FIG. FIG. 2 is a graph showing an example of a temporal waveform of target vibration 107 according to the first embodiment.
- FIG. 3 is a graph showing frequency characteristics of the first separation filter w 1 (t) and the second separation filter w 2 (t) according to the first embodiment.
- FIG. 4 is a graph showing the relationship between the frequency characteristics of the first drive voltage signal 108 and the second drive voltage signal 109 according to the first embodiment.
- FIG. 5 is a graph showing an example of target vibration according to the first embodiment.
- FIG. 6 is a graph showing an example of frequency characteristics of vibration transfer characteristics in the tactile sense presentation device of the first embodiment.
- FIG. 7 is a graph showing an example of the first drive voltage signal according to Embodiment 1.
- FIG. 8 is a graph showing an example of the second drive voltage signal according to the first embodiment.
- FIG. 9 is a graph showing an example of vibration presented at the touch position of the tactile sense presentation device according to the comparative example.
- 10 is a graph showing an example of vibration presented at a touch position according to Embodiment 1.
- FIG. 11A and 11B are schematic diagrams for explaining the relationship between the second drive voltage signals output to the respective actuators of the first embodiment.
- FIG. FIG. 12 is a graph showing the relationship between the frequency characteristics of the first drive voltage signal 108 and the second drive voltage signal 109 in Modification 1 of Embodiment 1.
- FIG. FIG. 13 is a graph showing an example of vibration presented at touch position 106 in Modification 1 of Embodiment 1.
- FIG. 1 is a schematic diagram of a tactile presentation device 1 according to Embodiment 1.
- the tactile sense presentation device 1 includes a touch panel 101, a housing 102, two actuators 103_1 and 103_2, a touch sensor 104, and a signal processing section 105. Each configuration of the tactile sense presentation device 1 will be described below.
- the touch panel 101 is a panel that a user touches with a finger to operate, and is, for example, a plate-like member made of glass or resin.
- the touch panel 101 has enough strength to keep its shape and can transmit vibrations for presenting tactile stimulation to the user. not.
- the housing 102 is a housing for supporting the touch panel 101, and is partially connected to the touch panel 101. As long as the housing 102 is connected so as to support the touch panel 101 , the connection location and the connection method are not particularly limited.
- the housing 102 and the touch panel 101 may be connected via a viscoelastic body such as silicone rubber (not shown).
- the actuators 103_1 and 103_2 are actuators attached so as to vibrate the touch panel 101, and are composed of voice coils and piezoelectric vibrators, for example. Actuators 103_1 and 103_2 are arranged at different positions on touch panel 101 from each other. Note that the actuators 103_1 and 103_2 may vibrate the touch panel 101, and the type and mounting method are not particularly limited. Actuators 103_1 and 103_2 may be connected to housing 102 at one end. Also, the actuators 103_1 and 103_2 may include an amplifier circuit required for driving.
- the touch sensor 104 is a sensor that detects a touch position 106 touched by the user's finger.
- it is composed of a sheet-like sensor of a capacitive type, and is attached to the touch panel 101 to be integrated therewith.
- the touch sensor 104 performs position detection using a large number of electrode rows arranged in two vertical and horizontal layers, so that when multiple fingers touch different locations simultaneously, the multiple touch positions 106 are sensed at the same time.
- the number of simultaneously detectable touch positions 106 is designed according to the number of simultaneous touches assumed in the intended use of the tactile presentation device 1.
- FIG. 2 is shown.
- the touch sensor 104 may be a sensor other than the capacitive type as long as it can simultaneously detect an assumed number of touch positions 106, and its type and form are not particularly limited.
- the touch panel 101 may be provided with a display panel (not shown) such as TFT or organic EL so that image data can be displayed. If a display panel is provided, it is possible to display images of buttons and knobs to present the user with intuitive and easy-to-understand touch operation methods. In that case, the actuators 103_1 and 103_2 are arranged, for example, in the periphery of the touch panel 101 so as not to interfere with the display area.
- the signal processing unit 105 is an electric circuit for performing arithmetic processing, and includes an input unit 111, a signal calculation unit 112, and an output unit 113 inside.
- the input unit 111 is an electric circuit having an input interface, and represents two touch positions 106_1-2 detected by the touch sensor 104 and target vibrations 107_1-2 presented at the touch positions 106_1-2, respectively. Takes information as input.
- the signal calculation unit 112 uses the target vibrations 107_1 and 107_2 set in advance corresponding to the touch positions 106_1 and 106_2 and the vibration transmission characteristics until reaching the touch positions 106_1 and 106_2 via the actuators 103_1 and 103_2. It is an arithmetic circuit for calculating drive voltage signals 108_1 and 108_2. Then, the signal calculator 112 uses the calculated first drive voltage signals 108_1 and 108_2 to calculate second drive voltage signals 109_1 and 109_2 to be output to the actuators 103_1 and 103_2, respectively.
- the output unit 113 is an electric circuit having an output interface connected to each of the actuators 103_1 and 103_2, and outputs the second drive voltage signals 109_1 and 109_2 calculated by the signal calculation unit 112 to each of the actuators 103_1 and 103_2. do.
- the range of voltages that can be applied to the actuators 103_1 and 103_2 is limited in advance by the circuit configuration of the output section 113 and, if the actuators 103_1 and 103_2 include an amplifier circuit inside, the voltage exceeding that limit. However, the intended voltage is not output due to phenomena such as saturation. In addition, the range in which the actuators 103_1 and 103_2 can move linearly is also predetermined, and if a voltage exceeding the movable range is applied, not only does the intended vibration not occur, but malfunction or failure may occur. . Therefore, the range of voltage values that can be applied to the actuators 103_1 and 103_2 is limited. Therefore, the signal calculator 112 uses the first drive voltage signals 108_1 and 108_2 to calculate the second drive voltage signals 109_1 and 109_2 within the voltage range in which the actuators 103_1 and 103_2 operate normally.
- the signal processing unit 105 includes, for example, general-purpose DSP (Digital Signal Processor), ASIC (Application Specific Integrated Circuit), FPGA (Field Programmable Gate Array), memory, HDD ( hard disk drive), input/output interface circuit, bus circuit that connects them, AD converter for inputting and outputting analog signals, DA converter, analog filter circuit, amplifier circuit, software that describes DSP operation, etc. Configured.
- DSP Digital Signal Processor
- ASIC Application Specific Integrated Circuit
- FPGA Field Programmable Gate Array
- memory high-ROM (Field Programmable Gate Array)
- HDD hard disk drive
- AD converter for inputting and outputting analog signals
- DA converter analog filter circuit
- amplifier circuit software that describes DSP operation, etc. Configured.
- Such signal input/output and arithmetic processing functions can be realized by a combination of various hardware and software, and the specific configuration is not particularly limited as long as the functions are realized.
- the tactile sense presentation device 1 of FIG. 1 has two touch positions 106 and two actuators 103, and the above description has been made according to this configuration.
- the configuration is not limited. There may be one touch location 106 or more than two. Similarly, there may be a configuration with one actuator 103 or a configuration with more than two actuators 103 . In that case, each of M and N is an integer of 1 or more, and the touch sensor 104 has a function capable of simultaneously detecting M or more touch positions and detects the touch positions 106_1 to 106_M.
- the input unit 111 is configured to receive information on M touch positions 106_1 to 106_M detected by the touch sensor 104 and target vibrations 107_1 to 107_M to be presented to the touch positions 106_1 to 106_M, respectively.
- the signal calculation unit 112 calculates N first drive voltage signals 108_1 to N and second drive voltage signals 109_1 to N from the touch positions 106_1 to 106_M and the target vibrations 107_1 to M presented to the touch positions 106_1 to 106_M, respectively. It becomes the structure to calculate.
- the output unit 113 is connected to each of the actuators 103_1 to 103_N, and is configured to output the second drive voltage signals 109_1 to 109_N calculated by the signal calculation unit 112 to each of the actuators 103_1 to 103_N. Also in this case, there is a limit to the range of voltage values that the second drive voltage signals 109_1 to 109_N can take, and the voltage values are calculated so as to fall within the voltage range in which the actuators 103_1 to 103_N operate normally.
- the touch sensor 104 attached to the touch panel 101 detects the touch position 106 .
- M touch positions 106_1 to M on the touch panel 101 are detected.
- the signal processing unit 105 receives, in the input unit 111, the touch positions 106_1 to 106_M detected by the touch sensor 104 and the target vibrations 107_1 to 107_M to be presented to the touch positions 106_1 to 106_M as information.
- FIG. 2 is a graph showing an example of a temporal waveform of target vibration 107 according to the first embodiment.
- the target vibration 107 is set to have a sharply changing waveform with a short duration, as shown in FIG.
- FIG. 2A is a waveform of one cycle of a sine wave with a frequency of 200 Hz. This waveform is calculated by multiplying a sine wave having a frequency of 200 Hz by a rectangular wave having a length of one cycle as an envelope waveform.
- FIG. 2B shows a waveform obtained by multiplying a sine wave with a frequency of 200 Hz by a gentle envelope waveform over several cycles.
- a vibration having a waveform with repeated peaks as shown in FIG. 2C is set as the target vibration 107 .
- the waveform in FIG. 2C is a waveform in which one cycle of a sine wave with a frequency of 200 Hz is repeated at regular intervals.
- stimuli such as repeated sharp clicks are suitable for attracting the user's attention.
- Vibration 107 is set.
- the correspondence between the touch position 106 and the target vibration 107 differs depending on the intention of presenting the tactile stimulus to the user. , is set so that the intended function can be presented to the user.
- Information on the target vibrations 107_1 to 107_M determined outside the tactile sense presentation device 1 is input to the tactile sense presentation device 1 based on the correspondence.
- the target vibration 107_1 is the vibration of the time waveform for one cycle of the sine wave with a frequency of 200 Hz shown in FIG. is also the vibration of the time waveform whose magnitude is 0.
- the input target vibrations 107_1 to 107_M may be configured to input the waveform data of the target vibrations 107_1 to 107_M themselves, or may be configured to input identifiers of the target vibrations 107_1 to 107_M. .
- various time waveforms used as the target vibrations 107_1 to 107_M are stored in a storage device such as a nonvolatile memory (illustrated not) and corresponding to the input target vibration identifiers 107_1 to 107_M are selected.
- the waveforms shown in FIGS. 2A to 2C are waveforms obtained by modulating a sine wave with a frequency of 200 Hz with some kind of envelope waveform, and contain many frequency components around 200 Hz.
- modulation refers to multiplying a sine wave of a given frequency by some envelope waveform.
- the waveform in FIG. 2D is also obtained by multiplying the sine wave with a frequency of 200 Hz by 0, and can be regarded as a modulated waveform of the sine wave with a frequency of 200 Hz.
- the signal calculation unit 112 When information indicating the touch positions 106_1 to 106_M and the target vibrations 107_1 to 107_M is input to the input unit 111, the signal calculation unit 112 generates the first drive voltage signals 108_1 to 108_N and the 2 Calculate the drive voltage signals 109_1 to 109_N.
- all time-series data used for calculation such as x m (t) and g mn (t), which will be described later, are treated as sampled digital data, and the sampling frequency is is 2048 Hz. That is, t is a time index that takes a discrete value in increments of 1/2048 second. It is known as a sampling theorem that sampled data can hold information up to half the sampling frequency. Therefore, if the sampling frequency is 2048 Hz, it is possible to hold a band up to about 1 kHz, which is sufficient to handle the time waveform of vibration centered at 200 Hz.
- each numerical value of the time series data is also digitized, but it is handled in a data type with sufficient precision so that large calculation errors do not occur.
- double-precision floating-point type data it is possible to suppress the calculation error to a sufficiently small level.
- the data is held as double-precision floating-point type data.
- time-series data is converted to data in the frequency domain as appropriate for explanation. , and there is no essential difference in storing data or performing operations in either area. That is, as long as the data in the time domain and the frequency domain are appropriately associated by the discrete Fourier transform/inverse discrete Fourier transform, equivalent operations can be performed in either domain. It is not limited to the data storage and calculation methods described in the form.
- x m (t) is the value of vibration acceleration at time t.
- g mn (t) is the value at time t of the vibration acceleration generated at the touch position 106 — m when a unit impulse voltage is applied to the actuator 103 — n at time 0 .
- the vibration transfer characteristic can be calculated by applying the voltage of the reference signal to each actuator and measuring the vibration generated at the touch position as a response.
- Wideband signals such as white noise, impulse, and TSP (Time Stretched Pulse) are generally used as the reference signal.
- the measurement points for example, positions that are candidates for the touch positions 106_1 to _M are set in a grid pattern in areas where touch operations are assumed on the touch panel 101, and each of the actuators 103_1 to 103_N and each grid point is set. For all combinations, transfer characteristic data is measured in advance.
- the measured vibration transfer characteristic data is stored in advance in a storage device (not shown) such as a non-volatile memory provided in the signal calculation unit 112, and the vibration transfer characteristic data of the lattice points corresponding to the touch positions 106_1 to 106_M. are used to calculate the first drive voltage signals 108_1-N.
- a storage device such as a non-volatile memory provided in the signal calculation unit 112
- the vibration transfer characteristic data of the lattice points corresponding to the touch positions 106_1 to 106_M. are used to calculate the first drive voltage signals 108_1-N.
- the vibration transfer characteristics to the grid points closest to the touch positions 106_1 to 106_M are transferred to the touch positions 106_1 to 106_M.
- the transfer characteristics to the touch positions 106_1 to 106_M may be obtained by interpolating from the transfer characteristics to several grid points around the touch positions 106_1 to 106_M.
- the time width of the stored vibration transfer characteristic data may be a time width that sufficiently converges without discontinuing the time waveform.
- the time at which the time waveform of the vibration transfer characteristic converges is determined by the characteristics of the vibration system such as the touch panel 101, the housing 102 supporting it, and silicon rubber (not shown). It is set according to the characteristics of the vibration system of the device 1 .
- the time width is assumed to be 1 second. At this time, since the sampling frequency is 2048 Hz, the number of samples (the number of numerical values of time series data) of one time waveform of the stored vibration transfer characteristic data is 2048.
- the signal calculation unit 112 calculates the first drive voltage signals 108_1 to 108_N from the time waveforms of the target vibrations 107_1 to 107_M and the vibration transmission characteristics until reaching the touch positions 106_1 to 106_M via the actuators 103_1 to 103_N. do.
- z n (t) is the value of the drive voltage at time t.
- t is a time index that takes discrete values in increments of 1/2048 seconds
- the time waveform z n (t) of the first drive voltage signal is digital data sampled at a sampling frequency of 2048 Hz. be.
- f is associated with the time index t by the discrete Fourier transform, and takes (number of samples/2+1) discrete values from 0 Hz in steps of (sampling frequency/number of samples) Hz, where the sampling frequency is Since the frequency is 2048 Hz and the number of samples of the time waveform is 2048, 1025 values are taken from 0 Hz to 1024 Hz in increments of 1 Hz.
- [H nm (f)] having the inverse characteristic of [G mn (f)] is calculated for each frequency f.
- [A mn ] represents a matrix having A mn as an element in the m-th row and the n-th column.
- the matrix having the inverse characteristic of [G mn (f)] is a matrix having characteristics that cancel out [G mn (f)], and is expressed by [G mn (f)] ⁇ [H nm ( f)] is close to the identity matrix.
- [G mn (f)] may not have an inverse matrix due to rank loss.
- the inverse matrix [H nm (f)] may be obtained as a generalized inverse matrix, or may be obtained as an inverse matrix of [cI+G mn (f)].
- I is a unit matrix
- c is a constant
- a method of obtaining an inverse matrix by adding cI is known as a method of preventing divergence of the inverse matrix due to rank loss.
- a matrix having an approximately inverse characteristic can be calculated.
- [ H nm (f)] can be obtained using a number of generally known methods including approximate solutions, and the matrix As long as it is, the method for obtaining it is not particularly limited.
- the accuracy as the inverse characteristic of [H nm (f)] may be significantly degraded.
- the number N of the actuators 103_1-N should be equal to or greater than the number M of the touch positions 106_1-M.
- the time waveform of the inverse characteristic after conversion is represented as h nm (t).
- t is an index representing time, which is associated with the frequency index f by inverse discrete Fourier transform, and takes 2048 values in 1/2048 second intervals.
- Equation 1 K represents the number of samples of f(t) and ⁇ k represents the time of the k-th sample of f(t).
- the frequency Fb is set to a frequency lower than the frequency of the main components of the target vibrations 107_1-107_M .
- the target vibration 107_1 is a waveform obtained by multiplying a sine wave of 200 Hz by an envelope waveform, and has a large frequency component around 200 Hz.
- z 1n (t) is the component in the second frequency band 115
- the time waveform of the first separation filter that separates the component of the first frequency band 114 is w 1 (t)
- the time waveform of the second separation filter that separates the component of the second frequency band 115 is w 2 (t). do.
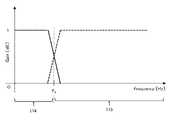
- FIG. 3 is a graph showing frequency characteristics of the time waveform w 1 (t) of the first separation filter and the time waveform w 2 (t) of the second separation filter according to the first embodiment.
- the solid line in FIG. 3 represents the frequency characteristics of the time waveform w 1 (t) of the first separation filter
- the dashed line in FIG. 3 represents the frequency characteristics of the second separation filter w 2 (t).
- the frequency characteristic of the time waveform w 1 (t) of the first separation filter is such that it passes the components in the first frequency band 114 below the frequency F b and blocks the second frequency band 115 above the frequency F b .
- the frequency characteristic of the time waveform w 2 (t) of the second separation filter is such that it cuts off the components in the first frequency band 114 below the frequency F b and passes the second frequency band 115 above the frequency F b .
- the first separation filter and the second separation filter do not need to completely pass or block the high-pass or low-pass components with the frequency Fb as the boundary, and have characteristics that overlap each other in a certain amount of bandwidth. .
- the gain of the first separation filter is larger
- the gain of the second separation filter is larger.
- the sum of the pass gains of both is set to 1 at all frequencies.
- the time waveforms z 1n (t) and z 2n (t) are calculated as follows using the time waveform w 1 (t) of the first separation filter and the time waveform w 1 (t) of the second separation filter. be.
- the time waveform w 1 (t) of the first separation filter is convolved with the time waveform z n (t) of the first drive voltage signal, and the obtained time waveform is assumed to be z 1n (t).
- the time waveform w 2 (t) of the second separation filter is convolved with the time waveform z n (t) of the first drive voltage signal, and the obtained time waveform is assumed to be z 2n (t).
- z 1n (t) is the time waveform mainly composed of the components of the first frequency band 114 of z n (t), and z 2n (t) is the second frequency band 115 of z n (t).
- the sum of the pass gains of w 1 (t) and w 2 (t) is 1 at all frequencies, so add z 1n (t) and z 2n (t)
- the resulting waveform is equal to z n (t).
- V max The upper limit of the voltage (absolute value) that the second drive voltage signals 109_1 to 109_N can take is V max .
- V max is set to the rated voltage value of the device or the upper limit value of the voltage at which the actuators 103_1 to 103_N can be linearly driven.
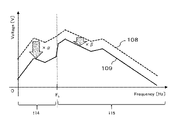
- FIG. 4 is a graph showing the relationship between the frequency characteristics of the first drive voltage signal 108 and the second drive voltage signal 109 according to the first embodiment.
- the broken line graph is the frequency characteristic of the time waveform z n (t) of the first drive voltage signal
- the solid line graph is the frequency characteristic of the time waveform y n (t) of the second drive voltage signal.
- the time waveform y n (t) of the second drive voltage signal is obtained by multiplying the component of the first frequency band 114 of the time waveform z n (t) of the first drive voltage signal by ⁇ times, and multiplying the time waveform z n (t) of the second drive voltage signal. It is a signal obtained by multiplying the component of the second frequency band 115 of n (t) by ⁇ . Since ⁇ , the time waveform y n (t) of the second drive voltage signal is obtained by replacing the component of the time waveform z n (t) of the first drive voltage signal in the first frequency band 114 with the component in the second frequency band 115 . It becomes a signal that is greatly reduced compared to the component.
- the value of ⁇ when yy n (t) falls within the range of ⁇ V max to +V max for all n from ⁇ N is adopted.
- the time waveform y n (t) of the second drive voltage signal is equal to the time waveform z n (t) of the first drive voltage signal.
- the time waveform y n (t) of the second drive voltage signal is higher than the time waveform z n (t) of the first drive voltage signal compared to the component of the second frequency band 115 . It becomes a signal in which the component of one frequency band 114 is greatly reduced.
- the second drive voltage signals 109_1 to 109_N are calculated in the signal calculator 112 by the processing of STEP 1 to STEP 4 above.
- the output section 113 of the signal processing section 105 drives the corresponding actuators 103_1 to 103_N with the second driving voltage signals 109_1 to 109_N, respectively.
- the driven actuators 103_1 to 103_N vibrate the touch panel 101 at the respective positions where they are attached, and the respective vibrations generated on the touch panel 101 are propagated to the touch positions 106_1 to 106_M to generate tactile sensation stimulation due to the vibrations.
- the driven actuators 103_1 to 103_N vibrate the touch panel 101 at the respective positions where they are attached, and the respective vibrations generated on the touch panel 101 are propagated to the touch positions 106_1 to 106_M to generate tactile sensation stimulation due to the vibrations.
- a waveform in which the components are similarly reduced compared to the components in the second frequency band 115 is obtained.
- the level of the time waveform z n (t) of the first drive voltage signal is lowered until it falls within the range of ⁇ V max or more and +V max or less, and this is used as the time waveform y n (t) of the second drive voltage signal. In this way, malfunctions and failures can be avoided.
- the maximum voltage of the time waveform z n (t) of the first drive voltage signal is twice the value of V max
- the signal of (1 ⁇ 2) times z n (t) is the second drive voltage signal.
- the time waveform is y n (t)
- it can be contained within the range of ⁇ V max to +V max .
- the vibration presented at this time is a vibration of (1/2) times the magnitude of x m (t).
- the tactile sense presentation device 1 of the present invention provides the following effects.
- the time waveform x m (t) of the target vibration as shown in FIG. 2 is a waveform generated by multiplying a sine wave of 200 Hz by an envelope waveform.
- the reason why such a waveform is used is that it contains many components near 200 Hz, which is a vibration frequency with good tactile sensitivity, and can easily present a clear tactile stimulus to the user.
- it since it is a waveform that fluctuates in a short period of time, it contains frequency components in a wide band other than around 200 Hz, and also has components on the lower frequency side than 200 Hz.
- FIG. 5 is a graph representing the target vibration 107_1 of Embodiment 1, and the time waveform of the target vibration 107_1 is shown in FIG. 5(A), and its frequency characteristic is shown in FIG. 5(B).
- FIG. 5A is a graph showing the same waveform as that of FIG. 2A, although the scale of the horizontal axis is different.
- the target vibration 107_1 is a time waveform for one cycle of a sine wave with a frequency of 200 Hz, and has a frequency peak near 200 Hz. .
- FIG. 6 is a graph showing an example of vibration transfer characteristics in the tactile sense presentation device 1.
- FIG. In a band of approximately 300 Hz or less, the gain decreases as the frequency becomes lower, and a sharp drop in gain is seen particularly in the first frequency band 114 of 100 Hz or less.
- the elements of the vibration transfer characteristic matrix [G mn (f)] tend to have smaller values, and the matrix [H nm (f)] has a larger value, so the convolution of [h nm (t)] and [x m (t)], that is, x m (t) in the frequency domain as X m (f),
- the first drive voltage signals 108_1 to N calculated as the product of [H nm (f)] and [X m (f)] also tend to have large values in the first frequency band 114 .
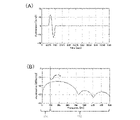
- FIG. 7 is a graph representing the first drive voltage signal 108_1 of the first embodiment.
- FIG. 7A shows the time waveform of the first drive voltage signal 108_1 calculated using the target vibration 107_1 shown in FIG. 5, and
- FIG. 7B shows its frequency characteristic as an example.
- the target vibration 107_1 shown in FIG. 5B has a peak near 200 Hz
- the first drive voltage signal 108_1 shown in FIG. It can be seen that there is a peak at a frequency near 80 Hz.
- the frequency peak of the target vibration 107_1 exists near 200 Hz, and this band is also a band with high tactile sensitivity to vibration. The effect on the distortion and tactile stimulation caused by the sensor is small.
- the frequency F b is set to a frequency lower than the frequency of the main components of the target vibrations 107_1 to 107_M, and the frequency of the first frequency band 114 below the frequency F b While preferentially reducing the components, the components of the second frequency band 115 above the frequency Fb are maintained without being reduced as much as possible.
- the main components of the target vibrations 107_1 to 107_M are included in the second frequency band 115, and the effect of suppressing distortion occurring in the presented vibration waveform is obtained.
- the low frequency components that tend to be large in the first drive voltage signals 108_1 to 108_N are included in the first frequency band 114, and by reducing this, the maximum voltage of the second drive voltage signals 109_1 to 109_N can be effectively reduced. It is possible to obtain the effect of being suppressed to At this time, since the component of the first frequency band 114 is not the main component in the target vibrations 107_1 to 107_M, even if this component is reduced, the effect on the presented vibration waveform is small.
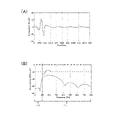
- FIG. 8 is a graph representing the second drive voltage signal 109_1 of the first embodiment.
- FIG. 8A shows the time waveform of the second drive voltage signal 109_1 calculated using the first drive voltage signal 108_1 shown in FIG. 7, and
- FIG. 8B shows its frequency characteristic as an example.
- the second drive voltage signal 109_1 has reduced components in the first frequency band 114 below 100 Hz set as the frequency Fb. 7A and 8A, the maximum voltage of the time waveform of the first drive voltage signal 108_1 is about 12V, and the maximum voltage of the time waveform of the second drive voltage signal 109_1 is about 3V. It can be seen that the second drive voltage signal 109_1 has a smaller maximum voltage than the first drive voltage signal 108_1. That is, by reducing the component of the first frequency band 114 of the first drive voltage signal 108_1, the maximum voltage of the time waveform of the second drive voltage signal 109_1 can be greatly reduced.
- FIG. 7(A) and 8(A) show the drivable voltage range when the upper limit value Vmax of the voltage is 8V.
- the first drive voltage signal 108_1 is out of this voltage range and cannot be applied to the actuator 103_1, but the second drive voltage signal 109_1 is within this voltage range and drives the actuator 103_1. be able to.
- FIG. 9 is a graph showing an example of vibration presented at the touch position 106_1 of the tactile presentation device according to the comparative example.
- FIG. 9 shows an example of the temporal waveform of the vibration acceleration presented when the first drive voltage signal 108_1 shown in FIG. 7 is used, assuming that there is no upper voltage limit, and
- FIG. 9A shows its frequency characteristics. 9(B). Comparing FIG. 9A and FIG. 5A, it can be seen that the target vibration waveform can be accurately presented when the first drive voltage signal 108_1 is used.
- FIG. 10 is a graph showing an example of vibration presented at the touch position 106_1 according to the first embodiment.
- FIG. 10(A) is a temporal waveform of vibration acceleration presented when the second drive voltage signal 109_1 shown in FIG. 8 is used, and its frequency characteristic is shown in FIG. 10(B).
- the frequency characteristic of the vibration acceleration in FIG. 10(B) has reduced components in the first frequency band 114 below 100 Hz set as the frequency Fb compared to FIG . 9(B).
- the time waveform of the vibration acceleration shown in FIG. 10A is the waveform x m (t) of the target vibration shown in FIG. 5A and the first drive voltage signal 108_1 shown in FIG.
- the second drive voltage signal 109_1 has a time waveform obtained by reducing the component of the first frequency band 114 of the first drive voltage signal 108_1, but by maintaining the component of the second frequency band 115, the first drive voltage Equivalent vibrations can be presented with signal 108_1.
- the tactile sense presentation device 1 provides vibrations at the touch positions 106_1 to 106_M via the target vibrations 107_1 to 107_M preset corresponding to the touch positions 106_1 to 106_M and the actuators 103_1 to 103_N.
- the first drive voltage signals 108_1 to _N are calculated using the vibration transfer characteristics until the first drive voltage signals 108_1 to _N are reached, and the components of the first frequency band 114 below the preset frequency Fb of the first drive voltage signals 108_1 to _N are reduced.
- the second drive voltage signals 109_1 to N within a preset voltage range (-V max or more and +V max or less) are calculated.
- the maximum voltage of the second drive voltage signals 109_1 to 109_N can be efficiently suppressed by reducing the components of the first frequency band 114 that tend to increase in the first drive voltage signals 108_1 to 108_N.
- the presented vibrations are brought closer to the target vibrations 107_1 to 107_M. be able to. Therefore, it is possible to generate vibration that presents an appropriate tactile sense stimulus to the user within a preset voltage range (-V max or more and +V max or less).
- the signal calculator 112 reduces the components of the second frequency band 115 above the preset frequency Fb of the first drive voltage signals _1 to _N, and reduces the components within the preset voltage range (-V max to +V max ). ) may be calculated.
- the reduction rate of the components of the first frequency band 114 of the first drive voltage signals _1-N is greater than the reduction rate of the components of the second frequency band 115 .
- a large frequency component near frequency F c and the component of frequency Fc can be regarded as the main frequency component. Therefore, the frequency Fb in this case should be set to a value lower than the frequency Fc .
- the second drive voltage signals 109_1 to 109_N retain the components of the second frequency band 115 in which the frequency peaks of the target vibrations 107_1 to 107_M are present, rather than the components of the first frequency band 114. It is possible to suppress the distortion that occurs and the effect on tactile stimulation, and present strong vibration stimulation as intended.
- the reason why the target vibrations 107_1 to 107_M are generated based on the sine wave with a frequency of 200 Hz is that the finger has a high tactile sense sensitivity to vibrations around 200 Hz.
- the frequency of the underlying sine wave is not necessarily limited to 200 Hz, but by presenting vibrations containing many frequency components with high tactile sensitivity, it is possible to convey a clear tactile stimulus to the user.
- the sensitivity characteristic of the human finger to vibration acceleration is high at frequencies of 300 Hz or less, and considering that the gain of the mechanical vibration system decreases as the frequency decreases, the vibration to be presented has a relatively high sensitivity. It is effective to use a relatively high frequency of 200 to 300 Hz and set the frequency Fb to a lower value of 200 Hz or less. As a result, distortion of the presented vibration waveform can be suppressed also from a tactile point of view.
- the upper limit Vmax of the voltage (absolute value) that the second drive voltage signals 109_1 to 109_N can take is set to the rated voltage value of the tactile presentation device 1 or the upper limit of the voltage at which the actuators 103_1 to 103_N can be linearly driven. The value is set to prevent the tactile presentation device 1 from malfunctioning or breaking down.
- the second drive voltage signals 109_1 to 109_N exceed the rated voltage value or the upper limit of the voltage at which the actuators 103_1 to 103_N can be linearly driven, saturation inside the amplifier circuit and nonlinear operation of the actuators occur. Not only is it not possible to present the intended vibration, but there is also the possibility of malfunction or failure.
- V max is set to the rated voltage value of the tactile presentation device 1 or the upper limit value of the voltage at which the actuators 103_1 to N can be linearly driven, and the second drive voltage signals 109_1 to N are set within the range of -V max to +V max . , you can avoid such problems.
- FIG. 11 is a schematic diagram illustrating the relationship between the second drive voltage signals 109_1-2 output to the actuators 103_1-2 of the first embodiment.
- FIG. 11 is a diagram illustrating a configuration in which two actuators 103 are provided as an example. Both the time waveforms y 1 (t) and y 2 (t) of the second drive voltage signals applied to the actuators 103_1 and 103_2 are the time waveforms z 1 (t) and z 2 (t) of the first drive voltage signals. ) in the first frequency band 114 is multiplied by ⁇ , and the time waveforms z 1 (t) and z 2 (t) of the first drive voltage signal in the second frequency band 115 are multiplied by ⁇ . is a signal. That is, all the second drive voltage signals 109_1-2 are calculated by reducing or amplifying the components of the first frequency band 114 and the second frequency band 115 of the corresponding first drive voltage signals 108_1-2 at the same rate. be done.
- vibrations generated at the touch positions 106_1 to 106_M are superimposed vibrations propagated from the respective actuators 103_1 to 103_N.
- the first drive voltage signals 108_1-N calculated based on the transfer characteristics so as to present the target vibrations 107_1-M to the touch positions 106_1-M are the vibration from one actuator 103_n and the vibration from another actuator 103_p(p ⁇ n), the desired vibration is formed by the balance of the vibration propagating from each of the actuators 103_1 to 103_n. Unintended vibration may remain.
- the waveform of the vibration acceleration presented to the touch positions 106_1 to 106_M is the target vibration.
- the component of the first frequency band 114 of the time waveform x m (t) is multiplied by ⁇ and the component of the second frequency band 115 is multiplied by ⁇ , and unintended vibration does not occur.
- the synthesis coefficients ⁇ and ⁇ for calculating the time waveform y n (t) of the second drive voltage signal are made common, and the first drive voltage signals 108_1 to 108_N of all the actuators 103_1 to 103_N are reduced or amplified at the same rate. , and by not changing the superposition ratio of the vibrations from the actuators 103_1 to 103_N, there is an effect of preventing unintended vibrations from occurring.
- the small gain of the vibration acceleration of the mechanical vibration system formed by the supporting portion of the touch panel 101 and the housing 102 causes the first drive voltage signals 108_1 to 108_N to increase.
- the effect of the present invention appears remarkably in a mechanical vibration system in which the gain in the first frequency band 114 is lower than the gain of vibration acceleration at the frequency of the main component of the target vibration 107 .
- Such frequency characteristics of the gain are likely to occur when all resonance frequencies of the mechanical vibration system are included in the second frequency band 115 . Therefore, it is desirable to configure the mechanical vibration system by the support portion of the touch panel 101 and the housing 102 such that all resonance frequencies thereof are included in the second frequency band 115 . Since the resonance frequency of the mechanical vibration system is determined by its weight, rigidity, shape, etc., the tactile presentation device 1 having a desired resonance frequency can Obtainable.
- Modification 1 of the first embodiment As Modified Example 1 of Embodiment 1, a configuration in which the procedure for determining the synthesis coefficients ⁇ and ⁇ in STEP 3 described above is different will be described.
- the synthesis coefficients ⁇ and ⁇ are determined so that ⁇ is less than 1 (where ⁇ is 0 or more) and ⁇ is greater than 1 under the condition that these values can be accommodated.
- FIG. 12 is a graph showing the relationship between the frequency characteristics of the first drive voltage signal 108 and the second drive voltage signal 109 in Modification 1 of Embodiment 1.
- the dashed line graph shows the frequency characteristics of the time waveform z n (t) of the first drive voltage signal
- the solid line graph shows the frequency characteristics of the time waveform y n (t) of the second drive voltage signal.
- the time waveform y n (t) of the second drive voltage signal is obtained by multiplying the component of the first frequency band 114 of the time waveform z n (t) of the first drive voltage signal by ⁇ times to obtain the time waveform z n (t) of the first drive voltage signal. It is a signal obtained by multiplying the component of the second frequency band 115 of n (t) by ⁇ . Since ⁇ 1, 1 ⁇ , the time waveform y n (t) of the second drive voltage signal has a reduced component in the first frequency band 114 of the time waveform z n (t) of the first drive voltage signal. , the components of the second frequency band 115 become amplified signals.
- the signal calculation unit 112 Leave ⁇ at 0, increase ⁇ from 1, and adopt the value of ⁇ that minimizes Equation 3 within the range where Condition 1 is satisfied.
- x 1m (t) is the time waveform of the component of the first frequency band 114 separated from the time waveform x m (t) of the target vibration
- x m (t) is the first separation filter w 1 (t ) is convoluted.
- x 2m (t) is the time waveform of the component of the second frequency band 115 separated from the time waveform x m (t) of the target vibration
- x m (t) is the second separation filter w 2 (t) is calculated by convoluting the
- FIG. 13 is a graph showing an example of vibration presented at touch position 106 in Modification 1 of Embodiment 1.
- FIG. 13 is a graph showing an example of a temporal waveform of vibration presented at the touch position 106, where the vertical axis is vibration acceleration (m/s 2 ) and the horizontal axis is time t (sec).
- the vibration shown in FIG. 13 is obtained by using the first drive voltage signal 108 shown in FIG.
- Signal 109 is the vibration presented to touch location 106 when output to actuator 103 .
- P1 in FIG. 13 is the peak-to-peak value of the time waveform of the target vibration shown in FIG.
- P2 is the peak of the time waveform of the vibration presented at the touch position 106 in Embodiment 1 shown in FIG.
- P3 indicates the peak-to-peak value of the time waveform of the vibration presented at the touch position 106 in Modification 1 of Embodiment 1, respectively.
- the peak-to-peak value of the time waveform of the presented vibration is , the peak-to-peak value of the target vibration 107 is not always the same due to the lack of the component of the first frequency band 114 .
- the peak-to-peak value P2 is slightly smaller than the peak-to-peak value P1.
- the tactile stimulus at the moment when the vibration reaches the peak may be felt weak. It is desirable to present the to-peak value.
- the synthesis coefficient ⁇ can be made larger than 1 in the range where the second drive voltage signal 109 falls within the range of ⁇ V max to +V max , the synthesis coefficient ⁇ is set to more than 1. set large.
- the peak-to-peak value P3 is increased, and the user can operate within the preset voltage range. Vibrations can be generated that present the appropriate tactile stimulus.
- Modified example 2 of the first embodiment As a modification 2 of Embodiment 1, a configuration in which the setting of the upper limit value V max of the voltage (absolute value) that the second drive voltage signal 109 can take in STEP 3 is different will be described.
- V max is or a value smaller than the upper limit of the voltage at which the actuator 103 can be linearly driven.
- V max by changing the setting of V max according to the operation mode of the tactile presentation device 1, there is a normal mode in which power consumption is large but strong vibration stimulation can be presented, and a vibration stimulation is weak in presentation but power consumption is saved.
- the peak frequency of the frequency characteristics of the target vibrations 107_1 to 107_M is calculated, and the frequency lower than the peak frequency is set as the frequency Fb.
- M is 2 or more and there are a plurality of target vibrations 107_1 to M
- each peak frequency is calculated and set to a frequency lower than any of them. Also, if a time waveform with a value of 0 at all times is included in any of the target vibrations 107_1 to 107_M, that time waveform is excluded.
- the frequency Fb should be set to a frequency lower than the peak frequency of the target vibrations 107_1 to 107_M. Just do it. In other words, if the peak component of the frequency characteristic is greatly reduced, the distortion occurring in the presented vibration waveform becomes large.
- the peak components of the frequency characteristics of the vibrations 107_1-M can be included in the second frequency band 115, and the distortion of the presented waveform can be suppressed.
- the frequency of the main component is determined and the frequency Fb is set. can do.
- each peak frequency is calculated, and the frequency Fb is set to a frequency lower than any of them, thereby presenting to the touch positions 106_1 to 106_M. It is possible to suppress the distortion of all vibration waveforms that are applied. However, if any one of the target vibrations 107_1 to 107_M has a time waveform with a value of 0 at all times, that waveform may be excluded and Fb may be selected. The reason for this is that the time waveform, which has a value of 0 at all times, remains at a value of 0 at all times even if any band component is reduced, and the waveform is not distorted.
- Modified example 4 of the first embodiment As a modification 4 of the first embodiment, another configuration in which the method of determining the frequency Fb in STEP 2 is different will be described.
- the frequency peak component of (t) can be included in the first frequency band 114, and the second drive voltage signals 109_1-N can be effectively reduced.
- the gain of the vibration acceleration in a mechanical vibration system such as the touch panel 101 sharply decreases as the frequency becomes lower, and the time waveform z n (t) of the first drive voltage signal corresponds to the target vibration 107_1 to M A peak tends to occur at a frequency lower than the frequency of the main component of .
- this component which is the frequency peak of the first drive voltage signals 108_1-N. If it is in a lower range than the frequency component, even if this component is reduced, the effect on the presented vibration waveform is small. Moreover, it is effective to set the frequency higher than the frequency of the main component of the time waveform z n (t) of the first drive voltage signal.
- each peak frequency is calculated, and the frequency F b is set higher than any of them.
- 1 tactile presentation device 101 touch panel, 102 housing, 103 actuator, 104 touch sensor, 105 signal processing unit, 106 touch position, 107 target vibration, 108 first drive voltage signal, 109 second drive voltage signal, 111 input unit, 112 signal calculator, 113 output unit, 114 first frequency band, 115 second frequency band
Landscapes
- Engineering & Computer Science (AREA)
- General Engineering & Computer Science (AREA)
- Theoretical Computer Science (AREA)
- Human Computer Interaction (AREA)
- Physics & Mathematics (AREA)
- General Physics & Mathematics (AREA)
- Position Input By Displaying (AREA)
- User Interface Of Digital Computer (AREA)
Priority Applications (3)
| Application Number | Priority Date | Filing Date | Title |
|---|---|---|---|
| US18/573,437 US12481365B2 (en) | 2021-07-01 | 2021-07-01 | Tactile sense presentation device and tactile sense presentation method |
| PCT/JP2021/024964 WO2023276113A1 (ja) | 2021-07-01 | 2021-07-01 | 触覚提示装置及び触覚提示方法 |
| JP2023531296A JP7351042B2 (ja) | 2021-07-01 | 2021-07-01 | 触覚提示装置及び触覚提示方法 |
Applications Claiming Priority (1)
| Application Number | Priority Date | Filing Date | Title |
|---|---|---|---|
| PCT/JP2021/024964 WO2023276113A1 (ja) | 2021-07-01 | 2021-07-01 | 触覚提示装置及び触覚提示方法 |
Publications (1)
| Publication Number | Publication Date |
|---|---|
| WO2023276113A1 true WO2023276113A1 (ja) | 2023-01-05 |
Family
ID=84692568
Family Applications (1)
| Application Number | Title | Priority Date | Filing Date |
|---|---|---|---|
| PCT/JP2021/024964 Ceased WO2023276113A1 (ja) | 2021-07-01 | 2021-07-01 | 触覚提示装置及び触覚提示方法 |
Country Status (3)
| Country | Link |
|---|---|
| US (1) | US12481365B2 (https=) |
| JP (1) | JP7351042B2 (https=) |
| WO (1) | WO2023276113A1 (https=) |
Families Citing this family (1)
| Publication number | Priority date | Publication date | Assignee | Title |
|---|---|---|---|---|
| JP2025073844A (ja) * | 2023-10-27 | 2025-05-13 | 太陽誘電株式会社 | 操作装置、ステアリングホイール、電子機器及び操作パネルの制御方法 |
Citations (3)
| Publication number | Priority date | Publication date | Assignee | Title |
|---|---|---|---|---|
| WO2012160827A1 (ja) * | 2011-05-24 | 2012-11-29 | 京セラ株式会社 | 電子機器 |
| JP2014048863A (ja) * | 2012-08-31 | 2014-03-17 | Kyocera Document Solutions Inc | 表示入力装置および画像形成装置 |
| JP2015028766A (ja) * | 2013-06-24 | 2015-02-12 | パナソニックIpマネジメント株式会社 | 触感呈示装置および触感呈示方法 |
Family Cites Families (10)
| Publication number | Priority date | Publication date | Assignee | Title |
|---|---|---|---|---|
| GB2464117B (en) | 2008-10-03 | 2015-01-28 | Hiwave Technologies Uk Ltd | Touch sensitive device |
| JP6032657B2 (ja) | 2012-04-27 | 2016-11-30 | パナソニックIpマネジメント株式会社 | 触感呈示装置、触感呈示方法、駆動信号生成装置および駆動信号生成方法 |
| US9122330B2 (en) * | 2012-11-19 | 2015-09-01 | Disney Enterprises, Inc. | Controlling a user's tactile perception in a dynamic physical environment |
| CN104395866B (zh) | 2012-11-30 | 2018-02-23 | 松下知识产权经营株式会社 | 触觉提示装置及触觉提示方法 |
| US9285880B2 (en) * | 2012-12-26 | 2016-03-15 | Panasonic Intellectual Property Management Co., Ltd. | Touch panel device and method of controlling a touch panel device |
| CN105745031A (zh) | 2013-12-06 | 2016-07-06 | 富士通株式会社 | 驱动装置、电子设备、驱动控制程序、以及驱动信号的生成方法 |
| CN114816198B (zh) * | 2016-10-21 | 2025-01-28 | 天马微电子股份有限公司 | 触觉提示装置 |
| JP7138024B2 (ja) | 2018-11-28 | 2022-09-15 | 京セラ株式会社 | 電子機器 |
| CN111596754B (zh) * | 2019-02-20 | 2024-06-21 | 天马日本株式会社 | 触觉呈现装置 |
| US11922798B2 (en) * | 2019-07-23 | 2024-03-05 | Sony Group Corporation | Control device and control method |
-
2021
- 2021-07-01 JP JP2023531296A patent/JP7351042B2/ja active Active
- 2021-07-01 US US18/573,437 patent/US12481365B2/en active Active
- 2021-07-01 WO PCT/JP2021/024964 patent/WO2023276113A1/ja not_active Ceased
Patent Citations (3)
| Publication number | Priority date | Publication date | Assignee | Title |
|---|---|---|---|---|
| WO2012160827A1 (ja) * | 2011-05-24 | 2012-11-29 | 京セラ株式会社 | 電子機器 |
| JP2014048863A (ja) * | 2012-08-31 | 2014-03-17 | Kyocera Document Solutions Inc | 表示入力装置および画像形成装置 |
| JP2015028766A (ja) * | 2013-06-24 | 2015-02-12 | パナソニックIpマネジメント株式会社 | 触感呈示装置および触感呈示方法 |
Also Published As
| Publication number | Publication date |
|---|---|
| US12481365B2 (en) | 2025-11-25 |
| US20240295926A1 (en) | 2024-09-05 |
| JP7351042B2 (ja) | 2023-09-26 |
| JPWO2023276113A1 (https=) | 2023-01-05 |
Similar Documents
| Publication | Publication Date | Title |
|---|---|---|
| JP6587941B2 (ja) | 入力装置、表示装置、および、入力装置の振動状態検出方法 | |
| JP5788887B2 (ja) | タッチセンシティブデバイス | |
| US9159207B2 (en) | Haptic device | |
| US8266971B1 (en) | Surface force distribution sensor by frequency-domain multiplexing | |
| CN103988157B (zh) | 传感装置 | |
| JP6183661B2 (ja) | 触感呈示装置および触感呈示方法 | |
| US10067593B2 (en) | Inter-symbol interference reduction for touch panel systems | |
| CN105745031A (zh) | 驱动装置、电子设备、驱动控制程序、以及驱动信号的生成方法 | |
| WO2015059887A1 (ja) | 電子機器 | |
| KR102559962B1 (ko) | 터치 패널 | |
| WO2013073321A1 (ja) | タッチセンサ及び電子機器 | |
| CN115469746B (zh) | 触觉反馈方法及装置 | |
| JP2015028766A (ja) | 触感呈示装置および触感呈示方法 | |
| WO2023276113A1 (ja) | 触覚提示装置及び触覚提示方法 | |
| JP6852795B2 (ja) | 制御装置、電子機器、及び、電子機器の制御方法 | |
| RU2589294C1 (ru) | Устройство управления устройством сенсорного ввода и способ управления устройством сенсорного ввода | |
| CN108227977A (zh) | 对触摸屏控制器中的不同采样率的并行分析 | |
| US12510969B2 (en) | Tactile sensation presentation device, display device, data terminal device, and tactile sensation presentation method | |
| CN121773387A (zh) | 触觉反馈信号检测电路、驱动控制电路及触觉反馈装置 | |
| JPWO2019130504A1 (ja) | 電子機器 | |
| JP2024035857A (ja) | 圧電ユニット及び入出力装置 | |
| JP2023174369A (ja) | 圧力分布計測システム、圧力分布計測方法、圧力分布計測プログラム、及び差動増幅計測の測定回路 | |
| KR20170080297A (ko) | 터치 스크린 장치 및 그 구동 방법 | |
| JP2013037542A (ja) | ピエゾ駆動装置 | |
| JP2022011511A (ja) | 圧電素子デバイス、圧電素子装置および荷重検出方法 |
Legal Events
| Date | Code | Title | Description |
|---|---|---|---|
| 121 | Ep: the epo has been informed by wipo that ep was designated in this application |
Ref document number: 21948417 Country of ref document: EP Kind code of ref document: A1 |
|
| WWE | Wipo information: entry into national phase |
Ref document number: 2023531296 Country of ref document: JP |
|
| NENP | Non-entry into the national phase |
Ref country code: DE |
|
| 122 | Ep: pct application non-entry in european phase |
Ref document number: 21948417 Country of ref document: EP Kind code of ref document: A1 |
|
| WWG | Wipo information: grant in national office |
Ref document number: 18573437 Country of ref document: US |