WO2023238366A1 - 故障診断装置、故障診断方法および故障診断プログラム - Google Patents
故障診断装置、故障診断方法および故障診断プログラム Download PDFInfo
- Publication number
- WO2023238366A1 WO2023238366A1 PCT/JP2022/023414 JP2022023414W WO2023238366A1 WO 2023238366 A1 WO2023238366 A1 WO 2023238366A1 JP 2022023414 W JP2022023414 W JP 2022023414W WO 2023238366 A1 WO2023238366 A1 WO 2023238366A1
- Authority
- WO
- WIPO (PCT)
- Prior art keywords
- failure
- group
- event
- sensor
- data
- Prior art date
- Legal status (The legal status is an assumption and is not a legal conclusion. Google has not performed a legal analysis and makes no representation as to the accuracy of the status listed.)
- Ceased
Links
Images


Classifications
-
- G—PHYSICS
- G06—COMPUTING OR CALCULATING; COUNTING
- G06Q—INFORMATION AND COMMUNICATION TECHNOLOGY [ICT] SPECIALLY ADAPTED FOR ADMINISTRATIVE, COMMERCIAL, FINANCIAL, MANAGERIAL OR SUPERVISORY PURPOSES; SYSTEMS OR METHODS SPECIALLY ADAPTED FOR ADMINISTRATIVE, COMMERCIAL, FINANCIAL, MANAGERIAL OR SUPERVISORY PURPOSES, NOT OTHERWISE PROVIDED FOR
- G06Q10/00—Administration; Management
Definitions
- the present disclosure relates to a technology for diagnosing equipment failure.
- IoT in which various devices are connected to the Internet
- IoT is an abbreviation for Internet of things.
- Patent Document 1 discloses a failure diagnosis method.
- a user interface for event input and a plurality of fault trees are registered in an easily configurable storage unit. Then, the user inputs whether or not an event has occurred regarding an event related to each fault tree. This makes it possible to efficiently diagnose the cause of failure without requiring complicated intermediate event settings.
- Patent Document 1 requires interactive information input from the user when narrowing down the cause of a failure using a failure tree. In other words, it takes a lot of manpower.
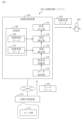
- the configuration of the failure diagnosis system 200 will be explained based on FIG. 1.
- the failure diagnosis system 200 includes a diagnosis target device 210 and a failure diagnosis apparatus 100.
- Fault diagnosis device 100 is connected to diagnosis target device 210 via a network.
- a specific example of a network is the Internet.
- the failure diagnosis device 100 diagnoses the diagnosis target device 210 based on the sensor data 201 and presents the diagnosis result to the user 209.
- the user 209 is a maintenance worker who handles failures.
- Diagnosis result data 202 is data indicating a diagnosis result.
- the processor 101 is an IC that performs arithmetic processing and controls other hardware.
- processor 101 is a CPU.
- IC is an abbreviation for Integrated Circuit.
- CPU is an abbreviation for Central Processing Unit.
- the auxiliary storage device 103 is a nonvolatile storage device.
- the auxiliary storage device 103 is a ROM, an HDD, a flash memory, or a combination thereof. Data stored in the auxiliary storage device 103 is loaded into the memory 102 as needed.
- ROM is an abbreviation for Read Only Memory.
- HDD is an abbreviation for Hard Disk Drive.
- the input/output interface 105 is a port to which an input device and an output device are connected.
- the input/output interface 105 is a USB terminal
- the input device is a keyboard and a mouse
- the output device is a display.
- Input/output of the failure diagnosis device 100 is performed using an input/output interface 105.
- USB is an abbreviation for Universal Serial Bus.
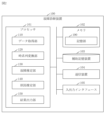
- the fault diagnosis device 100 includes elements such as a data acquisition section 110, a time series conversion section 120, an event estimation section 130, a cause estimation section 140, and a result output section 150. These elements are implemented in software.
- the failure diagnosis device 100 may include a plurality of processors that replace the processor 101.
- the fault diagnosis program can be recorded (stored) in a computer-readable manner on a non-volatile recording medium such as an optical disk or a flash memory.
- the operation procedure of the fault diagnosis system 200 corresponds to a fault diagnosis method. Further, the operation procedure of the fault diagnosis system 200 corresponds to the processing procedure by the fault diagnosis program.
- step S110 the data acquisition unit 110 acquires sensor data 201.
- the device to be diagnosed 210 transmits sensor data 201 to the failure diagnosis device 100.
- the data acquisition unit 110 then receives the sensor data 201.
- the time series conversion unit 120 uses the acquired sensor data 201 to convert the time series of sensor values into feature information for each sensor.
- the feature information indicates time-series features of the sensor values.
- the time series converter 120 converts the time series of sensor values into a waveform for each sensor to generate waveform data.
- the generated waveform data is feature information.
- the waveform data indicates a waveform representing a time series of sensor values.
- a feature information group (waveform data group) corresponding to the sensor group 211 is obtained.
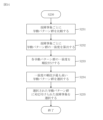
- step S130 the event estimation unit 130 estimates a failure event of the diagnosis target device 210 based on the failure event data 191 and the feature information group obtained in step S120.
- the estimated failure event is referred to as an estimated event.
- Failure event data 191 indicates a group of characteristic information in association with each of a plurality of failure events.
- the event estimation unit 130 selects a feature information group similar to the feature information group obtained in step S120 from the failure event data 191. Then, the event estimation unit 130 selects a failure event associated with the selected feature information group from the failure event data 191. The selected failure event is a probable event.
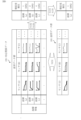
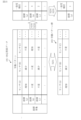
- the failure event data 191 indicates a waveform data group (characteristic information group) in association with each of a plurality of failure events.
- the failure event data 191 is tabular data.
- the vertical axis indicates multiple failure events. On the vertical axis, failure events that may occur in the device to be diagnosed 210 are covered, and a list of failure events is shown.
- the horizontal axis indicates a waveform data group corresponding to the sensor group 211. On the horizontal axis, a list of sensors making up the sensor group 211 is shown.
- the failure event data 191 is created by comprehensively analyzing the design information of the device to be diagnosed 210, and is stored in the storage unit 190 in advance.
- step S131 the event estimation unit 130 compares, for each failure event of the failure event data 191, the waveform data group associated with the failure event with the waveform data group obtained in step S120.
- step S132 the event estimation unit 130 calculates, for each failure event, the degree of similarity between the waveform data group associated with the failure event and the waveform data group obtained in step S120, based on the comparison result.
- the similarity of waveform data groups is calculated as follows.
- the event estimation unit 130 calculates the degree of similarity between the waveform data obtained in step S120 and the waveform data shown in the failure event data 191 for each sensor, and calculates a statistical value (for example, an average) of the calculated degree of similarity. .
- the calculated statistical value becomes the degree of similarity of the waveform data group.
- step S133 the event estimation unit 130 ranks the similarity of each waveform data group of the failure event data 191. The higher the similarity, the higher the ranking.
- step S134 the event estimation unit 130 selects the waveform data group with the highest similarity rank.
- step S135 the event estimation unit 130 selects a failure event associated with the selected waveform data group from the failure event data 191.
- the selected failure event is a probable event.
- FIG. 6 shows an overview of step S130.
- the waveform data group 181 is the waveform data group obtained in step S120.
- the degree of similarity of the waveform data group of failure (a) to the waveform data group 181 is 90%, which is the highest. In this case, failure (a) is the presumed event.
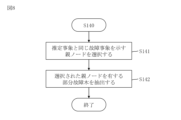
- step S140 the cause estimating unit 140 estimates a group of failure causes of the diagnosis target device 210 based on the estimated event and the failure cause data 192.
- a failure cause group is one or more failure causes.
- the estimated failure cause group is referred to as a probable cause group.
- the failure cause data 192 indicates failure cause groups in association with each of a plurality of failure events.
- the cause estimation unit 140 extracts a group of failure causes associated with the same failure event as the estimated event from the failure cause data 192.
- the extracted failure cause group is a presumed cause group.
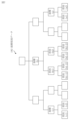
- the failure cause data 192 is data indicating an overall failure tree configured in a tree structure.
- the overall fault tree includes partial fault trees for each of the plurality of fault events.
- the overall fault tree covers all fault events that may occur in the device 210 to be diagnosed.
- a partial fault tree has a parent node indicating a failure event and a group of child nodes associated with the parent node and indicating a group of causes of failure.
- the partial fault tree covers all fault causes that cause a fault event to occur.
- the entire fault tree of fault cause data 192 includes partial fault trees of fault (a), fault (b), and fault (c).
- the parent node of failure (a) is associated with the child node of cause (a1) and the child node of cause (a2).
- the failure cause data 192 is created by comprehensively analyzing the design information of the device 210 to be diagnosed, and is stored in the storage unit 190 in advance.
- step S140 Details of step S140 will be explained based on FIG. 8.
- the cause estimation unit 140 selects a parent node that indicates the same failure event as the estimated event from the entire failure tree.
- step S142 the cause estimation unit 140 extracts a partial fault tree having the selected parent node from the entire fault tree.
- a group of failure causes indicated by a group of child nodes of the extracted partial fault tree is a group of presumed causes.
- FIG. 9 shows an overview of step S140.
- Estimated event 182 is failure (a).
- the parent node of fault (a) is selected from the global fault tree.
- a partial fault tree having the parent node of fault (a) is extracted.
- the child node group of the extracted partial fault tree is a child node of cause (a1) and a child node of cause (a2).
- cause (a1) and cause (a2) are a group of presumed causes.
- step S150 the result output unit 150 outputs the diagnosis result data 202.
- Diagnosis result data 202 indicates a presumed event and a group of presumed causes.
- the result output unit 150 displays the presumed event and the presumed cause group on the display.
- Embodiment 2 With regard to a mode for more easily determining estimated events, the main differences from Embodiment 1 will be explained based on FIGS. 10 to 16.
- the configuration of failure diagnosis device 100 is the same as the configuration in the first embodiment. However, the configuration of failure event data 191 is different from the configuration in the first embodiment.
- step S210 the data acquisition unit 110 acquires sensor data 201.
- Step S210 is the same as step S110 in the first embodiment.
- step S220 the time series conversion unit 120 converts the time series of sensor values into feature information for each sensor using the acquired sensor data 201. Specifically, the time series conversion unit 120 determines a time series behavior pattern of sensor values for each sensor. The determined behavior pattern is characteristic information. Behavior patterns indicate trends in changes in sensor values over time. In step S220, a feature information group (behavior pattern group) corresponding to the sensor group 211 is obtained.
- step S222 the time series conversion unit 120 determines the tendency of change in the sensor value during the failure time period relative to the sensor value during the normal time period based on the comparison result for each sensor.
- the determined tendency is a behavior pattern.
- the behavior pattern is determined as follows. Note that an error range is defined in advance for each sensor. However, a common error range may be defined. When many of the sensor values during the failure time period increase beyond the error range, the time series conversion unit 120 determines that the behavior pattern is "increase”. If many of the sensor values during the failure time period have decreased beyond the error range, the time series conversion unit 120 determines that the behavior pattern is "decreased.” If most of the sensor values during the failure time period do not change beyond the error range, the time series conversion unit 120 determines that the behavior pattern is "unchanged.”
- FIG. 12 shows an overview of step S220.
- the behavior pattern of sensor (A) is "increase”.
- the sensor (B) many of the sensor values (B) during the failure time period have decreased beyond the error range (B). In this case, the behavior pattern of sensor (B) is "decrease”.
- the sensor (C) most of the sensor values (C) during the failure time period do not change beyond the error range (C). In this case, the behavior pattern of the sensor (C) is "unchanged".
- the time series conversion unit 120 determines that the behavior pattern is "increase”.
- the time series conversion unit 120 determines that the behavior pattern is "decreasing”.
- the time series conversion unit 120 determines that the behavior pattern is "unchanged”.
- step S230 the event estimation unit 130 estimates a failure event of the diagnosis target device 210 based on the failure event data 191 and the feature information group obtained in step S120.
- step S230 the event estimation unit 130 compares, for each failure event in the failure event data 191, the behavior pattern group associated with the failure event with the behavior pattern group obtained in step S220.
- step S233 the event estimation unit 130 ranks the degree of matching of each behavior pattern group of the failure event data 191. The higher the degree of matching, the higher the ranking.
- step S235 the event estimation unit 130 selects a failure event associated with the selected behavior pattern group from the failure event data 191.
- the selected failure event is a probable event.
- step S240 the cause estimating unit 140 estimates the failure cause group of the diagnosis target device 210 based on the estimated event and the failure cause data 192.
- Step S240 is the same as step S140 in the first embodiment.
- the failure diagnosis device 100 converts sensor data obtained from the device to be diagnosed 210 into a sensor data behavior pattern. After that, the fault diagnosis device 100 compares the sensor data behavior pattern with the fault-sensor value correspondence table (191) and calculates the degree of coincidence.
- the format of the sensor data behavior pattern is simpler than the format of the sensor data waveform used in the first embodiment. Therefore, the computational resources required for comparison can be reduced.
- the failure diagnosis device 100 uses the pattern conversion threshold (error range) of each sensor data at the time of comparison. This makes it possible to ignore fluctuations in values due to factors unrelated to failures (for example, noise).
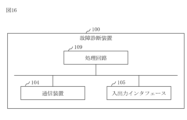
- the failure diagnosis device 100 includes a processing circuit 109 .
- the processing circuit 109 is hardware that implements the data acquisition section 110, the time series conversion section 120, the event estimation section 130, the cause estimation section 140, and the result output section 150.
- the processing circuit 109 may be dedicated hardware or may be the processor 101 that executes a program stored in the memory 102.
- processing circuit 109 is dedicated hardware, processing circuit 109 is, for example, a single circuit, a composite circuit, a programmed processor, a parallel programmed processor, an ASIC, an FPGA, or a combination thereof.
- ASIC is an abbreviation for Application Specific Integrated Circuit.
- FPGA is an abbreviation for Field Programmable Gate Array.
- the failure diagnosis device 100 may include a plurality of processing circuits that replace the processing circuit 109.
- the functions of the failure diagnosis device 100 can be realized by hardware, software, firmware, or a combination thereof.
- the "unit" of each element of the failure diagnosis device 100 may be read as “process”, “process”, “circuit”, or “circuitry”.
- failure diagnosis device 101 processor, 102 memory, 103 auxiliary storage device, 104 communication device, 105 input/output interface, 109 processing circuit, 110 data acquisition unit, 120 time series conversion unit, 130 event estimation unit, 140 cause estimation unit, 150 result output unit, 181 waveform data group, 182 estimated event, 183 behavior pattern group, 190 storage unit, 191 failure event data, 192 failure cause data, 200 failure diagnosis system, 201 sensor data, 202 diagnosis result data, 209 user, 210 Diagnosis target device, 211 Sensor group.
Landscapes
- Business, Economics & Management (AREA)
- Engineering & Computer Science (AREA)
- Economics (AREA)
- Entrepreneurship & Innovation (AREA)
- Human Resources & Organizations (AREA)
- Marketing (AREA)
- Operations Research (AREA)
- Quality & Reliability (AREA)
- Strategic Management (AREA)
- Tourism & Hospitality (AREA)
- Physics & Mathematics (AREA)
- General Business, Economics & Management (AREA)
- General Physics & Mathematics (AREA)
- Theoretical Computer Science (AREA)
- Testing And Monitoring For Control Systems (AREA)
Priority Applications (2)
| Application Number | Priority Date | Filing Date | Title |
|---|---|---|---|
| PCT/JP2022/023414 WO2023238366A1 (ja) | 2022-06-10 | 2022-06-10 | 故障診断装置、故障診断方法および故障診断プログラム |
| JP2022570104A JPWO2023238366A1 (https=) | 2022-06-10 | 2022-06-10 |
Applications Claiming Priority (1)
| Application Number | Priority Date | Filing Date | Title |
|---|---|---|---|
| PCT/JP2022/023414 WO2023238366A1 (ja) | 2022-06-10 | 2022-06-10 | 故障診断装置、故障診断方法および故障診断プログラム |
Publications (1)
| Publication Number | Publication Date |
|---|---|
| WO2023238366A1 true WO2023238366A1 (ja) | 2023-12-14 |
Family
ID=89117786
Family Applications (1)
| Application Number | Title | Priority Date | Filing Date |
|---|---|---|---|
| PCT/JP2022/023414 Ceased WO2023238366A1 (ja) | 2022-06-10 | 2022-06-10 | 故障診断装置、故障診断方法および故障診断プログラム |
Country Status (2)
| Country | Link |
|---|---|
| JP (1) | JPWO2023238366A1 (https=) |
| WO (1) | WO2023238366A1 (https=) |
Citations (3)
| Publication number | Priority date | Publication date | Assignee | Title |
|---|---|---|---|---|
| JP2015108375A (ja) * | 2013-12-05 | 2015-06-11 | ゼネラル・エレクトリック・カンパニイ | 故障した燃焼器を検出するためのシステムおよび方法 |
| JP2015176514A (ja) * | 2014-03-18 | 2015-10-05 | 株式会社日立製作所 | プラント事故時運転支援システム |
| JP2019191852A (ja) * | 2018-04-24 | 2019-10-31 | 株式会社日立製作所 | 故障診断装置、故障診断方法並びに故障診断装置が適用された機械 |
Family Cites Families (3)
| Publication number | Priority date | Publication date | Assignee | Title |
|---|---|---|---|---|
| JP5427107B2 (ja) * | 2010-05-20 | 2014-02-26 | 株式会社日立製作所 | 監視診断装置および監視診断方法 |
| JP2013152655A (ja) * | 2012-01-26 | 2013-08-08 | Hitachi Ltd | プラント又は設備の異常診断方法及びヘルスマネージメント方法 |
| JP6103899B2 (ja) * | 2012-11-28 | 2017-03-29 | 三菱電機株式会社 | 故障個所推定装置 |
-
2022
- 2022-06-10 JP JP2022570104A patent/JPWO2023238366A1/ja active Pending
- 2022-06-10 WO PCT/JP2022/023414 patent/WO2023238366A1/ja not_active Ceased
Patent Citations (3)
| Publication number | Priority date | Publication date | Assignee | Title |
|---|---|---|---|---|
| JP2015108375A (ja) * | 2013-12-05 | 2015-06-11 | ゼネラル・エレクトリック・カンパニイ | 故障した燃焼器を検出するためのシステムおよび方法 |
| JP2015176514A (ja) * | 2014-03-18 | 2015-10-05 | 株式会社日立製作所 | プラント事故時運転支援システム |
| JP2019191852A (ja) * | 2018-04-24 | 2019-10-31 | 株式会社日立製作所 | 故障診断装置、故障診断方法並びに故障診断装置が適用された機械 |
Also Published As
| Publication number | Publication date |
|---|---|
| JPWO2023238366A1 (https=) | 2023-12-14 |
Similar Documents
| Publication | Publication Date | Title |
|---|---|---|
| CN112955839B (zh) | 异常检测装置、异常检测方法和程序 | |
| CN108923952B (zh) | 基于服务监控指标的故障诊断方法、设备及存储介质 | |
| CN111459700B (zh) | 设备故障的诊断方法、诊断装置、诊断设备及存储介质 | |
| JP7126256B2 (ja) | 異常診断装置、異常診断方法、及びプログラム | |
| CN112257755B (zh) | 航天器运行状态的分析方法和装置 | |
| JP6088131B2 (ja) | タービン性能診断システム及び方法 | |
| WO2016101690A1 (zh) | 基于时间序列分析的输变电设备的状态监测数据清洗方法 | |
| US20190265088A1 (en) | System analysis method, system analysis apparatus, and program | |
| JP6886870B2 (ja) | プラント運転監視システム及びプラント運転監視方法 | |
| US9524223B2 (en) | Performance metrics of a computer system | |
| KR101960755B1 (ko) | 미취득 전력 데이터 생성 방법 및 장치 | |
| JP6164311B1 (ja) | 情報処理装置、情報処理方法、及び、プログラム | |
| KR102073537B1 (ko) | 리스크 평가 장치, 리스크 평가 시스템, 리스크 평가 방법 및 리스크 평가 프로그램 | |
| CN115033453B (zh) | 异常检测方法、装置、设备、存储介质及程序 | |
| KR20170104705A (ko) | 설비 고장 진단 장치 및 방법 | |
| WO2011138911A1 (ja) | 障害分析装置、障害分析方法および記録媒体 | |
| JP3718765B2 (ja) | プラント診断装置 | |
| TWI861824B (zh) | 異常診斷方法、異常診斷裝置以及異常診斷程式 | |
| CN116126574B (zh) | 一种系统故障诊断方法、装置、设备及存储介质 | |
| US11378944B2 (en) | System analysis method, system analysis apparatus, and program | |
| US20220342407A1 (en) | Irregularity detection system, irregularity detection method, and computer readable medium | |
| US20220406103A1 (en) | Fault diagnosis device, fault diagnosis system, fault diagnosis method, and fault diagnosis program | |
| KR20230075150A (ko) | 시스템 건전성을 관리하기 위한 방법 및 장치 | |
| CN109738220A (zh) | 一种基于多荷载工况结构响应关联的传感器优化布置方法 | |
| WO2023238366A1 (ja) | 故障診断装置、故障診断方法および故障診断プログラム |
Legal Events
| Date | Code | Title | Description |
|---|---|---|---|
| ENP | Entry into the national phase |
Ref document number: 2022570104 Country of ref document: JP Kind code of ref document: A |
|
| 121 | Ep: the epo has been informed by wipo that ep was designated in this application |
Ref document number: 22945866 Country of ref document: EP Kind code of ref document: A1 |
|
| NENP | Non-entry into the national phase |
Ref country code: DE |
|
| 122 | Ep: pct application non-entry in european phase |
Ref document number: 22945866 Country of ref document: EP Kind code of ref document: A1 |