WO2023238366A1 - 故障診断装置、故障診断方法および故障診断プログラム - Google Patents
故障診断装置、故障診断方法および故障診断プログラム Download PDFInfo
- Publication number
- WO2023238366A1 WO2023238366A1 PCT/JP2022/023414 JP2022023414W WO2023238366A1 WO 2023238366 A1 WO2023238366 A1 WO 2023238366A1 JP 2022023414 W JP2022023414 W JP 2022023414W WO 2023238366 A1 WO2023238366 A1 WO 2023238366A1
- Authority
- WO
- WIPO (PCT)
- Prior art keywords
- failure
- group
- event
- sensor
- data
- Prior art date
Links
- 238000003745 diagnosis Methods 0.000 title claims abstract description 79
- 238000000034 method Methods 0.000 title claims description 22
- 238000006243 chemical reaction Methods 0.000 claims abstract description 26
- 239000000284 extract Substances 0.000 claims abstract description 5
- 238000012545 processing Methods 0.000 claims description 15
- 230000003247 decreasing effect Effects 0.000 claims description 5
- 230000006399 behavior Effects 0.000 description 36
- 238000010586 diagram Methods 0.000 description 10
- 238000004891 communication Methods 0.000 description 7
- 230000006870 function Effects 0.000 description 6
- 238000013461 design Methods 0.000 description 4
- 230000002452 interceptive effect Effects 0.000 description 3
- 238000012423 maintenance Methods 0.000 description 3
- 230000000694 effects Effects 0.000 description 2
- 238000005259 measurement Methods 0.000 description 2
- 239000002131 composite material Substances 0.000 description 1
- 238000007796 conventional method Methods 0.000 description 1
- 238000005516 engineering process Methods 0.000 description 1
- 230000003287 optical effect Effects 0.000 description 1
- 239000013589 supplement Substances 0.000 description 1
Images


Classifications
-
- G—PHYSICS
- G06—COMPUTING; CALCULATING OR COUNTING
- G06Q—INFORMATION AND COMMUNICATION TECHNOLOGY [ICT] SPECIALLY ADAPTED FOR ADMINISTRATIVE, COMMERCIAL, FINANCIAL, MANAGERIAL OR SUPERVISORY PURPOSES; SYSTEMS OR METHODS SPECIALLY ADAPTED FOR ADMINISTRATIVE, COMMERCIAL, FINANCIAL, MANAGERIAL OR SUPERVISORY PURPOSES, NOT OTHERWISE PROVIDED FOR
- G06Q10/00—Administration; Management
Definitions
- the present disclosure relates to a technology for diagnosing equipment failure.
- IoT in which various devices are connected to the Internet
- IoT is an abbreviation for Internet of things.
- Patent Document 1 discloses a failure diagnosis method.
- a user interface for event input and a plurality of fault trees are registered in an easily configurable storage unit. Then, the user inputs whether or not an event has occurred regarding an event related to each fault tree. This makes it possible to efficiently diagnose the cause of failure without requiring complicated intermediate event settings.
- Patent Document 1 requires interactive information input from the user when narrowing down the cause of a failure using a failure tree. In other words, it takes a lot of manpower.
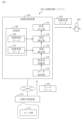
- the configuration of the failure diagnosis system 200 will be explained based on FIG. 1.
- the failure diagnosis system 200 includes a diagnosis target device 210 and a failure diagnosis apparatus 100.
- Fault diagnosis device 100 is connected to diagnosis target device 210 via a network.
- a specific example of a network is the Internet.
- the failure diagnosis device 100 diagnoses the diagnosis target device 210 based on the sensor data 201 and presents the diagnosis result to the user 209.
- the user 209 is a maintenance worker who handles failures.
- Diagnosis result data 202 is data indicating a diagnosis result.
- the processor 101 is an IC that performs arithmetic processing and controls other hardware.
- processor 101 is a CPU.
- IC is an abbreviation for Integrated Circuit.
- CPU is an abbreviation for Central Processing Unit.
- the auxiliary storage device 103 is a nonvolatile storage device.
- the auxiliary storage device 103 is a ROM, an HDD, a flash memory, or a combination thereof. Data stored in the auxiliary storage device 103 is loaded into the memory 102 as needed.
- ROM is an abbreviation for Read Only Memory.
- HDD is an abbreviation for Hard Disk Drive.
- the input/output interface 105 is a port to which an input device and an output device are connected.
- the input/output interface 105 is a USB terminal
- the input device is a keyboard and a mouse
- the output device is a display.
- Input/output of the failure diagnosis device 100 is performed using an input/output interface 105.
- USB is an abbreviation for Universal Serial Bus.
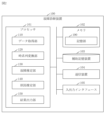
- the fault diagnosis device 100 includes elements such as a data acquisition section 110, a time series conversion section 120, an event estimation section 130, a cause estimation section 140, and a result output section 150. These elements are implemented in software.
- the failure diagnosis device 100 may include a plurality of processors that replace the processor 101.
- the fault diagnosis program can be recorded (stored) in a computer-readable manner on a non-volatile recording medium such as an optical disk or a flash memory.
- the operation procedure of the fault diagnosis system 200 corresponds to a fault diagnosis method. Further, the operation procedure of the fault diagnosis system 200 corresponds to the processing procedure by the fault diagnosis program.
- step S110 the data acquisition unit 110 acquires sensor data 201.
- the device to be diagnosed 210 transmits sensor data 201 to the failure diagnosis device 100.
- the data acquisition unit 110 then receives the sensor data 201.
- the time series conversion unit 120 uses the acquired sensor data 201 to convert the time series of sensor values into feature information for each sensor.
- the feature information indicates time-series features of the sensor values.
- the time series converter 120 converts the time series of sensor values into a waveform for each sensor to generate waveform data.
- the generated waveform data is feature information.
- the waveform data indicates a waveform representing a time series of sensor values.
- a feature information group (waveform data group) corresponding to the sensor group 211 is obtained.
- step S130 the event estimation unit 130 estimates a failure event of the diagnosis target device 210 based on the failure event data 191 and the feature information group obtained in step S120.
- the estimated failure event is referred to as an estimated event.
- Failure event data 191 indicates a group of characteristic information in association with each of a plurality of failure events.
- the event estimation unit 130 selects a feature information group similar to the feature information group obtained in step S120 from the failure event data 191. Then, the event estimation unit 130 selects a failure event associated with the selected feature information group from the failure event data 191. The selected failure event is a probable event.
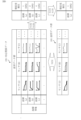
- the failure event data 191 indicates a waveform data group (characteristic information group) in association with each of a plurality of failure events.
- the failure event data 191 is tabular data.
- the vertical axis indicates multiple failure events. On the vertical axis, failure events that may occur in the device to be diagnosed 210 are covered, and a list of failure events is shown.
- the horizontal axis indicates a waveform data group corresponding to the sensor group 211. On the horizontal axis, a list of sensors making up the sensor group 211 is shown.
- the failure event data 191 is created by comprehensively analyzing the design information of the device to be diagnosed 210, and is stored in the storage unit 190 in advance.
- step S131 the event estimation unit 130 compares, for each failure event of the failure event data 191, the waveform data group associated with the failure event with the waveform data group obtained in step S120.
- step S132 the event estimation unit 130 calculates, for each failure event, the degree of similarity between the waveform data group associated with the failure event and the waveform data group obtained in step S120, based on the comparison result.
- the similarity of waveform data groups is calculated as follows.
- the event estimation unit 130 calculates the degree of similarity between the waveform data obtained in step S120 and the waveform data shown in the failure event data 191 for each sensor, and calculates a statistical value (for example, an average) of the calculated degree of similarity. .
- the calculated statistical value becomes the degree of similarity of the waveform data group.
- step S133 the event estimation unit 130 ranks the similarity of each waveform data group of the failure event data 191. The higher the similarity, the higher the ranking.
- step S134 the event estimation unit 130 selects the waveform data group with the highest similarity rank.
- step S135 the event estimation unit 130 selects a failure event associated with the selected waveform data group from the failure event data 191.
- the selected failure event is a probable event.
- FIG. 6 shows an overview of step S130.
- the waveform data group 181 is the waveform data group obtained in step S120.
- the degree of similarity of the waveform data group of failure (a) to the waveform data group 181 is 90%, which is the highest. In this case, failure (a) is the presumed event.
- step S140 the cause estimating unit 140 estimates a group of failure causes of the diagnosis target device 210 based on the estimated event and the failure cause data 192.
- a failure cause group is one or more failure causes.
- the estimated failure cause group is referred to as a probable cause group.
- the failure cause data 192 indicates failure cause groups in association with each of a plurality of failure events.
- the cause estimation unit 140 extracts a group of failure causes associated with the same failure event as the estimated event from the failure cause data 192.
- the extracted failure cause group is a presumed cause group.
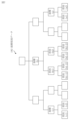
- the failure cause data 192 is data indicating an overall failure tree configured in a tree structure.
- the overall fault tree includes partial fault trees for each of the plurality of fault events.
- the overall fault tree covers all fault events that may occur in the device 210 to be diagnosed.
- a partial fault tree has a parent node indicating a failure event and a group of child nodes associated with the parent node and indicating a group of causes of failure.
- the partial fault tree covers all fault causes that cause a fault event to occur.
- the entire fault tree of fault cause data 192 includes partial fault trees of fault (a), fault (b), and fault (c).
- the parent node of failure (a) is associated with the child node of cause (a1) and the child node of cause (a2).
- the failure cause data 192 is created by comprehensively analyzing the design information of the device 210 to be diagnosed, and is stored in the storage unit 190 in advance.
- step S140 Details of step S140 will be explained based on FIG. 8.
- the cause estimation unit 140 selects a parent node that indicates the same failure event as the estimated event from the entire failure tree.
- step S142 the cause estimation unit 140 extracts a partial fault tree having the selected parent node from the entire fault tree.
- a group of failure causes indicated by a group of child nodes of the extracted partial fault tree is a group of presumed causes.
- FIG. 9 shows an overview of step S140.
- Estimated event 182 is failure (a).
- the parent node of fault (a) is selected from the global fault tree.
- a partial fault tree having the parent node of fault (a) is extracted.
- the child node group of the extracted partial fault tree is a child node of cause (a1) and a child node of cause (a2).
- cause (a1) and cause (a2) are a group of presumed causes.
- step S150 the result output unit 150 outputs the diagnosis result data 202.
- Diagnosis result data 202 indicates a presumed event and a group of presumed causes.
- the result output unit 150 displays the presumed event and the presumed cause group on the display.
- Embodiment 2 With regard to a mode for more easily determining estimated events, the main differences from Embodiment 1 will be explained based on FIGS. 10 to 16.
- the configuration of failure diagnosis device 100 is the same as the configuration in the first embodiment. However, the configuration of failure event data 191 is different from the configuration in the first embodiment.
- step S210 the data acquisition unit 110 acquires sensor data 201.
- Step S210 is the same as step S110 in the first embodiment.
- step S220 the time series conversion unit 120 converts the time series of sensor values into feature information for each sensor using the acquired sensor data 201. Specifically, the time series conversion unit 120 determines a time series behavior pattern of sensor values for each sensor. The determined behavior pattern is characteristic information. Behavior patterns indicate trends in changes in sensor values over time. In step S220, a feature information group (behavior pattern group) corresponding to the sensor group 211 is obtained.
- step S222 the time series conversion unit 120 determines the tendency of change in the sensor value during the failure time period relative to the sensor value during the normal time period based on the comparison result for each sensor.
- the determined tendency is a behavior pattern.
- the behavior pattern is determined as follows. Note that an error range is defined in advance for each sensor. However, a common error range may be defined. When many of the sensor values during the failure time period increase beyond the error range, the time series conversion unit 120 determines that the behavior pattern is "increase”. If many of the sensor values during the failure time period have decreased beyond the error range, the time series conversion unit 120 determines that the behavior pattern is "decreased.” If most of the sensor values during the failure time period do not change beyond the error range, the time series conversion unit 120 determines that the behavior pattern is "unchanged.”
- FIG. 12 shows an overview of step S220.
- the behavior pattern of sensor (A) is "increase”.
- the sensor (B) many of the sensor values (B) during the failure time period have decreased beyond the error range (B). In this case, the behavior pattern of sensor (B) is "decrease”.
- the sensor (C) most of the sensor values (C) during the failure time period do not change beyond the error range (C). In this case, the behavior pattern of the sensor (C) is "unchanged".
- the time series conversion unit 120 determines that the behavior pattern is "increase”.
- the time series conversion unit 120 determines that the behavior pattern is "decreasing”.
- the time series conversion unit 120 determines that the behavior pattern is "unchanged”.
- step S230 the event estimation unit 130 estimates a failure event of the diagnosis target device 210 based on the failure event data 191 and the feature information group obtained in step S120.
- step S230 the event estimation unit 130 compares, for each failure event in the failure event data 191, the behavior pattern group associated with the failure event with the behavior pattern group obtained in step S220.
- step S233 the event estimation unit 130 ranks the degree of matching of each behavior pattern group of the failure event data 191. The higher the degree of matching, the higher the ranking.
- step S235 the event estimation unit 130 selects a failure event associated with the selected behavior pattern group from the failure event data 191.
- the selected failure event is a probable event.
- step S240 the cause estimating unit 140 estimates the failure cause group of the diagnosis target device 210 based on the estimated event and the failure cause data 192.
- Step S240 is the same as step S140 in the first embodiment.
- the failure diagnosis device 100 converts sensor data obtained from the device to be diagnosed 210 into a sensor data behavior pattern. After that, the fault diagnosis device 100 compares the sensor data behavior pattern with the fault-sensor value correspondence table (191) and calculates the degree of coincidence.
- the format of the sensor data behavior pattern is simpler than the format of the sensor data waveform used in the first embodiment. Therefore, the computational resources required for comparison can be reduced.
- the failure diagnosis device 100 uses the pattern conversion threshold (error range) of each sensor data at the time of comparison. This makes it possible to ignore fluctuations in values due to factors unrelated to failures (for example, noise).
- the failure diagnosis device 100 includes a processing circuit 109 .
- the processing circuit 109 is hardware that implements the data acquisition section 110, the time series conversion section 120, the event estimation section 130, the cause estimation section 140, and the result output section 150.
- the processing circuit 109 may be dedicated hardware or may be the processor 101 that executes a program stored in the memory 102.
- processing circuit 109 is dedicated hardware, processing circuit 109 is, for example, a single circuit, a composite circuit, a programmed processor, a parallel programmed processor, an ASIC, an FPGA, or a combination thereof.
- ASIC is an abbreviation for Application Specific Integrated Circuit.
- FPGA is an abbreviation for Field Programmable Gate Array.
- the failure diagnosis device 100 may include a plurality of processing circuits that replace the processing circuit 109.
- the functions of the failure diagnosis device 100 can be realized by hardware, software, firmware, or a combination thereof.
- the "unit" of each element of the failure diagnosis device 100 may be read as “process”, “process”, “circuit”, or “circuitry”.
- failure diagnosis device 101 processor, 102 memory, 103 auxiliary storage device, 104 communication device, 105 input/output interface, 109 processing circuit, 110 data acquisition unit, 120 time series conversion unit, 130 event estimation unit, 140 cause estimation unit, 150 result output unit, 181 waveform data group, 182 estimated event, 183 behavior pattern group, 190 storage unit, 191 failure event data, 192 failure cause data, 200 failure diagnosis system, 201 sensor data, 202 diagnosis result data, 209 user, 210 Diagnosis target device, 211 Sensor group.
Landscapes
- Business, Economics & Management (AREA)
- Engineering & Computer Science (AREA)
- Economics (AREA)
- Entrepreneurship & Innovation (AREA)
- Human Resources & Organizations (AREA)
- Marketing (AREA)
- Operations Research (AREA)
- Quality & Reliability (AREA)
- Strategic Management (AREA)
- Tourism & Hospitality (AREA)
- Physics & Mathematics (AREA)
- General Business, Economics & Management (AREA)
- General Physics & Mathematics (AREA)
- Theoretical Computer Science (AREA)
- Testing And Monitoring For Control Systems (AREA)
Abstract
時系列変換部(120)は、センサデータ(201)を用いてセンサごとにセンサ値の時系列を特徴情報に変換する。事象推定部(130)は、故障事象データ(191)から、得られた特徴情報群と類似する特徴情報群に対応付けられた故障事象を、推定事象として選択する。原因推定部(140)は、故障原因データ(192)から、前記推定事象と同じ故障事象に対応付けられた故障原因群を、推定原因群として抽出する。結果出力部(150)は、前記推定事象と前記推定原因群を示す診断結果データ(202)を出力する。
Description
本開示は、機器の故障診断を行う技術に関するものである。
近年、様々な機器がインターネットに接続されるIoTが普及してきている。
IoTの普及により、従来はインターネットに接続されていなかった機器からもネットワークを通じて情報を収集することができるようになった。例えば、機器に設置された多種多様なセンサデータをリアルタイムで取得することが可能になっている。
IoTは、Internet of thingsの略称である。
IoTの普及により、従来はインターネットに接続されていなかった機器からもネットワークを通じて情報を収集することができるようになった。例えば、機器に設置された多種多様なセンサデータをリアルタイムで取得することが可能になっている。
IoTは、Internet of thingsの略称である。
一方、機器の運用時には、継続的に利用可能な状態を保つために、機器の保守を実施する必要がある。
機器に故障が発生すると、保守員は故障診断を行い、診断結果に応じて修理または部品交換などの対処を行う。故障診断では、発生している故障の種別及び故障の原因が特定される。
多数の部品から構成される機器の故障診断を行うには、高度な専門的知見が必要となる。そこで、故障診断を容易にする手法として故障木が用いられる。しかし、一般的な故障木を用いる従来手法では、故障事象と故障原因の間に複雑な中間事象を設定する必要がある。そのため、ユーザの負担が大きくなる。
機器に故障が発生すると、保守員は故障診断を行い、診断結果に応じて修理または部品交換などの対処を行う。故障診断では、発生している故障の種別及び故障の原因が特定される。
多数の部品から構成される機器の故障診断を行うには、高度な専門的知見が必要となる。そこで、故障診断を容易にする手法として故障木が用いられる。しかし、一般的な故障木を用いる従来手法では、故障事象と故障原因の間に複雑な中間事象を設定する必要がある。そのため、ユーザの負担が大きくなる。
特許文献1は故障診断方法を開示している。
この方法では、事象入力用ユーザインタフェースと複数の故障木が、容易に構築可能な記憶部に登録される。そして、ユーザが各故障木に関連する事象について事象の発生有無を入力する。これにより、複雑な中間事象の設定を要することなく、効率的な故障原因の診断が可能になる。
この方法では、事象入力用ユーザインタフェースと複数の故障木が、容易に構築可能な記憶部に登録される。そして、ユーザが各故障木に関連する事象について事象の発生有無を入力する。これにより、複雑な中間事象の設定を要することなく、効率的な故障原因の診断が可能になる。
特許文献1の方法は、故障木を用いて故障原因を絞り込む際に、ユーザからのインタラクティブな情報入力を必要とする。つまり、人手がかかる。
本開示は、ユーザからのインタラクティブな情報入力を必要とせずに故障診断を行えるようにすることを目的とする。
本開示の故障診断装置は、故障が発生した診断対象装置を診断する。
前記故障診断装置は、
前記診断対象装置のセンサ群によって得られセンサごとにセンサ値の時系列を示すセンサデータを取得するデータ取得部と、
取得されたセンサデータを用いて前記センサごとに前記センサ値の前記時系列を前記時系列の特徴を示す特徴情報に変換することによって、前記センサ群に対応する特徴情報群を得る時系列変換部と、
複数の故障事象のそれぞれに対応付けて特徴情報群を示す故障事象データから、得られた特徴情報群と類似する特徴情報群に対応付けられた故障事象を、推定事象として選択する事象推定部と、
前記複数の故障事象のそれぞれに対応付けて故障原因群を示す故障原因データから、前記推定事象と同じ故障事象に対応付けられた故障原因群を、推定原因群として抽出する原因推定部と、
前記推定事象と前記推定原因群を示す診断結果データを出力する結果出力部と、
を備える故障診断装置。
本開示によれば、ユーザからのインタラクティブな情報入力を必要とせずに故障診断を行うことができる。
実施の形態および図面において、同じ要素または対応する要素には同じ符号を付している。説明した要素と同じ符号が付された要素の説明は適宜に省略または簡略化する。図中の矢印はデータの流れ又は処理の流れを主に示している。
実施の形態1.
故障診断システム200について、図1から図9に基づいて説明する。
故障診断システム200について、図1から図9に基づいて説明する。
***構成の説明***
図1に基づいて、故障診断システム200の構成を説明する。
故障診断システム200は、診断対象装置210と、故障診断装置100と、を備える。
図1に基づいて、故障診断システム200の構成を説明する。
故障診断システム200は、診断対象装置210と、故障診断装置100と、を備える。
診断対象装置210は、故障が発生した装置である。
診断対象装置210は、各種計測を行うセンサ群211を具備する。
センサ群211は、1つ以上のセンサである。
センサは、診断対象装置210の状態(温度など)を計測する。計測によって得られる値を、センサ値と称する。
診断対象装置210は、各種計測を行うセンサ群211を具備する。
センサ群211は、1つ以上のセンサである。
センサは、診断対象装置210の状態(温度など)を計測する。計測によって得られる値を、センサ値と称する。
センサデータ201は、センサ群211によって得られるデータである。
センサデータ201は、センサごとにセンサ値の時系列を示す。つまり、センサデータ201は、センサごとに一定期間の各時刻のセンサ値を示す。一定期間には、故障の発生時刻および発生時刻の前後の時間帯が含まれる。
センサデータ201は、センサごとにセンサ値の時系列を示す。つまり、センサデータ201は、センサごとに一定期間の各時刻のセンサ値を示す。一定期間には、故障の発生時刻および発生時刻の前後の時間帯が含まれる。
故障診断装置100は、ネットワークを介して診断対象装置210に接続される。ネットワークの具体例はインターネットである。
故障診断装置100は、センサデータ201に基づいて診断対象装置210を診断し、ユーザ209に診断結果を提示する。例えば、ユーザ209は、故障の対応にあたる保守員である。
診断結果データ202は、診断結果を示すデータである。
故障診断装置100は、センサデータ201に基づいて診断対象装置210を診断し、ユーザ209に診断結果を提示する。例えば、ユーザ209は、故障の対応にあたる保守員である。
診断結果データ202は、診断結果を示すデータである。
図2に基づいて、故障診断装置100の構成を説明する。
故障診断装置100は、プロセッサ101とメモリ102と補助記憶装置103と通信装置104と入出力インタフェース105といったハードウェアを備えるコンピュータである。これらのハードウェアは、信号線を介して互いに接続されている。
故障診断装置100は、プロセッサ101とメモリ102と補助記憶装置103と通信装置104と入出力インタフェース105といったハードウェアを備えるコンピュータである。これらのハードウェアは、信号線を介して互いに接続されている。
プロセッサ101は、演算処理を行うICであり、他のハードウェアを制御する。例えば、プロセッサ101はCPUである。
ICは、Integrated Circuitの略称である。
CPUは、Central Processing Unitの略称である。
ICは、Integrated Circuitの略称である。
CPUは、Central Processing Unitの略称である。
メモリ102は揮発性または不揮発性の記憶装置である。メモリ102は、主記憶装置またはメインメモリとも呼ばれる。例えば、メモリ102はRAMである。メモリ102に記憶されたデータは必要に応じて補助記憶装置103に保存される。
RAMは、Random Access Memoryの略称である。
RAMは、Random Access Memoryの略称である。
補助記憶装置103は不揮発性の記憶装置である。例えば、補助記憶装置103は、ROM、HDD、フラッシュメモリまたはこれらの組み合わせである。補助記憶装置103に記憶されたデータは必要に応じてメモリ102にロードされる。
ROMは、Read Only Memoryの略称である。
HDDは、Hard Disk Driveの略称である。
ROMは、Read Only Memoryの略称である。
HDDは、Hard Disk Driveの略称である。
通信装置104はレシーバ及びトランスミッタである。例えば、通信装置104は通信チップまたはNICである。故障診断装置100の通信は通信装置104を用いて行われる。
NICは、Network Interface Cardの略称である。
NICは、Network Interface Cardの略称である。
入出力インタフェース105は、入力装置および出力装置が接続されるポートである。例えば、入出力インタフェース105はUSB端子であり、入力装置はキーボードおよびマウスであり、出力装置はディスプレイである。故障診断装置100の入出力は入出力インタフェース105を用いて行われる。
USBは、Universal Serial Busの略称である。
USBは、Universal Serial Busの略称である。
故障診断装置100は、データ取得部110と時系列変換部120と事象推定部130と原因推定部140と結果出力部150といった要素を備える。これらの要素はソフトウェアで実現される。
補助記憶装置103には、データ取得部110と時系列変換部120と事象推定部130と原因推定部140と結果出力部150としてコンピュータを機能させるための故障診断プログラムが記憶されている。故障診断プログラムは、メモリ102にロードされて、プロセッサ101によって実行される。
補助記憶装置103には、さらに、OSが記憶されている。OSの少なくとも一部は、メモリ102にロードされて、プロセッサ101によって実行される。
プロセッサ101は、OSを実行しながら、故障診断プログラムを実行する。
OSは、Operating Systemの略称である。
補助記憶装置103には、さらに、OSが記憶されている。OSの少なくとも一部は、メモリ102にロードされて、プロセッサ101によって実行される。
プロセッサ101は、OSを実行しながら、故障診断プログラムを実行する。
OSは、Operating Systemの略称である。
故障診断プログラムの入出力データは記憶部190に記憶される。
メモリ102は記憶部190として機能する。但し、補助記憶装置103、プロセッサ101内のレジスタおよびプロセッサ101内のキャッシュメモリなどの記憶装置が、メモリ102の代わりに、又は、メモリ102と共に、記憶部190として機能してもよい。
メモリ102は記憶部190として機能する。但し、補助記憶装置103、プロセッサ101内のレジスタおよびプロセッサ101内のキャッシュメモリなどの記憶装置が、メモリ102の代わりに、又は、メモリ102と共に、記憶部190として機能してもよい。
故障診断装置100は、プロセッサ101を代替する複数のプロセッサを備えてもよい。
故障診断プログラムは、光ディスクまたはフラッシュメモリ等の不揮発性の記録媒体にコンピュータ読み取り可能に記録(格納)することができる。
***動作の説明***
故障診断システム200の動作の手順は故障診断方法に相当する。また、故障診断システム200の動作の手順は故障診断プログラムによる処理の手順に相当する。
故障診断システム200の動作の手順は故障診断方法に相当する。また、故障診断システム200の動作の手順は故障診断プログラムによる処理の手順に相当する。
図3に基づいて、故障診断方法を説明する。
ステップS110において、データ取得部110は、センサデータ201を取得する。
例えば、故障が発生すると診断対象装置210がセンサデータ201を故障診断装置100へ送信する。そして、データ取得部110は、センサデータ201を受信する。
ステップS110において、データ取得部110は、センサデータ201を取得する。
例えば、故障が発生すると診断対象装置210がセンサデータ201を故障診断装置100へ送信する。そして、データ取得部110は、センサデータ201を受信する。
ステップS120において、時系列変換部120は、取得されたセンサデータ201を用いて、センサごとにセンサ値の時系列を特徴情報に変換する。特徴情報は、センサ値の時系列の特徴を示す。
具体的には、時系列変換部120は、センサごとにセンサ値の時系列を波形化して波形データを生成する。生成された波形データが特徴情報である。
波形データは、センサ値の時系列を表す波形を示す。
ステップS120により、センサ群211に対応する特徴情報群(波形データ群)が得られる。
具体的には、時系列変換部120は、センサごとにセンサ値の時系列を波形化して波形データを生成する。生成された波形データが特徴情報である。
波形データは、センサ値の時系列を表す波形を示す。
ステップS120により、センサ群211に対応する特徴情報群(波形データ群)が得られる。
ステップS130において、事象推定部130は、故障事象データ191と、ステップS120で得られた特徴情報群と、に基づいて診断対象装置210の故障事象を推定する。推定された故障事象を、推定事象と称する。
故障事象データ191は、複数の故障事象のそれぞれに対応付けて特徴情報群を示す。
故障事象データ191は、複数の故障事象のそれぞれに対応付けて特徴情報群を示す。
具体的には、事象推定部130は、ステップS120で得られた特徴情報群と類似する特徴情報群を故障事象データ191から選択する。そして、事象推定部130は、選択された特徴情報群に対応付けられた故障事象を故障事象データ191から選択する。選択された故障事象が推定事象である。
図4に基づいて、故障事象データ191の詳細を説明する。
故障事象データ191は、複数の故障事象のそれぞれに対応付けて波形データ群(特徴情報群)を示す。
例えば、故障事象データ191は表形式のデータである。図4において、縦軸は、複数の故障事象を示している。縦軸において、診断対象装置210で発生する可能性がある故障事象が網羅され、故障事象の一覧が示されている。また、横軸は、センサ群211に対応する波形データ群を示している。横軸において、センサ群211を構成するセンサの一覧が示されている。
故障事象データ191は、診断対象装置210の設計情報を網羅的に分析して作成され、記憶部190に予め記憶される。
故障事象データ191は、複数の故障事象のそれぞれに対応付けて波形データ群(特徴情報群)を示す。
例えば、故障事象データ191は表形式のデータである。図4において、縦軸は、複数の故障事象を示している。縦軸において、診断対象装置210で発生する可能性がある故障事象が網羅され、故障事象の一覧が示されている。また、横軸は、センサ群211に対応する波形データ群を示している。横軸において、センサ群211を構成するセンサの一覧が示されている。
故障事象データ191は、診断対象装置210の設計情報を網羅的に分析して作成され、記憶部190に予め記憶される。
図5に基づいて、ステップS130の詳細を説明する。
ステップS131において、事象推定部130は、故障事象データ191の故障事象ごとに、故障事象に対応付けられた波形データ群を、ステップS120で得られた波形データ群と比較する。
ステップS131において、事象推定部130は、故障事象データ191の故障事象ごとに、故障事象に対応付けられた波形データ群を、ステップS120で得られた波形データ群と比較する。
ステップS132において、事象推定部130は、故障事象ごとに、比較結果に基づいて、故障事象に対応付けられた波形データ群とステップS120で得られた波形データ群の類似度を算出する。
例えば、波形データ群の類似度は次のように算出される。事象推定部130は、センサごとに、ステップS120で得られた波形データと故障事象データ191に示される波形データの類似度を算出し、算出された類似度の統計値(例えば平均)を算出する。算出された統計値が波形データ群の類似度となる。
例えば、波形データ群の類似度は次のように算出される。事象推定部130は、センサごとに、ステップS120で得られた波形データと故障事象データ191に示される波形データの類似度を算出し、算出された類似度の統計値(例えば平均)を算出する。算出された統計値が波形データ群の類似度となる。
ステップS133において、事象推定部130は、故障事象データ191の各波形データ群の類似度を順位付けする。類似度が高いほど順位が高い。
ステップS134において、事象推定部130は、類似度の順位が最も高い波形データ群を選択する。
ステップS135において、事象推定部130は、選択された波形データ群に対応付けられた故障事象を故障事象データ191から選択する。選択された故障事象が推定事象である。
図6に、ステップS130の概要を示す。
波形データ群181は、ステップS120で得られた波形データ群である。
波形データ群181に対する故障(a)の波形データ群の類似度は、90パーセントであり、最も高い。
この場合、故障(a)が推定事象である。
波形データ群181は、ステップS120で得られた波形データ群である。
波形データ群181に対する故障(a)の波形データ群の類似度は、90パーセントであり、最も高い。
この場合、故障(a)が推定事象である。
図3に戻り、ステップS140から説明を続ける。
ステップS140において、原因推定部140は、推定事象と故障原因データ192に基づいて、診断対象装置210の故障原因群を推定する。故障原因群は、1つ以上の故障原因である。推定された故障原因群を、推定原因群と称する。
故障原因データ192は、複数の故障事象のそれぞれに対応付けて故障原因群を示す。
ステップS140において、原因推定部140は、推定事象と故障原因データ192に基づいて、診断対象装置210の故障原因群を推定する。故障原因群は、1つ以上の故障原因である。推定された故障原因群を、推定原因群と称する。
故障原因データ192は、複数の故障事象のそれぞれに対応付けて故障原因群を示す。
具体的には、原因推定部140は、推定事象と同じ故障事象に対応付けられた故障原因群を故障原因データ192から抽出する。抽出された故障原因群が推定原因群である。
図7に基づいて、故障原因データ192の詳細を説明する。
故障原因データ192は、木構造で構成された全体故障木を示すデータである。
全体故障木は、複数の故障事象のそれぞれの部分故障木を含む。全体故障木には、診断対象装置210で発生する可能性がある故障事象が網羅されている。
部分故障木は、故障事象を示す親ノードと、親ノードに関連付けられ故障原因群を示す子ノード群を有する。部分故障木には、故障事象を発生させる故障原因が網羅されている。
図7において、故障原因データ192の全体故障木は、故障(a)と故障(b)と故障(c)のそれぞれの部分故障木を含んでいる。
故障(a)の親ノードは、原因(a1)の子ノードと原因(a2)の子ノードに対応付けられている。
故障原因データ192は、診断対象装置210の設計情報を網羅的に分析して作成され、記憶部190に予め記憶される。
図8に基づいて、ステップS140の詳細を説明する。
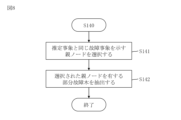
ステップS141において、原因推定部140は、推定事象と同じ故障事象を示す親ノードを全体故障木から選択する。
ステップS141において、原因推定部140は、推定事象と同じ故障事象を示す親ノードを全体故障木から選択する。
ステップS142において、原因推定部140は、選択された親ノードを有する部分故障木を全体故障木から抽出する。
抽出された部分故障木の子ノード群が示す故障原因群が推定原因群である。
抽出された部分故障木の子ノード群が示す故障原因群が推定原因群である。
図9に、ステップS140の概要を示す。
推定事象182は、故障(a)である。
故障(a)の親ノードが全体故障木から選択される。そして、故障(a)の親ノードを有する部分故障木が抽出される。
抽出された部分故障木の子ノード群は、原因(a1)の子ノードと原因(a2)の子ノードである。
この場合、原因(a1)および原因(a2)が推定原因群である。
推定事象182は、故障(a)である。
故障(a)の親ノードが全体故障木から選択される。そして、故障(a)の親ノードを有する部分故障木が抽出される。
抽出された部分故障木の子ノード群は、原因(a1)の子ノードと原因(a2)の子ノードである。
この場合、原因(a1)および原因(a2)が推定原因群である。
図3に戻り、ステップS150を説明する。
ステップS150において、結果出力部150は、診断結果データ202を出力する。
診断結果データ202は、推定事象と推定原因群を示す。
例えば、結果出力部150は、推定事象と推定原因群をディスプレイに表示する。
ステップS150において、結果出力部150は、診断結果データ202を出力する。
診断結果データ202は、推定事象と推定原因群を示す。
例えば、結果出力部150は、推定事象と推定原因群をディスプレイに表示する。
***実施の形態1の効果***
実施の形態1は、IoTによって機器から取得されるセンサデータを用いることで人手を要さずに自動で機器の故障原因を診断するための形態である。
実施の形態1では、診断対象装置210の設計に基づき、故障-センサ値対応表(191)があらかじめ作成され保持される。故障診断装置100は、故障発生時に診断対象装置210から収集したセンサデータ波形を故障-センサ値対応表と突き合わせる。これにより、人手による情報入力の工程が削減され、診断に要する時間の短縮および故障診断の省力化が可能となる。
実施の形態1は、IoTによって機器から取得されるセンサデータを用いることで人手を要さずに自動で機器の故障原因を診断するための形態である。
実施の形態1では、診断対象装置210の設計に基づき、故障-センサ値対応表(191)があらかじめ作成され保持される。故障診断装置100は、故障発生時に診断対象装置210から収集したセンサデータ波形を故障-センサ値対応表と突き合わせる。これにより、人手による情報入力の工程が削減され、診断に要する時間の短縮および故障診断の省力化が可能となる。
実施の形態2.
推定事象をより容易に求める形態について、主に実施の形態1と異なる点を図10から図16に基づいて説明する。
推定事象をより容易に求める形態について、主に実施の形態1と異なる点を図10から図16に基づいて説明する。
***構成の説明***
故障診断装置100の構成は、実施の形態1における構成と同じである。
但し、故障事象データ191の構成が、実施の形態1における構成と異なる。
故障診断装置100の構成は、実施の形態1における構成と同じである。
但し、故障事象データ191の構成が、実施の形態1における構成と異なる。
***動作の説明***
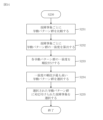
図10に基づいて、故障診断方法を説明する。
ステップS210において、データ取得部110は、センサデータ201を取得する。
ステップS210は、実施の形態1のステップS110と同じである。
図10に基づいて、故障診断方法を説明する。
ステップS210において、データ取得部110は、センサデータ201を取得する。
ステップS210は、実施の形態1のステップS110と同じである。
ステップS220において、時系列変換部120は、取得されたセンサデータ201を用いて、センサごとにセンサ値の時系列を特徴情報に変換する。
具体的には、時系列変換部120は、センサごとにセンサ値の時系列の挙動パターンを判定する。判定された挙動パターンが特徴情報である。
挙動パターンは、時間の経過に伴うセンサ値の変化の傾向を示す。
ステップS220により、センサ群211に対応する特徴情報群(挙動パターン群)が得られる。
具体的には、時系列変換部120は、センサごとにセンサ値の時系列の挙動パターンを判定する。判定された挙動パターンが特徴情報である。
挙動パターンは、時間の経過に伴うセンサ値の変化の傾向を示す。
ステップS220により、センサ群211に対応する特徴情報群(挙動パターン群)が得られる。
図11に基づいて、ステップS220の詳細を説明する。
センサデータ201は、開始時刻から終了時刻までのセンサ値の時系列を示す。
開始時刻は、故障の発生時刻より前の時刻である。開始時刻から故障の発生時刻までの時間帯を、正常時間帯と称する。
終了時刻は、故障の発生時刻より後の時刻である。故障の発生時刻から終了時刻までの時間帯を、故障時間帯と称する。
センサデータ201は、開始時刻から終了時刻までのセンサ値の時系列を示す。
開始時刻は、故障の発生時刻より前の時刻である。開始時刻から故障の発生時刻までの時間帯を、正常時間帯と称する。
終了時刻は、故障の発生時刻より後の時刻である。故障の発生時刻から終了時刻までの時間帯を、故障時間帯と称する。
ステップS221において、時系列変換部120は、センサごとに故障時間帯のセンサ値を正常時間帯のセンサ値と比較する。
ステップS222において、時系列変換部120は、センサごとに比較結果に基づいて正常時間帯のセンサ値に対する故障時間帯のセンサ値の変化の傾向を判定する。判定された傾向が挙動パターンである。
挙動パターンは、以下のように判定される。なお、センサごとに誤差範囲が予め定義される。但し、共通の誤差範囲が定義されてもよい。
故障時間帯のセンサ値の多くが誤差範囲を超えて増加している場合、時系列変換部120は、挙動パターンが「増加」であると判定する。
故障時間帯のセンサ値の多くが誤差範囲を超えて減少している場合、時系列変換部120は、挙動パターンが「減少」であると判定する。
故障時間帯のセンサ値の多くが誤差範囲を超えて変化していない場合、時系列変換部120は、挙動パターンが「不変」であると判定する。
故障時間帯のセンサ値の多くが誤差範囲を超えて増加している場合、時系列変換部120は、挙動パターンが「増加」であると判定する。
故障時間帯のセンサ値の多くが誤差範囲を超えて減少している場合、時系列変換部120は、挙動パターンが「減少」であると判定する。
故障時間帯のセンサ値の多くが誤差範囲を超えて変化していない場合、時系列変換部120は、挙動パターンが「不変」であると判定する。
図12に、ステップS220の概要を示す。
センサ(A)について、故障時間帯のセンサ値(A)の多くは誤差範囲(A)を超えて増加している。この場合、センサ(A)の挙動パターンは「増加」である。
センサ(B)について、故障時間帯のセンサ値(B)の多くは誤差範囲(B)を超えて減少している。この場合、センサ(B)の挙動パターンは「減少」である。
センサ(C)について、故障時間帯のセンサ値(C)の多くは誤差範囲(C)を超えて変化していない。この場合、センサ(C)の挙動パターンは「不変」である。
センサ(A)について、故障時間帯のセンサ値(A)の多くは誤差範囲(A)を超えて増加している。この場合、センサ(A)の挙動パターンは「増加」である。
センサ(B)について、故障時間帯のセンサ値(B)の多くは誤差範囲(B)を超えて減少している。この場合、センサ(B)の挙動パターンは「減少」である。
センサ(C)について、故障時間帯のセンサ値(C)の多くは誤差範囲(C)を超えて変化していない。この場合、センサ(C)の挙動パターンは「不変」である。
挙動パターンの判定について補足する。挙動パターンは、例えば、以下の条件で判定される。
誤差範囲の上限値を「m+」と記し、誤差範囲の下限値を「m-」と記す。故障時間帯にN個のセンサ値(x1~xN)がある。
時系列変換部120は、xn>m+を満たすセンサ値xnの個数(a)と、m->xnを満たすセンサ値xnの個数(b)と、m+>xn>m-を満たすセンサ値xnの個数(c)と、を数える。そして、時系列変換部120は、個数(a)と個数(b)と個数(c)を比較する。
個数(a)が最も多い場合、時系列変換部120は、挙動パターンが「増加」であると判定する。
個数(b)が最も多い場合、時系列変換部120は、挙動パターンが「減少」であると判定する。
個数(c)が最も多い場合、時系列変換部120は、挙動パターンが「不変」であると判定する。
図10に戻り、ステップS230から説明を続ける。
ステップS230において、事象推定部130は、故障事象データ191と、ステップS120で得られた特徴情報群と、に基づいて診断対象装置210の故障事象を推定する。
ステップS230において、事象推定部130は、故障事象データ191と、ステップS120で得られた特徴情報群と、に基づいて診断対象装置210の故障事象を推定する。
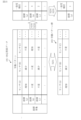
図13に基づいて、故障事象データ191の詳細を説明する。
故障事象データ191は、複数の故障事象のそれぞれに対応付けて挙動パターン群(特徴情報群)を示す。
例えば、故障事象データ191は表形式のデータである。図13において、縦軸は、複数の故障事象を示している。縦軸において、診断対象装置210で発生する可能性がある故障事象が網羅され、故障事象の一覧が示されている。また、横軸は、センサ群211に対応する挙動パターン群を示している。横軸において、センサ群211を構成するセンサの一覧が示されている。
故障事象データ191は、診断対象装置210の設計情報を網羅的に分析して作成され、記憶部190に予め記憶される。
故障事象データ191は、複数の故障事象のそれぞれに対応付けて挙動パターン群(特徴情報群)を示す。
例えば、故障事象データ191は表形式のデータである。図13において、縦軸は、複数の故障事象を示している。縦軸において、診断対象装置210で発生する可能性がある故障事象が網羅され、故障事象の一覧が示されている。また、横軸は、センサ群211に対応する挙動パターン群を示している。横軸において、センサ群211を構成するセンサの一覧が示されている。
故障事象データ191は、診断対象装置210の設計情報を網羅的に分析して作成され、記憶部190に予め記憶される。
図14に基づいて、ステップS230の詳細を説明する。
ステップS231において、事象推定部130は、故障事象データ191の故障事象ごとに、故障事象に対応付けられた挙動パターン群を、ステップS220で得られた挙動パターン群と比較する。
ステップS231において、事象推定部130は、故障事象データ191の故障事象ごとに、故障事象に対応付けられた挙動パターン群を、ステップS220で得られた挙動パターン群と比較する。
ステップS232において、事象推定部130は、故障事象ごとに、比較結果に基づいて、故障事象に対応付けられた挙動パターン群とステップS220で得られた挙動パターン群の一致度を算出する。
例えば、挙動パターン群の一致度は、一致する挙動パターンの個数である。
例えば、挙動パターン群の一致度は、一致する挙動パターンの個数である。
ステップS233において、事象推定部130は、故障事象データ191の各挙動パターン群の一致度を順位付けする。一致度が高いほど順位が高い。
ステップS234において、事象推定部130は、一致度の順位が最も高い挙動パターン群を選択する。
ステップS235において、事象推定部130は、選択された挙動パターン群に対応付けられた故障事象を故障事象データ191から選択する。選択された故障事象が推定事象である。
図15に、ステップS230の概要を示す。
挙動パターン群183は、ステップS220で得られた挙動パターン群である。
挙動パターン群183に対する故障(a)の挙動パターンの一致度が最も高い。
この場合、故障(a)が推定事象である。
挙動パターン群183は、ステップS220で得られた挙動パターン群である。
挙動パターン群183に対する故障(a)の挙動パターンの一致度が最も高い。
この場合、故障(a)が推定事象である。
図10に戻り、ステップS240から説明を続ける。
ステップS240において、原因推定部140は、推定事象と故障原因データ192に基づいて、診断対象装置210の故障原因群を推定する。
ステップS240は、実施の形態1のステップS140と同じである。
ステップS240において、原因推定部140は、推定事象と故障原因データ192に基づいて、診断対象装置210の故障原因群を推定する。
ステップS240は、実施の形態1のステップS140と同じである。
ステップS250において、結果出力部150は、診断結果データ202を出力する。
ステップS250は、実施の形態1のステップS150と同じである。
ステップS250は、実施の形態1のステップS150と同じである。
***実施の形態2の効果***
故障診断装置100は、診断対象装置210から得られたセンサデータをセンサデータ挙動パターンに変換する。その後、故障診断装置100は、センサデータ挙動パターンと故障-センサ値対応表(191)を比較し、一致度の算出を行う。
センサデータ挙動パターンの形式は、実施の形態1で用いられるセンサデータ波形の形式よりも単純である。そのため、比較時の計算資源を低減できる。
故障診断装置100は、比較時に各センサデータのパターン変換閾値(誤差範囲)を用いる。これにより、故障とは無関係な要因(例えばノイズ)による値の変動を無視することができる。
故障診断装置100は、診断対象装置210から得られたセンサデータをセンサデータ挙動パターンに変換する。その後、故障診断装置100は、センサデータ挙動パターンと故障-センサ値対応表(191)を比較し、一致度の算出を行う。
センサデータ挙動パターンの形式は、実施の形態1で用いられるセンサデータ波形の形式よりも単純である。そのため、比較時の計算資源を低減できる。
故障診断装置100は、比較時に各センサデータのパターン変換閾値(誤差範囲)を用いる。これにより、故障とは無関係な要因(例えばノイズ)による値の変動を無視することができる。
***実施の形態の補足***
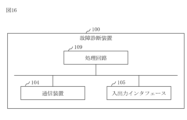
図16に基づいて、故障診断装置100のハードウェア構成を説明する。
故障診断装置100は処理回路109を備える。
処理回路109は、データ取得部110と時系列変換部120と事象推定部130と原因推定部140と結果出力部150を実現するハードウェアである。
処理回路109は、専用のハードウェアであってもよいし、メモリ102に格納されるプログラムを実行するプロセッサ101であってもよい。
図16に基づいて、故障診断装置100のハードウェア構成を説明する。
故障診断装置100は処理回路109を備える。
処理回路109は、データ取得部110と時系列変換部120と事象推定部130と原因推定部140と結果出力部150を実現するハードウェアである。
処理回路109は、専用のハードウェアであってもよいし、メモリ102に格納されるプログラムを実行するプロセッサ101であってもよい。
処理回路109が専用のハードウェアである場合、処理回路109は、例えば、単一回路、複合回路、プログラム化したプロセッサ、並列プログラム化したプロセッサ、ASIC、FPGAまたはこれらの組み合わせである。
ASICは、Application Specific Integrated Circuitの略称である。
FPGAは、Field Programmable Gate Arrayの略称である。
ASICは、Application Specific Integrated Circuitの略称である。
FPGAは、Field Programmable Gate Arrayの略称である。
故障診断装置100は、処理回路109を代替する複数の処理回路を備えてもよい。
処理回路109において、一部の機能が専用のハードウェアで実現されて、残りの機能がソフトウェアまたはファームウェアで実現されてもよい。
このように、故障診断装置100の機能はハードウェア、ソフトウェア、ファームウェアまたはこれらの組み合わせで実現することができる。
各実施の形態は、好ましい形態の例示であり、本開示の技術的範囲を制限することを意図するものではない。各実施の形態は、部分的に実施してもよいし、他の形態と組み合わせて実施してもよい。フローチャート等を用いて説明した手順は、適宜に変更してもよい。
故障診断装置100の各要素の「部」は、「処理」、「工程」、「回路」または「サーキットリ」と読み替えてもよい。
100 故障診断装置、101 プロセッサ、102 メモリ、103 補助記憶装置、104 通信装置、105 入出力インタフェース、109 処理回路、110 データ取得部、120 時系列変換部、130 事象推定部、140 原因推定部、150 結果出力部、181 波形データ群、182 推定事象、183 挙動パターン群、190 記憶部、191 故障事象データ、192 故障原因データ、200 故障診断システム、201 センサデータ、202 診断結果データ、209 ユーザ、210 診断対象装置、211 センサ群。
Claims (9)
- 故障が発生した診断対象装置を診断する故障診断装置であり、
前記診断対象装置のセンサ群によって得られセンサごとにセンサ値の時系列を示すセンサデータを取得するデータ取得部と、
取得されたセンサデータを用いて前記センサごとに前記センサ値の前記時系列を前記時系列の特徴を示す特徴情報に変換することによって、前記センサ群に対応する特徴情報群を得る時系列変換部と、
複数の故障事象のそれぞれに対応付けて特徴情報群を示す故障事象データから、得られた特徴情報群と類似する特徴情報群に対応付けられた故障事象を、推定事象として選択する事象推定部と、
前記複数の故障事象のそれぞれに対応付けて故障原因群を示す故障原因データから、前記推定事象と同じ故障事象に対応付けられた故障原因群を、推定原因群として抽出する原因推定部と、
前記推定事象と前記推定原因群を示す診断結果データを出力する結果出力部と、
を備える故障診断装置。 - 前記故障事象データは、前記複数の故障事象のそれぞれに対応付けて波形データ群を前記特徴情報群として示し、
前記時系列変換部は、前記センサごとに前記時系列を波形化して波形データを前記特徴情報として生成することによって、前記センサ群に対応する波形データ群を前記特徴情報群として得て、
前記事象推定部は、
前記故障事象データの前記故障事象ごとに、前記故障事象に対応付けられた波形データ群を、得られた波形データ群と比較し、
前記故障事象データの前記故障事象ごとに、前記故障事象に対応付けられた波形データ群と得られた波形データ群の類似度を算出し、
前記故障事象データの各波形データ群の類似度を順位付けし、
前記故障事象データから、類似度の順位が最も高い波形データ群を選択し、
選択された波形データ群に対応付けられた故障事象を前記推定事象として選択する
請求項1に記載の故障診断装置。 - 前記故障事象データは、前記複数の故障事象のそれぞれに対応付けて挙動パターン群を前記特徴情報群として示し、
前記時系列変換部は、前記センサごとに前記時系列の挙動パターンを前記特徴情報として判定することによって、前記センサ群に対応する挙動パターン群を前記特徴情報群として得て、
前記事象推定部は、
前記故障事象データの前記故障事象ごとに、前記故障事象に対応付けられた挙動パターン群を、得られた挙動パターン群と比較し、
前記故障事象データの前記故障事象ごとに、前記故障事象に対応付けられた挙動パターン群と得られた挙動パターン群の一致度を算出し、
前記故障事象データの各挙動パターン群の一致度を順位付けし、
前記故障事象データから、一致度の順位が最も高い挙動パターン群を選択し、
選択された挙動パターン群に対応付けられた故障事象を前記推定事象として選択する
請求項1に記載の故障診断装置。 - 前記センサデータは、前記故障の発生時刻より前の開始時刻から前記故障の前記発生時刻より後の終了時刻までの前記センサ値を前記時系列として示し、
前記時系列変換部は、前記発生時刻から前記終了時刻までの故障時間帯の前記センサ値を前記開始時刻から前記発生時刻までの正常時間帯の前記センサ値と比較し、前記正常時間帯の前記センサ値に対する前記故障時間帯の前記センサ値の変化の傾向を前記挙動パターンとして判定する
請求項3に記載の故障診断装置。 - 前記時系列変換部は、
前記故障時間帯の前記センサ値の多くが誤差範囲を超えて増加している場合、前記挙動パターンが増加であると判定し、
前記故障時間帯の前記センサ値の多くが前記誤差範囲を超えて減少している場合、前記挙動パターンが減少であると判定し、
前記故障時間帯の前記センサ値の多くが前記誤差範囲を超えて変化していない場合、前記挙動パターンが不変であると判定する
請求項4に記載の故障診断装置。 - 前記時系列変換部は、前記センサごとに定義された前記誤差範囲を用いて前記センサごとに前記挙動パターンを判定する
請求項5に記載の故障診断装置。 - 前記故障原因データは、木構造で構成された全体故障木を示すデータであり、
前記全体故障木は、前記複数の故障事象のそれぞれの部分故障木を含み、
前記部分故障木は、前記故障事象を示す親ノードと、前記親ノードに関連付けられ前記故障原因群を示す子ノード群を有し、
前記原因推定部は、
前記推定事象と同じ故障事象を示す親ノードを前記全体故障木から選択し、
前記全体故障木から、選択された親ノードを有する部分故障木を前記推定事象と前記推定原因群を示す部分故障木として抽出する
請求項1から請求項6のいずれか1項に記載の故障診断装置。 - 故障が発生した診断対象装置を診断する故障診断方法であり、
前記診断対象装置のセンサ群によって得られセンサごとにセンサ値の時系列を示すセンサデータを取得し、
取得されたセンサデータを用いて前記センサごとに前記センサ値の前記時系列を前記時系列の特徴を示す特徴情報に変換することによって、前記センサ群に対応する特徴情報群を得て、
複数の故障事象のそれぞれに対応付けて特徴情報群を示す故障事象データから、得られた特徴情報群と類似する特徴情報群に対応付けられた故障事象を、推定事象として選択し、
前記複数の故障事象のそれぞれに対応付けて故障原因群を示す故障原因データから、前記推定事象と同じ故障事象に対応付けられた故障原因群を、推定原因群として抽出し、
前記推定事象と前記推定原因群を示す診断結果データを出力する
故障診断方法。 - 故障が発生した診断対象装置を診断するための故障診断プログラムであり、
前記診断対象装置のセンサ群によって得られセンサごとにセンサ値の時系列を示すセンサデータを取得するデータ取得処理と、
取得されたセンサデータを用いて前記センサごとに前記センサ値の前記時系列を前記時系列の特徴を示す特徴情報に変換することによって、前記センサ群に対応する特徴情報群を得る時系列変換処理と、
複数の故障事象のそれぞれに対応付けて特徴情報群を示す故障事象データから、得られた特徴情報群と類似する特徴情報群に対応付けられた故障事象を、推定事象として選択する事象推定処理と、
前記複数の故障事象のそれぞれに対応付けて故障原因群を示す故障原因データから、前記推定事象と同じ故障事象に対応付けられた故障原因群を、推定原因群として抽出する原因推定処理と、
前記推定事象と前記推定原因群を示す診断結果データを出力する結果出力処理と、
をコンピュータに実行させるための故障診断プログラム。
Priority Applications (2)
| Application Number | Priority Date | Filing Date | Title |
|---|---|---|---|
| JP2022570104A JPWO2023238366A1 (ja) | 2022-06-10 | 2022-06-10 | |
| PCT/JP2022/023414 WO2023238366A1 (ja) | 2022-06-10 | 2022-06-10 | 故障診断装置、故障診断方法および故障診断プログラム |
Applications Claiming Priority (1)
| Application Number | Priority Date | Filing Date | Title |
|---|---|---|---|
| PCT/JP2022/023414 WO2023238366A1 (ja) | 2022-06-10 | 2022-06-10 | 故障診断装置、故障診断方法および故障診断プログラム |
Publications (1)
| Publication Number | Publication Date |
|---|---|
| WO2023238366A1 true WO2023238366A1 (ja) | 2023-12-14 |
Family
ID=89117786
Family Applications (1)
| Application Number | Title | Priority Date | Filing Date |
|---|---|---|---|
| PCT/JP2022/023414 WO2023238366A1 (ja) | 2022-06-10 | 2022-06-10 | 故障診断装置、故障診断方法および故障診断プログラム |
Country Status (2)
| Country | Link |
|---|---|
| JP (1) | JPWO2023238366A1 (ja) |
| WO (1) | WO2023238366A1 (ja) |
Citations (3)
| Publication number | Priority date | Publication date | Assignee | Title |
|---|---|---|---|---|
| JP2015108375A (ja) * | 2013-12-05 | 2015-06-11 | ゼネラル・エレクトリック・カンパニイ | 故障した燃焼器を検出するためのシステムおよび方法 |
| JP2015176514A (ja) * | 2014-03-18 | 2015-10-05 | 株式会社日立製作所 | プラント事故時運転支援システム |
| JP2019191852A (ja) * | 2018-04-24 | 2019-10-31 | 株式会社日立製作所 | 故障診断装置、故障診断方法並びに故障診断装置が適用された機械 |
-
2022
- 2022-06-10 WO PCT/JP2022/023414 patent/WO2023238366A1/ja unknown
- 2022-06-10 JP JP2022570104A patent/JPWO2023238366A1/ja active Pending
Patent Citations (3)
| Publication number | Priority date | Publication date | Assignee | Title |
|---|---|---|---|---|
| JP2015108375A (ja) * | 2013-12-05 | 2015-06-11 | ゼネラル・エレクトリック・カンパニイ | 故障した燃焼器を検出するためのシステムおよび方法 |
| JP2015176514A (ja) * | 2014-03-18 | 2015-10-05 | 株式会社日立製作所 | プラント事故時運転支援システム |
| JP2019191852A (ja) * | 2018-04-24 | 2019-10-31 | 株式会社日立製作所 | 故障診断装置、故障診断方法並びに故障診断装置が適用された機械 |
Also Published As
| Publication number | Publication date |
|---|---|
| JPWO2023238366A1 (ja) | 2023-12-14 |
Similar Documents
| Publication | Publication Date | Title |
|---|---|---|
| WO2016101690A1 (zh) | 基于时间序列分析的输变电设备的状态监测数据清洗方法 | |
| US10789120B2 (en) | Preprocessor and abnormality predictor diagnosis system | |
| CN111459700A (zh) | 设备故障的诊断方法、诊断装置、诊断设备及存储介质 | |
| CN112449696B (zh) | 时序数据诊断装置、追加学习方法及程序 | |
| JP6088131B2 (ja) | タービン性能診断システム及び方法 | |
| JP6886870B2 (ja) | プラント運転監視システム及びプラント運転監視方法 | |
| WO2011138911A1 (ja) | 障害分析装置、障害分析方法および記録媒体 | |
| US20150046757A1 (en) | Performance Metrics of a Computer System | |
| JP6164311B1 (ja) | 情報処理装置、情報処理方法、及び、プログラム | |
| JP7126256B2 (ja) | 異常診断装置、異常診断方法、及びプログラム | |
| US20200285807A1 (en) | Complex system anomaly detection based on discrete event sequences | |
| US20190265088A1 (en) | System analysis method, system analysis apparatus, and program | |
| JP6492555B2 (ja) | 異常診断方法、異常診断装置及び異常診断プログラム | |
| KR101960755B1 (ko) | 미취득 전력 데이터 생성 방법 및 장치 | |
| US11378944B2 (en) | System analysis method, system analysis apparatus, and program | |
| WO2023238366A1 (ja) | 故障診断装置、故障診断方法および故障診断プログラム | |
| WO2019049521A1 (ja) | リスク評価装置、リスク評価システム、リスク評価方法、リスク評価プログラム、及び、データ構造 | |
| JP2009110262A (ja) | フィルタ装置、フィルタ装置のフィルタリング方法およびフィルタリングプログラム | |
| JP7437163B2 (ja) | 診断装置、診断方法およびプログラム | |
| JP7293156B2 (ja) | 情報処理装置、情報処理方法およびプログラム | |
| US20220406103A1 (en) | Fault diagnosis device, fault diagnosis system, fault diagnosis method, and fault diagnosis program | |
| KR20230075150A (ko) | 시스템 건전성을 관리하기 위한 방법 및 장치 | |
| JP7450820B1 (ja) | 要因推定装置、要因推定方法および要因推定プログラム | |
| WO2019049522A1 (ja) | リスク評価装置、リスク評価システム、リスク評価方法、及び、リスク評価プログラム | |
| KR102497374B1 (ko) | 비정상 검출 시스템, 비정상 검출 방법 및 기록 매체에 저장된 비정상 검출 프로그램 |
Legal Events
| Date | Code | Title | Description |
|---|---|---|---|
| 121 | Ep: the epo has been informed by wipo that ep was designated in this application |
Ref document number: 22945866 Country of ref document: EP Kind code of ref document: A1 |