WO2023136102A1 - 光計測方法、光計測装置、データ処理装置及びプログラム - Google Patents
光計測方法、光計測装置、データ処理装置及びプログラム Download PDFInfo
- Publication number
- WO2023136102A1 WO2023136102A1 PCT/JP2022/047667 JP2022047667W WO2023136102A1 WO 2023136102 A1 WO2023136102 A1 WO 2023136102A1 JP 2022047667 W JP2022047667 W JP 2022047667W WO 2023136102 A1 WO2023136102 A1 WO 2023136102A1
- Authority
- WO
- WIPO (PCT)
- Prior art keywords
- frequency
- display
- interest
- light
- sampling frequency
- Prior art date
- Legal status (The legal status is an assumption and is not a legal conclusion. Google has not performed a legal analysis and makes no representation as to the accuracy of the status listed.)
- Ceased
Links
Images


Classifications
-
- G—PHYSICS
- G01—MEASURING; TESTING
- G01J—MEASUREMENT OF INTENSITY, VELOCITY, SPECTRAL CONTENT, POLARISATION, PHASE OR PULSE CHARACTERISTICS OF INFRARED, VISIBLE OR ULTRAVIOLET LIGHT; COLORIMETRY; RADIATION PYROMETRY
- G01J1/00—Photometry, e.g. photographic exposure meter
- G01J1/42—Photometry, e.g. photographic exposure meter using electric radiation detectors
- G01J1/44—Electric circuits
-
- G—PHYSICS
- G01—MEASURING; TESTING
- G01J—MEASUREMENT OF INTENSITY, VELOCITY, SPECTRAL CONTENT, POLARISATION, PHASE OR PULSE CHARACTERISTICS OF INFRARED, VISIBLE OR ULTRAVIOLET LIGHT; COLORIMETRY; RADIATION PYROMETRY
- G01J11/00—Measuring the characteristics of individual optical pulses or of optical pulse trains
-
- G—PHYSICS
- G01—MEASURING; TESTING
- G01J—MEASUREMENT OF INTENSITY, VELOCITY, SPECTRAL CONTENT, POLARISATION, PHASE OR PULSE CHARACTERISTICS OF INFRARED, VISIBLE OR ULTRAVIOLET LIGHT; COLORIMETRY; RADIATION PYROMETRY
- G01J3/00—Spectrometry; Spectrophotometry; Monochromators; Measuring colours
- G01J3/28—Investigating the spectrum
- G01J3/42—Absorption spectrometry; Double beam spectrometry; Flicker spectrometry; Reflection spectrometry
- G01J3/433—Modulation spectrometry; Derivative spectrometry
- G01J3/4338—Frequency modulated spectrometry
-
- G—PHYSICS
- G01—MEASURING; TESTING
- G01J—MEASUREMENT OF INTENSITY, VELOCITY, SPECTRAL CONTENT, POLARISATION, PHASE OR PULSE CHARACTERISTICS OF INFRARED, VISIBLE OR ULTRAVIOLET LIGHT; COLORIMETRY; RADIATION PYROMETRY
- G01J3/00—Spectrometry; Spectrophotometry; Monochromators; Measuring colours
- G01J3/46—Measurement of colour; Colour measuring devices, e.g. colorimeters
- G01J3/50—Measurement of colour; Colour measuring devices, e.g. colorimeters using electric radiation detectors
- G01J3/506—Measurement of colour; Colour measuring devices, e.g. colorimeters using electric radiation detectors measuring the colour produced by screens, monitors, displays or CRTs
-
- G—PHYSICS
- G01—MEASURING; TESTING
- G01M—TESTING STATIC OR DYNAMIC BALANCE OF MACHINES OR STRUCTURES; TESTING OF STRUCTURES OR APPARATUS, NOT OTHERWISE PROVIDED FOR
- G01M11/00—Testing of optical apparatus; Testing structures by optical methods not otherwise provided for
-
- H—ELECTRICITY
- H04—ELECTRIC COMMUNICATION TECHNIQUE
- H04N—PICTORIAL COMMUNICATION, e.g. TELEVISION
- H04N17/00—Diagnosis, testing or measuring for television systems or their details
- H04N17/04—Diagnosis, testing or measuring for television systems or their details for receivers
Definitions
- the present invention relates to an optical measurement method, an optical measurement device, a data processing device, and a program used for measuring optical waveforms of displays.
- the light emission waveform is becoming more complex as the function and performance of the display improve.
- OLED Organic Light-Emitting Diode
- light emission control that combines not only amplitude modulation but also pulse width modulation is adopted for gradation control. Emissions with complex waveforms are common.
- pulse width modulation a plurality of pulse light emission controls are performed in one frame period (vertical synchronization period), and the light emission waveform is much faster than the image update period.
- a display color analyzer for example, CA-410 manufactured by Konica Minolta, Inc.
- CA-410 manufactured by Konica Minolta, Inc.
- Such a display color analyzer has an internal optical sensor equivalent to spectral responsivity to acquire fluctuations in stimulus values.
- a sequential acquisition method that acquires instantaneous values
- an integral acquisition method that acquires integral values over a predetermined period of time.
- the sequential acquisition method is excellent in high speed, while the integral method is excellent in low luminance measurement performance.
- the display brightness range of displays has been expanding more and more in recent years.
- the emergence of self-luminous devices such as OLEDs has made it possible to control light in the extremely low luminance range, so the display luminance has greatly expanded to the low luminance side.
- Patent Document 1 discloses a technique for determining a measurement time value by high-speed scanning in an optical measurement device (spectroscope) equipped with an array detector, and enabling synchronization of temporally discontinuous illumination light sources. disclosed.
- the light emission waveform to be measured is becoming faster as the display evolves.
- the amount of oversampling decreases in the display light measurement. This drop means that the acquired waveform is coarser with respect to the luminescence response.
- Patent Document 1 does not describe the optical waveform measurement or the above-mentioned problems related to the optical waveform measurement, and therefore, even if Patent Document 1 is referred to, the above problems cannot be solved.
- An object of the present invention is to provide an optical measurement method, an optical measurement device, a data processing device, and a program capable of performing optical waveform measurement with high accuracy.
- stimulus value acquisition means for receiving light from the display and continuously acquiring intensity corresponding to the stimulus value at regular time intervals corresponding to a predetermined sampling frequency; setting means for setting the light amount fluctuation frequency of the display as a frequency of interest; determining means for determining the sampling frequency to be a natural number multiple of the frequency of interest set by the setting means;
- the display light measurement device according to the above item 7 or 8, wherein the frequency of interest is different from the frequency of the vertical synchronization signal of the display and is greater than the frequency of the vertical synchronization signal.
- the display light measurement device according to any one of the items 7 to 9, wherein the sampling frequency is 5 to 100 times the frequency of interest.
- the determining means can set at least one of an upper limit value and a lower limit value of the sampling frequency.
- the stimulus value acquiring means acquires an intensity corresponding to the stimulus value by an integral method.
- the display light measuring device according to any one of the above items 7 to 12, further comprising detecting means for detecting a light amount fluctuation frequency of the light of the display in order to determine the frequency of interest.
- a data processing device for receiving light from a display and determining a sampling frequency for continuously acquiring an intensity corresponding to a stimulus value at predetermined time intervals corresponding to a predetermined sampling frequency, setting means for setting the light amount fluctuation frequency of the display as a frequency of interest; determining means for determining the sampling frequency to be a natural number multiple of the frequency of interest set by the setting means;
- a data processing device with The data processing apparatus according to (14) above, wherein the frequency of interest is different from the frequency of the vertical synchronization signal of the display and is higher than the frequency of the vertical synchronization signal.
- sampling frequency is 5 to 100 times the frequency of interest.
- the determining means can set at least one of an upper limit value and a lower limit value of the sampling frequency.
- the stimulus value acquiring means acquires an intensity corresponding to the stimulus value by an integral method.
- the light of the display is received, and the intensity corresponding to the stimulus value is continuously obtained at regular time intervals corresponding to the predetermined sampling frequency.
- This sampling frequency is determined to be a natural number multiple of the frequency of interest when the frequency of fluctuations in light intensity of the display is the frequency of interest.
- the S/N of the acquired data can be improved.
- the frequency or period of interest can be set, and the sampling frequency can be determined to be a natural number multiple of the set frequency of interest.
- the program according to the present invention it is possible to cause a computer to execute the process of setting the frequency or period of interest and determining the sampling frequency so as to be a natural number multiple of the set frequency of interest.
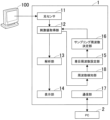
- FIG. 1 is a block diagram showing the functional configuration of an optical measurement device according to one embodiment of the present invention
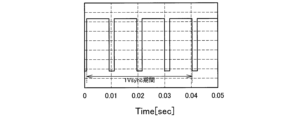
- FIG. FIG. 3 is a waveform diagram of a display control signal (ideal conditions);
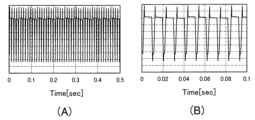
- A) is a signal holding voltage waveform diagram in a control circuit of the display, and
- B) is an enlarged view of a part thereof.
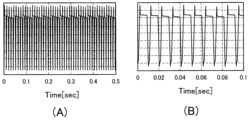
- A) is a waveform diagram showing an example of an optical waveform acquisition result in this embodiment, and (B) is an enlarged view of a part thereof.
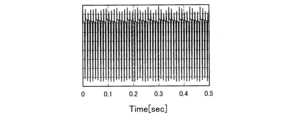
- FIG. 5 is a waveform diagram showing an example of optical waveform acquisition results in a conventional example;
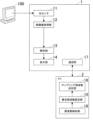
- FIG. 10 is a waveform diagram showing an example of optical waveform acquisition results when the sampling frequency is synchronized with the vertical synchronization signal; It is a block diagram showing a functional configuration of an optical measurement device according to another embodiment of the present invention. 1 is a block diagram showing the functional configuration of a data processing device according to one embodiment of the present invention; FIG.
- FIG. 1 is a block diagram showing the functional configuration of an optical measurement device 1 according to one embodiment of the invention.
- the optical measurement device 1 includes an optical sensor 11, a stimulus value acquisition unit 12, an analysis unit 13, a display unit 14, a target frequency setting unit 15, a sampling frequency determination unit 16, and a communication unit. 17.
- the optical sensor 11 is a light-receiving sensor that receives light emitted from the display 100, which is the object to be measured. It has a function of continuously acquiring data at regular time intervals and converting it into continuous data of stimulus value intensity.
- the optical sensor 21 may be of a tristimulus value direct reading type or a spectral type.
- the converted stimulus values include, for example, luminance, chromaticity (xy), and tristimulus values represented by XYZ. Filtering may be performed to remove noise in the continuous data conversion of stimulus values. For example, moving average processing that utilizes data before and after may be applied.
- the stimulus value acquisition unit 20 acquires data from the optical sensor 21 by an integration method. Since the integral method has excellent S/N, it is possible to improve the measurement accuracy. On the other hand, the integration method has the disadvantage that the data acquisition speed cannot be increased as in the sequential method, but this does not pose a problem in display analysis applications. Therefore, the integration method is generally more suitable than the sequential method.
- the analysis unit 13 analyzes the optical waveform acquired by the stimulus value acquisition unit 20 .
- Examples of analysis include determination of presence/absence of transient response, and confirmation of waveform shape/strength (presence/absence of under/overshoot, etc.) when there is transient response.
- the display unit 14 displays the optical waveform acquired by the stimulus value acquisition unit 20, the analysis result of the analysis unit 13, and the like.
- the frequency-of-interest setting unit 15 sets the frequency of interest, which will be described later. Since the frequency and the period are inextricably linked, the "setting of the frequency of interest” not only sets the frequency of interest itself, but also automatically sets the frequency of interest corresponding to the period of interest by setting the period of interest. Also included when set to The settings may be made based on instructions from an external personal computer (PC) 2, or may be made based on user input. Alternatively, as will be described later, an optical waveform frequency detector may be provided, and settings may be made based on the detection result of the frequency detector. The setting of the frequency of interest based on the detection result of the frequency detection unit will also be described later.
- PC personal computer
- the sampling frequency determination unit 16 determines the sampling frequency for the stimulus value acquisition unit 20 to acquire the output of the optical sensor 21 . Note that "determining the sampling frequency” includes not only the determination of the sampling frequency itself, but also the case where the sampling frequency is automatically determined by determining the sampling period.
- the communication unit 17 is a communication interface for communicating with an external device such as the PC 2.
- the processing for setting the frequency of interest by the frequency-of-interest setting unit 15 and the processing for determining the sampling frequency by the sampling frequency determination unit 16 are performed by the processor mounted on the optical measurement device 1 operating according to a program stored in a storage unit (not shown). executed.
- ⁇ Set target frequency> optical waveform measurement of the display 100 operating under the drive condition of the vertical synchronization signal (Vsync) frequency of 24.082 Hz will be described as an example. It should be noted that the Vsync frequency has individual variations, and here is an actual measurement value of displacement 100.
- FIG. Light emission control is hybrid control of pulse width modulation and amplitude modulation, and the pulse number of pulse width modulation is set to four. Control signals (ideal conditions) are shown in FIG.
- the frequency-of-interest setting unit 15 sets the light amount fluctuation frequency of the display 100 to be synchronized as the frequency of interest.
- the optical measuring device 1 and the PC 2 are connected for communication, and the user writes data via the PC 2 .
- the setting method there is no limitation to the setting method, and for example, a method in which the user directly writes to the optical measurement device 1 to set may be used.
- the Vsync frequency is selected in the case of conventional luminance measurement, but a different frequency is selected in this embodiment.
- the sampling frequency is determined to be a natural number multiple of the frequency of interest, and the stimulus value acquisition unit 12 acquires an intensity corresponding to the stimulus value at regular time intervals corresponding to the determined sampling frequency.
- the sampling frequency magnification is preferably 5-100. If the magnification is 100 times or more, the S/N ratio becomes worse due to the higher sampling frequency, which disturbs the acquired waveform and hinders the waveform analysis. In particular, when the integration method is adopted for the output of the optical sensor 11, the integration time is shortened and the amount of signal is reduced. It is likely to disappear. On the other hand, if it is 5 times or less, a sufficient S/N ratio can be secured, but the number of data may be insufficient for waveform analysis.
- the upper limit of the usable sampling frequency may be set and derived according to the following formula (1). This makes it possible to select the fastest sampling frequency on the condition that the S/N is ensured.
- the upper limit frequency is set to 3 kHz from the S/N characteristics.
- the magnification (oversampling amount) was 30 times and the sampling frequency was 2989.982 Hz.
- the determination of the sampling frequency is not limited to the above.
- the sampling frequency may be selected by the user from among the magnifications that are equal to or lower than the upper limit frequency.
- the user may simply specify the magnification.
- the selection of the magnification may be changed according to the type of measurement target, driving conditions, and the like. For example, in the case of amplitude modulation driving, the speed is set to S/N priority, and in the case of PWM modulation driving, the speed is set.
- the signal holding voltage waveform in the control circuit of the display 100 that is, the drive control signal for each pixel of the display 100 is shown in FIG. 3(A) and its enlarged view is shown in FIG. 3(B).
- the drive control signals shown in FIGS. 3A and 3B are actual waveforms of the control signals shown in FIG.
- the voltage waveform measurement unlike the optical waveform measurement, allows high-speed sampling, so the sampling frequency was set to 1 MHz.
- FIG. 4A shows an example of the optical waveform acquisition result in this embodiment (sampling frequency is 2989.982 Hz), FIG. Examples are shown in FIG. 5, respectively.
- the sampling frequency in the conventional example is set to the upper limit frequency (3 kHz) at which the S/N can be ensured.
- Fig. 6 shows an example of the optical waveform acquisition result when the sampling frequency is synchronized with Vsync.
- the sampling frequency is 2962.071Hz, which is 3kHz or less.
- the emission waveform has, for example, the following features. ⁇ Overshoot occurs, but the amount is constant and stable. ⁇ The brightness value (vertical axis in FIG. 4) is attenuated in the Vsync cycle. ⁇ The characteristics of the light emission waveform are consistent with the characteristics of the signal holding voltage waveform.
- the electrical transient state (holding voltage) in pixel control of the display 100 can be determined by utilizing the light emission waveform analysis in this embodiment. Also, there is an effect that it becomes possible to grasp the outline without contacting the circuit without requiring a probe contact or the like.
- the frequency-of-interest setting unit 15 sets the frequency of interest based on the input of the user or the like.
- the optical measurement device 1 according to the second embodiment includes a frequency detection unit 18 for the optical waveform, and the target frequency setting unit 15 detects the detection result of the frequency detection unit 18. The target frequency is automatically set based on the
- the configuration other than the frequency detection unit 18 is the same as that of the optical measurement device 1 shown in FIG. 1, so the same components are given the same reference numerals and detailed descriptions thereof are omitted.
- Detection of the frequency by the frequency detection unit 18 can be realized, for example, by preliminary (pre) waveform measurement.
- the light amount fluctuation period can be derived by performing pre-waveform measurement in advance and applying the autocorrelation method to the acquired data.
- the pre-waveform measurement data is converted into a frequency spectrum by performing a discrete Fourier transform (DFT), and the light amount fluctuation frequency can be derived by frequency analysis.
- DFT discrete Fourier transform
- the frequency detection method is not limited to this, and other methods may be used.
- Such frequency detection processing by the frequency detection unit 18 is executed by the processor mounted on the optical measurement device 1 operating according to a program stored in a storage unit (not shown).
- the frequency-of-interest setting unit 15 sets, as the frequency of interest, a frequency that is, for example, the minimum value of the light intensity fluctuation period, among the frequencies detected by the frequency detection unit 18, and the sampling frequency determination unit 16 sets the frequency of interest as the frequency of interest. Then, the sampling frequency is determined in the same manner as in the first embodiment.
- the present invention is not limited to the above embodiment.
- the case where the target frequency setting unit 15, the sampling frequency determination unit 16, or the frequency detection unit 18 is built in the optical measurement device 1 has been described.
- the target frequency setting unit 15, the sampling frequency determining unit 16, or the frequency detecting unit 18 is provided in the PC 2 as a data processing device separate from the optical measurement device 1, good.
- the sampling frequency determined by the PC 2 should be read into the optical measuring device 1 and operated. If the PC 2 is provided with the frequency detector 18, the PC 2 may receive the pre-waveform measurement result performed by the optical measuring device 1, and the frequency detector 18 may obtain the light amount fluctuation frequency.
- the processing for setting the frequency of interest by the frequency-of-interest setting unit 15, the sampling frequency determination processing by the sampling frequency determination unit 16, and the frequency detection processing by the frequency detection unit 18 are performed by the processor in the PC 2 in a storage unit (not shown). It is executed by operating according to a stored program.
- the sampling frequency obtained by the user's calculation may be directly written into the stimulus value acquisition unit 12 of the optical measurement device 1 to operate.
- This invention can be used for measuring optical waveforms of displays.
- optical measuring device 1 optical measuring device 2 personal computer (data processing device) REFERENCE SIGNS LIST 11 optical sensor 12 stimulus value acquisition unit 13 analysis unit 14 display unit 15 frequency of interest setting unit 16 sampling frequency determination unit 17 communication unit 100 display
Landscapes
- Physics & Mathematics (AREA)
- Spectroscopy & Molecular Physics (AREA)
- General Physics & Mathematics (AREA)
- Engineering & Computer Science (AREA)
- Health & Medical Sciences (AREA)
- Biomedical Technology (AREA)
- General Health & Medical Sciences (AREA)
- Multimedia (AREA)
- Signal Processing (AREA)
- Chemical & Material Sciences (AREA)
- Analytical Chemistry (AREA)
- Photometry And Measurement Of Optical Pulse Characteristics (AREA)
Abstract
Description
(1)ディスプレイの光を受光し、刺激値に相当する強度を所定のサンプリング周波数に対応する一定時間間隔で連続的に取得する刺激値取得ステップと、
前記ディスプレイの光量変動周波数を着目周波数として設定する設定ステップと、
前記サンプリング周波数を、前記設定ステップで設定された前記着目周波数の自然数倍になるように決定する決定ステップと、
を含むディスプレイ光計測方法。
(2)前記着目周波数は、ディスプレイの垂直同期信号の周波数と異なり、かつ垂直同期信号の周波数よりも大きい周波数である前項1に記載のディスプレイ光計測方法。
(3)前記サンプリング周波数は前記着目周波数の5~100倍である前項1または2に記載のディスプレイ光計測方法。
(4)前記決定ステップでは、前記サンプリング周波数の上限値と下限値の少なくとも何れかを設定可能である前項1~3の何れかに記載のディスプレイ光計測方法。
(5)前記刺激値取得ステップでは、積分方式により刺激値に相当する強度を取得する前項1~4の何れかに記載のディスプレイ光計測方法。
(6)着目周波数を決定するために、前記ディスプレイの光の光量変動周波数を検出する検出ステップを含んでいる前項1~5の何れかに記載のディスプレイ光計測方法。
(7)ディスプレイの光を受光し、刺激値に相当する強度を所定のサンプリング周波数に対応する一定時間間隔で連続的に取得する刺激値取得手段と、
前記ディスプレイの光量変動周波数を着目周波数として設定する設定手段と、
前記サンプリング周波数を、前記設定手段で設定された前記着目周波数の自然数倍になるように決定する決定手段と、
を備えたディスプレイ光計測装置。
(8)ディスプレイの光を受光し、刺激値に相当する強度を所定のサンプリング周波数に対応する一定時間間隔で連続的に取得する刺激値取得手段を備え、
前記ディスプレイの光量変動周波数を着目周波数としたとき、前記サンプリング周波数が着目周波数の自然数倍であるディスプレイ光計測装置。
(9)前記着目周波数は、ディスプレイの垂直同期信号の周波数と異なり、かつ垂直同期信号の周波数よりも大きい周波数である前項7または8に記載のディスプレイ光計測装置。
(10)前記サンプリング周波数は前記着目周波数の5~100倍である前項7~9の何れかに記載のディスプレイ光計測装置。
(11)前記決定手段は、前記サンプリング周波数の上限値と下限値の少なくとも何れかを設定可能である前項7~10の何れかに記載のディスプレイ光計測装置。
(12)前記刺激値取得手段は、積分方式により刺激値に相当する強度を取得する前項7~11の何れかに記載のディスプレイ光計測装置。
(13)着目周波数を決定するために、前記ディスプレイの光の光量変動周波数を検出する検出手段を備えている前項7~12の何れかに記載のディスプレイ光計測装置。
(14)ディスプレイの光を受光し、刺激値に相当する強度を所定のサンプリング周波数に対応する一定時間間隔で連続的に取得するための前記サンプリング周波数を決定するデータ処理装置であって、
前記ディスプレイの光量変動周波数を着目周波数として設定する設定手段と、
前記サンプリング周波数を、前記設定手段で設定された前記着目周波数の自然数倍になるように決定する決定手段と、
を備えたデータ処理装置。
(15)前記着目周波数は、ディスプレイの垂直同期信号の周波数と異なり、かつ垂直同期信号の周波数よりも大きい周波数である前項14に記載のデータ処理装置。
(16)前記サンプリング周波数は前記着目周波数の5~100倍である前項14または15に記載のデータ処理装置。
(17)前記決定手段は、前記サンプリング周波数の上限値と下限値の少なくとも何れかを設定可能である前項14~16の何れかに記載のデータ処理装置。
(18)前記刺激値取得手段は、積分方式により刺激値に相当する強度を取得する前項14~17の何れかに記載のデータ処理装置。
(19)着目周波数を決定するために、前記ディスプレイの光の光量変動周波数を検出する検出手段を備えている前項14~18の何れかに記載のデータ処理装置。
(20)ディスプレイの光を受光し、刺激値に相当する強度を所定のサンプリング周波数に対応する一定時間間隔で連続的に取得するための前記サンプリング周波数を決定するコンピュータに、
前記ディスプレイの光量変動周波数を着目周波数として設定する設定ステップと、
前記サンプリング周波数を、前記設定ステップで設定された前記着目周波数の自然数倍になるように決定する決定ステップと、
を実行させるためのプログラム。
(21)前記着目周波数は、ディスプレイの垂直同期信号の周波数と異なり、かつ垂直同期信号の周波数よりも大きい周波数である前項20に記載のプログラム。
(22)前記サンプリング周波数は前記着目周波数の5~100倍である前項20または21に記載のプログラム。
(23)前記決定ステップでは、前記サンプリング周波数の上限値と下限値の少なくとも何れかを設定可能である前項20~22の何れかに記載のプログラム。
(24)前記刺激値強度は積分方式により取得された刺激値に相当する強度である前項20~23の何れかに記載のプログラム。
(25)着目周波数を決定するために、前記ディスプレイの光の光量変動周波数を検出する検出プログラムをさらにコンピュータに実行させる前項20~24の何れかに記載のプログラム。
[第1の実施形態}
<光計測装置の構成>
図1は、この発明の一実施形態に係る光計測装置1の機能構成を示すブロック図である。図1に示すように、光計測装置1は光センサ11と、刺激値取得部12と、解析部13と、表示部14と、着目周波数設定部15と、サンプリング周波数決定部16と、通信部17を備えている。
<着目周波数の設定>
この実施形態では、垂直同期信号(Vsync)の周波数24.082Hzの駆動条件で動作しているディスプレイ100の光波形計測を例に取って説明する。なお、Vsync周波数は、個体バラツキがあり、ここではディスプレイス100の実測値である。発光制御はパルス幅変調と振幅変調のハイブリッド制御であり、パルス幅変調のパルス数は4とした。制御信号(理想条件)を図2に示す。
着目周波数は、従来の輝度計測の場合だとVsync周波数を選択するが、本実施形態では異なる周波数を選択する。光波形計測においては、光量変動周期の最小値となる周波数を選択することが好ましい。具体的には、本実施形態の場合、着目周波数は従来のVsync周波数24.082Hzではなく、パルス幅変調制御を実施している周期が光量変動周期の最小値となり、その周波数は24.082×4=96.328Hzとなる。
<サンプリング周波数の決定>
サンプリング周波数を着目周波数の自然数倍となるように決定し、決定したサンプリング周波数に対応する一定時間間隔で刺激値取得部12は刺激値に相当する強度を取得する。サンプリング周波数を着目周波数の自然数倍となるように決定することで、刺激値取得部12によるデータ取得点における発光周期の位相を揃えることが可能となり、偽の特徴の発現が解消できるようになる。
本実施形態では、上限周波数をS/N特性から3kHzに設定した。その結果、倍率(オーバーサンプリング量)は30倍、サンプリング周波数は2989.982Hzとなった。
<実施例の効果>
まず、ディスプレイ100の制御回路における信号保持電圧波形、つまりディスプレイ100の各画素の駆動制御信号を図3(A)に、その拡大図を図3(B)にそれぞれ示す。図3(A)(B)に示す駆動制御信号は図2に示した制御信号の実際の波形である。なお、電圧波形計測は、光波形計測と異なり高速サンプリングが可能なため、サンプリング周波数は1MHzとした。
・オーバーシュートが観測される。オーバーシュート量は概ね一定値である。
・保持電圧は、Vsync周期で減衰が生じている。
・オーバーシュートを生じているが、その量は一定で安定している。
・輝度値(図4の縦軸)についてはVsync周期の減衰が生じている。
・発光波形の特徴は、信号保持電圧波形の特徴と一致している。
[第2の実施形態}
第1の実施形態に係る光計測装置1では、着目周波数設定部15はユーザー等の入力を基に着目周波数を設定した。これに対し、第2の実施形態に係る光計測装置1は、図7に示すように、光波形に対する周波数検知部18を備えており、着目周波数設定部15は周波数検知部18の検知結果を基に自動で着目周波数を設定する。
2 パーソナルコンピュータ(データ処理装置)
11 光センサ
12 刺激値取得部
13 解析部
14 表示部
15 着目周波数設定部
16 サンプリング周波数決定部
17 通信部
100 ディスプレイ
Claims (25)
- ディスプレイの光を受光し、刺激値に相当する強度を所定のサンプリング周波数に対応する一定時間間隔で連続的に取得する刺激値取得ステップと、
前記ディスプレイの光量変動周波数を着目周波数として設定する設定ステップと、
前記サンプリング周波数を、前記設定ステップで設定された前記着目周波数の自然数倍になるように決定する決定ステップと、
を含むディスプレイ光計測方法。 - 前記着目周波数は、ディスプレイの垂直同期信号の周波数と異なり、かつ垂直同期信号の周波数よりも大きい周波数である請求項1に記載のディスプレイ光計測方法。
- 前記サンプリング周波数は前記着目周波数の5~100倍である請求項1または2に記載のディスプレイ光計測方法。
- 前記決定ステップでは、前記サンプリング周波数の上限値と下限値の少なくとも何れかを設定可能である請求項1~3の何れかに記載のディスプレイ光計測方法。
- 前記刺激値取得ステップでは、積分方式により刺激値に相当する強度を取得する請求項1~4の何れかに記載のディスプレイ光計測方法。
- 着目周波数を決定するために、前記ディスプレイの光の光量変動周波数を検出する検出ステップを含んでいる請求項1~5の何れかに記載のディスプレイ光計測方法。
- ディスプレイの光を受光し、刺激値に相当する強度を所定のサンプリング周波数に対応する一定時間間隔で連続的に取得する刺激値取得手段と、
前記ディスプレイの光量変動周波数を着目周波数として設定する設定手段と、
前記サンプリング周波数を、前記設定手段で設定された前記着目周波数の自然数倍になるように決定する決定手段と、
を備えたディスプレイ光計測装置。 - ディスプレイの光を受光し、刺激値に相当する強度を所定のサンプリング周波数に対応する一定時間間隔で連続的に取得する刺激値取得手段を備え、
前記ディスプレイの光量変動周波数を着目周波数としたとき、前記サンプリング周波数が着目周波数の自然数倍であるディスプレイ光計測装置。 - 前記着目周波数は、ディスプレイの垂直同期信号の周波数と異なり、かつ垂直同期信号の周波数よりも大きい周波数である請求項7または8に記載のディスプレイ光計測装置。
- 前記サンプリング周波数は前記着目周波数の5~100倍である請求項7~9の何れかに記載のディスプレイ光計測装置。
- 前記決定手段は、前記サンプリング周波数の上限値と下限値の少なくとも何れかを設定可能である請求項7~10の何れかに記載のディスプレイ光計測装置。
- 前記刺激値取得手段は、積分方式により刺激値に相当する強度を取得する請求項7~11の何れかに記載のディスプレイ光計測装置。
- 着目周波数を決定するために、前記ディスプレイの光の光量変動周波数を検出する検出手段を備えている請求項7~12の何れかに記載のディスプレイ光計測装置。
- ディスプレイの光を受光し、刺激値に相当する強度を所定のサンプリング周波数に対応する一定時間間隔で連続的に取得するための前記サンプリング周波数を決定するデータ処理装置であって、
前記ディスプレイの光量変動周波数を着目周波数として設定する設定手段と、
前記サンプリング周波数を、前記設定手段で設定された前記着目周波数の自然数倍になるように決定する決定手段と、
を備えたデータ処理装置。 - 前記着目周波数は、ディスプレイの垂直同期信号の周波数と異なり、かつ垂直同期信号の周波数よりも大きい周波数である請求項14に記載のデータ処理装置。
- 前記サンプリング周波数は前記着目周波数の5~100倍である請求項14または15に記載のデータ処理装置。
- 前記決定手段は、前記サンプリング周波数の上限値と下限値の少なくとも何れかを設定可能である請求項14~16の何れかに記載のデータ処理装置。
- 前記刺激値取得手段は、積分方式により刺激値に相当する強度を取得する請求項14~17の何れかに記載のデータ処理装置。
- 着目周波数を決定するために、前記ディスプレイの光の光量変動周波数を検出する検出手段を備えている請求項14~18の何れかに記載のデータ処理装置。
- ディスプレイの光を受光し、刺激値に相当する強度を所定のサンプリング周波数に対応する一定時間間隔で連続的に取得するための前記サンプリング周波数を決定するコンピュータに、
前記ディスプレイの光量変動周波数を着目周波数として設定する設定ステップと、
前記サンプリング周波数を、前記設定ステップで設定された前記着目周波数の自然数倍になるように決定する決定ステップと、
を実行させるためのプログラム。 - 前記着目周波数は、ディスプレイの垂直同期信号の周波数と異なり、かつ垂直同期信号の周波数よりも大きい周波数である請求項20に記載のプログラム。
- 前記サンプリング周波数は前記着目周波数の5~100倍である請求項20または21に記載のプログラム。
- 前記決定ステップでは、前記サンプリング周波数の上限値と下限値の少なくとも何れかを設定可能である請求項20~22の何れかに記載のプログラム。
- 前記刺激値強度は積分方式により取得された刺激値に相当する強度である請求項20~23の何れかに記載のプログラム。
- 着目周波数を決定するために、前記ディスプレイの光の光量変動周波数を検出する検出プログラムをさらにコンピュータに実行させる請求項20~24の何れかに記載のプログラム。
Priority Applications (3)
| Application Number | Priority Date | Filing Date | Title |
|---|---|---|---|
| CN202280088365.7A CN118525190A (zh) | 2022-01-11 | 2022-12-23 | 光测量方法、光测量装置、数据处理装置以及程序 |
| KR1020247020918A KR20240113543A (ko) | 2022-01-11 | 2022-12-23 | 광 계측 방법, 광 계측 장치, 데이터 처리 장치 및 프로그램 |
| JP2023573954A JPWO2023136102A1 (ja) | 2022-01-11 | 2022-12-23 |
Applications Claiming Priority (2)
| Application Number | Priority Date | Filing Date | Title |
|---|---|---|---|
| JP2022002147 | 2022-01-11 | ||
| JP2022-002147 | 2022-01-11 |
Publications (1)
| Publication Number | Publication Date |
|---|---|
| WO2023136102A1 true WO2023136102A1 (ja) | 2023-07-20 |
Family
ID=87279027
Family Applications (1)
| Application Number | Title | Priority Date | Filing Date |
|---|---|---|---|
| PCT/JP2022/047667 Ceased WO2023136102A1 (ja) | 2022-01-11 | 2022-12-23 | 光計測方法、光計測装置、データ処理装置及びプログラム |
Country Status (4)
| Country | Link |
|---|---|
| JP (1) | JPWO2023136102A1 (ja) |
| KR (1) | KR20240113543A (ja) |
| CN (1) | CN118525190A (ja) |
| WO (1) | WO2023136102A1 (ja) |
Cited By (1)
| Publication number | Priority date | Publication date | Assignee | Title |
|---|---|---|---|---|
| WO2025173637A1 (ja) * | 2024-02-15 | 2025-08-21 | コニカミノルタ株式会社 | 光計測装置、色計測システム、色の評価方法及びプログラム |
Citations (5)
| Publication number | Priority date | Publication date | Assignee | Title |
|---|---|---|---|---|
| JP2011163947A (ja) * | 2010-02-10 | 2011-08-25 | Seiko Epson Corp | 光特性測定方法およびその装置 |
| JP2014185881A (ja) * | 2013-03-22 | 2014-10-02 | Seiko Epson Corp | 測定装置、及び測定方法 |
| WO2019069634A1 (ja) * | 2017-10-05 | 2019-04-11 | コニカミノルタ株式会社 | 二次元フリッカ測定装置、二次元フリッカ測定システム、二次元フリッカ測定方法、及び、二次元フリッカ測定プログラム |
| WO2021090689A1 (ja) * | 2019-11-07 | 2021-05-14 | コニカミノルタ株式会社 | フリッカ計測装置及び計測方法 |
| WO2021246125A1 (ja) * | 2020-06-01 | 2021-12-09 | コニカミノルタ株式会社 | 光波形計測装置及び計測方法 |
Family Cites Families (1)
| Publication number | Priority date | Publication date | Assignee | Title |
|---|---|---|---|---|
| US20050103979A1 (en) | 2003-11-13 | 2005-05-19 | Photo Research, Inc. | Temporal source analysis using array detectors |
-
2022
- 2022-12-23 JP JP2023573954A patent/JPWO2023136102A1/ja active Pending
- 2022-12-23 WO PCT/JP2022/047667 patent/WO2023136102A1/ja not_active Ceased
- 2022-12-23 CN CN202280088365.7A patent/CN118525190A/zh active Pending
- 2022-12-23 KR KR1020247020918A patent/KR20240113543A/ko active Pending
Patent Citations (5)
| Publication number | Priority date | Publication date | Assignee | Title |
|---|---|---|---|---|
| JP2011163947A (ja) * | 2010-02-10 | 2011-08-25 | Seiko Epson Corp | 光特性測定方法およびその装置 |
| JP2014185881A (ja) * | 2013-03-22 | 2014-10-02 | Seiko Epson Corp | 測定装置、及び測定方法 |
| WO2019069634A1 (ja) * | 2017-10-05 | 2019-04-11 | コニカミノルタ株式会社 | 二次元フリッカ測定装置、二次元フリッカ測定システム、二次元フリッカ測定方法、及び、二次元フリッカ測定プログラム |
| WO2021090689A1 (ja) * | 2019-11-07 | 2021-05-14 | コニカミノルタ株式会社 | フリッカ計測装置及び計測方法 |
| WO2021246125A1 (ja) * | 2020-06-01 | 2021-12-09 | コニカミノルタ株式会社 | 光波形計測装置及び計測方法 |
Cited By (1)
| Publication number | Priority date | Publication date | Assignee | Title |
|---|---|---|---|---|
| WO2025173637A1 (ja) * | 2024-02-15 | 2025-08-21 | コニカミノルタ株式会社 | 光計測装置、色計測システム、色の評価方法及びプログラム |
Also Published As
| Publication number | Publication date |
|---|---|
| JPWO2023136102A1 (ja) | 2023-07-20 |
| KR20240113543A (ko) | 2024-07-22 |
| CN118525190A (zh) | 2024-08-20 |
Similar Documents
| Publication | Publication Date | Title |
|---|---|---|
| US11991808B2 (en) | Electronic device with ambient light flicker sensor | |
| KR102810517B1 (ko) | 광 계측 장치, 광 계측 방법, 데이터 처리 장치 및 프로그램 | |
| US20090167194A1 (en) | Light emission control system and image display system | |
| FI125675B (en) | Method, hardware, and computer program product for testing video playback quality | |
| US11651747B2 (en) | Flicker measurement device and measurement method | |
| KR20040105243A (ko) | 주기적 광원을 식별하기 위한 방법 및 장치 | |
| JP2005242308A (ja) | Lcd過駆動の自動キャリブレーションのための装置および方法 | |
| CN118525190A (zh) | 光测量方法、光测量装置、数据处理装置以及程序 | |
| KR102808720B1 (ko) | 광 파형 계측 장치 및 계측 방법 | |
| CN112634800A (zh) | 快速自动测试发光二极管显示屏刷新频率的方法及系统 | |
| CA2653572A1 (en) | Fundamental wave beat component detecting method and measuring target signal sampling apparatus and waveform observation system using the same | |
| KR20240134356A (ko) | 디스플레이 광 계측 장치 및 광 계측 방법, 데이터 처리 장치 그리고 프로그램 | |
| JP2001042845A (ja) | ディスプレイの動特性測定用データ取得装置および動特性測定装置 | |
| WO2023149337A1 (ja) | ディスプレイ光計測装置及び光計測方法、データ処理装置並びにプログラム | |
| CN114047841A (zh) | 屏幕刷新定位方法、装置、显示设备和存储介质 | |
| CN113887281A (zh) | 生物特征图像的采集方法、芯片、终端和存储介质 | |
| US11967267B2 (en) | Display device | |
| TWI353187B (ja) | ||
| JP2018189498A (ja) | 計測装置、および物品製造方法 | |
| CN119905050B (zh) | 显示设备的测试方法、装置、终端设备及计算机程序产品 | |
| WO2025173637A1 (ja) | 光計測装置、色計測システム、色の評価方法及びプログラム | |
| CN111679762A (zh) | 传输触控驱动信号的方法、触控芯片和电子设备 | |
| KR20070079233A (ko) | 디씨씨 측정 시스템 및 그 방법 | |
| JP2003227756A (ja) | 光検出装置、光検出方法、プログラムおよび記録媒体 | |
| JP2022026342A (ja) | ノイズ測定装置及びノイズ測定方法 |
Legal Events
| Date | Code | Title | Description |
|---|---|---|---|
| 121 | Ep: the epo has been informed by wipo that ep was designated in this application |
Ref document number: 22920619 Country of ref document: EP Kind code of ref document: A1 |
|
| ENP | Entry into the national phase |
Ref document number: 2023573954 Country of ref document: JP Kind code of ref document: A |
|
| ENP | Entry into the national phase |
Ref document number: 20247020918 Country of ref document: KR Kind code of ref document: A |
|
| WWE | Wipo information: entry into national phase |
Ref document number: 1020247020918 Country of ref document: KR |
|
| WWE | Wipo information: entry into national phase |
Ref document number: 202280088365.7 Country of ref document: CN |
|
| NENP | Non-entry into the national phase |
Ref country code: DE |
|
| 122 | Ep: pct application non-entry in european phase |
Ref document number: 22920619 Country of ref document: EP Kind code of ref document: A1 |