WO2023100243A1 - 学習装置、異常兆候検知装置、異常兆候検知システム、学習方法およびプログラム - Google Patents
学習装置、異常兆候検知装置、異常兆候検知システム、学習方法およびプログラム Download PDFInfo
- Publication number
- WO2023100243A1 WO2023100243A1 PCT/JP2021/043847 JP2021043847W WO2023100243A1 WO 2023100243 A1 WO2023100243 A1 WO 2023100243A1 JP 2021043847 W JP2021043847 W JP 2021043847W WO 2023100243 A1 WO2023100243 A1 WO 2023100243A1
- Authority
- WO
- WIPO (PCT)
- Prior art keywords
- data
- waveform
- normal
- sign
- learning
- Prior art date
- Legal status (The legal status is an assumption and is not a legal conclusion. Google has not performed a legal analysis and makes no representation as to the accuracy of the status listed.)
- Ceased
Links
Images








Classifications
-
- G—PHYSICS
- G06—COMPUTING OR CALCULATING; COUNTING
- G06V—IMAGE OR VIDEO RECOGNITION OR UNDERSTANDING
- G06V10/00—Arrangements for image or video recognition or understanding
- G06V10/40—Extraction of image or video features
- G06V10/46—Descriptors for shape, contour or point-related descriptors, e.g. scale invariant feature transform [SIFT] or bags of words [BoW]; Salient regional features
- G06V10/478—Contour-based spectral representations or scale-space representations, e.g. by Fourier analysis, wavelet analysis or curvature scale-space [CSS]
-
- G—PHYSICS
- G01—MEASURING; TESTING
- G01R—MEASURING ELECTRIC VARIABLES; MEASURING MAGNETIC VARIABLES
- G01R31/00—Arrangements for testing electric properties; Arrangements for locating electric faults; Arrangements for electrical testing characterised by what is being tested not provided for elsewhere
- G01R31/08—Locating faults in cables, transmission lines, or networks
-
- G—PHYSICS
- G06—COMPUTING OR CALCULATING; COUNTING
- G06F—ELECTRIC DIGITAL DATA PROCESSING
- G06F18/00—Pattern recognition
- G06F18/10—Pre-processing; Data cleansing
-
- G—PHYSICS
- G06—COMPUTING OR CALCULATING; COUNTING
- G06N—COMPUTING ARRANGEMENTS BASED ON SPECIFIC COMPUTATIONAL MODELS
- G06N20/00—Machine learning
-
- G—PHYSICS
- G06—COMPUTING OR CALCULATING; COUNTING
- G06V—IMAGE OR VIDEO RECOGNITION OR UNDERSTANDING
- G06V10/00—Arrangements for image or video recognition or understanding
- G06V10/98—Detection or correction of errors, e.g. by rescanning the pattern or by human intervention; Evaluation of the quality of the acquired patterns
- G06V10/993—Evaluation of the quality of the acquired pattern
Definitions
- the present disclosure relates to a learning device, an anomaly sign detection device, an anomaly sign detection system, a learning method, and a program that perform machine learning for anomaly sign detection.
- a ground fault that occurs in a power distribution system may be accompanied by some kind of precursory phenomenon, and techniques for capturing this precursory phenomenon have been proposed.
- Patent Document 1 discloses a technique for inferring the state of insulation deterioration by supervised learning using a neural network model using the frequency spectrum of at least one of the zero-phase voltage and zero-phase current in a distribution system. It is
- the present disclosure has been made in view of the above, and aims to obtain a learning device capable of improving the detection accuracy of signs of abnormality.
- a learning device that generates learned data used for detecting signs of abnormality, and has a predetermined time length as one cycle.
- N is an integer of 2 or more
- the learning device further uses the difference value before N cycles to generate, as learned data, a normal waveform and a normality determination threshold value used to determine whether the waveform is normal, by similar waveform analysis. and an analysis unit.
- the learning device has the effect of improving the detection accuracy of signs of abnormality.
- FIG. 1 is a diagram showing a configuration example of an abnormality symptom detection system according to a first embodiment
- FIG. FIG. 2 is a diagram showing an arrangement example of the anomaly sign detection system according to the first embodiment in a distribution system
- 3 is a flowchart showing an example of a processing procedure during learning in the learning device according to Embodiment 1
- FIG. 4 is a diagram for explaining preprocessing according to Embodiment 1
- a diagram schematically showing an example of the effect of the pretreatment of the first embodiment. 1 is a diagram showing a configuration example of a computer system that implements the learning device according to Embodiment 1;
- Flowchart showing an example of a processing procedure for learning a sign-of-abnormal waveform by analyzing similar waveforms according to the second embodiment Flowchart showing an example of a processing procedure at the time of inference in the abnormality sign detection device of Embodiment 2
- Flowchart showing an example of a processing procedure for learning using effective values according to the third embodiment Flowchart showing an example of a processing procedure at the time of inference in the anomaly sign detection device of Embodiment 3
- FIG. 11 is a diagram showing a configuration example of an abnormality sign detection system according to a fifth embodiment; FIG. Flowchart showing an example of a processing procedure of similar waveform analysis for learning abnormal symptom waveforms according to the fifth embodiment
- a learning device an anomaly sign detection device, an anomaly sign detection system, a learning method, and a program according to the embodiments will be described in detail below with reference to the drawings.
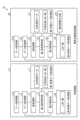
- FIG. 1 is a diagram illustrating a configuration example of an abnormality sign detection system according to a first embodiment
- An abnormality sign detection system 3 of the present embodiment includes a learning device 1 and an abnormality sign detection device 2 .
- the learning device 1 generates learned data used for detection of abnormal signs, and the abnormal sign detection device 2 uses the learned data generated by the learning device 1 to detect abnormal signs.
- the learning device 1 performs learning for detecting anomalies, for example, by waveform analysis of time-series data acquired by a sensor or the like. Waveform analysis in the present embodiment is an example of machine learning, also called similar waveform analysis.
- a reference waveform is accumulated as a reference waveform, and a threshold value for an outlier score indicating similarity to the reference waveform is set. decide. Then, in the waveform analysis according to the present embodiment, at the time of detecting an abnormal sign, that is, at the time of inferring whether or not an abnormal sign has occurred, the time-series data of the detection target and the reference waveform are used to obtain the time-series data of the detection target. A deviation score is calculated for each waveform with respect to the reference waveform in , and an abnormality sign is detected based on the result of comparison between the deviation score and a threshold determined by learning.
- the learning device 1 includes a data acquisition unit 11, a data storage unit 12, a preprocessing unit 13, a first waveform analysis unit 14, a removed waveform extraction unit 15, a removed waveform storage unit 16, and a first learning data storage.
- a section 17 is provided.
- the data acquisition unit 11 acquires time-series data for a normal period and stores it in the data storage unit 12.
- the data acquisition unit 11 acquires measurement data from, for example, a sensor that acquires time-series data.
- the preprocessing unit 13 performs smoothing processing on the time-series data stored in the data storage unit 12, cuts into a window size (one unit interval size), and performs N (N is an integer equal to or greater than 2) cycles. Preprocessing such as pre-difference processing is performed, and the data after preprocessing is output to the first waveform analysis unit 14 . Since the preprocessed data is cut out to the window size, it is output to the first waveform analysis unit 14 for each unit interval of data.
- the data of one unit interval is hereinafter also referred to as unit interval data.
- the preprocessing unit 13 outputs the unit interval data before the N cycles before difference processing is performed to the removed waveform extraction unit 15 .
- the first waveform analysis unit 14 learns normal waveforms through similar waveform analysis. Specifically, the first waveform analysis unit 14 calculates the distance between the preprocessed unit interval data as an outlier score, and uses the calculated outlier score to determine whether the data is normal or not. A threshold value is determined, and the determined normality determination threshold value is stored in the first learning data storage unit 17 .
- the distance between unit interval data is, for example, DTW (Dynamic Time Warping) distance, Mahalanobis distance, Euclidean distance, etc. Any distance may be used, but here, the distance between unit interval data is As an example, it is assumed that the cumulative value for one unit section of the distance for each sampling point between unit section data.
- the normality determination threshold is determined, for example, based on the standard deviation of the outlier scores. For example, the first waveform analysis unit 14 sets the normality determination threshold to 3 ⁇ when the standard deviation of the outlier scores is ⁇ . The first waveform analysis section 14 also selects unit section data to be stored as normal waveform data, and stores the selected unit section data in the first learning data storage section 17 as normal waveform data. In addition, the first waveform analysis unit 14 outputs identification information for identifying unit interval data determined to be normal data but rarely occurring waveforms to the removed waveform extraction unit 15 . The normal waveform and the normality determination threshold value stored in the first learning data storage unit 17 are learned data used for detection of signs of abnormality.
- the removed waveform extracting unit 15 extracts unit interval data corresponding to the identification information received from the first waveform analyzing unit 14 from among the unit interval data received from the preprocessing unit 13, that is, unit interval data determined to be rarely occurring waveforms. are classified into a plurality of waveform types, and conditions for determining normality are determined for each waveform type.
- the waveform condition for determining normality is determined based on, for example, the average value, standard deviation, maximum value, minimum value, etc. of each sample point in the unit interval data.
- the removed waveform extracting unit 15 stores the corresponding waveforms and waveform conditions for each type in the removed waveform storage unit 16 .
- the removed waveform extracting unit 15 is a process performed to prevent overdetection in which a waveform that is normal but causes a problem-free event, for example, with a large deviation score, is determined to be an abnormal sign. As will be described later, the information stored in the removed waveform storage unit 16 is used in the process of preventing overdetection in the abnormality sign detection device 2 .
- the removal of overdetection using the waveform condition for each waveform type determined by the removed waveform extraction unit 15 is also called filtering by type.
- the abnormal sign detection device 2 includes a data acquisition unit 21, a data storage unit 22, a preprocessing unit 23, a first waveform analysis unit 24, an overdetection removal unit 25, a removed waveform storage unit 26, a first learning data storage unit 27, and a detection A result output unit 28 is provided.
- the removed waveform storage unit 26 stores the same information as the information stored in the above-described removed waveform storage unit 16, and the first learning data storage unit 27 stores the information stored in the above-described first learning data storage unit 17. The same information as the information stored in the
- the data acquisition unit 21 acquires detection target data, which is time-series data for detection of abnormal signs, and stores the data in the data storage unit 22 .
- the preprocessing unit 23 performs the same preprocessing as the preprocessing unit 13 on the detection target data stored in the data storage unit 22 and outputs the preprocessed data to the first waveform analysis unit 24 .
- the preprocessing unit 23 outputs the unit interval data before the difference processing before N cycles to the overdetection removal unit 25 .
- the first waveform analysis unit 24 uses the unit interval data after preprocessing and the learned data to determine whether or not there is an abnormality sign by similar waveform analysis. Specifically, the first waveform analysis section 24 calculates the distance between the preprocessed unit section data and each of the normal waveform data stored in the first learning data storage section 27 as the first learning data storage section 27 . By comparing with the normality determination threshold value stored in , it is determined whether or not there is an abnormality symptom in the unit interval data after preprocessing, and the determination result is output to the overdetection removal unit 25 . For example, the first waveform analysis unit 24 determines that there is an abnormality sign when the smallest deviation score among the calculated deviation scores is equal to or greater than the normality determination threshold. When the first waveform analysis unit 24 determines that there is an abnormality sign, it also outputs the corresponding unit interval data to the overdetection removal unit 25 .
- the overdetection removal unit 25 combines the unit interval data received from the preprocessing unit 23 with the removed waveform storage unit 26.
- the waveform type of the unit interval data is determined by comparing with the waveforms of different types stored in the removed waveform storage unit 26, and the normality corresponding to the determined type among the normality determination conditions stored in the removed waveform storage unit 26 is determined. It is determined whether or not the unit interval data is normal using a determination condition.
- the overdetection removing unit 25 removes the abnormal symptom from the unit section data. It is determined that there is no detection result, and the determination result is output to the detection result output unit 28 . Further, when the determination result received from the first waveform analysis unit 24 indicates that there is an abnormal symptom and the normal determination condition indicates that the overdetection removal unit 25 is not normal, the unit interval data determines that there is an abnormality symptom, and outputs the determination result to the detection result output unit 28 .
- the overdetection removal unit 25 determines that the unit interval data determined to have an abnormal sign by the first waveform analysis unit 24 is not normal, the overdetection removal unit 25 When the determination result received from the first waveform analysis unit 24 indicates that there is no sign of abnormality, the overdetection removal unit 25 outputs the determination result to the detection result output unit 28 .
- the determination result when the first waveform analysis unit 24 determines that there is an abnormal symptom is notified to the detection result output unit 28 via the overdetection removal unit 25.
- the first waveform analysis unit 24 may directly notify the detection result output unit 28 of the determination result when the first waveform analysis unit 24 determines that there is an abnormality sign.
- the determination result is output to the detection result output unit 28 even when there is no sign of abnormality.
- the determination result is output to the detection result output unit 28 when there is no sign of abnormality. It does not have to be. That is, the determination result may be output to the detection result output unit 28 only when an abnormality symptom is detected.
- the learning device 1 and the sign-of-abnormality detection device 2 are provided separately, but the learning device 1 and the sign-of-abnormality detection device 2 may be integrated.
- the removed waveform storage unit 26 may not be provided and the removed waveform storage unit 16 may be used instead of the above-described removed waveform storage unit 26, and the first learning data storage unit 27 may not be provided and the first learning data storage unit 17 may be used instead of the first learning data storage unit 27 described above, or the data storage unit 22 may not be provided and the data storage unit 12 may be used instead of the data storage unit 22 described above.
- the data acquisition unit 11, the preprocessing unit 13, and the first waveform analysis unit 14 also function as the data acquisition unit 21, the preprocessing unit 23, and the first waveform analysis unit 24, respectively.
- the preprocessing section 23 and the first waveform analysis section 24 may not be provided. Since the learning device 1 and the sign-of-abnormality detection device 2 have many processes in common, when they are integrated, they can share such common parts.
- the anomaly sign detection system 3 of the present embodiment can be applied, for example, to detect an anomaly sign in a power distribution system.
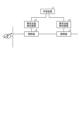
- FIG. 2 is a diagram showing an arrangement example of the anomaly sign detection system 3 of the present embodiment in a distribution system.
- the abnormality sign detection device 2 is a device called a slave station that controls switches 4 that connect sections in the distribution system.
- the sign-of-abnormality detection device 2 may be a device connected to a slave station that controls the switch 4 .
- a slave station can monitor the distribution system and control the switch 4 according to instructions from the master station. In this way, the slave station measures the current and voltage of the power distribution system. It is possible to detect signs of abnormality in the distribution system using the current and voltage obtained.
- a slave station is installed, for example, on a utility pole together with a transformer.
- the learning device 1 is the parent station or is connected to the parent station.
- the data in the first learning data storage unit 17 and the removed waveform storage unit 16 can be transmitted to the abnormal sign detection device 2 after the learning device 1 has learned.
- the method of reflecting the data in the first learning data storage unit 17 and the removed waveform storage unit 16 to the abnormal sign detection device 2 is not limited to this example, and the data from the learning device 1 to the abnormal sign detection device using another communication network. 2, or the abnormality sign detection device 2 may acquire these data via a recording medium or the like.
- abnormalities may occur in the distribution line or other equipment in the distribution system due to the effects of fallen trees, contact with trees, birds, snakes, etc.
- the abnormality sign detection device 2 can detect an abnormality sign at various places in the distribution system. Abnormalities can be dealt with before they occur.
- abnormality sign detection system 3 of the present embodiment is not limited to this, and other equipment in the electric power system, equipment in various plants, other An anomaly sign can be detected with respect to time-series data acquired by a sensor in an electrical device, and the time-series data for which an anomaly sign is detected may be of any type.
- each slave station measures current and voltage.
- the measurement data of the instantaneous value of at least one of the zero-phase current and the zero-phase voltage is used as time-series data to detect signs of abnormality. That is, one of the zero-phase current and the zero-phase voltage may be used as measurement data to detect signs of abnormality, or the detection of signs of abnormality using the zero-phase current as measurement data and the zero-phase voltage as measurement data. You may perform both the detection of the abnormality sign used. When performing both, for example, when an abnormality sign is detected in either one, it is determined that an abnormality sign is detected. Also, it is assumed that the measurement data of the zero-phase current and the zero-phase voltage are acquired as instantaneous values.
- the sensor that acquires the time-series data measures at least one of the zero-phase current and the zero-phase voltage.
- measurement data is acquired at a sampling period sufficiently shorter than the power supply period in the distribution system. Since the processing is the same when using either the zero-phase current or the zero-phase voltage, the zero-phase current and the zero-phase voltage are described below as measurement data of instantaneous values without distinction.
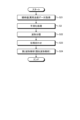
- FIG. 3 is a flowchart showing an example of a processing procedure during learning in the learning device 1 of the present embodiment.
- the learning device 1 acquires instantaneous values (normal data) (step S1).
- the data acquisition unit 11 acquires measurement data of instantaneous values in a normal period as time-series data, and stores the acquired measurement data in the data storage unit 12 .
- the data acquisition unit 11 may acquire measurement data of instantaneous values during a period when it is known to be normal from another device (not shown) that has been acquired by a sensor in the past and stored in another device.
- measurement data of instantaneous values obtained by an experiment may be obtained, or measurement data of instantaneous values may be obtained from a sensor during a period known to be normal.
- the learning device 1 performs smoothing processing (step S2). Specifically, the preprocessing unit 13 smoothes the measurement data stored in the data storage unit 12 using, for example, a first-order lag filter. Any value may be set for the filter coefficient of the first-order lag filter. %) to perform smoothing with a first-order lag filter.
- the learning device 1 extracts data (step S3).
- the preprocessing unit 13 extracts window size data from the measurement data stored in the data storage unit 12 .
- the preprocessing unit 13 generates unit interval data by segmenting the smoothed measurement data by window size.
- the window size may be set in any way, but here, as an example, it is set to one cycle of the power source.
- the window size is not limited to this, and may be set to another value such as, for example, two cycles of the power supply cycle.
- the learning device 1 performs difference processing before N cycles (step S4).
- the preprocessing unit 13 performs N-cycle pre-difference processing for each unit segment data that is window size data.
- N-cycles-before difference processing a predetermined time length is set as one cycle, and from the values of each point for one cycle of the normal data, which is normal data, This is a process of calculating the difference value before N cycles by subtracting the average value of each corresponding point.
- the difference processing before N cycles is a process of subtracting the average value of the values at corresponding points from one cycle to N cycles before from the value of each point in the current unit segment data. be.
- the N cycles before difference Q k,i P k,i ⁇ (P k ⁇ 1,i +P k ⁇ 2,i + . . . +P k ⁇ N,i )/N (1)
- the learning device 1 performs first waveform analysis (similar waveform analysis) (step S5). Specifically, the first waveform analysis unit 14 calculates the outlier score by calculating the distance between the preprocessed unit interval data, and obtains the standard deviation ⁇ of the calculated outlier score. Then, the normality determination threshold value is set to 3 ⁇ , and data to be stored as normality determination data is selected from the unit interval data. Here, the normality determination threshold is set to 3 ⁇ , but the normality determination threshold is not limited to this value as long as it is determined based on the result of preliminary evaluation, for example. The first waveform analysis unit 14 stores the selected normality determination data and the normality determination threshold in the first learning data storage unit 17 . In addition, the first waveform analysis unit 14 notifies the removed waveform extraction unit 15 of identification information for identifying unit interval data determined to be a normal waveform that rarely occurs.
- first waveform analysis unit 14 notifies the removed waveform extraction unit 15 of identification information for identifying unit interval data determined to be a normal waveform that rarely occurs.
- the learning device 1 extracts a waveform for removing overdetection (step S6).
- the removed waveform extraction unit 15 classifies the unit interval data corresponding to the identification information notified from the first waveform analysis unit 14 into a plurality of waveform types, and determines that each waveform type is normal. Determine the normality determination condition, which is the condition.
- the removed waveform extracting section 15 stores the corresponding unit section data and the normality determination condition in the removed waveform storage section 16 . Learning is completed by the above processing. In addition, after learning is completed once, re-learning may be performed using newly acquired measurement data.
- the learning data that is, the information stored in the first learning data storage unit 17 and the information stored in the removed waveform storage unit 16 are reflected in the abnormality sign detection device 2 .
- these pieces of information are transmitted from the learning device 1 to the sign-of-abnormality detection device 2 , so that these pieces of information are reflected in the sign-of-abnormality detection device 2 .
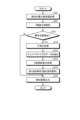
- FIG. 4 is a flowchart showing an example of a processing procedure during inference in the abnormality sign detection device 2 of the present embodiment.
- the abnormality sign detection device 2 acquires an instantaneous value to be detected (step S11).
- the data acquisition unit 21 acquires measurement data of instantaneous values of an inference target, that is, an abnormality sign detection target.
- the sign-of-abnormality detection device 2 performs preprocessing similar to steps S2 to S4 for the instantaneous value to be detected (steps S12 to S14).
- the abnormal sign detection device 2 performs first waveform analysis (similar waveform analysis) (step S15).
- the first waveform analysis unit 24 stores the distance between the preprocessed unit interval data and each of the normal waveform data stored in the first learning data storage unit 27 in the first learning data storage unit 27. By comparing with the stored normality determination threshold value, it is determined whether or not there is an abnormality symptom in the unit interval data after preprocessing, and the determination result is output to the overdetection removal unit 25 .
- the abnormality sign detection device 2 detects an abnormality sign as a result of the first waveform analysis (step S16 Yes), it removes overdetection (step S17). Specifically, when the determination result received from the first waveform analysis unit 24 is a determination result indicating that there is an abnormal symptom, the overdetection removal unit 25 removes the unit interval data received from the preprocessing unit 23 and removes the unit interval data.
- the waveform type of the unit interval data is determined by comparing with the waveforms of different types stored in the waveform storage unit 26, and the determined type is selected from the normality determination conditions stored in the removed waveform storage unit 26. It determines whether or not the unit interval data is normal using the normality determination condition corresponding to , and outputs the determination result to the detection result output unit 28 .
- the abnormality sign detection device 2 outputs the detection result (step S18). Specifically, the detection result output unit 28 outputs the determination result received from the over-detection removal unit 25 as the detection result.
- the detection result output unit 28 since the sign-of-abnormality detection device 2 is a slave station or is connected to a slave station, the detection result output unit 28 sends the detection result to the learning device 1 or a parent station different from the learning device 1, for example. You may output the detection result by sending .
- the detection result output unit 28 is realized by the display unit, and the detection result output unit 28 outputs the detection result by displaying the detection result. good too.
- the learning device 1 or a parent station different from the learning device 1 receives the detection result from the abnormality sign detection device 2, it displays the detection result on a display unit (not shown in FIG. 1).
- the abnormal sign detection device 2 advances the process to step S18 without performing over-detection removal.
- the detection result may be output when no abnormal sign is detected, that is, when normal, or output when an abnormal sign is detected and output when no abnormal sign is detected. It does not have to be.
- over-detection removal is performed, but over-detection removal does not have to be performed.
- the removed waveform extractor 15, the removed waveform storage 16, the overdetection remover 25, and the removed waveform storage 26 may not be provided.
- the data stored in the data storage unit 22 may be deleted, for example, after a certain period of time has elapsed, or may be deleted in chronological order after reaching a certain amount.
- FIG. 5 is a diagram for explaining the preprocessing of this embodiment.
- the raw data which is instantaneous value measurement data, contains various types of noise, and thus has a waveform with many high-frequency components. Therefore, if the first waveform analysis, which is a similar waveform analysis, is performed as it is, the error becomes large, and erroneous detection of abnormal symptoms is likely to occur.
- the smoothing process by performing the smoothing process, it is possible to obtain a waveform in which the influence of noise is reduced, as shown in the middle part of FIG.
- the difference processing before N cycles when the difference processing before N cycles is performed, the components of large changes dependent on the power supply cycle are removed, so it becomes easier to detect the substantial changes compared to the raw data. .
- FIG. 6 is a diagram schematically showing an example of the effects of the pretreatment of this embodiment.
- FIG. 6 when raw data corresponding to a normal case and raw data corresponding to a case in which an abnormal sign is present are input as measurement data to be detected in the sign-of-abnormality detection apparatus 2 of the present embodiment, The results obtained are shown schematically.
- the raw data corresponding to the normal case, the data after preprocessing (smoothing processing and N-cycle pre-difference processing), and the outlier score are shown.
- Raw data, data after preprocessing (smoothing and N-cycle pre-difference processing) and outlier scores are shown.
- a threshold 201 is a normal determination threshold obtained by the first waveform analysis. As shown in FIG.
- the deviation score is equal to or less than the threshold value 201 when the condition is normal, and the deviation score exceeds the threshold value 201 when the symptom of abnormality appears.
- the influence of the change component that is the basis of the raw data is suppressed, the state of substantial change becomes easier to detect, and the outlier score is compared with the normal judgment threshold. It is possible to improve the detection accuracy of anomaly signs.
- FIG. 6 is a schematic diagram, it was confirmed that the detection accuracy of signs of abnormality can be improved by comparing the outlier score with the normal judgment threshold by performing analysis using similar actual data. It is
- the smoothing process does not have to be performed.
- the preprocessing unit 13 performs N-cycles-before difference processing
- the first waveform analysis unit 14 uses the N-cycles-before difference value to perform similar waveform analysis to determine whether the waveform is normal or not.
- the normality determination threshold value used for may be generated as learned data, and the smoothing process may or may not be performed before the difference process before N cycles.
- FIG. 7 is a diagram showing a configuration example of a computer system that implements the learning device 1 of this embodiment. As shown in FIG. 7, this computer system comprises a control section 101, an input section 102, a storage section 103, a display section 104, a communication section 105 and an output section 106, which are connected via a system bus 107. there is
- control unit 101 is, for example, a processor such as a CPU (Central Processing Unit), and executes a program describing the processing in the learning device 1 of this embodiment.
- Part of the control unit 101 may be realized by dedicated hardware such as GPU (Graphics Processing Unit), FPGA (Field-Programmable Gate Array).
- the input unit 102 is composed of, for example, a keyboard and a mouse, and is used by the user of the computer system to input various information.
- the storage unit 103 includes various memories such as RAM (Random Access Memory) and ROM (Read Only Memory) and storage devices such as hard disks, and stores programs to be executed by the control unit 101 and necessary information obtained in the process of processing. store data, etc.
- the storage unit 103 is also used as a temporary storage area for programs.
- the display unit 104 includes a display, LCD (liquid crystal display panel), etc., and displays various screens to the user of the computer system.
- a communication unit 105 is a receiver and a transmitter that perform communication processing.
- the output unit 106 is a printer, speaker, or the like. Note that FIG. 7 is an example, and the configuration of the computer system is not limited to the example in FIG.
- a computer program is stored in a storage unit from a CD-ROM or DVD-ROM set in a CD (Compact Disc)-ROM drive or a DVD (Digital Versatile Disc)-ROM drive (not shown).
- 103 installed. Then, when the program is executed, the program read from storage unit 103 is stored in the main storage area of storage unit 103 . In this state, control unit 101 executes processing as learning device 1 of the present embodiment according to the program stored in storage unit 103 .
- a CD-ROM or DVD-ROM is used as a recording medium to provide the program describing the processing in the learning device 1.
- the configuration of the computer system and the program to be provided are not limited to this.
- a program provided by a transmission medium such as the Internet via the communication unit 105 may be used depending on the capacity.
- the program of the present embodiment provides a computer system that generates learned data to be used for detection of abnormal signs, from the values of each point for one cycle of normal data, which is normal data, from one cycle before N A step of calculating a difference value before the N cycles by subtracting the average value of each corresponding point in the cycle of the normal data up to the cycle before; and generating, as learned data, a normality determination threshold value used for determining whether or not.
- the preprocessing unit 13, the first waveform analysis unit 14, and the removed waveform extraction unit 15 shown in FIG. 1 are executed by the control unit 101 shown in FIG. 7 from computer programs stored in the storage unit 103 shown in FIG. It is realized by The storage unit 103 shown in FIG. 7 is also used to realize the preprocessing unit 13, the first waveform analysis unit 14, and the removed waveform extraction unit 15 shown in FIG.
- the data storage unit 12, the removed waveform storage unit 16, and the first learning data storage unit 17 shown in FIG. 1 are part of the storage unit 103 shown in FIG.
- Data acquisition unit 11 shown in FIG. 1 is implemented by communication unit 105 and control unit 101 shown in FIG.
- the learning device 1 may be realized by a plurality of computer systems.
- the learning device 1 may be realized by a cloud computer system.
- the abnormality sign detection device 2 is also realized by the computer system shown in FIG.
- the preprocessing unit 23, the first waveform analysis unit 24, and the overdetection removal unit 25 shown in FIG. 1 are executed by the control unit 101 shown in FIG. 7 according to a computer program stored in the storage unit 103 shown in FIG. It is realized by The storage unit 103 shown in FIG. 7 is also used to realize the preprocessing unit 23, the first waveform analysis unit 24, and the overdetection removal unit 25 shown in FIG.
- the data storage unit 22, the removed waveform storage unit 26, and the first learning data storage unit 27 shown in FIG. 1 are part of the storage unit 103 shown in FIG.
- Data acquisition unit 21 shown in FIG. 1 is realized by communication unit 105 and control unit 101 shown in FIG.
- the detection result output unit 28 is implemented by the communication unit 105 or the display unit 104 . If the computer system that implements the sign-of-abnormality detection device 2 is the slave station described above, the computer system may be simpler than the computer system shown in FIG. For example, the display unit 104 and the output unit 106 may be removed from the computer system shown in FIG.
- the abnormal sign detection system 3 of the present embodiment detects an abnormal sign by similar waveform analysis for learning normal waveforms, and performs differential processing before N cycles as preprocessing for learning. As a result, it is possible to improve the detection accuracy of the sign of abnormality. In addition, by further performing smoothing processing in the preprocessing, it is possible to further improve the detection accuracy of signs of abnormality.
- FIG. 8 is a diagram illustrating a configuration example of an abnormality sign detection system according to a second embodiment
- An abnormality sign detection system 3a of the present embodiment includes a learning device 1a and an abnormality sign detection device 2a.
- the learning device 1a of the present embodiment includes a preprocessing unit 13a, a classification unit 18, a phase matching unit 19, and a second waveform analysis unit 41 instead of the preprocessing unit 13, the removed waveform extraction unit 15, and the removed waveform storage unit 16. and a second learning data storage unit 42, the learning device 1 is the same as the learning device 1 of the first embodiment.
- the abnormal sign detection device 2a of the present embodiment includes a preprocessing unit 23a, a classification unit 29, a phase matching unit 30, a second waveform analysis It is the same as the abnormality sign detection device 2 of Embodiment 1 except that the unit 31 and the second learning data storage unit 32 are provided.
- Components having functions similar to those of the first embodiment are denoted by the same reference numerals as those of the first embodiment, and overlapping descriptions are omitted. Differences from the first embodiment will be mainly described below.
- the first waveform analysis unit 14 learns normal waveforms through similar waveform analysis.
- the abnormal sign waveform data and the abnormal sign determination threshold value used for determining whether or not there is an abnormal sign are further analyzed by similar waveform analysis using the abnormal sign data, which is data with an abnormal sign. and a second waveform analysis unit 41 for generating .
- the abnormal sign waveform and the abnormal sign determination threshold are also learned data used for detecting an abnormal sign.
- An abnormal symptom waveform is a waveform in which an abnormal symptom appears.
- the abnormal sign waveform Detect abnormal signs using learning results.
- the measurement data of the instantaneous value of at least one of the zero-phase current and the zero-phase voltage measured in the distribution system is used as time-series data. 1, the configuration and operation of this embodiment can also be applied to other time-series data.
- step S6 may be performed by providing the removed waveform extraction unit 15 and the removed waveform storage unit 16 described in the first embodiment.
- FIG. 9 is a flowchart showing an example of a processing procedure for learning an abnormal sign waveform by similar waveform analysis according to the present embodiment.
- the learning device 1a acquires instantaneous values (abnormal sign data) (step S21).
- the data acquisition unit 11 acquires measurement data of instantaneous values of waveforms in which signs of abnormality have been found to occur, for example, from another device (not shown) as signs of abnormality data.
- a plurality of pieces of data of short intervals are input as the abnormal sign data.
- the learning device 1a performs smoothing processing in the same manner as in Embodiment 1 (step S2), and the data after the smoothing processing is input to the classification unit 18.
- the learning device 1a performs waveform classification (step S22).
- the classification unit 18 classifies the smoothed data according to the distance, and outputs the classified data to the phase matching unit 19 .
- Any sorting method may be used in the sorting unit 18.
- the K-Shape method is used for sorting. Note that this waveform classification is intended to improve the accuracy of abnormal symptom waveforms by classifying waveforms with a low degree of similarity (longer distances), so waveforms with a high degree of similarity can be detected. Waveform classification may not be performed if possible.
- the learning device 1a performs phase matching (step S23). Specifically, the phase matching unit 19 performs a process of matching the phases of a plurality of data input from the classifying unit 18 .
- phase matching is performed to match the phases in the power cycle between a plurality of data.
- the phase matching may be performed by the operator specifying the amount of offset while checking the shape of each waveform, or may be performed by other methods. It should be noted that, for example, when data with the same phase is input, the phase matching does not have to be performed.
- phase matching and second waveform analysis may be performed for each group classified by the classification section 18 . In this case, an abnormality sign determination threshold may be set for each group.
- the learning device 1a performs a second waveform analysis (similar waveform analysis) (step S24).
- the second waveform analysis unit 41 uses the data input from the phase matching unit 19 to calculate the outlier score, and the calculated outlier score is used to determine whether or not there is an abnormality sign. Determining thresholds for judgment of signs of abnormality.
- the abnormality sign determination threshold value is set to, for example, 3 ⁇ as in the first embodiment, but is not limited to this.
- the second waveform analysis unit 41 stores the abnormal sign waveform data and the abnormal sign determination threshold in the second learning data storage unit 42 .
- Information stored in the second learning data storage unit 42 of the learning device 1a is stored in the second learning data storage unit 32 of the abnormality sign detection device 2a.
- the method of reflecting the information of the second learning data storage unit 42 to the second learning data storage unit 32 is the same as the method of reflecting the information of the first learning data storage unit 17 to the first learning data storage unit 27 of the first embodiment. It is the same.
- FIG. 10 is a flowchart showing an example of a processing procedure during inference in the anomaly sign detection device 2a of the present embodiment.
- Steps S11 to S16 are the same as in the first embodiment.
- the pre-processing unit 23 a outputs the data after the post-smoothing processing in step S ⁇ b>12 (before the N-cycle pre-difference processing) to the classifying unit 29 .
- the first waveform analysis section 24 also outputs the determination result to the classification section 29 .
- the abnormality sign detection device 2a performs waveform classification (step S31). Specifically, the classification unit 29 classifies the data determined to have signs of abnormality by the first waveform analysis unit 24 into the distance from the signs of abnormality waveform data of each group stored in the second learning data storage unit 32. Classify the data to be detected based on
- the abnormality sign detection device 2a performs phase matching (step S32). Specifically, the phase matching unit 30 performs a process of matching the phase of the data to be detected with the abnormal sign waveform data of the corresponding group.
- the abnormality sign detection device 2a performs second waveform analysis (similar waveform analysis) (step S33). Specifically, the second waveform analysis unit 31 calculates an outlier score using the phase-matched data and the symptom-of-abnormal waveform data for each group stored in the second learning data storage unit 32, and the outlier score is If the score is equal to or less than the abnormality sign determination threshold value, it is determined that there is an abnormality sign, and if the deviation score exceeds the abnormality sign determination threshold value, it is determined that there is no abnormality sign.
- the second waveform analysis section 31 outputs the determination result to the detection result output section 28 .
- Step S18 after step S33 is the same as in the first embodiment. If determined as No in step S ⁇ b>16 , the classification section 29 outputs the determination result of the first waveform analysis section 24 to the detection result output section 28 .
- Step S31 may be executed when it is determined that the filtering process by type is normal.
- the second waveform analysis unit 31 uses the detection target data, the abnormality symptom waveform, and the abnormality symptom determination threshold value to Determine whether or not there is an abnormality sign.
- overdetection is removed by type-specific filter processing. to remove
- the type-specific filter processing is to specially store the behavior of a device that operates only occasionally, determine that the behavior detected by the behavior is normal, and remove it.
- the similar waveform analysis by is to pass only those that are similar to past abnormal sign data and remove the others.
- the similar waveform analysis by the second waveform analysis unit 31 learns waveforms with explanatory properties (well-known laws of physics, records of accidents, etc.) as abnormal symptom waveforms when a specific waveform appears at the time of an accident. and pass a waveform similar to that waveform as an anomaly symptom waveform. Therefore, the similar waveform analysis by the second waveform analysis unit 31 can improve the explainability of waveforms detected as signs of abnormality, compared to the case of using filtering by type.
- the second waveform analysis is performed when an abnormal symptom is detected in the first waveform analysis.
- the results of both analyses may be used to detect signs of anomalies. For example, if an abnormal symptom is detected by either the first waveform analysis or the second waveform analysis, the final detection result is determined to be an abnormal symptom, and the first waveform analysis and the second waveform analysis are performed. If both are determined to be normal, the final result may be normal.
- the learning device 1a of the present embodiment is realized by, for example, the computer system shown in FIG.
- the preprocessing unit 13a, the classification unit 18, the phase matching unit 19, and the second waveform analysis unit 41 shown in FIG. 9 are executed by the control unit 101 shown in FIG. It is realized by being executed by The second learning data storage unit 42 shown in FIG. 9 is part of the storage unit 103 shown in FIG.
- the sign-of-abnormality detection device 2a is realized by the computer system shown in FIG. 7, for example.
- the preprocessing unit 23a, the classification unit 29, the phase matching unit 30, and the second waveform analysis unit 31 shown in FIG. 9 are controlled by the control unit 101 shown in FIG. It is realized by being executed by The second learning data storage unit 32 shown in FIG. 9 is part of the storage unit 103 shown in FIG.
- abnormal signs are detected by similar waveform analysis for learning normal waveforms, and N cycles before difference processing is performed as preprocessing for learning. As a result, it is possible to improve the detection accuracy of the sign of abnormality.
- FIG. 11 is a diagram illustrating a configuration example of an abnormality sign detection system according to a third embodiment.
- An abnormality sign detection system 3b of the present embodiment includes a learning device 1b and an abnormality sign detection device 2b.
- the learning device 1b of the present embodiment includes a data acquisition unit 11a, a difference analysis unit 43, and a third learning data storage unit 44 instead of the data acquisition unit 11, the removed waveform extraction unit 15, and the removed waveform storage unit 16. are the same as those of the learning device 1 of the first embodiment.
- the abnormality sign detection device 2b of the present embodiment includes a data acquisition unit 21a, a difference analysis unit 33, and a third learning data storage unit 34 instead of the data acquisition unit 21, the overdetection removal unit 25, and the removed waveform storage unit 26. It is the same as the abnormality sign detection device 2 of Embodiment 1 except that it is provided. Components having functions similar to those of the first embodiment are denoted by the same reference numerals as those of the first embodiment, and overlapping descriptions are omitted. Differences from the first embodiment will be mainly described below.
- the measurement data of the instantaneous value of the measurement target which is at least one of the zero-phase current and the zero-phase voltage measured in the distribution system, is used as time-series data.
- measurement data are obtained not only for instantaneous values but also for effective values.
- the processing capability of the hardware of the abnormality sign detection device 2b is restricted in order to suppress the .
- the instantaneous value is 6000 points of data per second if the power supply cycle in the power distribution system is 60 Hz.
- the voltage and current of the distribution system are generally obtained as measurement data also for the effective value, and since the effective value is one data per cycle, the number of data points is smaller than the instantaneous value.
- the operation of the present embodiment is not limited to the case where the measurement data to be detected is at least one of the zero-phase current and the zero-phase voltage measured in the distribution system, and the measurement data to be detected is periodic. At least one of a certain current and voltage can be applied, and the period is not limited to the power supply frequency.
- detection of abnormal signs using effective values is always performed, and when abnormal signs are detected by detecting abnormal signs using effective values, instantaneous values around the time of detection are calculated. Detect abnormal signs using As a result, it is possible to reduce the processing load on the abnormality sign detection device 2b and improve the detection accuracy of the abnormality sign by performing detailed analysis of the waveform using the instantaneous value.
- step S6 may be performed by providing the removed waveform extraction unit 15 and the removed waveform storage unit 16 described in the first embodiment.
- FIG. 12 is a flowchart showing an example of a learning processing procedure using effective values according to the present embodiment.
- the learning device 1b acquires effective values (normal data) (step S41).
- the data acquisition unit 11 a acquires the measurement data of the effective value of the object to be measured, that is, the measurement data of the effective value in the normal period, and stores it in the data storage unit 12 .
- the learning device 1b performs first-order difference value analysis (step S42). Specifically, the difference analysis unit 43 obtains a first-order difference value, which is the difference between the effective value measurement data and the previous data. Then, the standard deviation is obtained using a plurality of first-order difference values, and the threshold value for determining whether or not it is normal is determined using the standard deviation. This threshold value is also learned data used for detection of signs of abnormality. For example, the difference analysis unit 43 uses 6 ⁇ as a threshold. Here, the threshold is set to 6 ⁇ , but the threshold is not limited to this value as long as it is determined based on the result of preliminary evaluation, for example. The difference analysis section 43 stores the calculated threshold in the third learning data storage section 44 .
- Information stored in the third learning data storage unit 44 of the learning device 1b is stored in the third learning data storage unit 34 of the abnormality sign detection device 2b.
- the method of reflecting the information of the third learning data storage unit 44 to the third learning data storage unit 34 is the same as the method of reflecting the information of the first learning data storage unit 17 to the first learning data storage unit 27 of the first embodiment. It is the same.
- FIG. 13 is a flowchart showing an example of a processing procedure during inference in the anomaly sign detection device 2b of the present embodiment.
- the sign-of-abnormality detection device 2b acquires the effective value of the detection target (step S51). Specifically, the data acquisition unit 21 a acquires the effective value of the detection target and stores it in the data storage unit 22 . At this time, the data acquisition unit 21 a also acquires instantaneous values and stores them in the data storage unit 22 .
- the abnormality sign detection device 2b performs first-order difference value analysis (step S52). Specifically, the difference analysis unit 33 calculates the first-order difference value using the effective value stored in the data storage unit 22, and the first-order difference value and the third learning data storage unit 44 store the difference value. Compare with threshold.
- steps S12 to S15 are performed in the same manner as in the first embodiment.
- the determination result of step S15 is notified from the first waveform analysis unit 24 to the detection result output unit 28, and step S18 is performed. More specifically, steps S12 to S15 are performed using an instantaneous value for a certain period of time, such as two seconds, after the sign of abnormality is detected. As described above, when the processing described in step S6 of the first embodiment is performed during learning, even if steps S16 and S17 are performed after step S15 in the same manner as in the first embodiment, good.
- step S53 No If no sign of abnormality is detected (step S53 No), that is, if normal, the process of step S18 is performed. Note that, as in the first embodiment, when it is determined to be normal, the detection result does not have to be output.
- the difference analysis unit 33 calculates the first-order difference value of the measurement data of the effective value of the detection target of the measurement target, and uses the calculated first-order difference value and the threshold value. , determines whether or not there is an abnormality symptom, and if the difference analysis unit 33 determines that there is an abnormality symptom, the first waveform analysis unit 24 compares the difference value before N cycles, the normal waveform, and the normal determination threshold is used to determine whether or not there is an abnormality sign by similar waveform analysis.
- the first waveform analysis and the first order difference value analysis are performed in parallel, and the results of both analyzes are used to detect an abnormality sign.
- the final detection result is determined to be an abnormal symptom, and the first waveform analysis and the second waveform analysis are performed. If both are determined to be normal, the final result may be normal.
- the learning device 1b of the present embodiment is realized by, for example, the computer system shown in FIG. 7, like the learning device 1 of the first embodiment.
- the difference analysis unit 43 shown in FIG. 11 is realized by executing a computer program stored in the storage unit 103 shown in FIG. 7 by the control unit 101 shown in FIG.
- the third learning data storage unit 44 shown in FIG. 11 is part of the storage unit 103 shown in FIG.
- Data acquisition unit 11a shown in FIG. 11 is implemented by communication unit 105 and control unit 101 shown in FIG.
- the sign-of-abnormality detection device 2b is realized by the computer system shown in FIG. 7, for example.
- the difference analysis unit 33 shown in FIG. 11 is realized by executing a computer program stored in the storage unit 103 shown in FIG. 7 by the control unit 101 shown in FIG.
- the third learning data storage unit 34 shown in FIG. 11 is part of the storage unit 103 shown in FIG.
- Data acquisition unit 21a shown in FIG. 11 is implemented by communication unit 105 and control unit 101 shown in FIG.
- abnormal signs are detected by similar waveform analysis for learning normal waveforms, and N cycles before difference processing is performed as preprocessing for learning. As a result, it is possible to improve the detection accuracy of the sign of abnormality.
- the processing load of the abnormality sign detection device 2b can be reduced compared to the case where the abnormality sign is always detected using the instantaneous value.
- FIG. 14 is a diagram illustrating a configuration example of an abnormality sign detection system according to a fourth embodiment.
- An abnormality sign detection system 3c of the present embodiment includes a learning device 1c and an abnormality sign detection device 2c.
- a learning device 1c of the present embodiment includes a data acquisition unit 11b, a preprocessing
- the learning device 1b of the third embodiment is the same as the learning device 1b except that it includes a section 13b, a classification section 18, a phase matching section 19, a second waveform analysis section 41, and a second learning data storage section .
- the abnormality sign detection device 2c of the present embodiment includes a data acquisition unit 21b, Except for including a preprocessing unit 23b, a classification unit 29, a phase matching unit 30, a second waveform analysis unit 31, and a second learning data storage unit 32, it is the same as the abnormal sign detection device 2b of the third embodiment.
- the classification unit 18, the phase matching unit 19, the second waveform analysis unit 41, the second learning data storage unit 42, the classification unit 29, the phase matching unit 30, the second waveform analysis unit 31, and the second learning data storage unit 32 perform The classification unit 18, the phase matching unit 19, the second waveform analysis unit 41, the second learning data storage unit 42, the classification unit 29, the phase matching unit 30, the second waveform analysis unit 31, and the second learning data described in form 2 It is the same as that of the storage unit 32 .
- Components having functions similar to those of the second and third embodiments are assigned the same reference numerals as those of the second and third embodiments, and duplicate descriptions are omitted. Differences from the second and third embodiments will be mainly described below.
- the preprocessing unit 13 b does not perform N-cycle pre-difference processing, but performs smoothing processing as preprocessing, and outputs data after preprocessing to the second waveform analysis unit 41 .
- the processing shown in FIG. 9 of the second embodiment and the processing shown in FIG. 12 of the third embodiment are performed. That is, the learning device 1c of the present embodiment performs normal waveform learning using normal data, which is normal data, and abnormal sign waveform learning using abnormal sign data, which is data with an abnormal sign. Generate trained data.
- normal waveform learning is performed by the differential analysis unit 43
- abnormal symptom waveform learning is performed by the second waveform analysis unit 41, which is an abnormal symptom waveform analysis unit.
- FIG. 15 is a flowchart showing an example of a processing procedure during inference in the anomaly sign detection device 2c of the present embodiment.
- the preprocessing unit 23 b does not perform N-cycle pre-difference processing, but performs smoothing processing as preprocessing, and outputs data after preprocessing to the second waveform analysis unit 31 .
- Steps S51 to S53 are the same as in the third embodiment. If Yes in step S53, steps S31 to S33 and S18 are performed as in the second embodiment.
- the learning device 1c and the sign-of-abnormality detection device 2c of the present embodiment are also realized by, for example, the computer system shown in FIG. 7, like the learning device 1 and the sign-of-abnormality detection device 2 of the first embodiment.
- normal waveforms are learned by first-order difference value analysis, and abnormal symptom waveforms are learned by similar waveform analysis.
- abnormal signs are detected by combining learning of normal waveforms and learning of abnormal sign waveforms. As a result, it is possible to improve the detection accuracy of the signs of abnormality.
- FIG. 16 is a diagram illustrating a configuration example of an abnormality sign detection system according to a fifth embodiment.
- An abnormality sign detection system 3d of the present embodiment includes a learning device 1d and an abnormality sign detection device 2d.
- the learning apparatus 1d of the present embodiment has a preprocessing unit 13b and a first waveform analysis unit 14a, instead of the preprocessing unit 13 and the first waveform analysis unit 14 of the second embodiment, except that the preprocessing unit 13b and the first waveform analysis unit 14a are provided as in the second embodiment. is the same as that of the learning device 1a.
- the abnormality sign detection device 2d of the present embodiment is similar to that of Embodiment 2 except that the first waveform analysis unit 24 and the first learning data storage unit 27 are deleted and the preprocessing unit 23b is provided instead of the preprocessing unit 23. is the same as that of the abnormality sign detection device 2a.
- Pre-processing section 13b and pre-processing section 23b are the same as in the fourth embodiment. Components having functions similar to those of the second and fourth embodiments are denoted by the same reference numerals as those of the second and fourth embodiments, and overlapping descriptions are omitted. Differences from the second and fourth embodiments will be mainly described below.
- an abnormal sign is detected by learning by similar waveform analysis for learning an abnormal sign waveform described in the second embodiment.
- the judgment result of the similar waveform analysis of the normal waveform is used.
- the first waveform analysis section 14a of the present embodiment has both the function of the first waveform analysis section 14 of the first embodiment and the function of the first waveform analysis section 24 of the first embodiment.
- the first waveform analysis unit 14a uses the normal data stored in the data storage unit 12 to perform the first waveform analysis in the same manner as the first waveform analysis unit 14 of the first embodiment, thereby performing the first learning data storage unit 17 stores the normal waveform data and the normal determination threshold value. Using this learning result, a similar waveform analysis for learning an abnormal sign waveform is performed.
- FIG. 17 is a flow chart showing an example of a similar waveform analysis processing procedure for learning an abnormal symptom waveform according to the present embodiment.
- the learning device 1d acquires an instantaneous value to be extracted from an abnormal sign waveform (step S61).
- the data acquisition unit 11 acquires measurement data of instantaneous values from which abnormal symptom waveforms are extracted, and stores the measurement data in the data storage unit 22 .
- the measurement data is the measurement data of the period assumed to include the abnormal symptom waveform, if the period assumed to include the abnormal symptom waveform is not known, arbitrary measurement data is input. may
- the learning device 1d performs smoothing processing (step S62). Specifically, the preprocessing unit 13b performs smoothing processing on the measurement data stored in the data storage unit 22, and outputs the processed data to the first waveform analysis unit 14a.
- the learning device 1d performs first waveform analysis (similar waveform analysis) (step S63). Specifically, the first waveform analysis unit 14a divides the smoothed measurement data into unit interval data, and normal waveform data stored in the first learning data storage unit 17 for each unit interval data. is compared with the normality determination threshold value stored in the first learning data storage unit 17 to determine whether or not there is an abnormality sign in the unit interval data.
- the learning device 1d extracts an abnormality sign waveform candidate (step S64). Specifically, the first waveform analysis unit 14 a extracts the unit interval data determined to have an abnormality symptom as an abnormality symptom waveform candidate, and outputs it to the classification unit 18 . After that, steps S22 to S24 are performed in the same manner as in the second embodiment.
- the abnormality sign detection device 2d of the present embodiment performs steps S12 and S31 to S33 and S18 described in the second embodiment.
- the first waveform analysis unit 14a performs similar waveform analysis using normal data, which is normal data, to determine a normal waveform and a normal judgment threshold value for judging that the waveform is normal. and extracts candidate data that is a candidate for data with an abnormal sign from the detection target data using the detection target data, which is data containing a waveform with an abnormal sign, and the normal learning data.
- the second waveform analysis unit 41 uses the candidate data, the second waveform analysis unit 41 generates, as learned data, an abnormal sign waveform and an abnormal sign judgment threshold value used for judging whether or not there is an abnormal sign by similar waveform analysis. do.
- the learning device 1d of the present embodiment performs normal waveform learning using normal data, which is normal data, and abnormal sign waveform learning using abnormal sign data, which is data with abnormal signs.
- Generate learned data by Normal waveform learning is processing by the first waveform analysis unit 14a, which is the normal waveform analysis unit
- abnormal sign waveform learning is processing by the second waveform analysis unit 41, which is the abnormal sign waveform analysis unit.
- the learning device 1d and the sign-of-abnormality detection device 2d of the present embodiment are also realized by, for example, the computer system shown in FIG. 7, like the learning device 1 and the sign-of-abnormality detection device 2 of the first embodiment.
- candidates for abnormal sign waveforms are determined using the results of detection of abnormal signs by similar waveform analysis of normal waveforms, and similar waveform analysis of abnormal sign waveforms is performed using the determined candidates. Carry out learning. Thus, in this embodiment as well, learning of normal waveforms and learning of abnormal sign waveforms are combined. As a result, it is possible to improve the detection accuracy of the signs of abnormality.
Landscapes
- Engineering & Computer Science (AREA)
- Theoretical Computer Science (AREA)
- Physics & Mathematics (AREA)
- General Physics & Mathematics (AREA)
- Software Systems (AREA)
- Computer Vision & Pattern Recognition (AREA)
- Evolutionary Computation (AREA)
- Data Mining & Analysis (AREA)
- General Engineering & Computer Science (AREA)
- Mathematical Physics (AREA)
- Artificial Intelligence (AREA)
- Medical Informatics (AREA)
- Computing Systems (AREA)
- Quality & Reliability (AREA)
- Multimedia (AREA)
- Spectroscopy & Molecular Physics (AREA)
- Life Sciences & Earth Sciences (AREA)
- Bioinformatics & Cheminformatics (AREA)
- Bioinformatics & Computational Biology (AREA)
- Evolutionary Biology (AREA)
- Testing And Monitoring For Control Systems (AREA)
- Locating Faults (AREA)
- Measurement Of Current Or Voltage (AREA)
- Alarm Systems (AREA)
Priority Applications (7)
| Application Number | Priority Date | Filing Date | Title |
|---|---|---|---|
| JP2022549925A JP7278499B1 (ja) | 2021-11-30 | 2021-11-30 | 学習装置、異常兆候検知装置、異常兆候検知システム、学習方法およびプログラム |
| GB2407346.2A GB2627391A (en) | 2021-11-30 | 2021-11-30 | Learning device, abnormality sign detection device, abnormality sign detection system, learning method, and program |
| US18/701,559 US20240403718A1 (en) | 2021-11-30 | 2021-11-30 | Learning device, anomaly indication detection device, anomaly indication detection system, learning method, and storage medium |
| PCT/JP2021/043847 WO2023100243A1 (ja) | 2021-11-30 | 2021-11-30 | 学習装置、異常兆候検知装置、異常兆候検知システム、学習方法およびプログラム |
| TW111144576A TWI823684B (zh) | 2021-11-30 | 2022-11-22 | 學習裝置、異常徵兆檢測裝置、異常徵兆檢測系統、學習方法及記錄媒體 |
| TW112134061A TWI852760B (zh) | 2021-11-30 | 2022-11-22 | 學習裝置、異常徵兆檢測裝置、異常徵兆檢測系統、學習方法及記錄媒體 |
| JP2023073761A JP7536138B2 (ja) | 2021-11-30 | 2023-04-27 | 学習装置、異常兆候検知装置、異常兆候検知システム、学習方法およびプログラム |
Applications Claiming Priority (1)
| Application Number | Priority Date | Filing Date | Title |
|---|---|---|---|
| PCT/JP2021/043847 WO2023100243A1 (ja) | 2021-11-30 | 2021-11-30 | 学習装置、異常兆候検知装置、異常兆候検知システム、学習方法およびプログラム |
Publications (1)
| Publication Number | Publication Date |
|---|---|
| WO2023100243A1 true WO2023100243A1 (ja) | 2023-06-08 |
Family
ID=86382593
Family Applications (1)
| Application Number | Title | Priority Date | Filing Date |
|---|---|---|---|
| PCT/JP2021/043847 Ceased WO2023100243A1 (ja) | 2021-11-30 | 2021-11-30 | 学習装置、異常兆候検知装置、異常兆候検知システム、学習方法およびプログラム |
Country Status (5)
| Country | Link |
|---|---|
| US (1) | US20240403718A1 (https=) |
| JP (2) | JP7278499B1 (https=) |
| GB (1) | GB2627391A (https=) |
| TW (2) | TWI852760B (https=) |
| WO (1) | WO2023100243A1 (https=) |
Families Citing this family (3)
| Publication number | Priority date | Publication date | Assignee | Title |
|---|---|---|---|---|
| CN119644040A (zh) * | 2024-12-12 | 2025-03-18 | 深圳供电局有限公司 | 一种低压线路故障诊断分析方法及装置 |
| CN119717779A (zh) * | 2024-12-31 | 2025-03-28 | 天玑机电科技(徐州)有限公司 | 一种控制器故障自动检测方法 |
| CN120408456B (zh) * | 2025-06-30 | 2025-09-05 | 深圳供电局有限公司 | 基于电流与谐波波动的交流电弧检测方法及相关装置 |
Citations (3)
| Publication number | Priority date | Publication date | Assignee | Title |
|---|---|---|---|---|
| JPH05163993A (ja) * | 1991-12-10 | 1993-06-29 | Japan Electron Control Syst Co Ltd | 内燃機関におけるブローバイガス発生検出装置及び燃料供給系異常診断装置 |
| JP2013133799A (ja) * | 2011-12-27 | 2013-07-08 | Denso Corp | エンジン制御装置 |
| US20190362245A1 (en) * | 2018-05-24 | 2019-11-28 | International Business Machines Corporation | Anomaly detection |
Family Cites Families (10)
| Publication number | Priority date | Publication date | Assignee | Title |
|---|---|---|---|---|
| JPH0692914B2 (ja) * | 1989-04-14 | 1994-11-16 | 株式会社日立製作所 | 機器/設備の状態診断システム |
| JPH03251022A (ja) * | 1990-02-28 | 1991-11-08 | Mitsubishi Electric Corp | 配電線の異常状態監視装置 |
| JP6426667B2 (ja) * | 2016-08-10 | 2018-11-21 | 三菱重工工作機械株式会社 | 工作機械の工具の異常検知装置及び方法 |
| JP6792129B2 (ja) * | 2017-03-03 | 2020-11-25 | 株式会社安川電機 | アーク溶接システム及びアーク溶接判定装置 |
| JP2018156151A (ja) * | 2017-03-15 | 2018-10-04 | ファナック株式会社 | 異常検知装置及び機械学習装置 |
| JP7094608B2 (ja) * | 2018-01-11 | 2022-07-04 | Kyb株式会社 | 不良判定方法 |
| JP7070255B2 (ja) * | 2018-08-31 | 2022-05-18 | 富士通株式会社 | 異常判別プログラム、異常判別方法および異常判別装置 |
| CN110215202A (zh) * | 2019-05-14 | 2019-09-10 | 杭州电子科技大学 | 基于步态非线性特征的心电rr间隔预测关联方法 |
| CN112199252B (zh) * | 2020-09-30 | 2024-05-31 | 中国民航信息网络股份有限公司 | 一种异常监控方法、装置及电子设备 |
| CN113095355B (zh) * | 2021-03-03 | 2022-08-23 | 上海工程技术大学 | 改进差分进化算法优化随机森林的滚动轴承故障诊断方法 |
-
2021
- 2021-11-30 JP JP2022549925A patent/JP7278499B1/ja active Active
- 2021-11-30 US US18/701,559 patent/US20240403718A1/en active Pending
- 2021-11-30 WO PCT/JP2021/043847 patent/WO2023100243A1/ja not_active Ceased
- 2021-11-30 GB GB2407346.2A patent/GB2627391A/en active Pending
-
2022
- 2022-11-22 TW TW112134061A patent/TWI852760B/zh active
- 2022-11-22 TW TW111144576A patent/TWI823684B/zh active
-
2023
- 2023-04-27 JP JP2023073761A patent/JP7536138B2/ja active Active
Patent Citations (3)
| Publication number | Priority date | Publication date | Assignee | Title |
|---|---|---|---|---|
| JPH05163993A (ja) * | 1991-12-10 | 1993-06-29 | Japan Electron Control Syst Co Ltd | 内燃機関におけるブローバイガス発生検出装置及び燃料供給系異常診断装置 |
| JP2013133799A (ja) * | 2011-12-27 | 2013-07-08 | Denso Corp | エンジン制御装置 |
| US20190362245A1 (en) * | 2018-05-24 | 2019-11-28 | International Business Machines Corporation | Anomaly detection |
Also Published As
| Publication number | Publication date |
|---|---|
| JP7278499B1 (ja) | 2023-05-19 |
| JPWO2023100243A1 (https=) | 2023-06-08 |
| TWI823684B (zh) | 2023-11-21 |
| JP7536138B2 (ja) | 2024-08-19 |
| TWI852760B (zh) | 2024-08-11 |
| US20240403718A1 (en) | 2024-12-05 |
| JP2023109769A (ja) | 2023-08-08 |
| TW202401308A (zh) | 2024-01-01 |
| GB2627391A8 (en) | 2024-09-18 |
| GB2627391A (en) | 2024-08-21 |
| TW202324225A (zh) | 2023-06-16 |
| GB202407346D0 (en) | 2024-07-10 |
Similar Documents
| Publication | Publication Date | Title |
|---|---|---|
| JP2023109769A (ja) | 学習装置、異常兆候検知装置、異常兆候検知システム、学習方法およびプログラム | |
| CN111459700B (zh) | 设备故障的诊断方法、诊断装置、诊断设备及存储介质 | |
| CN110458248B (zh) | 基于多测点振动信号的变压器异常状态检测方法 | |
| CN117668751B (zh) | 一种高低压电力系统故障诊断方法及装置 | |
| CN118261584B (zh) | 基于多参量数据的变压器状态评估方法及系统 | |
| CN110222765B (zh) | 一种永磁同步电机健康状态监测方法及系统 | |
| US20160196175A1 (en) | Information processing system, information processing method, and program | |
| US20230351158A1 (en) | Apparatus, system and method for detecting anomalies in a grid | |
| CN114184870A (zh) | 非侵入式负荷识别方法及设备 | |
| CN110347717A (zh) | 一种基于城市电力设备监测的大数据存储方法 | |
| CN114613116A (zh) | 防外破预警方法、装置、设备及存储介质 | |
| CN120763716B (zh) | 一种基于膨胀残差网络的旋转机械故障诊断方法 | |
| CN119199428A (zh) | 开关柜局部放电检测方法、系统、电子设备及存储介质 | |
| CN109255201B (zh) | 一种基于som-mqe的滚珠丝杠副健康评估方法 | |
| CN115128345B (zh) | 一种基于谐波监测的电网安全预警方法及系统 | |
| CN105389475B (zh) | 一种基于小波包分解的电厂设备故障检测方法 | |
| CN116576957A (zh) | 光缆外破预警界面的显示方法、装置、设备及存储介质 | |
| CN119805200B (zh) | 一种配电网开关故障智能诊断方法、装置及电子设备 | |
| CN120449050A (zh) | 一种电力载波数据异常检测方法和装置 | |
| CN121125445A (zh) | 监控告警方法、装置、设备及存储介质 | |
| KR102216513B1 (ko) | 실시간 전류 분석을 통한 전동기 열화 감지 방법 및 장치 | |
| CN112446320A (zh) | 一种模糊识别逻辑门多重互补局放判别装置及方法 | |
| KR20220062250A (ko) | 초음파 대역의 음향 신호를 이용한 설비 고장 예측 시스템 및 그 방법 | |
| de Andrade et al. | Power quality disturbances segmentation based on wavelet decomposition and adaptive thresholds | |
| CN115063402B (zh) | 基于滑动分析的电缆异物检测方法、系统、终端及介质 |
Legal Events
| Date | Code | Title | Description |
|---|---|---|---|
| WWE | Wipo information: entry into national phase |
Ref document number: 2022549925 Country of ref document: JP |
|
| 121 | Ep: the epo has been informed by wipo that ep was designated in this application |
Ref document number: 21966329 Country of ref document: EP Kind code of ref document: A1 |
|
| ENP | Entry into the national phase |
Ref document number: 202407346 Country of ref document: GB Kind code of ref document: A Free format text: PCT FILING DATE = 20211130 |
|
| WWE | Wipo information: entry into national phase |
Ref document number: 2407346.2 Country of ref document: GB |
|
| NENP | Non-entry into the national phase |
Ref country code: DE |
|
| WWP | Wipo information: published in national office |
Ref document number: 2407346.2 Country of ref document: GB |
|
| 122 | Ep: pct application non-entry in european phase |
Ref document number: 21966329 Country of ref document: EP Kind code of ref document: A1 |