WO2023100243A1 - Learning device, abnormality sign detection device, abnormality sign detection system, learning method, and program - Google Patents
Learning device, abnormality sign detection device, abnormality sign detection system, learning method, and program Download PDFInfo
- Publication number
- WO2023100243A1 WO2023100243A1 PCT/JP2021/043847 JP2021043847W WO2023100243A1 WO 2023100243 A1 WO2023100243 A1 WO 2023100243A1 JP 2021043847 W JP2021043847 W JP 2021043847W WO 2023100243 A1 WO2023100243 A1 WO 2023100243A1
- Authority
- WO
- WIPO (PCT)
- Prior art keywords
- data
- waveform
- normal
- sign
- learning
- Prior art date
Links
- 230000005856 abnormality Effects 0.000 title claims abstract description 158
- 238000001514 detection method Methods 0.000 title claims description 195
- 238000000034 method Methods 0.000 title claims description 53
- 238000004458 analytical method Methods 0.000 claims abstract description 206
- 238000007781 pre-processing Methods 0.000 claims abstract description 73
- 230000002159 abnormal effect Effects 0.000 claims description 155
- 238000005259 measurement Methods 0.000 claims description 61
- 208000024891 symptom Diseases 0.000 claims description 43
- 238000013500 data storage Methods 0.000 description 81
- 238000012545 processing Methods 0.000 description 80
- 238000009499 grossing Methods 0.000 description 18
- 238000010586 diagram Methods 0.000 description 16
- 238000000605 extraction Methods 0.000 description 13
- 238000004891 communication Methods 0.000 description 10
- 230000006870 function Effects 0.000 description 8
- 239000000284 extract Substances 0.000 description 7
- 238000004590 computer program Methods 0.000 description 6
- 230000000694 effects Effects 0.000 description 6
- 230000006399 behavior Effects 0.000 description 3
- 238000001914 filtration Methods 0.000 description 3
- 238000005070 sampling Methods 0.000 description 3
- 238000001228 spectrum Methods 0.000 description 3
- 238000011156 evaluation Methods 0.000 description 2
- 238000010801 machine learning Methods 0.000 description 2
- 230000015654 memory Effects 0.000 description 2
- 241000270295 Serpentes Species 0.000 description 1
- 230000005540 biological transmission Effects 0.000 description 1
- 235000005770 birds nest Nutrition 0.000 description 1
- 230000001186 cumulative effect Effects 0.000 description 1
- 230000001419 dependent effect Effects 0.000 description 1
- 230000006866 deterioration Effects 0.000 description 1
- 230000001747 exhibiting effect Effects 0.000 description 1
- 238000002474 experimental method Methods 0.000 description 1
- 238000009413 insulation Methods 0.000 description 1
- 239000004973 liquid crystal related substance Substances 0.000 description 1
- 238000003062 neural network model Methods 0.000 description 1
- 230000000737 periodic effect Effects 0.000 description 1
- 235000005765 wild carrot Nutrition 0.000 description 1
Images


Classifications
-
- G—PHYSICS
- G06—COMPUTING; CALCULATING OR COUNTING
- G06F—ELECTRIC DIGITAL DATA PROCESSING
- G06F18/00—Pattern recognition
- G06F18/10—Pre-processing; Data cleansing
-
- G—PHYSICS
- G06—COMPUTING; CALCULATING OR COUNTING
- G06N—COMPUTING ARRANGEMENTS BASED ON SPECIFIC COMPUTATIONAL MODELS
- G06N20/00—Machine learning
Definitions
- the present disclosure relates to a learning device, an anomaly sign detection device, an anomaly sign detection system, a learning method, and a program that perform machine learning for anomaly sign detection.
- a ground fault that occurs in a power distribution system may be accompanied by some kind of precursory phenomenon, and techniques for capturing this precursory phenomenon have been proposed.
- Patent Document 1 discloses a technique for inferring the state of insulation deterioration by supervised learning using a neural network model using the frequency spectrum of at least one of the zero-phase voltage and zero-phase current in a distribution system. It is
- the present disclosure has been made in view of the above, and aims to obtain a learning device capable of improving the detection accuracy of signs of abnormality.
- a learning device that generates learned data used for detecting signs of abnormality, and has a predetermined time length as one cycle.
- N is an integer of 2 or more
- the learning device further uses the difference value before N cycles to generate, as learned data, a normal waveform and a normality determination threshold value used to determine whether the waveform is normal, by similar waveform analysis. and an analysis unit.
- the learning device has the effect of improving the detection accuracy of signs of abnormality.
- FIG. 1 is a diagram showing a configuration example of an abnormality symptom detection system according to a first embodiment
- FIG. FIG. 2 is a diagram showing an arrangement example of the anomaly sign detection system according to the first embodiment in a distribution system
- 3 is a flowchart showing an example of a processing procedure during learning in the learning device according to Embodiment 1
- FIG. 4 is a diagram for explaining preprocessing according to Embodiment 1
- a diagram schematically showing an example of the effect of the pretreatment of the first embodiment. 1 is a diagram showing a configuration example of a computer system that implements the learning device according to Embodiment 1;
- Flowchart showing an example of a processing procedure for learning a sign-of-abnormal waveform by analyzing similar waveforms according to the second embodiment Flowchart showing an example of a processing procedure at the time of inference in the abnormality sign detection device of Embodiment 2
- Flowchart showing an example of a processing procedure for learning using effective values according to the third embodiment Flowchart showing an example of a processing procedure at the time of inference in the anomaly sign detection device of Embodiment 3
- FIG. 11 is a diagram showing a configuration example of an abnormality sign detection system according to a fifth embodiment; FIG. Flowchart showing an example of a processing procedure of similar waveform analysis for learning abnormal symptom waveforms according to the fifth embodiment
- a learning device an anomaly sign detection device, an anomaly sign detection system, a learning method, and a program according to the embodiments will be described in detail below with reference to the drawings.
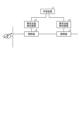
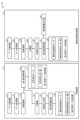
- FIG. 1 is a diagram illustrating a configuration example of an abnormality sign detection system according to a first embodiment
- An abnormality sign detection system 3 of the present embodiment includes a learning device 1 and an abnormality sign detection device 2 .
- the learning device 1 generates learned data used for detection of abnormal signs, and the abnormal sign detection device 2 uses the learned data generated by the learning device 1 to detect abnormal signs.
- the learning device 1 performs learning for detecting anomalies, for example, by waveform analysis of time-series data acquired by a sensor or the like. Waveform analysis in the present embodiment is an example of machine learning, also called similar waveform analysis.
- a reference waveform is accumulated as a reference waveform, and a threshold value for an outlier score indicating similarity to the reference waveform is set. decide. Then, in the waveform analysis according to the present embodiment, at the time of detecting an abnormal sign, that is, at the time of inferring whether or not an abnormal sign has occurred, the time-series data of the detection target and the reference waveform are used to obtain the time-series data of the detection target. A deviation score is calculated for each waveform with respect to the reference waveform in , and an abnormality sign is detected based on the result of comparison between the deviation score and a threshold determined by learning.
- the learning device 1 includes a data acquisition unit 11, a data storage unit 12, a preprocessing unit 13, a first waveform analysis unit 14, a removed waveform extraction unit 15, a removed waveform storage unit 16, and a first learning data storage.
- a section 17 is provided.
- the data acquisition unit 11 acquires time-series data for a normal period and stores it in the data storage unit 12.
- the data acquisition unit 11 acquires measurement data from, for example, a sensor that acquires time-series data.
- the preprocessing unit 13 performs smoothing processing on the time-series data stored in the data storage unit 12, cuts into a window size (one unit interval size), and performs N (N is an integer equal to or greater than 2) cycles. Preprocessing such as pre-difference processing is performed, and the data after preprocessing is output to the first waveform analysis unit 14 . Since the preprocessed data is cut out to the window size, it is output to the first waveform analysis unit 14 for each unit interval of data.
- the data of one unit interval is hereinafter also referred to as unit interval data.
- the preprocessing unit 13 outputs the unit interval data before the N cycles before difference processing is performed to the removed waveform extraction unit 15 .
- the first waveform analysis unit 14 learns normal waveforms through similar waveform analysis. Specifically, the first waveform analysis unit 14 calculates the distance between the preprocessed unit interval data as an outlier score, and uses the calculated outlier score to determine whether the data is normal or not. A threshold value is determined, and the determined normality determination threshold value is stored in the first learning data storage unit 17 .
- the distance between unit interval data is, for example, DTW (Dynamic Time Warping) distance, Mahalanobis distance, Euclidean distance, etc. Any distance may be used, but here, the distance between unit interval data is As an example, it is assumed that the cumulative value for one unit section of the distance for each sampling point between unit section data.
- the normality determination threshold is determined, for example, based on the standard deviation of the outlier scores. For example, the first waveform analysis unit 14 sets the normality determination threshold to 3 ⁇ when the standard deviation of the outlier scores is ⁇ . The first waveform analysis section 14 also selects unit section data to be stored as normal waveform data, and stores the selected unit section data in the first learning data storage section 17 as normal waveform data. In addition, the first waveform analysis unit 14 outputs identification information for identifying unit interval data determined to be normal data but rarely occurring waveforms to the removed waveform extraction unit 15 . The normal waveform and the normality determination threshold value stored in the first learning data storage unit 17 are learned data used for detection of signs of abnormality.
- the removed waveform extracting unit 15 extracts unit interval data corresponding to the identification information received from the first waveform analyzing unit 14 from among the unit interval data received from the preprocessing unit 13, that is, unit interval data determined to be rarely occurring waveforms. are classified into a plurality of waveform types, and conditions for determining normality are determined for each waveform type.
- the waveform condition for determining normality is determined based on, for example, the average value, standard deviation, maximum value, minimum value, etc. of each sample point in the unit interval data.
- the removed waveform extracting unit 15 stores the corresponding waveforms and waveform conditions for each type in the removed waveform storage unit 16 .
- the removed waveform extracting unit 15 is a process performed to prevent overdetection in which a waveform that is normal but causes a problem-free event, for example, with a large deviation score, is determined to be an abnormal sign. As will be described later, the information stored in the removed waveform storage unit 16 is used in the process of preventing overdetection in the abnormality sign detection device 2 .
- the removal of overdetection using the waveform condition for each waveform type determined by the removed waveform extraction unit 15 is also called filtering by type.
- the abnormal sign detection device 2 includes a data acquisition unit 21, a data storage unit 22, a preprocessing unit 23, a first waveform analysis unit 24, an overdetection removal unit 25, a removed waveform storage unit 26, a first learning data storage unit 27, and a detection A result output unit 28 is provided.
- the removed waveform storage unit 26 stores the same information as the information stored in the above-described removed waveform storage unit 16, and the first learning data storage unit 27 stores the information stored in the above-described first learning data storage unit 17. The same information as the information stored in the
- the data acquisition unit 21 acquires detection target data, which is time-series data for detection of abnormal signs, and stores the data in the data storage unit 22 .
- the preprocessing unit 23 performs the same preprocessing as the preprocessing unit 13 on the detection target data stored in the data storage unit 22 and outputs the preprocessed data to the first waveform analysis unit 24 .
- the preprocessing unit 23 outputs the unit interval data before the difference processing before N cycles to the overdetection removal unit 25 .
- the first waveform analysis unit 24 uses the unit interval data after preprocessing and the learned data to determine whether or not there is an abnormality sign by similar waveform analysis. Specifically, the first waveform analysis section 24 calculates the distance between the preprocessed unit section data and each of the normal waveform data stored in the first learning data storage section 27 as the first learning data storage section 27 . By comparing with the normality determination threshold value stored in , it is determined whether or not there is an abnormality symptom in the unit interval data after preprocessing, and the determination result is output to the overdetection removal unit 25 . For example, the first waveform analysis unit 24 determines that there is an abnormality sign when the smallest deviation score among the calculated deviation scores is equal to or greater than the normality determination threshold. When the first waveform analysis unit 24 determines that there is an abnormality sign, it also outputs the corresponding unit interval data to the overdetection removal unit 25 .
- the overdetection removal unit 25 combines the unit interval data received from the preprocessing unit 23 with the removed waveform storage unit 26.
- the waveform type of the unit interval data is determined by comparing with the waveforms of different types stored in the removed waveform storage unit 26, and the normality corresponding to the determined type among the normality determination conditions stored in the removed waveform storage unit 26 is determined. It is determined whether or not the unit interval data is normal using a determination condition.
- the overdetection removing unit 25 removes the abnormal symptom from the unit section data. It is determined that there is no detection result, and the determination result is output to the detection result output unit 28 . Further, when the determination result received from the first waveform analysis unit 24 indicates that there is an abnormal symptom and the normal determination condition indicates that the overdetection removal unit 25 is not normal, the unit interval data determines that there is an abnormality symptom, and outputs the determination result to the detection result output unit 28 .
- the overdetection removal unit 25 determines that the unit interval data determined to have an abnormal sign by the first waveform analysis unit 24 is not normal, the overdetection removal unit 25 When the determination result received from the first waveform analysis unit 24 indicates that there is no sign of abnormality, the overdetection removal unit 25 outputs the determination result to the detection result output unit 28 .
- the determination result when the first waveform analysis unit 24 determines that there is an abnormal symptom is notified to the detection result output unit 28 via the overdetection removal unit 25.
- the first waveform analysis unit 24 may directly notify the detection result output unit 28 of the determination result when the first waveform analysis unit 24 determines that there is an abnormality sign.
- the determination result is output to the detection result output unit 28 even when there is no sign of abnormality.
- the determination result is output to the detection result output unit 28 when there is no sign of abnormality. It does not have to be. That is, the determination result may be output to the detection result output unit 28 only when an abnormality symptom is detected.
- the learning device 1 and the sign-of-abnormality detection device 2 are provided separately, but the learning device 1 and the sign-of-abnormality detection device 2 may be integrated.
- the removed waveform storage unit 26 may not be provided and the removed waveform storage unit 16 may be used instead of the above-described removed waveform storage unit 26, and the first learning data storage unit 27 may not be provided and the first learning data storage unit 17 may be used instead of the first learning data storage unit 27 described above, or the data storage unit 22 may not be provided and the data storage unit 12 may be used instead of the data storage unit 22 described above.
- the data acquisition unit 11, the preprocessing unit 13, and the first waveform analysis unit 14 also function as the data acquisition unit 21, the preprocessing unit 23, and the first waveform analysis unit 24, respectively.
- the preprocessing section 23 and the first waveform analysis section 24 may not be provided. Since the learning device 1 and the sign-of-abnormality detection device 2 have many processes in common, when they are integrated, they can share such common parts.
- the anomaly sign detection system 3 of the present embodiment can be applied, for example, to detect an anomaly sign in a power distribution system.
- FIG. 2 is a diagram showing an arrangement example of the anomaly sign detection system 3 of the present embodiment in a distribution system.
- the abnormality sign detection device 2 is a device called a slave station that controls switches 4 that connect sections in the distribution system.
- the sign-of-abnormality detection device 2 may be a device connected to a slave station that controls the switch 4 .
- a slave station can monitor the distribution system and control the switch 4 according to instructions from the master station. In this way, the slave station measures the current and voltage of the power distribution system. It is possible to detect signs of abnormality in the distribution system using the current and voltage obtained.
- a slave station is installed, for example, on a utility pole together with a transformer.
- the learning device 1 is the parent station or is connected to the parent station.
- the data in the first learning data storage unit 17 and the removed waveform storage unit 16 can be transmitted to the abnormal sign detection device 2 after the learning device 1 has learned.
- the method of reflecting the data in the first learning data storage unit 17 and the removed waveform storage unit 16 to the abnormal sign detection device 2 is not limited to this example, and the data from the learning device 1 to the abnormal sign detection device using another communication network. 2, or the abnormality sign detection device 2 may acquire these data via a recording medium or the like.
- abnormalities may occur in the distribution line or other equipment in the distribution system due to the effects of fallen trees, contact with trees, birds, snakes, etc.
- the abnormality sign detection device 2 can detect an abnormality sign at various places in the distribution system. Abnormalities can be dealt with before they occur.
- abnormality sign detection system 3 of the present embodiment is not limited to this, and other equipment in the electric power system, equipment in various plants, other An anomaly sign can be detected with respect to time-series data acquired by a sensor in an electrical device, and the time-series data for which an anomaly sign is detected may be of any type.
- each slave station measures current and voltage.
- the measurement data of the instantaneous value of at least one of the zero-phase current and the zero-phase voltage is used as time-series data to detect signs of abnormality. That is, one of the zero-phase current and the zero-phase voltage may be used as measurement data to detect signs of abnormality, or the detection of signs of abnormality using the zero-phase current as measurement data and the zero-phase voltage as measurement data. You may perform both the detection of the abnormality sign used. When performing both, for example, when an abnormality sign is detected in either one, it is determined that an abnormality sign is detected. Also, it is assumed that the measurement data of the zero-phase current and the zero-phase voltage are acquired as instantaneous values.
- the sensor that acquires the time-series data measures at least one of the zero-phase current and the zero-phase voltage.
- measurement data is acquired at a sampling period sufficiently shorter than the power supply period in the distribution system. Since the processing is the same when using either the zero-phase current or the zero-phase voltage, the zero-phase current and the zero-phase voltage are described below as measurement data of instantaneous values without distinction.
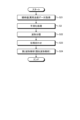
- FIG. 3 is a flowchart showing an example of a processing procedure during learning in the learning device 1 of the present embodiment.
- the learning device 1 acquires instantaneous values (normal data) (step S1).
- the data acquisition unit 11 acquires measurement data of instantaneous values in a normal period as time-series data, and stores the acquired measurement data in the data storage unit 12 .
- the data acquisition unit 11 may acquire measurement data of instantaneous values during a period when it is known to be normal from another device (not shown) that has been acquired by a sensor in the past and stored in another device.
- measurement data of instantaneous values obtained by an experiment may be obtained, or measurement data of instantaneous values may be obtained from a sensor during a period known to be normal.
- the learning device 1 performs smoothing processing (step S2). Specifically, the preprocessing unit 13 smoothes the measurement data stored in the data storage unit 12 using, for example, a first-order lag filter. Any value may be set for the filter coefficient of the first-order lag filter. %) to perform smoothing with a first-order lag filter.
- the learning device 1 extracts data (step S3).
- the preprocessing unit 13 extracts window size data from the measurement data stored in the data storage unit 12 .
- the preprocessing unit 13 generates unit interval data by segmenting the smoothed measurement data by window size.
- the window size may be set in any way, but here, as an example, it is set to one cycle of the power source.
- the window size is not limited to this, and may be set to another value such as, for example, two cycles of the power supply cycle.
- the learning device 1 performs difference processing before N cycles (step S4).
- the preprocessing unit 13 performs N-cycle pre-difference processing for each unit segment data that is window size data.
- N-cycles-before difference processing a predetermined time length is set as one cycle, and from the values of each point for one cycle of the normal data, which is normal data, This is a process of calculating the difference value before N cycles by subtracting the average value of each corresponding point.
- the difference processing before N cycles is a process of subtracting the average value of the values at corresponding points from one cycle to N cycles before from the value of each point in the current unit segment data. be.
- the N cycles before difference Q k,i P k,i ⁇ (P k ⁇ 1,i +P k ⁇ 2,i + . . . +P k ⁇ N,i )/N (1)
- the learning device 1 performs first waveform analysis (similar waveform analysis) (step S5). Specifically, the first waveform analysis unit 14 calculates the outlier score by calculating the distance between the preprocessed unit interval data, and obtains the standard deviation ⁇ of the calculated outlier score. Then, the normality determination threshold value is set to 3 ⁇ , and data to be stored as normality determination data is selected from the unit interval data. Here, the normality determination threshold is set to 3 ⁇ , but the normality determination threshold is not limited to this value as long as it is determined based on the result of preliminary evaluation, for example. The first waveform analysis unit 14 stores the selected normality determination data and the normality determination threshold in the first learning data storage unit 17 . In addition, the first waveform analysis unit 14 notifies the removed waveform extraction unit 15 of identification information for identifying unit interval data determined to be a normal waveform that rarely occurs.
- first waveform analysis unit 14 notifies the removed waveform extraction unit 15 of identification information for identifying unit interval data determined to be a normal waveform that rarely occurs.
- the learning device 1 extracts a waveform for removing overdetection (step S6).
- the removed waveform extraction unit 15 classifies the unit interval data corresponding to the identification information notified from the first waveform analysis unit 14 into a plurality of waveform types, and determines that each waveform type is normal. Determine the normality determination condition, which is the condition.
- the removed waveform extracting section 15 stores the corresponding unit section data and the normality determination condition in the removed waveform storage section 16 . Learning is completed by the above processing. In addition, after learning is completed once, re-learning may be performed using newly acquired measurement data.
- the learning data that is, the information stored in the first learning data storage unit 17 and the information stored in the removed waveform storage unit 16 are reflected in the abnormality sign detection device 2 .
- these pieces of information are transmitted from the learning device 1 to the sign-of-abnormality detection device 2 , so that these pieces of information are reflected in the sign-of-abnormality detection device 2 .
- FIG. 4 is a flowchart showing an example of a processing procedure during inference in the abnormality sign detection device 2 of the present embodiment.
- the abnormality sign detection device 2 acquires an instantaneous value to be detected (step S11).
- the data acquisition unit 21 acquires measurement data of instantaneous values of an inference target, that is, an abnormality sign detection target.
- the sign-of-abnormality detection device 2 performs preprocessing similar to steps S2 to S4 for the instantaneous value to be detected (steps S12 to S14).
- the abnormal sign detection device 2 performs first waveform analysis (similar waveform analysis) (step S15).
- the first waveform analysis unit 24 stores the distance between the preprocessed unit interval data and each of the normal waveform data stored in the first learning data storage unit 27 in the first learning data storage unit 27. By comparing with the stored normality determination threshold value, it is determined whether or not there is an abnormality symptom in the unit interval data after preprocessing, and the determination result is output to the overdetection removal unit 25 .
- the abnormality sign detection device 2 detects an abnormality sign as a result of the first waveform analysis (step S16 Yes), it removes overdetection (step S17). Specifically, when the determination result received from the first waveform analysis unit 24 is a determination result indicating that there is an abnormal symptom, the overdetection removal unit 25 removes the unit interval data received from the preprocessing unit 23 and removes the unit interval data.
- the waveform type of the unit interval data is determined by comparing with the waveforms of different types stored in the waveform storage unit 26, and the determined type is selected from the normality determination conditions stored in the removed waveform storage unit 26. It determines whether or not the unit interval data is normal using the normality determination condition corresponding to , and outputs the determination result to the detection result output unit 28 .
- the abnormality sign detection device 2 outputs the detection result (step S18). Specifically, the detection result output unit 28 outputs the determination result received from the over-detection removal unit 25 as the detection result.
- the detection result output unit 28 since the sign-of-abnormality detection device 2 is a slave station or is connected to a slave station, the detection result output unit 28 sends the detection result to the learning device 1 or a parent station different from the learning device 1, for example. You may output the detection result by sending .
- the detection result output unit 28 is realized by the display unit, and the detection result output unit 28 outputs the detection result by displaying the detection result. good too.
- the learning device 1 or a parent station different from the learning device 1 receives the detection result from the abnormality sign detection device 2, it displays the detection result on a display unit (not shown in FIG. 1).
- the abnormal sign detection device 2 advances the process to step S18 without performing over-detection removal.
- the detection result may be output when no abnormal sign is detected, that is, when normal, or output when an abnormal sign is detected and output when no abnormal sign is detected. It does not have to be.
- over-detection removal is performed, but over-detection removal does not have to be performed.
- the removed waveform extractor 15, the removed waveform storage 16, the overdetection remover 25, and the removed waveform storage 26 may not be provided.
- the data stored in the data storage unit 22 may be deleted, for example, after a certain period of time has elapsed, or may be deleted in chronological order after reaching a certain amount.
- FIG. 5 is a diagram for explaining the preprocessing of this embodiment.
- the raw data which is instantaneous value measurement data, contains various types of noise, and thus has a waveform with many high-frequency components. Therefore, if the first waveform analysis, which is a similar waveform analysis, is performed as it is, the error becomes large, and erroneous detection of abnormal symptoms is likely to occur.
- the smoothing process by performing the smoothing process, it is possible to obtain a waveform in which the influence of noise is reduced, as shown in the middle part of FIG.
- the difference processing before N cycles when the difference processing before N cycles is performed, the components of large changes dependent on the power supply cycle are removed, so it becomes easier to detect the substantial changes compared to the raw data. .
- FIG. 6 is a diagram schematically showing an example of the effects of the pretreatment of this embodiment.
- FIG. 6 when raw data corresponding to a normal case and raw data corresponding to a case in which an abnormal sign is present are input as measurement data to be detected in the sign-of-abnormality detection apparatus 2 of the present embodiment, The results obtained are shown schematically.
- the raw data corresponding to the normal case, the data after preprocessing (smoothing processing and N-cycle pre-difference processing), and the outlier score are shown.
- Raw data, data after preprocessing (smoothing and N-cycle pre-difference processing) and outlier scores are shown.
- a threshold 201 is a normal determination threshold obtained by the first waveform analysis. As shown in FIG.
- the deviation score is equal to or less than the threshold value 201 when the condition is normal, and the deviation score exceeds the threshold value 201 when the symptom of abnormality appears.
- the influence of the change component that is the basis of the raw data is suppressed, the state of substantial change becomes easier to detect, and the outlier score is compared with the normal judgment threshold. It is possible to improve the detection accuracy of anomaly signs.
- FIG. 6 is a schematic diagram, it was confirmed that the detection accuracy of signs of abnormality can be improved by comparing the outlier score with the normal judgment threshold by performing analysis using similar actual data. It is
- the smoothing process does not have to be performed.
- the preprocessing unit 13 performs N-cycles-before difference processing
- the first waveform analysis unit 14 uses the N-cycles-before difference value to perform similar waveform analysis to determine whether the waveform is normal or not.
- the normality determination threshold value used for may be generated as learned data, and the smoothing process may or may not be performed before the difference process before N cycles.
- FIG. 7 is a diagram showing a configuration example of a computer system that implements the learning device 1 of this embodiment. As shown in FIG. 7, this computer system comprises a control section 101, an input section 102, a storage section 103, a display section 104, a communication section 105 and an output section 106, which are connected via a system bus 107. there is
- control unit 101 is, for example, a processor such as a CPU (Central Processing Unit), and executes a program describing the processing in the learning device 1 of this embodiment.
- Part of the control unit 101 may be realized by dedicated hardware such as GPU (Graphics Processing Unit), FPGA (Field-Programmable Gate Array).
- the input unit 102 is composed of, for example, a keyboard and a mouse, and is used by the user of the computer system to input various information.
- the storage unit 103 includes various memories such as RAM (Random Access Memory) and ROM (Read Only Memory) and storage devices such as hard disks, and stores programs to be executed by the control unit 101 and necessary information obtained in the process of processing. store data, etc.
- the storage unit 103 is also used as a temporary storage area for programs.
- the display unit 104 includes a display, LCD (liquid crystal display panel), etc., and displays various screens to the user of the computer system.
- a communication unit 105 is a receiver and a transmitter that perform communication processing.
- the output unit 106 is a printer, speaker, or the like. Note that FIG. 7 is an example, and the configuration of the computer system is not limited to the example in FIG.
- a computer program is stored in a storage unit from a CD-ROM or DVD-ROM set in a CD (Compact Disc)-ROM drive or a DVD (Digital Versatile Disc)-ROM drive (not shown).
- 103 installed. Then, when the program is executed, the program read from storage unit 103 is stored in the main storage area of storage unit 103 . In this state, control unit 101 executes processing as learning device 1 of the present embodiment according to the program stored in storage unit 103 .
- a CD-ROM or DVD-ROM is used as a recording medium to provide the program describing the processing in the learning device 1.
- the configuration of the computer system and the program to be provided are not limited to this.
- a program provided by a transmission medium such as the Internet via the communication unit 105 may be used depending on the capacity.
- the program of the present embodiment provides a computer system that generates learned data to be used for detection of abnormal signs, from the values of each point for one cycle of normal data, which is normal data, from one cycle before N A step of calculating a difference value before the N cycles by subtracting the average value of each corresponding point in the cycle of the normal data up to the cycle before; and generating, as learned data, a normality determination threshold value used for determining whether or not.
- the preprocessing unit 13, the first waveform analysis unit 14, and the removed waveform extraction unit 15 shown in FIG. 1 are executed by the control unit 101 shown in FIG. 7 from computer programs stored in the storage unit 103 shown in FIG. It is realized by The storage unit 103 shown in FIG. 7 is also used to realize the preprocessing unit 13, the first waveform analysis unit 14, and the removed waveform extraction unit 15 shown in FIG.
- the data storage unit 12, the removed waveform storage unit 16, and the first learning data storage unit 17 shown in FIG. 1 are part of the storage unit 103 shown in FIG.
- Data acquisition unit 11 shown in FIG. 1 is implemented by communication unit 105 and control unit 101 shown in FIG.
- the learning device 1 may be realized by a plurality of computer systems.
- the learning device 1 may be realized by a cloud computer system.
- the abnormality sign detection device 2 is also realized by the computer system shown in FIG.
- the preprocessing unit 23, the first waveform analysis unit 24, and the overdetection removal unit 25 shown in FIG. 1 are executed by the control unit 101 shown in FIG. 7 according to a computer program stored in the storage unit 103 shown in FIG. It is realized by The storage unit 103 shown in FIG. 7 is also used to realize the preprocessing unit 23, the first waveform analysis unit 24, and the overdetection removal unit 25 shown in FIG.
- the data storage unit 22, the removed waveform storage unit 26, and the first learning data storage unit 27 shown in FIG. 1 are part of the storage unit 103 shown in FIG.
- Data acquisition unit 21 shown in FIG. 1 is realized by communication unit 105 and control unit 101 shown in FIG.
- the detection result output unit 28 is implemented by the communication unit 105 or the display unit 104 . If the computer system that implements the sign-of-abnormality detection device 2 is the slave station described above, the computer system may be simpler than the computer system shown in FIG. For example, the display unit 104 and the output unit 106 may be removed from the computer system shown in FIG.
- the abnormal sign detection system 3 of the present embodiment detects an abnormal sign by similar waveform analysis for learning normal waveforms, and performs differential processing before N cycles as preprocessing for learning. As a result, it is possible to improve the detection accuracy of the sign of abnormality. In addition, by further performing smoothing processing in the preprocessing, it is possible to further improve the detection accuracy of signs of abnormality.
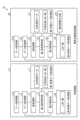
- FIG. 8 is a diagram illustrating a configuration example of an abnormality sign detection system according to a second embodiment
- An abnormality sign detection system 3a of the present embodiment includes a learning device 1a and an abnormality sign detection device 2a.
- the learning device 1a of the present embodiment includes a preprocessing unit 13a, a classification unit 18, a phase matching unit 19, and a second waveform analysis unit 41 instead of the preprocessing unit 13, the removed waveform extraction unit 15, and the removed waveform storage unit 16. and a second learning data storage unit 42, the learning device 1 is the same as the learning device 1 of the first embodiment.
- the abnormal sign detection device 2a of the present embodiment includes a preprocessing unit 23a, a classification unit 29, a phase matching unit 30, a second waveform analysis It is the same as the abnormality sign detection device 2 of Embodiment 1 except that the unit 31 and the second learning data storage unit 32 are provided.
- Components having functions similar to those of the first embodiment are denoted by the same reference numerals as those of the first embodiment, and overlapping descriptions are omitted. Differences from the first embodiment will be mainly described below.
- the first waveform analysis unit 14 learns normal waveforms through similar waveform analysis.
- the abnormal sign waveform data and the abnormal sign determination threshold value used for determining whether or not there is an abnormal sign are further analyzed by similar waveform analysis using the abnormal sign data, which is data with an abnormal sign. and a second waveform analysis unit 41 for generating .
- the abnormal sign waveform and the abnormal sign determination threshold are also learned data used for detecting an abnormal sign.
- An abnormal symptom waveform is a waveform in which an abnormal symptom appears.
- the abnormal sign waveform Detect abnormal signs using learning results.
- the measurement data of the instantaneous value of at least one of the zero-phase current and the zero-phase voltage measured in the distribution system is used as time-series data. 1, the configuration and operation of this embodiment can also be applied to other time-series data.
- step S6 may be performed by providing the removed waveform extraction unit 15 and the removed waveform storage unit 16 described in the first embodiment.
- FIG. 9 is a flowchart showing an example of a processing procedure for learning an abnormal sign waveform by similar waveform analysis according to the present embodiment.
- the learning device 1a acquires instantaneous values (abnormal sign data) (step S21).
- the data acquisition unit 11 acquires measurement data of instantaneous values of waveforms in which signs of abnormality have been found to occur, for example, from another device (not shown) as signs of abnormality data.
- a plurality of pieces of data of short intervals are input as the abnormal sign data.
- the learning device 1a performs smoothing processing in the same manner as in Embodiment 1 (step S2), and the data after the smoothing processing is input to the classification unit 18.
- the learning device 1a performs waveform classification (step S22).
- the classification unit 18 classifies the smoothed data according to the distance, and outputs the classified data to the phase matching unit 19 .
- Any sorting method may be used in the sorting unit 18.
- the K-Shape method is used for sorting. Note that this waveform classification is intended to improve the accuracy of abnormal symptom waveforms by classifying waveforms with a low degree of similarity (longer distances), so waveforms with a high degree of similarity can be detected. Waveform classification may not be performed if possible.
- the learning device 1a performs phase matching (step S23). Specifically, the phase matching unit 19 performs a process of matching the phases of a plurality of data input from the classifying unit 18 .
- phase matching is performed to match the phases in the power cycle between a plurality of data.
- the phase matching may be performed by the operator specifying the amount of offset while checking the shape of each waveform, or may be performed by other methods. It should be noted that, for example, when data with the same phase is input, the phase matching does not have to be performed.
- phase matching and second waveform analysis may be performed for each group classified by the classification section 18 . In this case, an abnormality sign determination threshold may be set for each group.
- the learning device 1a performs a second waveform analysis (similar waveform analysis) (step S24).
- the second waveform analysis unit 41 uses the data input from the phase matching unit 19 to calculate the outlier score, and the calculated outlier score is used to determine whether or not there is an abnormality sign. Determining thresholds for judgment of signs of abnormality.
- the abnormality sign determination threshold value is set to, for example, 3 ⁇ as in the first embodiment, but is not limited to this.
- the second waveform analysis unit 41 stores the abnormal sign waveform data and the abnormal sign determination threshold in the second learning data storage unit 42 .
- Information stored in the second learning data storage unit 42 of the learning device 1a is stored in the second learning data storage unit 32 of the abnormality sign detection device 2a.
- the method of reflecting the information of the second learning data storage unit 42 to the second learning data storage unit 32 is the same as the method of reflecting the information of the first learning data storage unit 17 to the first learning data storage unit 27 of the first embodiment. It is the same.
- FIG. 10 is a flowchart showing an example of a processing procedure during inference in the anomaly sign detection device 2a of the present embodiment.
- Steps S11 to S16 are the same as in the first embodiment.
- the pre-processing unit 23 a outputs the data after the post-smoothing processing in step S ⁇ b>12 (before the N-cycle pre-difference processing) to the classifying unit 29 .
- the first waveform analysis section 24 also outputs the determination result to the classification section 29 .
- the abnormality sign detection device 2a performs waveform classification (step S31). Specifically, the classification unit 29 classifies the data determined to have signs of abnormality by the first waveform analysis unit 24 into the distance from the signs of abnormality waveform data of each group stored in the second learning data storage unit 32. Classify the data to be detected based on
- the abnormality sign detection device 2a performs phase matching (step S32). Specifically, the phase matching unit 30 performs a process of matching the phase of the data to be detected with the abnormal sign waveform data of the corresponding group.
- the abnormality sign detection device 2a performs second waveform analysis (similar waveform analysis) (step S33). Specifically, the second waveform analysis unit 31 calculates an outlier score using the phase-matched data and the symptom-of-abnormal waveform data for each group stored in the second learning data storage unit 32, and the outlier score is If the score is equal to or less than the abnormality sign determination threshold value, it is determined that there is an abnormality sign, and if the deviation score exceeds the abnormality sign determination threshold value, it is determined that there is no abnormality sign.
- the second waveform analysis section 31 outputs the determination result to the detection result output section 28 .
- Step S18 after step S33 is the same as in the first embodiment. If determined as No in step S ⁇ b>16 , the classification section 29 outputs the determination result of the first waveform analysis section 24 to the detection result output section 28 .
- Step S31 may be executed when it is determined that the filtering process by type is normal.
- the second waveform analysis unit 31 uses the detection target data, the abnormality symptom waveform, and the abnormality symptom determination threshold value to Determine whether or not there is an abnormality sign.
- overdetection is removed by type-specific filter processing. to remove
- the type-specific filter processing is to specially store the behavior of a device that operates only occasionally, determine that the behavior detected by the behavior is normal, and remove it.
- the similar waveform analysis by is to pass only those that are similar to past abnormal sign data and remove the others.
- the similar waveform analysis by the second waveform analysis unit 31 learns waveforms with explanatory properties (well-known laws of physics, records of accidents, etc.) as abnormal symptom waveforms when a specific waveform appears at the time of an accident. and pass a waveform similar to that waveform as an anomaly symptom waveform. Therefore, the similar waveform analysis by the second waveform analysis unit 31 can improve the explainability of waveforms detected as signs of abnormality, compared to the case of using filtering by type.
- the second waveform analysis is performed when an abnormal symptom is detected in the first waveform analysis.
- the results of both analyses may be used to detect signs of anomalies. For example, if an abnormal symptom is detected by either the first waveform analysis or the second waveform analysis, the final detection result is determined to be an abnormal symptom, and the first waveform analysis and the second waveform analysis are performed. If both are determined to be normal, the final result may be normal.
- the learning device 1a of the present embodiment is realized by, for example, the computer system shown in FIG.
- the preprocessing unit 13a, the classification unit 18, the phase matching unit 19, and the second waveform analysis unit 41 shown in FIG. 9 are executed by the control unit 101 shown in FIG. It is realized by being executed by The second learning data storage unit 42 shown in FIG. 9 is part of the storage unit 103 shown in FIG.
- the sign-of-abnormality detection device 2a is realized by the computer system shown in FIG. 7, for example.
- the preprocessing unit 23a, the classification unit 29, the phase matching unit 30, and the second waveform analysis unit 31 shown in FIG. 9 are controlled by the control unit 101 shown in FIG. It is realized by being executed by The second learning data storage unit 32 shown in FIG. 9 is part of the storage unit 103 shown in FIG.
- abnormal signs are detected by similar waveform analysis for learning normal waveforms, and N cycles before difference processing is performed as preprocessing for learning. As a result, it is possible to improve the detection accuracy of the sign of abnormality.
- FIG. 11 is a diagram illustrating a configuration example of an abnormality sign detection system according to a third embodiment.
- An abnormality sign detection system 3b of the present embodiment includes a learning device 1b and an abnormality sign detection device 2b.
- the learning device 1b of the present embodiment includes a data acquisition unit 11a, a difference analysis unit 43, and a third learning data storage unit 44 instead of the data acquisition unit 11, the removed waveform extraction unit 15, and the removed waveform storage unit 16. are the same as those of the learning device 1 of the first embodiment.
- the abnormality sign detection device 2b of the present embodiment includes a data acquisition unit 21a, a difference analysis unit 33, and a third learning data storage unit 34 instead of the data acquisition unit 21, the overdetection removal unit 25, and the removed waveform storage unit 26. It is the same as the abnormality sign detection device 2 of Embodiment 1 except that it is provided. Components having functions similar to those of the first embodiment are denoted by the same reference numerals as those of the first embodiment, and overlapping descriptions are omitted. Differences from the first embodiment will be mainly described below.
- the measurement data of the instantaneous value of the measurement target which is at least one of the zero-phase current and the zero-phase voltage measured in the distribution system, is used as time-series data.
- measurement data are obtained not only for instantaneous values but also for effective values.
- the processing capability of the hardware of the abnormality sign detection device 2b is restricted in order to suppress the .
- the instantaneous value is 6000 points of data per second if the power supply cycle in the power distribution system is 60 Hz.
- the voltage and current of the distribution system are generally obtained as measurement data also for the effective value, and since the effective value is one data per cycle, the number of data points is smaller than the instantaneous value.
- the operation of the present embodiment is not limited to the case where the measurement data to be detected is at least one of the zero-phase current and the zero-phase voltage measured in the distribution system, and the measurement data to be detected is periodic. At least one of a certain current and voltage can be applied, and the period is not limited to the power supply frequency.
- detection of abnormal signs using effective values is always performed, and when abnormal signs are detected by detecting abnormal signs using effective values, instantaneous values around the time of detection are calculated. Detect abnormal signs using As a result, it is possible to reduce the processing load on the abnormality sign detection device 2b and improve the detection accuracy of the abnormality sign by performing detailed analysis of the waveform using the instantaneous value.
- step S6 may be performed by providing the removed waveform extraction unit 15 and the removed waveform storage unit 16 described in the first embodiment.
- FIG. 12 is a flowchart showing an example of a learning processing procedure using effective values according to the present embodiment.
- the learning device 1b acquires effective values (normal data) (step S41).
- the data acquisition unit 11 a acquires the measurement data of the effective value of the object to be measured, that is, the measurement data of the effective value in the normal period, and stores it in the data storage unit 12 .
- the learning device 1b performs first-order difference value analysis (step S42). Specifically, the difference analysis unit 43 obtains a first-order difference value, which is the difference between the effective value measurement data and the previous data. Then, the standard deviation is obtained using a plurality of first-order difference values, and the threshold value for determining whether or not it is normal is determined using the standard deviation. This threshold value is also learned data used for detection of signs of abnormality. For example, the difference analysis unit 43 uses 6 ⁇ as a threshold. Here, the threshold is set to 6 ⁇ , but the threshold is not limited to this value as long as it is determined based on the result of preliminary evaluation, for example. The difference analysis section 43 stores the calculated threshold in the third learning data storage section 44 .
- Information stored in the third learning data storage unit 44 of the learning device 1b is stored in the third learning data storage unit 34 of the abnormality sign detection device 2b.
- the method of reflecting the information of the third learning data storage unit 44 to the third learning data storage unit 34 is the same as the method of reflecting the information of the first learning data storage unit 17 to the first learning data storage unit 27 of the first embodiment. It is the same.
- FIG. 13 is a flowchart showing an example of a processing procedure during inference in the anomaly sign detection device 2b of the present embodiment.
- the sign-of-abnormality detection device 2b acquires the effective value of the detection target (step S51). Specifically, the data acquisition unit 21 a acquires the effective value of the detection target and stores it in the data storage unit 22 . At this time, the data acquisition unit 21 a also acquires instantaneous values and stores them in the data storage unit 22 .
- the abnormality sign detection device 2b performs first-order difference value analysis (step S52). Specifically, the difference analysis unit 33 calculates the first-order difference value using the effective value stored in the data storage unit 22, and the first-order difference value and the third learning data storage unit 44 store the difference value. Compare with threshold.
- steps S12 to S15 are performed in the same manner as in the first embodiment.
- the determination result of step S15 is notified from the first waveform analysis unit 24 to the detection result output unit 28, and step S18 is performed. More specifically, steps S12 to S15 are performed using an instantaneous value for a certain period of time, such as two seconds, after the sign of abnormality is detected. As described above, when the processing described in step S6 of the first embodiment is performed during learning, even if steps S16 and S17 are performed after step S15 in the same manner as in the first embodiment, good.
- step S53 No If no sign of abnormality is detected (step S53 No), that is, if normal, the process of step S18 is performed. Note that, as in the first embodiment, when it is determined to be normal, the detection result does not have to be output.
- the difference analysis unit 33 calculates the first-order difference value of the measurement data of the effective value of the detection target of the measurement target, and uses the calculated first-order difference value and the threshold value. , determines whether or not there is an abnormality symptom, and if the difference analysis unit 33 determines that there is an abnormality symptom, the first waveform analysis unit 24 compares the difference value before N cycles, the normal waveform, and the normal determination threshold is used to determine whether or not there is an abnormality sign by similar waveform analysis.
- the first waveform analysis and the first order difference value analysis are performed in parallel, and the results of both analyzes are used to detect an abnormality sign.
- the final detection result is determined to be an abnormal symptom, and the first waveform analysis and the second waveform analysis are performed. If both are determined to be normal, the final result may be normal.
- the learning device 1b of the present embodiment is realized by, for example, the computer system shown in FIG. 7, like the learning device 1 of the first embodiment.
- the difference analysis unit 43 shown in FIG. 11 is realized by executing a computer program stored in the storage unit 103 shown in FIG. 7 by the control unit 101 shown in FIG.
- the third learning data storage unit 44 shown in FIG. 11 is part of the storage unit 103 shown in FIG.
- Data acquisition unit 11a shown in FIG. 11 is implemented by communication unit 105 and control unit 101 shown in FIG.
- the sign-of-abnormality detection device 2b is realized by the computer system shown in FIG. 7, for example.
- the difference analysis unit 33 shown in FIG. 11 is realized by executing a computer program stored in the storage unit 103 shown in FIG. 7 by the control unit 101 shown in FIG.
- the third learning data storage unit 34 shown in FIG. 11 is part of the storage unit 103 shown in FIG.
- Data acquisition unit 21a shown in FIG. 11 is implemented by communication unit 105 and control unit 101 shown in FIG.
- abnormal signs are detected by similar waveform analysis for learning normal waveforms, and N cycles before difference processing is performed as preprocessing for learning. As a result, it is possible to improve the detection accuracy of the sign of abnormality.
- the processing load of the abnormality sign detection device 2b can be reduced compared to the case where the abnormality sign is always detected using the instantaneous value.
- FIG. 14 is a diagram illustrating a configuration example of an abnormality sign detection system according to a fourth embodiment.
- An abnormality sign detection system 3c of the present embodiment includes a learning device 1c and an abnormality sign detection device 2c.
- a learning device 1c of the present embodiment includes a data acquisition unit 11b, a preprocessing
- the learning device 1b of the third embodiment is the same as the learning device 1b except that it includes a section 13b, a classification section 18, a phase matching section 19, a second waveform analysis section 41, and a second learning data storage section .
- the abnormality sign detection device 2c of the present embodiment includes a data acquisition unit 21b, Except for including a preprocessing unit 23b, a classification unit 29, a phase matching unit 30, a second waveform analysis unit 31, and a second learning data storage unit 32, it is the same as the abnormal sign detection device 2b of the third embodiment.
- the classification unit 18, the phase matching unit 19, the second waveform analysis unit 41, the second learning data storage unit 42, the classification unit 29, the phase matching unit 30, the second waveform analysis unit 31, and the second learning data storage unit 32 perform The classification unit 18, the phase matching unit 19, the second waveform analysis unit 41, the second learning data storage unit 42, the classification unit 29, the phase matching unit 30, the second waveform analysis unit 31, and the second learning data described in form 2 It is the same as that of the storage unit 32 .
- Components having functions similar to those of the second and third embodiments are assigned the same reference numerals as those of the second and third embodiments, and duplicate descriptions are omitted. Differences from the second and third embodiments will be mainly described below.
- the preprocessing unit 13 b does not perform N-cycle pre-difference processing, but performs smoothing processing as preprocessing, and outputs data after preprocessing to the second waveform analysis unit 41 .
- the processing shown in FIG. 9 of the second embodiment and the processing shown in FIG. 12 of the third embodiment are performed. That is, the learning device 1c of the present embodiment performs normal waveform learning using normal data, which is normal data, and abnormal sign waveform learning using abnormal sign data, which is data with an abnormal sign. Generate trained data.
- normal waveform learning is performed by the differential analysis unit 43
- abnormal symptom waveform learning is performed by the second waveform analysis unit 41, which is an abnormal symptom waveform analysis unit.
- FIG. 15 is a flowchart showing an example of a processing procedure during inference in the anomaly sign detection device 2c of the present embodiment.
- the preprocessing unit 23 b does not perform N-cycle pre-difference processing, but performs smoothing processing as preprocessing, and outputs data after preprocessing to the second waveform analysis unit 31 .
- Steps S51 to S53 are the same as in the third embodiment. If Yes in step S53, steps S31 to S33 and S18 are performed as in the second embodiment.
- the learning device 1c and the sign-of-abnormality detection device 2c of the present embodiment are also realized by, for example, the computer system shown in FIG. 7, like the learning device 1 and the sign-of-abnormality detection device 2 of the first embodiment.
- normal waveforms are learned by first-order difference value analysis, and abnormal symptom waveforms are learned by similar waveform analysis.
- abnormal signs are detected by combining learning of normal waveforms and learning of abnormal sign waveforms. As a result, it is possible to improve the detection accuracy of the signs of abnormality.
- FIG. 16 is a diagram illustrating a configuration example of an abnormality sign detection system according to a fifth embodiment.
- An abnormality sign detection system 3d of the present embodiment includes a learning device 1d and an abnormality sign detection device 2d.
- the learning apparatus 1d of the present embodiment has a preprocessing unit 13b and a first waveform analysis unit 14a, instead of the preprocessing unit 13 and the first waveform analysis unit 14 of the second embodiment, except that the preprocessing unit 13b and the first waveform analysis unit 14a are provided as in the second embodiment. is the same as that of the learning device 1a.
- the abnormality sign detection device 2d of the present embodiment is similar to that of Embodiment 2 except that the first waveform analysis unit 24 and the first learning data storage unit 27 are deleted and the preprocessing unit 23b is provided instead of the preprocessing unit 23. is the same as that of the abnormality sign detection device 2a.
- Pre-processing section 13b and pre-processing section 23b are the same as in the fourth embodiment. Components having functions similar to those of the second and fourth embodiments are denoted by the same reference numerals as those of the second and fourth embodiments, and overlapping descriptions are omitted. Differences from the second and fourth embodiments will be mainly described below.
- an abnormal sign is detected by learning by similar waveform analysis for learning an abnormal sign waveform described in the second embodiment.
- the judgment result of the similar waveform analysis of the normal waveform is used.
- the first waveform analysis section 14a of the present embodiment has both the function of the first waveform analysis section 14 of the first embodiment and the function of the first waveform analysis section 24 of the first embodiment.
- the first waveform analysis unit 14a uses the normal data stored in the data storage unit 12 to perform the first waveform analysis in the same manner as the first waveform analysis unit 14 of the first embodiment, thereby performing the first learning data storage unit 17 stores the normal waveform data and the normal determination threshold value. Using this learning result, a similar waveform analysis for learning an abnormal sign waveform is performed.
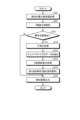
- FIG. 17 is a flow chart showing an example of a similar waveform analysis processing procedure for learning an abnormal symptom waveform according to the present embodiment.
- the learning device 1d acquires an instantaneous value to be extracted from an abnormal sign waveform (step S61).
- the data acquisition unit 11 acquires measurement data of instantaneous values from which abnormal symptom waveforms are extracted, and stores the measurement data in the data storage unit 22 .
- the measurement data is the measurement data of the period assumed to include the abnormal symptom waveform, if the period assumed to include the abnormal symptom waveform is not known, arbitrary measurement data is input. may
- the learning device 1d performs smoothing processing (step S62). Specifically, the preprocessing unit 13b performs smoothing processing on the measurement data stored in the data storage unit 22, and outputs the processed data to the first waveform analysis unit 14a.
- the learning device 1d performs first waveform analysis (similar waveform analysis) (step S63). Specifically, the first waveform analysis unit 14a divides the smoothed measurement data into unit interval data, and normal waveform data stored in the first learning data storage unit 17 for each unit interval data. is compared with the normality determination threshold value stored in the first learning data storage unit 17 to determine whether or not there is an abnormality sign in the unit interval data.
- the learning device 1d extracts an abnormality sign waveform candidate (step S64). Specifically, the first waveform analysis unit 14 a extracts the unit interval data determined to have an abnormality symptom as an abnormality symptom waveform candidate, and outputs it to the classification unit 18 . After that, steps S22 to S24 are performed in the same manner as in the second embodiment.
- the abnormality sign detection device 2d of the present embodiment performs steps S12 and S31 to S33 and S18 described in the second embodiment.
- the first waveform analysis unit 14a performs similar waveform analysis using normal data, which is normal data, to determine a normal waveform and a normal judgment threshold value for judging that the waveform is normal. and extracts candidate data that is a candidate for data with an abnormal sign from the detection target data using the detection target data, which is data containing a waveform with an abnormal sign, and the normal learning data.
- the second waveform analysis unit 41 uses the candidate data, the second waveform analysis unit 41 generates, as learned data, an abnormal sign waveform and an abnormal sign judgment threshold value used for judging whether or not there is an abnormal sign by similar waveform analysis. do.
- the learning device 1d of the present embodiment performs normal waveform learning using normal data, which is normal data, and abnormal sign waveform learning using abnormal sign data, which is data with abnormal signs.
- Generate learned data by Normal waveform learning is processing by the first waveform analysis unit 14a, which is the normal waveform analysis unit
- abnormal sign waveform learning is processing by the second waveform analysis unit 41, which is the abnormal sign waveform analysis unit.
- the learning device 1d and the sign-of-abnormality detection device 2d of the present embodiment are also realized by, for example, the computer system shown in FIG. 7, like the learning device 1 and the sign-of-abnormality detection device 2 of the first embodiment.
- candidates for abnormal sign waveforms are determined using the results of detection of abnormal signs by similar waveform analysis of normal waveforms, and similar waveform analysis of abnormal sign waveforms is performed using the determined candidates. Carry out learning. Thus, in this embodiment as well, learning of normal waveforms and learning of abnormal sign waveforms are combined. As a result, it is possible to improve the detection accuracy of the signs of abnormality.
Abstract
A learning device (1) according to the present disclosure generates learned data used to detect signs of abnormality, and is provided with: a preprocessing unit (13) that calculates difference values for previous N cycles, which are obtained by subtracting, from the value of each point in one cycle of normal data, the average of the values of the corresponding points in the immediately previous to Nth previous cycles of normal data, where one cycle is a defined time length and N is an integer at least equal to 2; and a first waveform analysis unit (14) that generates, as learned data, a normal waveform and a normality determination threshold value that is used to determine whether or not data is normal, through similarity waveform analysis using the difference values for the previous N cycles.
Description
本開示は、異常兆候検知のための機械学習を行う学習装置、異常兆候検知装置、異常兆候検知システム、学習方法およびプログラムに関する。
The present disclosure relates to a learning device, an anomaly sign detection device, an anomaly sign detection system, a learning method, and a program that perform machine learning for anomaly sign detection.
電力系統の設備、各種プラントにおける設備をはじめとして各種の重要な設備では、故障の影響が大きいため、故障の発生前に異常兆候を検知することが望まれている。例えば、配電系統で発生する地絡故障などでは何らかの前駆現象を伴うことがありこの前駆現象を捉える技術が提案されている。
Since failures have a large impact on various important facilities, including power system facilities and facilities in various plants, it is desirable to detect signs of anomalies before failures occur. For example, a ground fault that occurs in a power distribution system may be accompanied by some kind of precursory phenomenon, and techniques for capturing this precursory phenomenon have been proposed.
例えば、下記特許文献1には、配電系統における零相電圧および零相電流のうちの少なくとも一方の周波数スペクトルを用いて、ニューラルネットワークモデルを用いた教師あり学習により絶縁劣化状態を推論する技術が開示されている。
For example, Patent Document 1 below discloses a technique for inferring the state of insulation deterioration by supervised learning using a neural network model using the frequency spectrum of at least one of the zero-phase voltage and zero-phase current in a distribution system. It is
特許文献1に記載の技術では、瞬時地絡時には、零相電圧および零相電流のうちの少なくとも一方が、電源周波数と整数倍周波数以外にも多くの分数調波成分を含み、零相電圧の周波数スペクトルは電源周波数以下で周波数が低くなるほど大きくなる傾向を示すという前提のもとに、このような特徴の現れる信号を教師信号として用いている。しかしながら、故障の予兆としてはこのように波形の性質が既知のものだけではなく、要因によって様々な波形が有ると考えられる。特に、山間部に設置された配電線では、倒木、鳥の巣などの影響によって故障が生じることもあり、これらの現象による故障の予兆は特許文献1に記載された周波数スペクトルの特徴を有するとは限らない。このため、特許文献1に記載の技術では異常兆候の検知精度が十分ではない可能性がある。
In the technique described in Patent Document 1, at the time of an instantaneous ground fault, at least one of the zero-phase voltage and the zero-phase current contains many subharmonic components in addition to the power supply frequency and the integer multiple frequency, and the zero-phase voltage Based on the premise that the frequency spectrum tends to increase as the frequency becomes lower below the power supply frequency, a signal exhibiting such characteristics is used as the teacher signal. However, it is thought that there are various waveforms depending on factors as well as waveforms whose characteristics are known as signs of failure. In particular, in distribution lines installed in mountainous areas, failures may occur due to the effects of fallen trees, bird nests, etc., and it is said that signs of failure due to these phenomena have the characteristics of the frequency spectrum described in Patent Document 1. is not limited. Therefore, the technique described in Patent Literature 1 may not be sufficiently accurate in detecting signs of abnormality.
本開示は、上記に鑑みてなされたものであって、異常兆候の検知精度を向上させることが可能な学習装置を得ることを目的とする。
The present disclosure has been made in view of the above, and aims to obtain a learning device capable of improving the detection accuracy of signs of abnormality.
上述した課題を解決し、目的を達成するために、本開示にかかる学習装置は、異常兆候の検知に用いられる学習済データを生成する学習装置であって、定められた時間長を1周期とし、Nを2以上の整数とするとき、正常なデータである正常データの1周期分の各点の値から、1周期前からN周期前までの正常データの周期内の対応する各点の平均値をそれぞれ減じたN周期前差分値を算出する前処理部、を備える。学習装置は、さらに、N周期前差分値を用いて、類似波形解析によって、正常波形と正常であるか否かの判定に用いられる正常判定しきい値とを学習済データとして生成する第1波形解析部と、を備える。
In order to solve the above-described problems and achieve the object, a learning device according to the present disclosure is a learning device that generates learned data used for detecting signs of abnormality, and has a predetermined time length as one cycle. , where N is an integer of 2 or more, the average of the corresponding points within the normal data cycle from 1 cycle to N cycles before from the value of each point for 1 cycle of normal data, which is normal data and a preprocessing unit that calculates the N-period-before difference values from which the respective values are subtracted. The learning device further uses the difference value before N cycles to generate, as learned data, a normal waveform and a normality determination threshold value used to determine whether the waveform is normal, by similar waveform analysis. and an analysis unit.
本開示にかかる学習装置は、異常兆候の検知精度を向上させることができるという効果を奏する。
The learning device according to the present disclosure has the effect of improving the detection accuracy of signs of abnormality.
以下に、実施の形態にかかる学習装置、異常兆候検知装置、異常兆候検知システム、学習方法およびプログラムを図面に基づいて詳細に説明する。
A learning device, an anomaly sign detection device, an anomaly sign detection system, a learning method, and a program according to the embodiments will be described in detail below with reference to the drawings.
実施の形態1.
図1は、実施の形態1にかかる異常兆候検知システムの構成例を示す図である。本実施の形態の異常兆候検知システム3は、学習装置1と、異常兆候検知装置2と、を備える。学習装置1は、異常兆候の検知に用いられる学習済データを生成し、異常兆候検知装置2は、学習装置1によって生成された学習済データを用いて、異常兆候を検知する。学習装置1は、例えば、センサなどによって取得された時系列データに対して波形解析により異常検知を行うための学習を行う。本実施の形態における波形解析は、類似波形解析とも呼ばれる機械学習の一例であり、学習時には、基準となる波形を基準波形として蓄積するとともに基準波形との類似度を示す外れスコアに対するしきい値を決定する。そして、本実施の形態における波形解析では、異常兆候の検知時すなわち異常兆候が生じているか否かの推論時には、検知対象の時系列データと基準波形とを用いて、当該検知対象の時系列データにおける各波形の基準波形に対する外れスコアを算出し、外れスコアと学習によって定められたしきい値との比較結果に基づいて異常兆候を検知する。 Embodiment 1.
FIG. 1 is a diagram illustrating a configuration example of an abnormality sign detection system according to a first embodiment; An abnormalitysign detection system 3 of the present embodiment includes a learning device 1 and an abnormality sign detection device 2 . The learning device 1 generates learned data used for detection of abnormal signs, and the abnormal sign detection device 2 uses the learned data generated by the learning device 1 to detect abnormal signs. The learning device 1 performs learning for detecting anomalies, for example, by waveform analysis of time-series data acquired by a sensor or the like. Waveform analysis in the present embodiment is an example of machine learning, also called similar waveform analysis. During learning, a reference waveform is accumulated as a reference waveform, and a threshold value for an outlier score indicating similarity to the reference waveform is set. decide. Then, in the waveform analysis according to the present embodiment, at the time of detecting an abnormal sign, that is, at the time of inferring whether or not an abnormal sign has occurred, the time-series data of the detection target and the reference waveform are used to obtain the time-series data of the detection target. A deviation score is calculated for each waveform with respect to the reference waveform in , and an abnormality sign is detected based on the result of comparison between the deviation score and a threshold determined by learning.
図1は、実施の形態1にかかる異常兆候検知システムの構成例を示す図である。本実施の形態の異常兆候検知システム3は、学習装置1と、異常兆候検知装置2と、を備える。学習装置1は、異常兆候の検知に用いられる学習済データを生成し、異常兆候検知装置2は、学習装置1によって生成された学習済データを用いて、異常兆候を検知する。学習装置1は、例えば、センサなどによって取得された時系列データに対して波形解析により異常検知を行うための学習を行う。本実施の形態における波形解析は、類似波形解析とも呼ばれる機械学習の一例であり、学習時には、基準となる波形を基準波形として蓄積するとともに基準波形との類似度を示す外れスコアに対するしきい値を決定する。そして、本実施の形態における波形解析では、異常兆候の検知時すなわち異常兆候が生じているか否かの推論時には、検知対象の時系列データと基準波形とを用いて、当該検知対象の時系列データにおける各波形の基準波形に対する外れスコアを算出し、外れスコアと学習によって定められたしきい値との比較結果に基づいて異常兆候を検知する。 Embodiment 1.
FIG. 1 is a diagram illustrating a configuration example of an abnormality sign detection system according to a first embodiment; An abnormality
図1に示すように学習装置1は、データ取得部11、データ記憶部12、前処理部13、第1波形解析部14、除去波形抽出部15、除去波形記憶部16および第1学習データ記憶部17を備える。
As shown in FIG. 1, the learning device 1 includes a data acquisition unit 11, a data storage unit 12, a preprocessing unit 13, a first waveform analysis unit 14, a removed waveform extraction unit 15, a removed waveform storage unit 16, and a first learning data storage. A section 17 is provided.
データ取得部11は、正常な期間の時系列データを取得し、データ記憶部12に記憶する。データ取得部11は、例えば、時系列データを取得するセンサなどから計測データを取得する。前処理部13は、データ記憶部12に記憶されている時系列データに対して、平滑化処理、ウィンドウサイズ(1単位区間分のサイズ)への切り出し、N(Nは2以上の整数)周期前差分処理などの前処理を行い、前処理後のデータを第1波形解析部14へ出力する。前処理後のデータはウィンドウサイズに切り出されているため、1単位区間のデータごとに第1波形解析部14へ出力される。以下1単位区間のデータを単位区間データとも呼ぶ。また、前処理部13は、N周期前差分処理が行われる前の単位区間データを除去波形抽出部15へ出力する。
The data acquisition unit 11 acquires time-series data for a normal period and stores it in the data storage unit 12. The data acquisition unit 11 acquires measurement data from, for example, a sensor that acquires time-series data. The preprocessing unit 13 performs smoothing processing on the time-series data stored in the data storage unit 12, cuts into a window size (one unit interval size), and performs N (N is an integer equal to or greater than 2) cycles. Preprocessing such as pre-difference processing is performed, and the data after preprocessing is output to the first waveform analysis unit 14 . Since the preprocessed data is cut out to the window size, it is output to the first waveform analysis unit 14 for each unit interval of data. The data of one unit interval is hereinafter also referred to as unit interval data. In addition, the preprocessing unit 13 outputs the unit interval data before the N cycles before difference processing is performed to the removed waveform extraction unit 15 .
第1波形解析部14は、類似波形解析により正常波形を学習する。詳細には、第1波形解析部14は、前処理後の単位区間データ間の距離を外れスコアとして算出し、算出した外れスコアを用いて、正常であるか否かの判定に用いられる正常判定しきい値を決定し、決定した正常判定しきい値を、第1学習データ記憶部17へ格納する。単位区間データ間の距離は、例えば、DTW(Dynamic Time Warping)距離、マハラノビス距離、ユークリッド距離などであり、どのような距離が用いられてもよいが、ここでは、単位区間データ間の距離は、一例として単位区間データ間におけるサンプリング点ごとの距離の1単位区間分の累積値であるとする。正常判定しきい値は、例えば、外れスコアの標準偏差に基づいて決定される。例えば、第1波形解析部14は、外れスコアの標準偏差をσとするとき、正常判定しきい値を3σとする。また、第1波形解析部14は、単位区間データのうち、正常波形データとして格納するものを選択し、選択した単位区間データを正常波形データとして第1学習データ記憶部17へ格納する。また、第1波形解析部14は、正常データではあるものの、まれに発生する波形と判断された単位区間データを識別する識別情報を除去波形抽出部15へ出力する。第1学習データ記憶部17に格納される正常波形および正常判定しきい値は、異常兆候の検知に用いられる学習済データである。
The first waveform analysis unit 14 learns normal waveforms through similar waveform analysis. Specifically, the first waveform analysis unit 14 calculates the distance between the preprocessed unit interval data as an outlier score, and uses the calculated outlier score to determine whether the data is normal or not. A threshold value is determined, and the determined normality determination threshold value is stored in the first learning data storage unit 17 . The distance between unit interval data is, for example, DTW (Dynamic Time Warping) distance, Mahalanobis distance, Euclidean distance, etc. Any distance may be used, but here, the distance between unit interval data is As an example, it is assumed that the cumulative value for one unit section of the distance for each sampling point between unit section data. The normality determination threshold is determined, for example, based on the standard deviation of the outlier scores. For example, the first waveform analysis unit 14 sets the normality determination threshold to 3σ when the standard deviation of the outlier scores is σ. The first waveform analysis section 14 also selects unit section data to be stored as normal waveform data, and stores the selected unit section data in the first learning data storage section 17 as normal waveform data. In addition, the first waveform analysis unit 14 outputs identification information for identifying unit interval data determined to be normal data but rarely occurring waveforms to the removed waveform extraction unit 15 . The normal waveform and the normality determination threshold value stored in the first learning data storage unit 17 are learned data used for detection of signs of abnormality.
除去波形抽出部15は、前処理部13から受け取った単位区間データのうち、第1波形解析部14から受け取った識別情報に対応する単位区間データすなわちまれに発生する波形と判断された単位区間データを、複数の波形のタイプに分類し、波形のタイプごとに正常と判定するための条件を決定する。正常と判定するための波形条件は、例えば、単位区間データ内の各サンプル点の平均値、標準偏差、最大値、最小値などに基づいて決定される。除去波形抽出部15は、タイプごとに対応する波形と波形条件とを除去波形記憶部16に格納する。除去波形抽出部15は、正常ではあるものの例えば問題のないなんらかのイベントによって発生する外れスコアが大きくなるような波形が、異常兆候と判定される過検知を防ぐために行われる処理である。後述するように、除去波形記憶部16に格納された情報は、異常兆候検知装置2において、過検知を防ぐ処理で用いられる。除去波形抽出部15によって決定された、波形のタイプごとの波形条件を用いた過検知の除去をタイプ別フィルタ処理とも呼ぶ。
The removed waveform extracting unit 15 extracts unit interval data corresponding to the identification information received from the first waveform analyzing unit 14 from among the unit interval data received from the preprocessing unit 13, that is, unit interval data determined to be rarely occurring waveforms. are classified into a plurality of waveform types, and conditions for determining normality are determined for each waveform type. The waveform condition for determining normality is determined based on, for example, the average value, standard deviation, maximum value, minimum value, etc. of each sample point in the unit interval data. The removed waveform extracting unit 15 stores the corresponding waveforms and waveform conditions for each type in the removed waveform storage unit 16 . The removed waveform extracting unit 15 is a process performed to prevent overdetection in which a waveform that is normal but causes a problem-free event, for example, with a large deviation score, is determined to be an abnormal sign. As will be described later, the information stored in the removed waveform storage unit 16 is used in the process of preventing overdetection in the abnormality sign detection device 2 . The removal of overdetection using the waveform condition for each waveform type determined by the removed waveform extraction unit 15 is also called filtering by type.
異常兆候検知装置2は、データ取得部21、データ記憶部22、前処理部23、第1波形解析部24、過検知除去部25、除去波形記憶部26、第1学習データ記憶部27よび検知結果出力部28を備える。除去波形記憶部26には、上述した除去波形記憶部16に記憶されている情報と同じ情報が格納され、第1学習データ記憶部27には、上述した第1学習データ記憶部17に記憶されている情報と同じ情報が格納される。
The abnormal sign detection device 2 includes a data acquisition unit 21, a data storage unit 22, a preprocessing unit 23, a first waveform analysis unit 24, an overdetection removal unit 25, a removed waveform storage unit 26, a first learning data storage unit 27, and a detection A result output unit 28 is provided. The removed waveform storage unit 26 stores the same information as the information stored in the above-described removed waveform storage unit 16, and the first learning data storage unit 27 stores the information stored in the above-described first learning data storage unit 17. The same information as the information stored in the
データ取得部21は、異常兆候の検知対象の時系列データである検知対象データを取得し、データ記憶部22に記憶する。前処理部23は、データ記憶部22に記憶されている検知対象データに対して、前処理部13と同様の前処理を行い、前処理後のデータを第1波形解析部24へ出力する。また、前処理部23は、N周期前差分処理前の単位区間データを過検知除去部25へ出力する。
The data acquisition unit 21 acquires detection target data, which is time-series data for detection of abnormal signs, and stores the data in the data storage unit 22 . The preprocessing unit 23 performs the same preprocessing as the preprocessing unit 13 on the detection target data stored in the data storage unit 22 and outputs the preprocessed data to the first waveform analysis unit 24 . In addition, the preprocessing unit 23 outputs the unit interval data before the difference processing before N cycles to the overdetection removal unit 25 .
第1波形解析部24は、前処理後の単位区間データと、学習済データとを用いて、類似波形解析によって、異常兆候があるか否かを判定する。具体的には、第1波形解析部24は、前処理後の単位区間データと、第1学習データ記憶部27に記憶されている正常波形データのそれぞれとの距離を第1学習データ記憶部27に記憶されている正常判定しきい値と比較することで、前処理後の単位区間データに異常兆候があるか否かを判定し、判定結果を過検知除去部25へ出力する。例えば、第1波形解析部24は、算出した外れスコアのうち最小の外れスコアが正常判定しきい値以上である場合に、異常兆候があると判定する。第1波形解析部24は、異常兆候があると判定した場合には、対応する単位区間データも過検知除去部25へ出力する。
The first waveform analysis unit 24 uses the unit interval data after preprocessing and the learned data to determine whether or not there is an abnormality sign by similar waveform analysis. Specifically, the first waveform analysis section 24 calculates the distance between the preprocessed unit section data and each of the normal waveform data stored in the first learning data storage section 27 as the first learning data storage section 27 . By comparing with the normality determination threshold value stored in , it is determined whether or not there is an abnormality symptom in the unit interval data after preprocessing, and the determination result is output to the overdetection removal unit 25 . For example, the first waveform analysis unit 24 determines that there is an abnormality sign when the smallest deviation score among the calculated deviation scores is equal to or greater than the normality determination threshold. When the first waveform analysis unit 24 determines that there is an abnormality sign, it also outputs the corresponding unit interval data to the overdetection removal unit 25 .
過検知除去部25は、第1波形解析部24から受け取った判定結果が、異常兆候があることを示す判定結果であった場合、前処理部23から受け取った単位区間データと除去波形記憶部26に格納されているタイプ別の波形とを比較することで、当該単位区間データの波形のタイプを判別し、除去波形記憶部26に格納されている正常判定条件のうち判別したタイプに対応する正常判定条件を用いて当該単位区間データが正常であるか否かを判定する。過検知除去部25は、第1波形解析部24から受け取った判定結果が、異常兆候があることを示し、かつ正常判定条件で正常と判定された場合には、当該単位区間データには異常兆候はないと判定し、判定結果を検知結果出力部28へ出力する。また、過検知除去部25は、第1波形解析部24から受け取った判定結果が、異常兆候があることを示し、かつ正常判定条件で正常でないと判定された場合には、当該単位区間データには異常兆候があると判定し、判定結果を検知結果出力部28へ出力する。
If the determination result received from the first waveform analysis unit 24 is a determination result indicating that there is an abnormal sign, the overdetection removal unit 25 combines the unit interval data received from the preprocessing unit 23 with the removed waveform storage unit 26. The waveform type of the unit interval data is determined by comparing with the waveforms of different types stored in the removed waveform storage unit 26, and the normality corresponding to the determined type among the normality determination conditions stored in the removed waveform storage unit 26 is determined. It is determined whether or not the unit interval data is normal using a determination condition. When the determination result received from the first waveform analysis unit 24 indicates that there is an abnormal symptom and the normal determination condition determines that the unit section data is normal, the overdetection removing unit 25 removes the abnormal symptom from the unit section data. It is determined that there is no detection result, and the determination result is output to the detection result output unit 28 . Further, when the determination result received from the first waveform analysis unit 24 indicates that there is an abnormal symptom and the normal determination condition indicates that the overdetection removal unit 25 is not normal, the unit interval data determines that there is an abnormality symptom, and outputs the determination result to the detection result output unit 28 .
また、過検知除去部25は、第1波形解析部24により異常兆候があると判定された単位区間データのうち過検知除去部25で正常でないと判定された場合に、過検知除去部25は、過検知除去部25は、第1波形解析部24から受け取った判定結果が、異常兆候がないことを示す判定結果であった場合、当該判定結果を検知結果出力部28へ出力する。
Further, when the overdetection removal unit 25 determines that the unit interval data determined to have an abnormal sign by the first waveform analysis unit 24 is not normal, the overdetection removal unit 25 When the determination result received from the first waveform analysis unit 24 indicates that there is no sign of abnormality, the overdetection removal unit 25 outputs the determination result to the detection result output unit 28 .
なお、以上述べた例では、第1波形解析部24により異常兆候があると判定された場合の判定結果が過検知除去部25を介して検知結果出力部28へ通知されているが、これに限らず、第1波形解析部24により異常兆候があると判定された場合の判定結果は第1波形解析部24から検知結果出力部28へ直接通知されてもよい。また、以上述べた例では、異常兆候がない場合も判定結果が検知結果出力部28へ出力されるが、これに限らず、異常兆候がない場合には判定結果が検知結果出力部28へ出力されなくてもよい。すなわち、異常兆候が検知された場合だけに、判定結果が検知結果出力部28へ出力されてもよい。
In the example described above, the determination result when the first waveform analysis unit 24 determines that there is an abnormal symptom is notified to the detection result output unit 28 via the overdetection removal unit 25. Alternatively, the first waveform analysis unit 24 may directly notify the detection result output unit 28 of the determination result when the first waveform analysis unit 24 determines that there is an abnormality sign. In the example described above, the determination result is output to the detection result output unit 28 even when there is no sign of abnormality. However, the determination result is output to the detection result output unit 28 when there is no sign of abnormality. It does not have to be. That is, the determination result may be output to the detection result output unit 28 only when an abnormality symptom is detected.
また、図1に示した例では、学習装置1と異常兆候検知装置2とが個別に設けられているが、学習装置1と異常兆候検知装置2とが一体化されていてもよい。この場合、除去波形記憶部26は設けずに除去波形記憶部16を上述した除去波形記憶部26の代わりに用いてもよく、第1学習データ記憶部27は設けずに第1学習データ記憶部17を上述した第1学習データ記憶部27の代わりに用いてもよく、データ記憶部22は設けずにデータ記憶部12を上述したデータ記憶部22の代わりに用いてもよい。また、データ取得部11、前処理部13および第1波形解析部14が、それぞれデータ取得部21、前処理部23および第1波形解析部24としての機能も有することで、データ取得部21、前処理部23および第1波形解析部24を設けなくてもよい。学習装置1と異常兆候検知装置2とは、共通する処理が多いため、一体化される場合には、このように共通する部分を共用することができる。
Also, in the example shown in FIG. 1, the learning device 1 and the sign-of-abnormality detection device 2 are provided separately, but the learning device 1 and the sign-of-abnormality detection device 2 may be integrated. In this case, the removed waveform storage unit 26 may not be provided and the removed waveform storage unit 16 may be used instead of the above-described removed waveform storage unit 26, and the first learning data storage unit 27 may not be provided and the first learning data storage unit 17 may be used instead of the first learning data storage unit 27 described above, or the data storage unit 22 may not be provided and the data storage unit 12 may be used instead of the data storage unit 22 described above. Further, the data acquisition unit 11, the preprocessing unit 13, and the first waveform analysis unit 14 also function as the data acquisition unit 21, the preprocessing unit 23, and the first waveform analysis unit 24, respectively. The preprocessing section 23 and the first waveform analysis section 24 may not be provided. Since the learning device 1 and the sign-of-abnormality detection device 2 have many processes in common, when they are integrated, they can share such common parts.
本実施の形態の異常兆候検知システム3は、例えば、配電系統における異常兆候を検知に適用することができる。図2は、配電系統における本実施の形態の異常兆候検知システム3の配置例を示す図である。図2に示した例では、異常兆候検知装置2は、配電系統における各区間を接続する開閉器4を制御する子局と呼ばれる装置である。または、異常兆候検知装置2は、開閉器4を制御する子局に接続される装置であってもよい。
The anomaly sign detection system 3 of the present embodiment can be applied, for example, to detect an anomaly sign in a power distribution system. FIG. 2 is a diagram showing an arrangement example of the anomaly sign detection system 3 of the present embodiment in a distribution system. In the example shown in FIG. 2, the abnormality sign detection device 2 is a device called a slave station that controls switches 4 that connect sections in the distribution system. Alternatively, the sign-of-abnormality detection device 2 may be a device connected to a slave station that controls the switch 4 .
近年、配電系統における開閉器4を遠隔地から自動制御する配線制御システムの導入が進められており、このようなシステムでは開閉器4を制御する子局が、遠隔地に設けられた親局と通信を行う。子局は、配電系統の電流、電圧を計測することで、配電系統を監視するとともに、親局からの指示にしたがって開閉器4を制御することが可能である。このように、子局は、配電系統の電流および電圧を計測しており、異常兆候検知装置2を子局として用いることにより、または異常兆候検知装置2を子局に接続することにより、計測された電流および電圧を用いて配電系統の異常兆候の検知が可能となる。子局は、例えば、変圧器とともに電柱に設置される。
In recent years, the introduction of a wiring control system that automatically controls the switch 4 in a distribution system from a remote location has been promoted. communicate. By measuring the current and voltage of the distribution system, the slave station can monitor the distribution system and control the switch 4 according to instructions from the master station. In this way, the slave station measures the current and voltage of the power distribution system. It is possible to detect signs of abnormality in the distribution system using the current and voltage obtained. A slave station is installed, for example, on a utility pole together with a transformer.
図2に示した例では、学習装置1が親局であるかまたは親局に接続されている。これにより、学習装置1が学習を行った後に、第1学習データ記憶部17および除去波形記憶部16のデータを、異常兆候検知装置2へ送信することができる。なお、第1学習データ記憶部17および除去波形記憶部16のデータを異常兆候検知装置2へ反映させる方法はこの例に限定されず、別の通信網を用いて学習装置1から異常兆候検知装置2へ送信されてもよいし、記録媒体などを介して異常兆候検知装置2がこれらのデータを取得してもよい。
In the example shown in FIG. 2, the learning device 1 is the parent station or is connected to the parent station. As a result, the data in the first learning data storage unit 17 and the removed waveform storage unit 16 can be transmitted to the abnormal sign detection device 2 after the learning device 1 has learned. The method of reflecting the data in the first learning data storage unit 17 and the removed waveform storage unit 16 to the abnormal sign detection device 2 is not limited to this example, and the data from the learning device 1 to the abnormal sign detection device using another communication network. 2, or the abnormality sign detection device 2 may acquire these data via a recording medium or the like.
配電系統では、特に山間部においては、配電線またはその他の配電系統における設備に、倒木、樹木の接触、鳥、蛇などの影響によって異常が生じることがある。一方、山間部において作業員が常時配電系統の状態を監視することは難しい。このため、配電系統の状態を遠隔監視し、異常兆候が検知できることが望まれる。図2に示した例では、異常兆候検知装置2が、配電系統の各所を異常兆候の検知を行うことができるため、異常兆候が検知された場合に、作業員が現地を確認することで、異常が発生する前に対処することができる。
In the distribution system, especially in mountainous areas, abnormalities may occur in the distribution line or other equipment in the distribution system due to the effects of fallen trees, contact with trees, birds, snakes, etc. On the other hand, it is difficult for workers to constantly monitor the state of the distribution system in mountainous areas. Therefore, it is desirable to be able to remotely monitor the state of the distribution system and detect signs of anomalies. In the example shown in FIG. 2, the abnormality sign detection device 2 can detect an abnormality sign at various places in the distribution system. Abnormalities can be dealt with before they occur.
以下では、配電系統における異常兆候を検知に適用する例について説明するが、本実施の形態の異常兆候検知システム3は、これに限らず、電力系統の他の設備、各種プラントにおける設備、その他の電気機器においてセンサによって取得された時系列データに関して異常兆候を検知することができ、異常兆候の検知対象の時系列データはどのようなものであってもよい。
In the following, an example of applying an abnormality sign in a power distribution system to detection will be described, but the abnormality sign detection system 3 of the present embodiment is not limited to this, and other equipment in the electric power system, equipment in various plants, other An anomaly sign can be detected with respect to time-series data acquired by a sensor in an electrical device, and the time-series data for which an anomaly sign is detected may be of any type.
上述したように、各子局は、電流および電圧を計測している。以下では、零相電流および零相電圧のうちの少なくとも一方の瞬時値の計測データを時系列データとして用いて異常兆候の検知を行う例を説明する。すなわち、零相電流および零相電圧のうち一方を計測データとして用いて異常兆候の検知を行ってもよいし、零相電流を計測データとして用いた異常兆候の検知と零相電圧を計測データとして用いた異常兆候の検知との両方を行ってもよい。両方を行う場合には、例えば、いずれか一方で異常兆候が検知されたら異常兆候検知と判定する。また、零相電流および零相電圧の計測データは瞬時値として取得されているとする。すなわち、この例では、時系列データを取得するセンサは、零相電流および零相電圧のうち少なくとも一方を計測する。例えば、配電系統における電源周期より十分短いサンプリング周期で計測データが取得されているとする。零相電流および零相電圧のいずれを用いる場合も処理は同様であるため、以下では、零相電流および零相電圧を区別せずに、瞬時値の計測データとして記載する。
As described above, each slave station measures current and voltage. In the following, an example will be described in which the measurement data of the instantaneous value of at least one of the zero-phase current and the zero-phase voltage is used as time-series data to detect signs of abnormality. That is, one of the zero-phase current and the zero-phase voltage may be used as measurement data to detect signs of abnormality, or the detection of signs of abnormality using the zero-phase current as measurement data and the zero-phase voltage as measurement data. You may perform both the detection of the abnormality sign used. When performing both, for example, when an abnormality sign is detected in either one, it is determined that an abnormality sign is detected. Also, it is assumed that the measurement data of the zero-phase current and the zero-phase voltage are acquired as instantaneous values. That is, in this example, the sensor that acquires the time-series data measures at least one of the zero-phase current and the zero-phase voltage. For example, it is assumed that measurement data is acquired at a sampling period sufficiently shorter than the power supply period in the distribution system. Since the processing is the same when using either the zero-phase current or the zero-phase voltage, the zero-phase current and the zero-phase voltage are described below as measurement data of instantaneous values without distinction.
図3は、本実施の形態の学習装置1における学習時の処理手順の一例を示すフローチャートである。学習装置1は、瞬時値(正常データ)を取得する(ステップS1)。詳細には、データ取得部11が、正常な期間の瞬時値の計測データを時系列データとして取得し、取得した計測データをデータ記憶部12へ格納する。なお、データ取得部11は、過去にセンサによって取得されて他の装置に格納されている図示しない他の装置から正常であることが判明している期間の瞬時値の計測データを取得してもよいし、実験によって取得された瞬時値の計測データを取得してもよいし、正常であるとわかっている期間であればセンサから瞬時値の計測データを取得してもよい。
FIG. 3 is a flowchart showing an example of a processing procedure during learning in the learning device 1 of the present embodiment. The learning device 1 acquires instantaneous values (normal data) (step S1). Specifically, the data acquisition unit 11 acquires measurement data of instantaneous values in a normal period as time-series data, and stores the acquired measurement data in the data storage unit 12 . Note that the data acquisition unit 11 may acquire measurement data of instantaneous values during a period when it is known to be normal from another device (not shown) that has been acquired by a sensor in the past and stored in another device. Alternatively, measurement data of instantaneous values obtained by an experiment may be obtained, or measurement data of instantaneous values may be obtained from a sensor during a period known to be normal.
次に、学習装置1は、平滑化処理を行う(ステップS2)。詳細には、前処理部13が、データ記憶部12に格納された計測データに対して、例えば、一次遅れフィルタによる平滑化を実施する。一次遅れフィルタのフィルタ係数はどのような値が設定されてもよいが、例えば、前処理部13は、1つ前のサンプリング点と現在のサンプリング点との比率を3:1(75%:25%)に設定して一次遅れフィルタによる平滑化を実施する。
Next, the learning device 1 performs smoothing processing (step S2). Specifically, the preprocessing unit 13 smoothes the measurement data stored in the data storage unit 12 using, for example, a first-order lag filter. Any value may be set for the filter coefficient of the first-order lag filter. %) to perform smoothing with a first-order lag filter.
次に、学習装置1は、データを抽出する(ステップS3)。詳細には、前処理部13が、データ記憶部12に格納された計測データに対して、ウィンドウサイズのデータを抽出する。詳細には、前処理部13が、平滑化処理後の計測データをウィンドウサイズごとに区分することで単位区間データを生成する。ウィンドウサイズはどのように設定してもよいが、ここでは、一例として電源周期の1周期分とする。ウィンドウサイズは、これに限らず、例えば、例えば電源周期の2周期分など、他の値に設定されてもよい。
Next, the learning device 1 extracts data (step S3). Specifically, the preprocessing unit 13 extracts window size data from the measurement data stored in the data storage unit 12 . Specifically, the preprocessing unit 13 generates unit interval data by segmenting the smoothed measurement data by window size. The window size may be set in any way, but here, as an example, it is set to one cycle of the power source. The window size is not limited to this, and may be set to another value such as, for example, two cycles of the power supply cycle.
次に、学習装置1は、N周期前差分処理を行う(ステップS4)。詳細には、前処理部13が、ウィンドウサイズのデータである単位区分データごとに、N周期前差分処理を行う。N周期前差分処理は、定められた時間長を1周期とし、正常なデータである正常データの1周期分の各点の値から、1周期前からN周期前までの正常データの周期内の対応する各点の平均値をそれぞれ減じたN周期前差分値を算出する処理である。より具体的には、N周期前差分処理は、現在の単位区分データにおける各点の値から、1つ前の周期からN周期前までの対応する点における値の平均値をそれぞれ減算する処理である。すなわち、N周期前差分処理は、処理対象の単位区間データがk番目の単位区間データであるとし、k番目の単位区間データ内のi番目の点をPk,iとすると、N周期前差分処理後のQk,iを以下の式(1)で表すことができる。
Qk,i=Pk,i-(Pk-1,i+Pk-2,i+・・・+Pk-N,i)/N …(1) Next, the learning device 1 performs difference processing before N cycles (step S4). Specifically, the preprocessing unit 13 performs N-cycle pre-difference processing for each unit segment data that is window size data. In the N-cycles-before difference processing, a predetermined time length is set as one cycle, and from the values of each point for one cycle of the normal data, which is normal data, This is a process of calculating the difference value before N cycles by subtracting the average value of each corresponding point. More specifically, the difference processing before N cycles is a process of subtracting the average value of the values at corresponding points from one cycle to N cycles before from the value of each point in the current unit segment data. be. That is, in the N cycles before difference processing, if the unit interval data to be processed is the k-th unit interval data and the i-th point in the k-th unit interval data is Pk ,i , then the N cycles before difference Q k,i after processing can be expressed by the following equation (1).
Q k,i =P k,i −(P k−1,i +P k−2,i + . . . +P k−N,i )/N (1)
次に、学習装置1は、第1波形解析(類似波形解析)を行う(ステップS5)。詳細には、第1波形解析部14が、前処理後の単位区間データ間の距離を算出することで外れスコアを算出し、算出した外れスコアの標準偏差σを求める。そして、正常判定しきい値を3σとし、単位区間データから正常判定データとして格納するデータを選択する。ここでは正常判定しきい値を3σとしたが、正常判定しきい値は、例えば、事前評価の結果などによって決定されればよくこの値に限定されない。第1波形解析部14は、選択した正常判定データと正常判定しきい値とを第1学習データ記憶部17に格納する。また、第1波形解析部14は、まれに発生する正常な波形であると判断した単位区間データを識別する識別情報を除去波形抽出部15へ通知する。
Next, the learning device 1 performs first waveform analysis (similar waveform analysis) (step S5). Specifically, the first waveform analysis unit 14 calculates the outlier score by calculating the distance between the preprocessed unit interval data, and obtains the standard deviation σ of the calculated outlier score. Then, the normality determination threshold value is set to 3σ, and data to be stored as normality determination data is selected from the unit interval data. Here, the normality determination threshold is set to 3σ, but the normality determination threshold is not limited to this value as long as it is determined based on the result of preliminary evaluation, for example. The first waveform analysis unit 14 stores the selected normality determination data and the normality determination threshold in the first learning data storage unit 17 . In addition, the first waveform analysis unit 14 notifies the removed waveform extraction unit 15 of identification information for identifying unit interval data determined to be a normal waveform that rarely occurs.
次に、学習装置1は、過検知除去用の波形を抽出する(ステップS6)。詳細には、除去波形抽出部15が、第1波形解析部14から通知された識別情報に対応する単位区間データを複数の波形のタイプに分類し、波形のタイプごとに正常と判定するための条件である正常判定条件を決定する。そして、除去波形抽出部15は、対応する単位区間データと正常判定条件とを除去波形記憶部16に格納する。以上の処理により学習が終了する。なお、一度学習が終了した後に、新たに取得された計測データを用いて再学習が行われてもよい。再学習が行われた場合には、学習データ、すなわち第1学習データ記憶部17に格納された情報および除去波形記憶部16に格納された情報は、異常兆候検知装置2に反映される。具体的には、例えば、これらの情報が学習装置1から異常兆候検知装置2へ送信されることで、これらの情報が異常兆候検知装置2に反映される。
Next, the learning device 1 extracts a waveform for removing overdetection (step S6). Specifically, the removed waveform extraction unit 15 classifies the unit interval data corresponding to the identification information notified from the first waveform analysis unit 14 into a plurality of waveform types, and determines that each waveform type is normal. Determine the normality determination condition, which is the condition. Then, the removed waveform extracting section 15 stores the corresponding unit section data and the normality determination condition in the removed waveform storage section 16 . Learning is completed by the above processing. In addition, after learning is completed once, re-learning may be performed using newly acquired measurement data. When re-learning is performed, the learning data, that is, the information stored in the first learning data storage unit 17 and the information stored in the removed waveform storage unit 16 are reflected in the abnormality sign detection device 2 . Specifically, for example, these pieces of information are transmitted from the learning device 1 to the sign-of-abnormality detection device 2 , so that these pieces of information are reflected in the sign-of-abnormality detection device 2 .
図4は、本実施の形態の異常兆候検知装置2における推論時の処理手順の一例を示すフローチャートである。異常兆候検知装置2は、検知対象の瞬時値を取得する(ステップS11)。詳細には、データ取得部21が、推論対象、すなわち異常兆候の検知対象の瞬時値の計測データを取得する。
FIG. 4 is a flowchart showing an example of a processing procedure during inference in the abnormality sign detection device 2 of the present embodiment. The abnormality sign detection device 2 acquires an instantaneous value to be detected (step S11). Specifically, the data acquisition unit 21 acquires measurement data of instantaneous values of an inference target, that is, an abnormality sign detection target.
次に、異常兆候検知装置2は、検知対象の瞬時値に関して、ステップS2~ステップS4と同様の前処理を実施する(ステップS12~ステップS14)。ステップS14の後、異常兆候検知装置2は、第1波形解析(類似波形解析)を実施する(ステップS15)。詳細には、第1波形解析部24が、前処理後の単位区間データと、第1学習データ記憶部27に記憶されている正常波形データのそれぞれとの距離を第1学習データ記憶部27に記憶されている正常判定しきい値と比較することで、前処理後の単位区間データに異常兆候があるか否かを判定し、判定結果を過検知除去部25へ出力する。
Next, the sign-of-abnormality detection device 2 performs preprocessing similar to steps S2 to S4 for the instantaneous value to be detected (steps S12 to S14). After step S14, the abnormal sign detection device 2 performs first waveform analysis (similar waveform analysis) (step S15). Specifically, the first waveform analysis unit 24 stores the distance between the preprocessed unit interval data and each of the normal waveform data stored in the first learning data storage unit 27 in the first learning data storage unit 27. By comparing with the stored normality determination threshold value, it is determined whether or not there is an abnormality symptom in the unit interval data after preprocessing, and the determination result is output to the overdetection removal unit 25 .
異常兆候検知装置2は、第1波形解析の結果、異常兆候が検知された場合(ステップS16 Yes)、過検知除去を実施する(ステップS17)。詳細には、過検知除去部25が、第1波形解析部24から受け取った判定結果が、異常兆候があることを示す判定結果であった場合、前処理部23から受け取った単位区間データと除去波形記憶部26に格納されているタイプ別の波形とを比較することで、当該単位区間データの波形のタイプを判別し、除去波形記憶部26に格納されている正常判定条件のうち判別したタイプに対応する正常判定条件を用いて当該単位区間データが正常であるか否かを判定し、判定結果を検知結果出力部28へ出力する。
When the abnormality sign detection device 2 detects an abnormality sign as a result of the first waveform analysis (step S16 Yes), it removes overdetection (step S17). Specifically, when the determination result received from the first waveform analysis unit 24 is a determination result indicating that there is an abnormal symptom, the overdetection removal unit 25 removes the unit interval data received from the preprocessing unit 23 and removes the unit interval data. The waveform type of the unit interval data is determined by comparing with the waveforms of different types stored in the waveform storage unit 26, and the determined type is selected from the normality determination conditions stored in the removed waveform storage unit 26. It determines whether or not the unit interval data is normal using the normality determination condition corresponding to , and outputs the determination result to the detection result output unit 28 .
次に、異常兆候検知装置2は、検知結果を出力する(ステップS18)。詳細には、検知結果出力部28が、過検知除去部25から受け取った判定結果を検知結果として出力する。ここでは、異常兆候検知装置2が、子局であるかまたは子局に接続されているため、検知結果出力部28は、例えば、学習装置1または学習装置1とは別の親局へ検知結果を送信することで検知結果を出力してもよい。また、異常兆候検知装置2が表示部を有している場合には、検知結果出力部28が表示部によって実現され、検知結果出力部28が検知結果を表示することで検知結果を出力してもよい。学習装置1または学習装置1とは別の親局は、異常兆候検知装置2から検知結果を受信すると、図1では図示を省略した表示部に検知結果を表示する。
Next, the abnormality sign detection device 2 outputs the detection result (step S18). Specifically, the detection result output unit 28 outputs the determination result received from the over-detection removal unit 25 as the detection result. Here, since the sign-of-abnormality detection device 2 is a slave station or is connected to a slave station, the detection result output unit 28 sends the detection result to the learning device 1 or a parent station different from the learning device 1, for example. You may output the detection result by sending . Further, when the abnormality sign detection device 2 has a display unit, the detection result output unit 28 is realized by the display unit, and the detection result output unit 28 outputs the detection result by displaying the detection result. good too. When the learning device 1 or a parent station different from the learning device 1 receives the detection result from the abnormality sign detection device 2, it displays the detection result on a display unit (not shown in FIG. 1).
異常兆候が検知されなかった場合(ステップS16 No)、異常兆候検知装置2は、過検知除去を実施せずに、処理をステップS18へ進める。なお、上述したように、検知結果は、異常兆候が検知されなかった場合すなわち正常な場合にも出力されてもよいし、異常兆候が検知された場合に出力され異常兆候が検知されない場合に出力されなくてもよい。
If no abnormal sign is detected (step S16 No), the abnormal sign detection device 2 advances the process to step S18 without performing over-detection removal. As described above, the detection result may be output when no abnormal sign is detected, that is, when normal, or output when an abnormal sign is detected and output when no abnormal sign is detected. It does not have to be.
なお、上述した例では、過検知除去を行っているが、過検知除去は行われなくてもよい。この場合、除去波形抽出部15、除去波形記憶部16、過検知除去部25、除去波形記憶部26は設けられなくてよい。なお、データ記憶部22に格納されたデータは、例えば一定期間が経過したら削除されてもよいし、一定量に達したら古い順に削除されてもよい。
In the above example, over-detection removal is performed, but over-detection removal does not have to be performed. In this case, the removed waveform extractor 15, the removed waveform storage 16, the overdetection remover 25, and the removed waveform storage 26 may not be provided. Note that the data stored in the data storage unit 22 may be deleted, for example, after a certain period of time has elapsed, or may be deleted in chronological order after reaching a certain amount.
次に本実施の形態の効果について説明する。本実施の形態では、前処理部13が、平滑化処理とN周期前差分処理を実施している。図5は、本実施の形態の前処理を説明するための図である。図5に示すように、瞬時値の計測データである生データには、様々なノイズが含まれているため高周波数成分が多い波形となっている。このため、このまま類似波形解析である第1波形解析を行うと、誤差が大きくなり異常兆候の誤検出が発生しやすくなる。本実施の形態では、平滑化処理を行うことで、図5の中段に示したように、ノイズの影響が低減された波形を得ることができ、異常兆候の検知精度を高めることができる。また、図5の下段に示すように、N周期前差分処理を行うと電源周期に依存した大きな変化の成分が除去されるため、生データに比べて実質的な変化の様子を検出しやすくなる。
Next, the effects of this embodiment will be described. In the present embodiment, the preprocessing unit 13 performs smoothing processing and N-cycles before difference processing. FIG. 5 is a diagram for explaining the preprocessing of this embodiment. As shown in FIG. 5, the raw data, which is instantaneous value measurement data, contains various types of noise, and thus has a waveform with many high-frequency components. Therefore, if the first waveform analysis, which is a similar waveform analysis, is performed as it is, the error becomes large, and erroneous detection of abnormal symptoms is likely to occur. In the present embodiment, by performing the smoothing process, it is possible to obtain a waveform in which the influence of noise is reduced, as shown in the middle part of FIG. In addition, as shown in the lower part of FIG. 5, when the difference processing before N cycles is performed, the components of large changes dependent on the power supply cycle are removed, so it becomes easier to detect the substantial changes compared to the raw data. .
図6は、本実施の形態の前処理の効果の一例を模式的に示す図である。図6では、本実施の形態の異常兆候検知装置2に検知対象の計測データとして、正常な場合に対応する生データ、および異常兆候が表れている場合に対応する生データをそれぞれ入力した場合に得られる結果を模式的に示している。正常な場合に対応する生データ、前処理(平滑化処理およびN周期前差分処理)後のデータおよび外れスコアを示し、右側に異常兆候が表れている場合(図では異常と記載)に対応する生データ、前処理(平滑化処理およびN周期前差分処理)後のデータおよび外れスコアを示している。図6において、しきい値201は、第1波形解析によって得られる正常判定しきい値である。図6に示すように、正常な場合には、外れスコアがしきい値201以下となり、異常兆候が表れている場合には、外れスコアがしきい値201を上回ることがわかる。本実施の形態の前処理を行うことで、生データにおけるベースとなる変化の成分の影響が抑制され、実質的な変化の様子が検出しやすくなり、外れスコアを正常判定しきい値と比較することによる異常兆候の検知精度を高めることができる。なお、図6は模式図であるが、同様の実データを用いた解析を行うことで、外れスコアを正常判定しきい値と比較することにより、異常兆候の検知精度を高めることができることが確認されている。
FIG. 6 is a diagram schematically showing an example of the effects of the pretreatment of this embodiment. In FIG. 6, when raw data corresponding to a normal case and raw data corresponding to a case in which an abnormal sign is present are input as measurement data to be detected in the sign-of-abnormality detection apparatus 2 of the present embodiment, The results obtained are shown schematically. The raw data corresponding to the normal case, the data after preprocessing (smoothing processing and N-cycle pre-difference processing), and the outlier score are shown. Raw data, data after preprocessing (smoothing and N-cycle pre-difference processing) and outlier scores are shown. In FIG. 6, a threshold 201 is a normal determination threshold obtained by the first waveform analysis. As shown in FIG. 6, the deviation score is equal to or less than the threshold value 201 when the condition is normal, and the deviation score exceeds the threshold value 201 when the symptom of abnormality appears. By performing the preprocessing of the present embodiment, the influence of the change component that is the basis of the raw data is suppressed, the state of substantial change becomes easier to detect, and the outlier score is compared with the normal judgment threshold. It is possible to improve the detection accuracy of anomaly signs. Although FIG. 6 is a schematic diagram, it was confirmed that the detection accuracy of signs of abnormality can be improved by comparing the outlier score with the normal judgment threshold by performing analysis using similar actual data. It is
また、本実施の形態では、前処理として平滑化処理とN周期前差分処理との両方を行う例を説明したが、平滑化処理は行わなくてもよい。この場合も、N周期前差分処理を行わない場合に比べて、異常兆候の検知精度を高めることができる。このように、前処理部13はN周期前差分処理を行い、第1波形解析部14は、N周期前差分値を用いて、類似波形解析によって、正常波形と正常であるか否かの判定に用いられる正常判定しきい値とを学習済データとして生成すればよく、N周期前差分処理の前の平滑化処理は行われてもよいし行われてなくてもよい。
Also, in the present embodiment, an example in which both the smoothing process and the N-cycle previous difference process are performed as preprocessing has been described, but the smoothing process does not have to be performed. In this case as well, it is possible to improve the detection accuracy of the sign of abnormality as compared with the case where the difference processing before N cycles is not performed. In this way, the preprocessing unit 13 performs N-cycles-before difference processing, and the first waveform analysis unit 14 uses the N-cycles-before difference value to perform similar waveform analysis to determine whether the waveform is normal or not. The normality determination threshold value used for , may be generated as learned data, and the smoothing process may or may not be performed before the difference process before N cycles.
次に、本実施の形態の学習装置1のハードウェア構成について説明する。本実施の形態の学習装置1は、コンピュータシステム上で、学習装置1における処理が記述されたコンピュータプログラムであるプログラムが実行されることにより、コンピュータシステムが学習装置1として機能する。図7は、本実施の形態の学習装置1を実現するコンピュータシステムの構成例を示す図である。図7に示すように、このコンピュータシステムは、制御部101と入力部102と記憶部103と表示部104と通信部105と出力部106とを備え、これらはシステムバス107を介して接続されている。
Next, the hardware configuration of the learning device 1 of this embodiment will be described. The computer system of the learning device 1 of the present embodiment functions as the learning device 1 by executing a program, which is a computer program in which processing in the learning device 1 is described, on the computer system. FIG. 7 is a diagram showing a configuration example of a computer system that implements the learning device 1 of this embodiment. As shown in FIG. 7, this computer system comprises a control section 101, an input section 102, a storage section 103, a display section 104, a communication section 105 and an output section 106, which are connected via a system bus 107. there is
図7において、制御部101は、例えば、CPU(Central Processing Unit)等のプロセッサであり、本実施の形態の学習装置1における処理が記述されたプログラムを実行する。なお、制御部101の一部が、GPU(Graphics Processing Unit),FPGA(Field-Programmable Gate Array)などの専用ハードウェアにより実現されてもよい。入力部102は、たとえばキーボード、マウスなどで構成され、コンピュータシステムの使用者が、各種情報の入力を行うために使用する。記憶部103は、RAM(Random Access Memory),ROM(Read Only Memory)などの各種メモリおよびハードディスクなどのストレージデバイスを含み、上記制御部101が実行すべきプログラム、処理の過程で得られた必要なデータ、などを記憶する。また、記憶部103は、プログラムの一時的な記憶領域としても使用される。表示部104は、ディスプレイ、LCD(液晶表示パネル)などで構成され、コンピュータシステムの使用者に対して各種画面を表示する。通信部105は、通信処理を実施する受信機および送信機である。出力部106は、プリンタ、スピーカなどである。なお、図7は、一例であり、コンピュータシステムの構成は図7の例に限定されない。
In FIG. 7, the control unit 101 is, for example, a processor such as a CPU (Central Processing Unit), and executes a program describing the processing in the learning device 1 of this embodiment. Part of the control unit 101 may be realized by dedicated hardware such as GPU (Graphics Processing Unit), FPGA (Field-Programmable Gate Array). The input unit 102 is composed of, for example, a keyboard and a mouse, and is used by the user of the computer system to input various information. The storage unit 103 includes various memories such as RAM (Random Access Memory) and ROM (Read Only Memory) and storage devices such as hard disks, and stores programs to be executed by the control unit 101 and necessary information obtained in the process of processing. store data, etc. The storage unit 103 is also used as a temporary storage area for programs. The display unit 104 includes a display, LCD (liquid crystal display panel), etc., and displays various screens to the user of the computer system. A communication unit 105 is a receiver and a transmitter that perform communication processing. The output unit 106 is a printer, speaker, or the like. Note that FIG. 7 is an example, and the configuration of the computer system is not limited to the example in FIG.
ここで、本実施の形態のプログラムが実行可能な状態になるまでのコンピュータシステムの動作例について説明する。上述した構成をとるコンピュータシステムには、たとえば、図示しないCD(Compact Disc)-ROMドライブまたはDVD(Digital Versatile Disc)-ROMドライブにセットされたCD-ROMまたはDVD-ROMから、コンピュータプログラムが記憶部103にインストールされる。そして、プログラムの実行時に、記憶部103から読み出されたプログラムが記憶部103の主記憶領域に格納される。この状態で、制御部101は、記憶部103に格納されたプログラムに従って、本実施の形態の学習装置1としての処理を実行する。
Here, an example of the operation of the computer system until the program of the present embodiment becomes executable will be described. In the computer system having the above configuration, for example, a computer program is stored in a storage unit from a CD-ROM or DVD-ROM set in a CD (Compact Disc)-ROM drive or a DVD (Digital Versatile Disc)-ROM drive (not shown). 103 installed. Then, when the program is executed, the program read from storage unit 103 is stored in the main storage area of storage unit 103 . In this state, control unit 101 executes processing as learning device 1 of the present embodiment according to the program stored in storage unit 103 .
なお、上記の説明においては、CD-ROMまたはDVD-ROMを記録媒体として、学習装置1における処理を記述したプログラムを提供しているが、これに限らず、コンピュータシステムの構成、提供するプログラムの容量などに応じて、たとえば、通信部105を経由してインターネットなどの伝送媒体により提供されたプログラムを用いることとしてもよい。
In the above description, a CD-ROM or DVD-ROM is used as a recording medium to provide the program describing the processing in the learning device 1. However, the configuration of the computer system and the program to be provided are not limited to this. For example, a program provided by a transmission medium such as the Internet via the communication unit 105 may be used depending on the capacity.
本実施の形態のプログラムは、例えば、異常兆候の検知に用いられる学習済データを生成するコンピュータシステムに、正常なデータである正常データの1周期分の各点の値から、1周期前からN周期前までの正常データの周期内の対応する各点の平均値をそれぞれ減じたN周期前差分値を算出するステップと、N周期前差分値を用いて、類似波形解析によって、正常波形と正常であるか否かの判定に用いられる正常判定しきい値とを学習済データとして生成するステップと、を実行させる。
For example, the program of the present embodiment provides a computer system that generates learned data to be used for detection of abnormal signs, from the values of each point for one cycle of normal data, which is normal data, from one cycle before N A step of calculating a difference value before the N cycles by subtracting the average value of each corresponding point in the cycle of the normal data up to the cycle before; and generating, as learned data, a normality determination threshold value used for determining whether or not.
図1に示した前処理部13、第1波形解析部14および除去波形抽出部15は、図7に示した記憶部103に記憶されたコンピュータプログラムが図7に示した制御部101により実行されることにより実現される。図1に示した前処理部13、第1波形解析部14および除去波形抽出部15の実現には、図7に示した記憶部103も用いられる。図1に示したデータ記憶部12、除去波形記憶部16および第1学習データ記憶部17は、図7に示した記憶部103の一部である。図1に示したデータ取得部11は、図7に示した通信部105および制御部101により実現される。また、学習装置1は複数のコンピュータシステムにより実現されてもよい。例えば、学習装置1は、クラウドコンピュータシステムにより実現されてもよい。
The preprocessing unit 13, the first waveform analysis unit 14, and the removed waveform extraction unit 15 shown in FIG. 1 are executed by the control unit 101 shown in FIG. 7 from computer programs stored in the storage unit 103 shown in FIG. It is realized by The storage unit 103 shown in FIG. 7 is also used to realize the preprocessing unit 13, the first waveform analysis unit 14, and the removed waveform extraction unit 15 shown in FIG. The data storage unit 12, the removed waveform storage unit 16, and the first learning data storage unit 17 shown in FIG. 1 are part of the storage unit 103 shown in FIG. Data acquisition unit 11 shown in FIG. 1 is implemented by communication unit 105 and control unit 101 shown in FIG. Also, the learning device 1 may be realized by a plurality of computer systems. For example, the learning device 1 may be realized by a cloud computer system.
異常兆候検知装置2も、学習装置1と同様に図7に示したコンピュータシステムにより実現される。図1に示した前処理部23、第1波形解析部24および過検知除去部25は、図7に示した記憶部103に記憶されたコンピュータプログラムが図7に示した制御部101により実行されることにより実現される。図1に示した前処理部23、第1波形解析部24および過検知除去部25の実現には、図7に示した記憶部103も用いられる。図1に示したデータ記憶部22、除去波形記憶部26および第1学習データ記憶部27は、図7に示した記憶部103の一部である。図1に示したデータ取得部21は、図7に示した通信部105および制御部101により実現される。また、検知結果出力部28は、通信部105または表示部104により実現される。なお、異常兆候検知装置2を実現するコンピュータシステムが上述した子局である場合、図7に示したコンピュータシステムより簡易なものであってもよい。例えば、図7に示したコンピュータシステムから表示部104および出力部106が除かれたものであってもよい。
Similarly to the learning device 1, the abnormality sign detection device 2 is also realized by the computer system shown in FIG. The preprocessing unit 23, the first waveform analysis unit 24, and the overdetection removal unit 25 shown in FIG. 1 are executed by the control unit 101 shown in FIG. 7 according to a computer program stored in the storage unit 103 shown in FIG. It is realized by The storage unit 103 shown in FIG. 7 is also used to realize the preprocessing unit 23, the first waveform analysis unit 24, and the overdetection removal unit 25 shown in FIG. The data storage unit 22, the removed waveform storage unit 26, and the first learning data storage unit 27 shown in FIG. 1 are part of the storage unit 103 shown in FIG. Data acquisition unit 21 shown in FIG. 1 is realized by communication unit 105 and control unit 101 shown in FIG. Also, the detection result output unit 28 is implemented by the communication unit 105 or the display unit 104 . If the computer system that implements the sign-of-abnormality detection device 2 is the slave station described above, the computer system may be simpler than the computer system shown in FIG. For example, the display unit 104 and the output unit 106 may be removed from the computer system shown in FIG.
以上のように、本実施の形態の異常兆候検知システム3は、正常波形を学習する類似波形解析により異常兆候を検知し、学習における前処理として、N周期前差分処理を行うようにした。これにより、異常兆候の検知精度を向上させることができる。また、前処理においてさらに平滑化処理を行うことにより、さらに異常兆候の検知精度を向上させることができる。
As described above, the abnormal sign detection system 3 of the present embodiment detects an abnormal sign by similar waveform analysis for learning normal waveforms, and performs differential processing before N cycles as preprocessing for learning. As a result, it is possible to improve the detection accuracy of the sign of abnormality. In addition, by further performing smoothing processing in the preprocessing, it is possible to further improve the detection accuracy of signs of abnormality.
実施の形態2.
図8は、実施の形態2にかかる異常兆候検知システムの構成例を示す図である。本実施の形態の異常兆候検知システム3aは、学習装置1aと、異常兆候検知装置2aと、を備える。本実施の形態の学習装置1aは、前処理部13、除去波形抽出部15および除去波形記憶部16の代わりに、前処理部13a、分類部18、位相合わせ部19、第2波形解析部41および第2学習データ記憶部42を備える以外は、実施の形態1の学習装置1と同様である。本実施の形態の異常兆候検知装置2aは、前処理部23、過検知除去部25および除去波形記憶部26の代わりに、前処理部23a、分類部29、位相合わせ部30、第2波形解析部31および第2学習データ記憶部32を備える以外は、実施の形態1の異常兆候検知装置2と同様である。実施の形態1と同様の機能を有する構成要素には実施の形態1と同一の符号を付して重複する説明を省略する。以下実施の形態1と異なる点を主に説明する。 Embodiment 2.
FIG. 8 is a diagram illustrating a configuration example of an abnormality sign detection system according to a second embodiment; An abnormality sign detection system 3a of the present embodiment includes alearning device 1a and an abnormality sign detection device 2a. The learning device 1a of the present embodiment includes a preprocessing unit 13a, a classification unit 18, a phase matching unit 19, and a second waveform analysis unit 41 instead of the preprocessing unit 13, the removed waveform extraction unit 15, and the removed waveform storage unit 16. and a second learning data storage unit 42, the learning device 1 is the same as the learning device 1 of the first embodiment. In place of the preprocessing unit 23, the overdetection removal unit 25, and the removed waveform storage unit 26, the abnormal sign detection device 2a of the present embodiment includes a preprocessing unit 23a, a classification unit 29, a phase matching unit 30, a second waveform analysis It is the same as the abnormality sign detection device 2 of Embodiment 1 except that the unit 31 and the second learning data storage unit 32 are provided. Components having functions similar to those of the first embodiment are denoted by the same reference numerals as those of the first embodiment, and overlapping descriptions are omitted. Differences from the first embodiment will be mainly described below.
図8は、実施の形態2にかかる異常兆候検知システムの構成例を示す図である。本実施の形態の異常兆候検知システム3aは、学習装置1aと、異常兆候検知装置2aと、を備える。本実施の形態の学習装置1aは、前処理部13、除去波形抽出部15および除去波形記憶部16の代わりに、前処理部13a、分類部18、位相合わせ部19、第2波形解析部41および第2学習データ記憶部42を備える以外は、実施の形態1の学習装置1と同様である。本実施の形態の異常兆候検知装置2aは、前処理部23、過検知除去部25および除去波形記憶部26の代わりに、前処理部23a、分類部29、位相合わせ部30、第2波形解析部31および第2学習データ記憶部32を備える以外は、実施の形態1の異常兆候検知装置2と同様である。実施の形態1と同様の機能を有する構成要素には実施の形態1と同一の符号を付して重複する説明を省略する。以下実施の形態1と異なる点を主に説明する。 Embodiment 2.
FIG. 8 is a diagram illustrating a configuration example of an abnormality sign detection system according to a second embodiment; An abnormality sign detection system 3a of the present embodiment includes a
実施の形態1で述べたように、第1波形解析部14は、類似波形解析により正常波形を学習する。本実施の形態では、さらに、異常兆候のあるデータである異常兆候データを用いて、類似波形解析によって、異常兆候波形データと異常兆候があるか否かの判定に用いられる異常兆候判定しきい値とを生成する第2波形解析部41を備える。異常兆候波形および異常兆候判定しきい値も、異常兆候の検知に用いられる学習済データである。異常兆候波形は、異常兆候が表れている波形である。本実施の形態では、除去波形抽出部15によって決定される判定条件を用いたタイプ別フィルタ処理の代わりに、第1波形解析部14による判定により異常兆候が検知された場合に、異常兆候波形の学習結果を用いた異常兆候の検知を行う。以下では、実施の形態1と同様に、配電系統において計測される零相電流および零相電圧のうちの少なくとも一方の瞬時値の計測データを時系列データとして用いる例を説明するが、実施の形態1と同様に、本実施の形態の構成および動作は、他の時系列データにも適用できる。
As described in Embodiment 1, the first waveform analysis unit 14 learns normal waveforms through similar waveform analysis. In the present embodiment, the abnormal sign waveform data and the abnormal sign determination threshold value used for determining whether or not there is an abnormal sign are further analyzed by similar waveform analysis using the abnormal sign data, which is data with an abnormal sign. and a second waveform analysis unit 41 for generating . The abnormal sign waveform and the abnormal sign determination threshold are also learned data used for detecting an abnormal sign. An abnormal symptom waveform is a waveform in which an abnormal symptom appears. In the present embodiment, instead of the type-specific filter processing using the determination condition determined by the removed waveform extracting unit 15, when an abnormal sign is detected by the determination by the first waveform analysis unit 14, the abnormal sign waveform Detect abnormal signs using learning results. In the following, as in the first embodiment, an example will be described in which the measurement data of the instantaneous value of at least one of the zero-phase current and the zero-phase voltage measured in the distribution system is used as time-series data. 1, the configuration and operation of this embodiment can also be applied to other time-series data.
次に、本実施の形態の動作について説明する。まず、学習時の動作について説明する。本実施の形態においても、学習装置1aは、類似波形解析により正常波形を学習する。すなわち、図3に示したステップS1~ステップS5の処理を実施する。なお、本実施の形態においても、実施の形態1で述べた除去波形抽出部15および除去波形記憶部16を設けて、ステップS6が行われてもよい。
Next, the operation of this embodiment will be described. First, the operation during learning will be described. Also in this embodiment, the learning device 1a learns normal waveforms by similar waveform analysis. That is, the processing of steps S1 to S5 shown in FIG. 3 is performed. Also in this embodiment, step S6 may be performed by providing the removed waveform extraction unit 15 and the removed waveform storage unit 16 described in the first embodiment.
図9は、本実施の形態における類似波形解析による異常兆候波形の学習の処理手順の一例を示すフローチャートである。図9に示すように、学習装置1aは、瞬時値(異常兆候データ)を取得する(ステップS21)。詳細には、データ取得部11は、例えば、異常兆候が生じていると判明している波形の瞬時値の計測データを異常兆候データとして図示しない他の装置から取得する。異常兆候データとしては、短い区間(例えば単位区間)のデータが複数入力される。
FIG. 9 is a flowchart showing an example of a processing procedure for learning an abnormal sign waveform by similar waveform analysis according to the present embodiment. As shown in FIG. 9, the learning device 1a acquires instantaneous values (abnormal sign data) (step S21). Specifically, the data acquisition unit 11 acquires measurement data of instantaneous values of waveforms in which signs of abnormality have been found to occur, for example, from another device (not shown) as signs of abnormality data. A plurality of pieces of data of short intervals (for example, unit intervals) are input as the abnormal sign data.
次に、学習装置1aは、実施の形態1と同様に平滑化処理が行われ(ステップS2)、平滑化処理後のデータが分類部18に入力される。次に、学習装置1aは、波形分類を行う(ステップS22)。詳細には、分類部18が、平滑化処理後のデータを距離に応じて分類し、分類されたデータを位相合わせ部19へ出力する。分類部18における分類方法は、どのような方法を用いてもよいが、例えば、K-Shape法により分類する。なお、この波形分類は、類似度が低い(距離が離れた)ものを分類することで、異常兆候の波形の精度を向上させるためのものであるため、類似度の高い波形を検出することができればよく波形分類は行われなくてもよい。
Next, the learning device 1a performs smoothing processing in the same manner as in Embodiment 1 (step S2), and the data after the smoothing processing is input to the classification unit 18. Next, the learning device 1a performs waveform classification (step S22). Specifically, the classification unit 18 classifies the smoothed data according to the distance, and outputs the classified data to the phase matching unit 19 . Any sorting method may be used in the sorting unit 18. For example, the K-Shape method is used for sorting. Note that this waveform classification is intended to improve the accuracy of abnormal symptom waveforms by classifying waveforms with a low degree of similarity (longer distances), so waveforms with a high degree of similarity can be detected. Waveform classification may not be performed if possible.
次に、学習装置1aは、位相合わせを行う(ステップS23)。詳細には、位相合わせ部19が分類部18から入力された複数のデータの位相を合わせる処理を行う。正常波形を学習する場合には、一般に、入力データとして正常な期間の連続した時系列データが入力されるが、異常兆候が生じている波形である異常兆候波形を学習する場合には、一般には短い区間の連続しないデータが入力される。このため、複数のデータ間で電源周期における位相を合わせるための位相合わせが行われる。位相合わせは、オペレータが各波形の形状を確認しながらオフセットさせる量を指定することで行われてもよいし、他の方法で行われてもよい。なお、位相が揃ったデータが入力される場合などには、位相合わせは行われなくてもよい。なお、位相合わせおよび第2波形解析は分類部18によって分類されたグループごとに行われてもよい。この場合、グループごとに異常兆候判定しきい値が設定されてもよい。
Next, the learning device 1a performs phase matching (step S23). Specifically, the phase matching unit 19 performs a process of matching the phases of a plurality of data input from the classifying unit 18 . When learning normal waveforms, in general, continuous time-series data of a normal period is input as input data. Non-continuous data in short intervals is input. For this reason, phase matching is performed to match the phases in the power cycle between a plurality of data. The phase matching may be performed by the operator specifying the amount of offset while checking the shape of each waveform, or may be performed by other methods. It should be noted that, for example, when data with the same phase is input, the phase matching does not have to be performed. Note that phase matching and second waveform analysis may be performed for each group classified by the classification section 18 . In this case, an abnormality sign determination threshold may be set for each group.
次に、学習装置1aは、第2波形解析(類似波形解析)を行う(ステップS24)。詳細には、第2波形解析部41が、位相合わせ部19から入力されたデータを用いて、外れスコアを算出し、算出した外れスコアを用いて異常兆候があるか否かの判定に用いられる異常兆候判定しきい値を決定する。入力されるデータが異なるが、類似波形解析自体の処理は実施の形態1の第1波形解析部14の処理と同様である。異常兆候判定しきい値は、例えば、実施の形態1と同様に3σに設定されるがこれに限定されない。第2波形解析部41は、異常兆候波形データと異常兆候判定しきい値とを第2学習データ記憶部42に格納する。異常兆候検知装置2aの第2学習データ記憶部32には、学習装置1aの第2学習データ記憶部42に格納された情報が記憶される。第2学習データ記憶部32への第2学習データ記憶部42の情報の反映方法は、実施の形態1の第1学習データ記憶部17の情報の第1学習データ記憶部27への反映方法と同様である。
Next, the learning device 1a performs a second waveform analysis (similar waveform analysis) (step S24). Specifically, the second waveform analysis unit 41 uses the data input from the phase matching unit 19 to calculate the outlier score, and the calculated outlier score is used to determine whether or not there is an abnormality sign. Determining thresholds for judgment of signs of abnormality. Although the input data are different, the processing of the similar waveform analysis itself is the same as the processing of the first waveform analysis section 14 of the first embodiment. The abnormality sign determination threshold value is set to, for example, 3σ as in the first embodiment, but is not limited to this. The second waveform analysis unit 41 stores the abnormal sign waveform data and the abnormal sign determination threshold in the second learning data storage unit 42 . Information stored in the second learning data storage unit 42 of the learning device 1a is stored in the second learning data storage unit 32 of the abnormality sign detection device 2a. The method of reflecting the information of the second learning data storage unit 42 to the second learning data storage unit 32 is the same as the method of reflecting the information of the first learning data storage unit 17 to the first learning data storage unit 27 of the first embodiment. It is the same.
図10は、本実施の形態の異常兆候検知装置2aにおける推論時の処理手順の一例を示すフローチャートである。ステップS11~ステップS16は実施の形態1と同様である。ただし、前処理部23aは、ステップS12の後平滑化処理後(N周期前差分処理の前)のデータを分類部29に出力する。また第1波形解析部24は、判定結果を分類部29へ出力する。ステップS16でYesと判定された場合、異常兆候検知装置2aは、波形分類を行う(ステップS31)。詳細には、分類部29が、第1波形解析部24によって異常兆候があると判定されたデータを、第2学習データ記憶部32に記憶されている各グループの異常兆候波形データとの距離に基づいて検知対象のデータを分類する。
FIG. 10 is a flowchart showing an example of a processing procedure during inference in the anomaly sign detection device 2a of the present embodiment. Steps S11 to S16 are the same as in the first embodiment. However, the pre-processing unit 23 a outputs the data after the post-smoothing processing in step S<b>12 (before the N-cycle pre-difference processing) to the classifying unit 29 . The first waveform analysis section 24 also outputs the determination result to the classification section 29 . When it is determined as Yes in step S16, the abnormality sign detection device 2a performs waveform classification (step S31). Specifically, the classification unit 29 classifies the data determined to have signs of abnormality by the first waveform analysis unit 24 into the distance from the signs of abnormality waveform data of each group stored in the second learning data storage unit 32. Classify the data to be detected based on
次に、異常兆候検知装置2aは、位相合わせを行う(ステップS32)。詳細には、位相合わせ部30が、検知対象のデータの位相を、対応するグループの異常兆候波形データに合わせる処理を行う。次に、異常兆候検知装置2aは、第2波形解析(類似波形解析)を行う(ステップS33)。詳細には、第2波形解析部31が、位相合わせ後のデータと第2学習データ記憶部32に記憶されている各グループの異常兆候波形データとを用いて外れスコアを算出し、外れスコアが異常兆候判定しきい値以下である場合に、異常兆候があると判定し、外れスコアが異常兆候判定しきい値を超える場合に、異常兆候がないと判定する。第2波形解析部31は、判定結果を検知結果出力部28へ出力する。ステップS33の後のステップS18は実施の形態1と同様である。ステップS16でNoと判定された場合には、分類部29が第1波形解析部24の判定結果を検知結果出力部28へ出力する。なお、上述したように、学習時に実施の形態1のステップS6で述べた処理が行われている場合には、ステップS31の前に、実施の形態1と同様にタイプ別フィルタ処理が行われ、タイプ別フィルタ処理で正常であると判定された場合にステップS31が実行されてもよい。
Next, the abnormality sign detection device 2a performs phase matching (step S32). Specifically, the phase matching unit 30 performs a process of matching the phase of the data to be detected with the abnormal sign waveform data of the corresponding group. Next, the abnormality sign detection device 2a performs second waveform analysis (similar waveform analysis) (step S33). Specifically, the second waveform analysis unit 31 calculates an outlier score using the phase-matched data and the symptom-of-abnormal waveform data for each group stored in the second learning data storage unit 32, and the outlier score is If the score is equal to or less than the abnormality sign determination threshold value, it is determined that there is an abnormality sign, and if the deviation score exceeds the abnormality sign determination threshold value, it is determined that there is no abnormality sign. The second waveform analysis section 31 outputs the determination result to the detection result output section 28 . Step S18 after step S33 is the same as in the first embodiment. If determined as No in step S<b>16 , the classification section 29 outputs the determination result of the first waveform analysis section 24 to the detection result output section 28 . As described above, when the processing described in step S6 of the first embodiment is performed during learning, before step S31, type-specific filter processing is performed in the same manner as in the first embodiment, Step S31 may be executed when it is determined that the filtering process by type is normal.
以上のように、第2波形解析部31は、第1波形解析部24によって異常兆候があると判定された場合に、検知対象データと異常兆候波形と異常兆候判定しきい値とを用いて、異常兆候があるか否かを判定する。実施の形態1では、タイプ別フィルタ処理により、過検知を除去したが、本実施の形態では、第2波形解析部31が異常兆候波形の学習結果を用いた類似波形解析を行うことで過検知を除去する。タイプ別フィルタ処理は、例えばたまにしか動かない装置による挙動を特別に記憶しておき、その挙動による検知されたものを正常であると判定して除去するものであるが、第2波形解析部31による類似波形解析は、過去の異常兆候データと類似しているものだけを通過させそれ以外を除去するものである。すなわち、第2波形解析部31による類似波形解析は、事故時に特定の波形が出現する場合に、説明性(周知の物理法則、事故に至った実績有りなど)がある波形を異常兆候波形として学習させ、その波形と類似した波形を異常兆候波形として通過させる。したがって、第2波形解析部31による類似波形解析はタイプ別フィルタ処理を用いる場合に比べて、異常兆候として検出された波形の説明性を高めることができる。
As described above, when the first waveform analysis unit 24 determines that there is an abnormality symptom, the second waveform analysis unit 31 uses the detection target data, the abnormality symptom waveform, and the abnormality symptom determination threshold value to Determine whether or not there is an abnormality sign. In Embodiment 1, overdetection is removed by type-specific filter processing. to remove For example, the type-specific filter processing is to specially store the behavior of a device that operates only occasionally, determine that the behavior detected by the behavior is normal, and remove it. The similar waveform analysis by is to pass only those that are similar to past abnormal sign data and remove the others. That is, the similar waveform analysis by the second waveform analysis unit 31 learns waveforms with explanatory properties (well-known laws of physics, records of accidents, etc.) as abnormal symptom waveforms when a specific waveform appears at the time of an accident. and pass a waveform similar to that waveform as an anomaly symptom waveform. Therefore, the similar waveform analysis by the second waveform analysis unit 31 can improve the explainability of waveforms detected as signs of abnormality, compared to the case of using filtering by type.
なお、上述した例では、第1波形解析で異常兆候が検知された場合に、第2波形解析を実施するようにしたが、第1波形解析と第2波形解析とを並行して実施し、両方の解析の結果を用いて、異常兆候を検知してもよい。例えば、第1波形解析と第2波形解析とのいずれか一方で異常兆候があると検知された場合に、最終の検知結果を異常兆候があるとし、第1波形解析と第2波形解析との両方で正常と判定された場合に、最終結果を正常としてもよい。
In the above example, the second waveform analysis is performed when an abnormal symptom is detected in the first waveform analysis. The results of both analyses, may be used to detect signs of anomalies. For example, if an abnormal symptom is detected by either the first waveform analysis or the second waveform analysis, the final detection result is determined to be an abnormal symptom, and the first waveform analysis and the second waveform analysis are performed. If both are determined to be normal, the final result may be normal.
以上述べた以外の本実施の形態の動作は実施の形態1と同様である。本実施の形態の学習装置1aも実施の形態1の学習装置1と同様に、例えば、図7に示したコンピュータシステムにより実現される。図9に示した前処理部13a、分類部18、位相合わせ部19、第2波形解析部41は、図7に示した記憶部103に記憶されたコンピュータプログラムが図7に示した制御部101により実行されることにより実現される。図9に示した第2学習データ記憶部42は、図7に示した記憶部103の一部である。異常兆候検知装置2aも、同様に、例えば図7に示したコンピュータシステムにより実現される。図9に示した前処理部23a、分類部29、位相合わせ部30、第2波形解析部31は、図7に示した記憶部103に記憶されたコンピュータプログラムが図7に示した制御部101により実行されることにより実現される。図9に示した第2学習データ記憶部32は、図7に示した記憶部103の一部である。
The operation of the present embodiment other than that described above is the same as that of the first embodiment. Like the learning device 1 of the first embodiment, the learning device 1a of the present embodiment is realized by, for example, the computer system shown in FIG. The preprocessing unit 13a, the classification unit 18, the phase matching unit 19, and the second waveform analysis unit 41 shown in FIG. 9 are executed by the control unit 101 shown in FIG. It is realized by being executed by The second learning data storage unit 42 shown in FIG. 9 is part of the storage unit 103 shown in FIG. Similarly, the sign-of-abnormality detection device 2a is realized by the computer system shown in FIG. 7, for example. The preprocessing unit 23a, the classification unit 29, the phase matching unit 30, and the second waveform analysis unit 31 shown in FIG. 9 are controlled by the control unit 101 shown in FIG. It is realized by being executed by The second learning data storage unit 32 shown in FIG. 9 is part of the storage unit 103 shown in FIG.
本実施の形態においても、実施の形態1と同様に、正常波形を学習する類似波形解析により異常兆候を検知し、学習における前処理として、N周期前差分処理を行うようにした。これにより、異常兆候の検知精度を向上させることができる。
Also in the present embodiment, similar to the first embodiment, abnormal signs are detected by similar waveform analysis for learning normal waveforms, and N cycles before difference processing is performed as preprocessing for learning. As a result, it is possible to improve the detection accuracy of the sign of abnormality.
実施の形態3.
図11は、実施の形態3にかかる異常兆候検知システムの構成例を示す図である。本実施の形態の異常兆候検知システム3bは、学習装置1bと、異常兆候検知装置2bと、を備える。本実施の形態の学習装置1bは、データ取得部11、除去波形抽出部15および除去波形記憶部16の代わりに、データ取得部11a、差分解析部43および第3学習データ記憶部44を備える以外は、実施の形態1の学習装置1と同様である。本実施の形態の異常兆候検知装置2bは、データ取得部21、過検知除去部25および除去波形記憶部26の代わりに、データ取得部21a、差分解析部33および第3学習データ記憶部34を備える以外は、実施の形態1の異常兆候検知装置2と同様である。実施の形態1と同様の機能を有する構成要素には実施の形態1と同一の符号を付して重複する説明を省略する。以下実施の形態1と異なる点を主に説明する。Embodiment 3.
FIG. 11 is a diagram illustrating a configuration example of an abnormality sign detection system according to a third embodiment; An abnormalitysign detection system 3b of the present embodiment includes a learning device 1b and an abnormality sign detection device 2b. The learning device 1b of the present embodiment includes a data acquisition unit 11a, a difference analysis unit 43, and a third learning data storage unit 44 instead of the data acquisition unit 11, the removed waveform extraction unit 15, and the removed waveform storage unit 16. are the same as those of the learning device 1 of the first embodiment. The abnormality sign detection device 2b of the present embodiment includes a data acquisition unit 21a, a difference analysis unit 33, and a third learning data storage unit 34 instead of the data acquisition unit 21, the overdetection removal unit 25, and the removed waveform storage unit 26. It is the same as the abnormality sign detection device 2 of Embodiment 1 except that it is provided. Components having functions similar to those of the first embodiment are denoted by the same reference numerals as those of the first embodiment, and overlapping descriptions are omitted. Differences from the first embodiment will be mainly described below.
図11は、実施の形態3にかかる異常兆候検知システムの構成例を示す図である。本実施の形態の異常兆候検知システム3bは、学習装置1bと、異常兆候検知装置2bと、を備える。本実施の形態の学習装置1bは、データ取得部11、除去波形抽出部15および除去波形記憶部16の代わりに、データ取得部11a、差分解析部43および第3学習データ記憶部44を備える以外は、実施の形態1の学習装置1と同様である。本実施の形態の異常兆候検知装置2bは、データ取得部21、過検知除去部25および除去波形記憶部26の代わりに、データ取得部21a、差分解析部33および第3学習データ記憶部34を備える以外は、実施の形態1の異常兆候検知装置2と同様である。実施の形態1と同様の機能を有する構成要素には実施の形態1と同一の符号を付して重複する説明を省略する。以下実施の形態1と異なる点を主に説明する。
FIG. 11 is a diagram illustrating a configuration example of an abnormality sign detection system according to a third embodiment; An abnormality
本実施の形態では、実施の形態1と同様に、配電系統において計測される零相電流および零相電圧のうちの少なくとも一方である計測対象の瞬時値の計測データを時系列データとして用いる例を説明する。さらに、本実施の形態では、瞬時値だけでなく実効値についても計測データが取得される。例えば、実施の形態1の図2の異常兆候検知装置2と同様に、異常兆候検知装置2bが、開閉器4を制御する子局であり、多数の異常兆候検知装置2bが用いられる場合、コストを抑制するために異常兆候検知装置2bのハードウェアの処理能力に制約が生じることが考えられる。瞬時値は、例えば、1波形あたり100点のサンプリングが行われるとすると、配電系統における電源周期が60Hzである場合、1秒あたり6000点のデータとなる。このようなデータを用いて常時リアルタイムに異常兆候を検知するためには異常兆候検知装置2bには処理負荷がかかり、ハードウェアの処理能力の制約があると処理が難しい場合も考えられる。一方、配電系統の電圧および電流は一般には、実効値についても計測データとして取得されており、実効値は、1周期あたり1つのデータとなるため、データの点数が瞬時値に比べて少なくなる。
In the present embodiment, as in the first embodiment, the measurement data of the instantaneous value of the measurement target, which is at least one of the zero-phase current and the zero-phase voltage measured in the distribution system, is used as time-series data. explain. Furthermore, in the present embodiment, measurement data are obtained not only for instantaneous values but also for effective values. For example, similarly to the sign-of-abnormality detection device 2 of FIG. It is conceivable that the processing capability of the hardware of the abnormality sign detection device 2b is restricted in order to suppress the . Assuming that 100 points of sampling are performed per waveform, for example, the instantaneous value is 6000 points of data per second if the power supply cycle in the power distribution system is 60 Hz. In order to always detect signs of anomalies in real time using such data, a processing load is placed on the sign-of-abnormality detecting device 2b, and processing may be difficult if there are restrictions on the processing capacity of the hardware. On the other hand, the voltage and current of the distribution system are generally obtained as measurement data also for the effective value, and since the effective value is one data per cycle, the number of data points is smaller than the instantaneous value.
なお、本実施の形態の動作は、検知対象の計測データが配電系統において計測される零相電流および零相電圧のうちの少なくとも一方である場合に限らず、検知対象の計測データが周期性のある電流および電圧のうち少なくとも一方であれば適用でき、周期は電源周波数に限定されない。
Note that the operation of the present embodiment is not limited to the case where the measurement data to be detected is at least one of the zero-phase current and the zero-phase voltage measured in the distribution system, and the measurement data to be detected is periodic. At least one of a certain current and voltage can be applied, and the period is not limited to the power supply frequency.
そこで、本実施の形態では、実効値を用いた異常兆候の検知を常時行い、実効値を用いた異常兆候の検知により異常兆候が検知された場合に、検知された時刻の周辺の瞬時値を用いた異常兆候の検知を行う。これにより、異常兆候検知装置2bにおける処理負荷を軽減しつつ、瞬時値を用いた波形の詳細な解析も行うことで異常兆候の検知精度を向上させることができる。
Therefore, in the present embodiment, detection of abnormal signs using effective values is always performed, and when abnormal signs are detected by detecting abnormal signs using effective values, instantaneous values around the time of detection are calculated. Detect abnormal signs using As a result, it is possible to reduce the processing load on the abnormality sign detection device 2b and improve the detection accuracy of the abnormality sign by performing detailed analysis of the waveform using the instantaneous value.
次に、本実施の形態の動作について説明する。まず、学習時の動作について説明する。本実施の形態においても、学習装置1bは、類似波形解析により正常波形を学習する。すなわち、図3に示したステップS1~ステップS5の処理を実施する。なお、本実施の形態においても、実施の形態1で述べた除去波形抽出部15および除去波形記憶部16を設けて、ステップS6が行われてもよい。
Next, the operation of this embodiment will be described. First, the operation during learning will be described. Also in the present embodiment, the learning device 1b learns normal waveforms by similar waveform analysis. That is, the processing of steps S1 to S5 shown in FIG. 3 is performed. Also in this embodiment, step S6 may be performed by providing the removed waveform extraction unit 15 and the removed waveform storage unit 16 described in the first embodiment.
本実施の形態では、さらに、実効値を用いた学習が行われる。図12は、本実施の形態の実効値を用いた学習の処理手順の一例を示すフローチャートである。図12に示すように、学習装置1bは、実効値(正常データ)を取得する(ステップS41)。詳細には、データ取得部11aが、計測対象の実効値の計測データ、すなわち正常な期間における実効値の計測データを取得しデータ記憶部12に格納する。
In the present embodiment, learning using effective values is further performed. FIG. 12 is a flowchart showing an example of a learning processing procedure using effective values according to the present embodiment. As shown in FIG. 12, the learning device 1b acquires effective values (normal data) (step S41). Specifically, the data acquisition unit 11 a acquires the measurement data of the effective value of the object to be measured, that is, the measurement data of the effective value in the normal period, and stores it in the data storage unit 12 .
学習装置1bは、1階差分値解析を実施する(ステップS42)。詳細には、差分解析部43が、実効値の計測データの1つ前のデータとの差分である1階差分値を求める。そして、複数の1階差分値を用いて標準偏差を求め、標準偏差を用いて正常であるか否かを判定するためのしきい値を決定する。このしきい値も、異常兆候の検知に用いられる学習済データである。例えば、差分解析部43は、6σをしきい値とする。ここではしきい値を6σとしたが、しきい値は、例えば、事前評価の結果などによって決定されればよくこの値に限定されない。差分解析部43は、算出したしきい値を第3学習データ記憶部44に格納する。異常兆候検知装置2bの第3学習データ記憶部34には、学習装置1bの第3学習データ記憶部44に格納された情報が記憶される。第3学習データ記憶部34への第3学習データ記憶部44の情報の反映方法は、実施の形態1の第1学習データ記憶部17の情報の第1学習データ記憶部27への反映方法と同様である。
The learning device 1b performs first-order difference value analysis (step S42). Specifically, the difference analysis unit 43 obtains a first-order difference value, which is the difference between the effective value measurement data and the previous data. Then, the standard deviation is obtained using a plurality of first-order difference values, and the threshold value for determining whether or not it is normal is determined using the standard deviation. This threshold value is also learned data used for detection of signs of abnormality. For example, the difference analysis unit 43 uses 6σ as a threshold. Here, the threshold is set to 6σ, but the threshold is not limited to this value as long as it is determined based on the result of preliminary evaluation, for example. The difference analysis section 43 stores the calculated threshold in the third learning data storage section 44 . Information stored in the third learning data storage unit 44 of the learning device 1b is stored in the third learning data storage unit 34 of the abnormality sign detection device 2b. The method of reflecting the information of the third learning data storage unit 44 to the third learning data storage unit 34 is the same as the method of reflecting the information of the first learning data storage unit 17 to the first learning data storage unit 27 of the first embodiment. It is the same.
図13は、本実施の形態の異常兆候検知装置2bにおける推論時の処理手順の一例を示すフローチャートである。まず、異常兆候検知装置2bは、検知対象の実効値を取得する(ステップS51)。詳細には、データ取得部21aが、検知対象の実効値を取得しデータ記憶部22に格納する。なお、このとき、データ取得部21aは、瞬時値についても取得してデータ記憶部22に格納する。
FIG. 13 is a flowchart showing an example of a processing procedure during inference in the anomaly sign detection device 2b of the present embodiment. First, the sign-of-abnormality detection device 2b acquires the effective value of the detection target (step S51). Specifically, the data acquisition unit 21 a acquires the effective value of the detection target and stores it in the data storage unit 22 . At this time, the data acquisition unit 21 a also acquires instantaneous values and stores them in the data storage unit 22 .
次に、異常兆候検知装置2bは、1階差分値解析を実施する(ステップS52)。詳細には、差分解析部33が、データ記憶部22に格納されている実効値を用いて1階差分値を算出し、1階差分値と第3学習データ記憶部44に格納されているしきい値とを比較する。
Next, the abnormality sign detection device 2b performs first-order difference value analysis (step S52). Specifically, the difference analysis unit 33 calculates the first-order difference value using the effective value stored in the data storage unit 22, and the first-order difference value and the third learning data storage unit 44 store the difference value. Compare with threshold.
異常兆候が検知された場合(ステップS53 Yes)、すなわち1階差分値がしきい値を超えた場合、実施の形態1と同様のステップS12~ステップS15が実施される。ステップS15の判定結果が第1波形解析部24から検知結果出力部28に通知され、ステップS18が行われる。詳細には、異常兆候が検知された後、2秒間など一定期間における瞬時値が用いられてステップS12~ステップS15が実施される。なお、上述したように、学習時に実施の形態1のステップS6で述べた処理が行われている場合には、ステップS15の後に、実施の形態1と同様にステップS16,S17が行われてもよい。
If an abnormality symptom is detected (step S53 Yes), that is, if the first-order difference value exceeds the threshold, steps S12 to S15 are performed in the same manner as in the first embodiment. The determination result of step S15 is notified from the first waveform analysis unit 24 to the detection result output unit 28, and step S18 is performed. More specifically, steps S12 to S15 are performed using an instantaneous value for a certain period of time, such as two seconds, after the sign of abnormality is detected. As described above, when the processing described in step S6 of the first embodiment is performed during learning, even if steps S16 and S17 are performed after step S15 in the same manner as in the first embodiment, good.
異常兆候が検知されない場合(ステップS53 No)、すなわち正常な場合、ステップS18の処理が実施される。なお、実施の形態1と同様に、正常と判定された場合には、検知結果の出力は行われてなくてもよい。
If no sign of abnormality is detected (step S53 No), that is, if normal, the process of step S18 is performed. Note that, as in the first embodiment, when it is determined to be normal, the detection result does not have to be output.
以上のように、本実施の形態では、差分解析部33は、計測対象の検知対象の実効値の計測データの1階差分値を算出し、算出した1階差分値としきい値とを用いて、異常兆候があるか否かを判定し、第1波形解析部24は、差分解析部33によって異常兆候があると判定された場合に、N周期前差分値と正常波形と正常判定しきい値とを用いて、類似波形解析によって、異常兆候があるか否かを判定する。
As described above, in the present embodiment, the difference analysis unit 33 calculates the first-order difference value of the measurement data of the effective value of the detection target of the measurement target, and uses the calculated first-order difference value and the threshold value. , determines whether or not there is an abnormality symptom, and if the difference analysis unit 33 determines that there is an abnormality symptom, the first waveform analysis unit 24 compares the difference value before N cycles, the normal waveform, and the normal determination threshold is used to determine whether or not there is an abnormality sign by similar waveform analysis.
なお、異常兆候検知装置2bの処理能力に制約がない場合には、第1波形解析と1階差分値解析とを並行して実施し、両方の解析の結果を用いて、異常兆候を検知してもよい。例えば、第1波形解析と1階差分値解析のいずれか一方で異常兆候があると検知された場合に、最終の検知結果を異常兆候があるとし、第1波形解析と第2波形解析との両方で正常と判定された場合に、最終結果を正常としてもよい。
If there is no restriction on the processing capacity of the abnormality sign detection device 2b, the first waveform analysis and the first order difference value analysis are performed in parallel, and the results of both analyzes are used to detect an abnormality sign. may For example, if an abnormal symptom is detected by either the first waveform analysis or the first difference value analysis, the final detection result is determined to be an abnormal symptom, and the first waveform analysis and the second waveform analysis are performed. If both are determined to be normal, the final result may be normal.
本実施の形態の学習装置1bも実施の形態1の学習装置1と同様に、例えば、図7に示したコンピュータシステムにより実現される。図11に示した差分解析部43は、図7に示した記憶部103に記憶されたコンピュータプログラムが図7に示した制御部101により実行されることにより実現される。図11に示した第3学習データ記憶部44は、図7に示した記憶部103の一部である。図11に示したデータ取得部11aは、図7に示した通信部105および制御部101により実現される。異常兆候検知装置2bも、同様に、例えば図7に示したコンピュータシステムにより実現される。図11に示した差分解析部33は、図7に示した記憶部103に記憶されたコンピュータプログラムが図7に示した制御部101により実行されることにより実現される。図11に示した第3学習データ記憶部34は、図7に示した記憶部103の一部である。図11に示したデータ取得部21aは、図7に示した通信部105および制御部101により実現される。
The learning device 1b of the present embodiment is realized by, for example, the computer system shown in FIG. 7, like the learning device 1 of the first embodiment. The difference analysis unit 43 shown in FIG. 11 is realized by executing a computer program stored in the storage unit 103 shown in FIG. 7 by the control unit 101 shown in FIG. The third learning data storage unit 44 shown in FIG. 11 is part of the storage unit 103 shown in FIG. Data acquisition unit 11a shown in FIG. 11 is implemented by communication unit 105 and control unit 101 shown in FIG. Similarly, the sign-of-abnormality detection device 2b is realized by the computer system shown in FIG. 7, for example. The difference analysis unit 33 shown in FIG. 11 is realized by executing a computer program stored in the storage unit 103 shown in FIG. 7 by the control unit 101 shown in FIG. The third learning data storage unit 34 shown in FIG. 11 is part of the storage unit 103 shown in FIG. Data acquisition unit 21a shown in FIG. 11 is implemented by communication unit 105 and control unit 101 shown in FIG.
本実施の形態においても、実施の形態1と同様に、正常波形を学習する類似波形解析により異常兆候を検知し、学習における前処理として、N周期前差分処理を行うようにした。これにより、異常兆候の検知精度を向上させることができる。また、本実施の形態では、実効値を用いた異常兆候の検知と組み合わせ、実効値を用いた異常兆候の検知で異常兆候があると判定された場合に、瞬時値を用いた異常兆候の検知を行うため、常時瞬時値を用いた異常兆候の検知を行う場合に比べて、異常兆候検知装置2bの処理負荷を軽減することができる。
Also in the present embodiment, similar to the first embodiment, abnormal signs are detected by similar waveform analysis for learning normal waveforms, and N cycles before difference processing is performed as preprocessing for learning. As a result, it is possible to improve the detection accuracy of the sign of abnormality. In addition, in the present embodiment, in combination with the detection of the sign of abnormality using the effective value, when it is determined that there is a sign of abnormality by the detection of the sign of abnormality using the effective value, the detection of the sign of abnormality using the instantaneous value , the processing load of the abnormality sign detection device 2b can be reduced compared to the case where the abnormality sign is always detected using the instantaneous value.
実施の形態4.
図14は、実施の形態4にかかる異常兆候検知システムの構成例を示す図である。本実施の形態の異常兆候検知システム3cは、学習装置1cと、異常兆候検知装置2cと、を備える。本実施の形態の学習装置1cは、実施の形態3のデータ取得部11a、前処理部13、第1波形解析部14および第1学習データ記憶部17の代わりに、データ取得部11b、前処理部13b、分類部18、位相合わせ部19、第2波形解析部41および第2学習データ記憶部42を備える以外は、実施の形態3の学習装置1bと同様である。本実施の形態の異常兆候検知装置2cは、実施の形態3のデータ取得部21a、前処理部23、第1波形解析部24および第1学習データ記憶部27の代わりに、データ取得部21b、前処理部23b、分類部29、位相合わせ部30、第2波形解析部31および第2学習データ記憶部32を備える以外は、実施の形態3の異常兆候検知装置2bと同様である。 Embodiment 4.
FIG. 14 is a diagram illustrating a configuration example of an abnormality sign detection system according to a fourth embodiment; An abnormalitysign detection system 3c of the present embodiment includes a learning device 1c and an abnormality sign detection device 2c. A learning device 1c of the present embodiment includes a data acquisition unit 11b, a preprocessing The learning device 1b of the third embodiment is the same as the learning device 1b except that it includes a section 13b, a classification section 18, a phase matching section 19, a second waveform analysis section 41, and a second learning data storage section . Instead of the data acquisition unit 21a, the preprocessing unit 23, the first waveform analysis unit 24, and the first learning data storage unit 27 of the third embodiment, the abnormality sign detection device 2c of the present embodiment includes a data acquisition unit 21b, Except for including a preprocessing unit 23b, a classification unit 29, a phase matching unit 30, a second waveform analysis unit 31, and a second learning data storage unit 32, it is the same as the abnormal sign detection device 2b of the third embodiment.
図14は、実施の形態4にかかる異常兆候検知システムの構成例を示す図である。本実施の形態の異常兆候検知システム3cは、学習装置1cと、異常兆候検知装置2cと、を備える。本実施の形態の学習装置1cは、実施の形態3のデータ取得部11a、前処理部13、第1波形解析部14および第1学習データ記憶部17の代わりに、データ取得部11b、前処理部13b、分類部18、位相合わせ部19、第2波形解析部41および第2学習データ記憶部42を備える以外は、実施の形態3の学習装置1bと同様である。本実施の形態の異常兆候検知装置2cは、実施の形態3のデータ取得部21a、前処理部23、第1波形解析部24および第1学習データ記憶部27の代わりに、データ取得部21b、前処理部23b、分類部29、位相合わせ部30、第2波形解析部31および第2学習データ記憶部32を備える以外は、実施の形態3の異常兆候検知装置2bと同様である。 Embodiment 4.
FIG. 14 is a diagram illustrating a configuration example of an abnormality sign detection system according to a fourth embodiment; An abnormality
分類部18、位相合わせ部19、第2波形解析部41、第2学習データ記憶部42、分類部29、位相合わせ部30、第2波形解析部31および第2学習データ記憶部32は、実施の形態2で述べた分類部18、位相合わせ部19、第2波形解析部41、第2学習データ記憶部42、分類部29、位相合わせ部30、第2波形解析部31および第2学習データ記憶部32とそれぞれ同様である。実施の形態2,3と同様の機能を有する構成要素には実施の形態2,3と同一の符号を付して重複する説明を省略する。以下実施の形態2,3と異なる点を主に説明する。
The classification unit 18, the phase matching unit 19, the second waveform analysis unit 41, the second learning data storage unit 42, the classification unit 29, the phase matching unit 30, the second waveform analysis unit 31, and the second learning data storage unit 32 perform The classification unit 18, the phase matching unit 19, the second waveform analysis unit 41, the second learning data storage unit 42, the classification unit 29, the phase matching unit 30, the second waveform analysis unit 31, and the second learning data described in form 2 It is the same as that of the storage unit 32 . Components having functions similar to those of the second and third embodiments are assigned the same reference numerals as those of the second and third embodiments, and duplicate descriptions are omitted. Differences from the second and third embodiments will be mainly described below.
本実施の形態では、実施の形態3で述べた実効値を用いた異常兆候の検知と、実施の形態2で述べた異常兆候波形の学習による異常兆候の検知とを組み合わせる。本実施の形態では、前処理部13bは、N周期前差分処理は行わず、前処理として平滑化処理を行い、前処理後のデータを第2波形解析部41へ出力する。本実施の形態の学習装置1cにおける学習では、実施の形態2の図9に示した処理と実施の形態3の図12に示した処理とがそれぞれ行われる。すなわち、本実施の形態の学習装置1cは、正常なデータである正常データを用いた正常波形学習と、異常兆候のあるデータである異常兆候データを用いた異常兆候波形学習とを行うことにより、学習済データを生成する。本実施の形態では、正常波形学習は、差分解析部43における処理であり、異常兆候波形学習は、異常兆候波形解析部である第2波形解析部41の処理である。
In the present embodiment, detection of signs of abnormality using the effective value described in Embodiment 3 is combined with detection of signs of abnormality by learning of waveforms of signs of abnormality described in Embodiment 2. In the present embodiment, the preprocessing unit 13 b does not perform N-cycle pre-difference processing, but performs smoothing processing as preprocessing, and outputs data after preprocessing to the second waveform analysis unit 41 . In learning by the learning device 1c of the present embodiment, the processing shown in FIG. 9 of the second embodiment and the processing shown in FIG. 12 of the third embodiment are performed. That is, the learning device 1c of the present embodiment performs normal waveform learning using normal data, which is normal data, and abnormal sign waveform learning using abnormal sign data, which is data with an abnormal sign. Generate trained data. In the present embodiment, normal waveform learning is performed by the differential analysis unit 43, and abnormal symptom waveform learning is performed by the second waveform analysis unit 41, which is an abnormal symptom waveform analysis unit.
図15は、本実施の形態の異常兆候検知装置2cにおける推論時の処理手順の一例を示すフローチャートである。なお、本実施の形態では、前処理部23bは、N周期前差分処理は行わず、前処理として平滑化処理を行い、前処理後のデータを第2波形解析部31へ出力する。ステップS51~ステップS53は、実施の形態3と同様である。ステップS53でYesの場合、実施の形態2と同様に、ステップS31~ステップS33,S18が行われる。
FIG. 15 is a flowchart showing an example of a processing procedure during inference in the anomaly sign detection device 2c of the present embodiment. Note that in the present embodiment, the preprocessing unit 23 b does not perform N-cycle pre-difference processing, but performs smoothing processing as preprocessing, and outputs data after preprocessing to the second waveform analysis unit 31 . Steps S51 to S53 are the same as in the third embodiment. If Yes in step S53, steps S31 to S33 and S18 are performed as in the second embodiment.
本実施の形態の学習装置1c、異常兆候検知装置2cも、実施の形態1の学習装置1、異常兆候検知装置2と同様に、例えば、図7に示したコンピュータシステムにより実現される。
The learning device 1c and the sign-of-abnormality detection device 2c of the present embodiment are also realized by, for example, the computer system shown in FIG. 7, like the learning device 1 and the sign-of-abnormality detection device 2 of the first embodiment.
以上述べたように、本実施の形態においては、正常な波形を1階差分値解析により学習し、異常兆候波形を類似波形解析により学習している。すなわち、正常な波形の学習と異常兆候波形の学習とを組み合わせて異常兆候の検知を行っている。これにより、異常兆候の検知精度を高めることができる。
As described above, in the present embodiment, normal waveforms are learned by first-order difference value analysis, and abnormal symptom waveforms are learned by similar waveform analysis. In other words, abnormal signs are detected by combining learning of normal waveforms and learning of abnormal sign waveforms. As a result, it is possible to improve the detection accuracy of the signs of abnormality.
実施の形態5.
図16は、実施の形態5にかかる異常兆候検知システムの構成例を示す図である。本実施の形態の異常兆候検知システム3dは、学習装置1dと、異常兆候検知装置2dと、を備える。本実施の形態の学習装置1dは、実施の形態2の前処理部13および第1波形解析部14の代わりに、前処理部13bおよび第1波形解析部14aを備える以外は、実施の形態2の学習装置1aと同様である。本実施の形態の異常兆候検知装置2dは、第1波形解析部24および第1学習データ記憶部27を削除し、前処理部23の代わりに前処理部23bを備える以外は、実施の形態2の異常兆候検知装置2aと同様である。前処理部13bおよび前処理部23bは実施の形態4と同様である。実施の形態2,4と同様の機能を有する構成要素には実施の形態2,4と同一の符号を付して重複する説明を省略する。以下、実施の形態2,4と異なる点を主に説明する。Embodiment 5.
FIG. 16 is a diagram illustrating a configuration example of an abnormality sign detection system according to a fifth embodiment; An abnormalitysign detection system 3d of the present embodiment includes a learning device 1d and an abnormality sign detection device 2d. The learning apparatus 1d of the present embodiment has a preprocessing unit 13b and a first waveform analysis unit 14a, instead of the preprocessing unit 13 and the first waveform analysis unit 14 of the second embodiment, except that the preprocessing unit 13b and the first waveform analysis unit 14a are provided as in the second embodiment. is the same as that of the learning device 1a. The abnormality sign detection device 2d of the present embodiment is similar to that of Embodiment 2 except that the first waveform analysis unit 24 and the first learning data storage unit 27 are deleted and the preprocessing unit 23b is provided instead of the preprocessing unit 23. is the same as that of the abnormality sign detection device 2a. Pre-processing section 13b and pre-processing section 23b are the same as in the fourth embodiment. Components having functions similar to those of the second and fourth embodiments are denoted by the same reference numerals as those of the second and fourth embodiments, and overlapping descriptions are omitted. Differences from the second and fourth embodiments will be mainly described below.
図16は、実施の形態5にかかる異常兆候検知システムの構成例を示す図である。本実施の形態の異常兆候検知システム3dは、学習装置1dと、異常兆候検知装置2dと、を備える。本実施の形態の学習装置1dは、実施の形態2の前処理部13および第1波形解析部14の代わりに、前処理部13bおよび第1波形解析部14aを備える以外は、実施の形態2の学習装置1aと同様である。本実施の形態の異常兆候検知装置2dは、第1波形解析部24および第1学習データ記憶部27を削除し、前処理部23の代わりに前処理部23bを備える以外は、実施の形態2の異常兆候検知装置2aと同様である。前処理部13bおよび前処理部23bは実施の形態4と同様である。実施の形態2,4と同様の機能を有する構成要素には実施の形態2,4と同一の符号を付して重複する説明を省略する。以下、実施の形態2,4と異なる点を主に説明する。
FIG. 16 is a diagram illustrating a configuration example of an abnormality sign detection system according to a fifth embodiment; An abnormality
本実施の形態では、実施の形態2で述べた異常兆候波形を学習する類似波形解析によって学習することで、異常兆候を検知するが、異常兆候波形を学習する際に、異常兆候波形の選択に、正常波形の類似波形解析の判定結果を用いる。
In this embodiment, an abnormal sign is detected by learning by similar waveform analysis for learning an abnormal sign waveform described in the second embodiment. , the judgment result of the similar waveform analysis of the normal waveform is used.
本実施の形態の第1波形解析部14aは、実施の形態1の第1波形解析部14としての機能と実施の形態1の第1波形解析部24としての機能との両方を有する。第1波形解析部14aは、データ記憶部12に格納された正常データを用いて実施の形態1の第1波形解析部14と同様に、第1波形解析を行うことで第1学習データ記憶部17に正常波形データと正常判定しきい値とを格納する。この学習結果を用いて、異常兆候波形を学習する類似波形解析が行われる。
The first waveform analysis section 14a of the present embodiment has both the function of the first waveform analysis section 14 of the first embodiment and the function of the first waveform analysis section 24 of the first embodiment. The first waveform analysis unit 14a uses the normal data stored in the data storage unit 12 to perform the first waveform analysis in the same manner as the first waveform analysis unit 14 of the first embodiment, thereby performing the first learning data storage unit 17 stores the normal waveform data and the normal determination threshold value. Using this learning result, a similar waveform analysis for learning an abnormal sign waveform is performed.
図17は、本実施の形態の異常兆候波形を学習する類似波形解析の処理手順の一例を示すフローチャートである。図17に示すように、学習装置1dは、異常兆候波形の抽出対象の瞬時値を取得する(ステップS61)。詳細には、データ取得部11が、異常兆候波形の抽出対象となる瞬時値の計測データを取得し、計測データをデータ記憶部22に格納する。なお、計測データは異常兆候波形が含まれると想定される期間の計測データであるが、異常兆候波形が含まれると想定される期間が判明していない場合には、任意の計測データが入力されてもよい。
FIG. 17 is a flow chart showing an example of a similar waveform analysis processing procedure for learning an abnormal symptom waveform according to the present embodiment. As shown in FIG. 17, the learning device 1d acquires an instantaneous value to be extracted from an abnormal sign waveform (step S61). Specifically, the data acquisition unit 11 acquires measurement data of instantaneous values from which abnormal symptom waveforms are extracted, and stores the measurement data in the data storage unit 22 . Although the measurement data is the measurement data of the period assumed to include the abnormal symptom waveform, if the period assumed to include the abnormal symptom waveform is not known, arbitrary measurement data is input. may
次に、学習装置1dは、平滑化処理を行う(ステップS62)。詳細には、前処理部13bがデータ記憶部22に格納された計測データに対して平滑化処理を実施し、処理後のデータを第1波形解析部14aへ出力する。
Next, the learning device 1d performs smoothing processing (step S62). Specifically, the preprocessing unit 13b performs smoothing processing on the measurement data stored in the data storage unit 22, and outputs the processed data to the first waveform analysis unit 14a.
次に、学習装置1dは、第1波形解析(類似波形解析)を行う(ステップS63)。詳細には、第1波形解析部14aが、平滑化処理後の計測データを単位区間データに区分し、単位区間データごとに、第1学習データ記憶部17に記憶されている正常波形データのそれぞれとの距離を第1学習データ記憶部17に記憶されている正常判定しきい値と比較することで、単位区間データに異常兆候があるか否かを判定する。
Next, the learning device 1d performs first waveform analysis (similar waveform analysis) (step S63). Specifically, the first waveform analysis unit 14a divides the smoothed measurement data into unit interval data, and normal waveform data stored in the first learning data storage unit 17 for each unit interval data. is compared with the normality determination threshold value stored in the first learning data storage unit 17 to determine whether or not there is an abnormality sign in the unit interval data.
次に、学習装置1dは、異常兆候波形候補を抽出する(ステップS64)。詳細には、第1波形解析部14aは、異常兆候があると判定した単位区間データを異常兆候波形候補として抽出し、分類部18へ出力する。その後は、実施の形態2と同様に、ステップS22~ステップS24が行われる。
Next, the learning device 1d extracts an abnormality sign waveform candidate (step S64). Specifically, the first waveform analysis unit 14 a extracts the unit interval data determined to have an abnormality symptom as an abnormality symptom waveform candidate, and outputs it to the classification unit 18 . After that, steps S22 to S24 are performed in the same manner as in the second embodiment.
本実施の形態の異常兆候検知装置2dは、実施の形態2で述べたステップS12、ステップS31~ステップS33,S18を実施する。以上のように、第1波形解析部14aは、正常なデータである正常データを用いて、類似波形解析によって、正常波形と正常であると判定するための正常判定しきい値とを正常学習データとして生成し、異常兆候のある波形を含むデータである検知対象データと正常学習データとを用いて検知対象データから異常兆候のあるデータの候補となる候補データを抽出する。そして、第2波形解析部41は、候補データを用いて、類似波形解析によって、異常兆候波形と異常兆候があるか否かの判定に用いられる異常兆候判定しきい値とを学習済データとして生成する。このように、本実施の形態の学習装置1dは、正常なデータである正常データを用いた正常波形学習と、異常兆候のあるデータである異常兆候データを用いた異常兆候波形学習とを行うことにより学習済データを生成する。正常波形学習は、正常波形解析部である第1波形解析部14aによる処理であり、異常兆候波形学習は、異常兆候波形解析部である第2波形解析部41の処理である。
The abnormality sign detection device 2d of the present embodiment performs steps S12 and S31 to S33 and S18 described in the second embodiment. As described above, the first waveform analysis unit 14a performs similar waveform analysis using normal data, which is normal data, to determine a normal waveform and a normal judgment threshold value for judging that the waveform is normal. and extracts candidate data that is a candidate for data with an abnormal sign from the detection target data using the detection target data, which is data containing a waveform with an abnormal sign, and the normal learning data. Then, using the candidate data, the second waveform analysis unit 41 generates, as learned data, an abnormal sign waveform and an abnormal sign judgment threshold value used for judging whether or not there is an abnormal sign by similar waveform analysis. do. Thus, the learning device 1d of the present embodiment performs normal waveform learning using normal data, which is normal data, and abnormal sign waveform learning using abnormal sign data, which is data with abnormal signs. Generate learned data by Normal waveform learning is processing by the first waveform analysis unit 14a, which is the normal waveform analysis unit, and abnormal sign waveform learning is processing by the second waveform analysis unit 41, which is the abnormal sign waveform analysis unit.
本実施の形態の学習装置1d、異常兆候検知装置2dも、実施の形態1の学習装置1、異常兆候検知装置2と同様に、例えば、図7に示したコンピュータシステムにより実現される。
The learning device 1d and the sign-of-abnormality detection device 2d of the present embodiment are also realized by, for example, the computer system shown in FIG. 7, like the learning device 1 and the sign-of-abnormality detection device 2 of the first embodiment.
以上のように、本実施の形態では、正常波形の類似波形解析による異常兆候の検知結果を用いて、異常兆候波形の候補を決定し、決定した候補を用いて異常兆候波形の類似波形解析の学習を実施する。このように、本実施の形態においても正常な波形の学習と、異常兆候波形の学習とを組み合わせている。これにより、異常兆候の検知精度を高めることができる。
As described above, in the present embodiment, candidates for abnormal sign waveforms are determined using the results of detection of abnormal signs by similar waveform analysis of normal waveforms, and similar waveform analysis of abnormal sign waveforms is performed using the determined candidates. Carry out learning. Thus, in this embodiment as well, learning of normal waveforms and learning of abnormal sign waveforms are combined. As a result, it is possible to improve the detection accuracy of the signs of abnormality.
以上の実施の形態に示した構成は、一例を示すものであり、別の公知の技術と組み合わせることも可能であるし、実施の形態同士を組み合わせることも可能であるし、要旨を逸脱しない範囲で、構成の一部を省略、変更することも可能である。
The configurations shown in the above embodiments are only examples, and can be combined with other known techniques, or can be combined with other embodiments, without departing from the scope of the invention. It is also possible to omit or change part of the configuration.
1,1a,1b,1c,1d 学習装置、2,2a,2b,2c,2d 異常兆候検知装置、3,3a,3b,3c,3d 異常兆候検知システム、4 開閉器、11,11a,11b,21,21a,21b データ取得部、12,22 データ記憶部、13,13a,13b,23,23a,23b 前処理部、14,14a,24 第1波形解析部、15 除去波形抽出部、16,26 除去波形記憶部、17,27 第1学習データ記憶部、18,29 分類部、19 位相合わせ部、25 過検知除去部、28 検知結果出力部、31,41 第2波形解析部、32,42 第2学習データ記憶部、33,43 差分解析部、34,44 第3学習データ記憶部。
1, 1a, 1b, 1c, 1d Learning device 2, 2a, 2b, 2c, 2d Abnormal sign detection device 3, 3a, 3b, 3c, 3d Abnormal sign detection system 4 Switch 11, 11a, 11b, 21, 21a, 21b data acquisition unit, 12, 22 data storage unit, 13, 13a, 13b, 23, 23a, 23b preprocessing unit, 14, 14a, 24 first waveform analysis unit, 15 removed waveform extraction unit, 16, 26 removed waveform storage unit, 17, 27 first learning data storage unit, 18, 29 classification unit, 19 phase matching unit, 25 overdetection removal unit, 28 detection result output unit, 31, 41 second waveform analysis unit, 32, 42 Second learning data storage unit, 33, 43 difference analysis unit, 34, 44 third learning data storage unit.
Claims (19)
- 異常兆候の検知に用いられる学習済データを生成する学習装置であって、
定められた時間長を1周期とし、Nを2以上の整数とするとき、正常なデータである正常データの1周期分の各点の値から、1周期前からN周期前までの前記正常データの周期内の対応する各点の平均値をそれぞれ減じたN周期前差分値を算出する前処理部と、
前記N周期前差分値を用いて、類似波形解析によって、正常波形と正常であるか否かの判定に用いられる正常判定しきい値とを前記学習済データとして生成する第1波形解析部と、
を備えることを特徴とする学習装置。 A learning device that generates learned data used for detecting abnormal signs,
When a predetermined time length is one cycle and N is an integer of 2 or more, the normal data from one cycle before to N cycles before from the value of each point for one cycle of the normal data which is normal data. A preprocessing unit that calculates the difference value before N cycles by subtracting the average value of each corresponding point in the cycle of
a first waveform analysis unit that generates, as the learned data, a normal waveform and a normality determination threshold value used for determining whether the waveform is normal or not by similar waveform analysis using the difference value before N cycles;
A learning device comprising: - 前記前処理部は、前記正常データに一次遅れフィルタによる平滑化処理を行い、平滑化処理後の前記正常データを用いて前記N周期前差分値を算出することを特徴とする請求項1に記載の学習装置。 2. The preprocessing unit according to claim 1, wherein the normal data is smoothed by a first-order lag filter, and the smoothed normal data is used to calculate the difference value before N cycles. learning device.
- 異常兆候のあるデータである異常兆候データを用いて、類似波形解析によって、異常兆候波形と異常兆候があるか否かの判定に用いられる異常兆候判定しきい値とを前記学習済データとしてさらに生成する第2波形解析部、
を備えることを特徴とする請求項1または2に記載の学習装置。 Further generating, as the learned data, an abnormal sign waveform and an abnormal sign determination threshold used for determining whether or not there is an abnormal sign, by similar waveform analysis using the abnormal sign data, which is data having an abnormal sign. a second waveform analysis unit for
3. The learning device according to claim 1 or 2, comprising: - 前記正常データは、電圧および電流のうち少なくとも一方である計測対象の瞬時値の計測データであり、
正常な前記計測対象の実効値の計測データの1階差分値を算出し、算出した1階差分値を用いて正常であるか否かを判定するためのしきい値を前記学習済データとしてさらに生成する差分解析部、
を備えることを特徴とする請求項1または2に記載の学習装置。 The normal data is measurement data of an instantaneous value to be measured, which is at least one of voltage and current,
Further calculating a first-order difference value of normal measurement data of the effective value of the measurement object, and using the calculated first-order difference value to determine whether or not it is normal, as the learned data. a differential analysis unit to generate,
3. The learning device according to claim 1 or 2, comprising: - 異常兆候の検知に用いられる学習済データを生成する学習装置であって、
正常なデータである正常データを用いた正常波形学習と、異常兆候のあるデータである異常兆候データを用いた異常兆候波形学習とを行うことにより、前記学習済データを生成することを特徴とする学習装置。 A learning device that generates learned data used for detecting abnormal signs,
The learned data is generated by performing normal waveform learning using normal data that is normal data and abnormal sign waveform learning using abnormal sign data that is data with abnormal signs. learning device. - 前記正常波形学習を行う差分解析部と、
前記異常兆候波形学習を行う異常兆候波形解析部と、
を備え、
前記差分解析部は、電圧および電流のうち少なくとも一方である計測対象の実効値の計測データの1階差分値を算出し、算出した1階差分値を用いて正常であると判定するためのしきい値を前記学習済データとして学習し、
前記異常兆候波形解析部は、前記計測対象の異常兆候のある瞬時値の計測データである異常兆候データを用いて、類似波形解析によって、異常兆候波形と異常兆候があるか否かの判定に用いられる異常兆候判定しきい値とを前記学習済データとして生成することを特徴とする請求項5に記載の学習装置。 a difference analysis unit that performs the normal waveform learning;
an abnormality sign waveform analysis unit that performs the abnormality sign waveform learning;
with
The difference analysis unit calculates a first-order difference value of the measurement data of the effective value of the measurement target, which is at least one of the voltage and the current, and uses the calculated first-order difference value to determine that it is normal. learning a threshold value as the learned data;
The abnormal sign waveform analysis unit uses abnormal sign data, which is measurement data of instantaneous values with abnormal signs of the measurement target, to determine whether or not there is an abnormal sign waveform and an abnormal sign by similar waveform analysis. 6. The learning device according to claim 5, wherein the learned data is generated as the learned data. - 前記正常波形学習を行う正常波形解析部と、
前記異常兆候波形学習を行う異常兆候波形解析部と、
を備え、
前記正常波形解析部は、正常なデータである正常データを用いて、類似波形解析によって、正常波形と正常であると判定するための正常判定しきい値とを正常学習データとして生成し、異常兆候のある波形を含むデータである検知対象データと前記正常学習データとを用いて前記検知対象データから異常兆候のあるデータの候補となる候補データを抽出し、
前記異常兆候波形解析部は、前記候補データを用いて、類似波形解析によって、異常兆候波形と異常兆候があるか否かの判定に用いられる異常兆候判定しきい値とを前記学習済データとして生成することを特徴とする請求項5に記載の学習装置。 a normal waveform analysis unit that performs the normal waveform learning;
an abnormality sign waveform analysis unit that performs the abnormality sign waveform learning;
with
The normal waveform analysis unit uses normal data, which is normal data, to generate a normal waveform and a normal judgment threshold value for judging normality as normal learning data by similar waveform analysis, and Extracting candidate data that is a candidate for data with an abnormal sign from the detection target data using the detection target data that is data containing a certain waveform and the normal learning data,
The abnormal sign waveform analysis unit generates, as the learned data, an abnormal sign waveform and an abnormal sign judgment threshold value used for judging whether or not there is an abnormal sign by similar waveform analysis using the candidate data. 6. The learning device according to claim 5, wherein: - 配電系統を区分する開閉器を制御する子局において計測される前記配電系統の零相電圧および零相電流のうちの少なくとも一方の計測データに対して前記学習済データを用いた前記異常兆候の検知が行われることを特徴とする請求項1から7のいずれか1つに記載の学習装置。 Detection of the sign of abnormality using the learned data for measurement data of at least one of a zero-phase voltage and a zero-phase current of the distribution system measured by a slave station that controls a switch that divides the distribution system. 8. The learning device according to any one of claims 1 to 7, wherein:
- 学習済データを用いて異常兆候の検知を行う異常兆候検知装置であって、
定められた時間長を1周期とし、Nを2以上の整数とするとき、異常兆候の検知対象のデータである検知対象データの1周期分の各点の値から、1周期前からN周期前までの前記検知対象データの周期内の対応する各点の平均値をそれぞれ減じたN周期前差分値を算出する前処理部と、
前記N周期前差分値と前記学習済データとを用いて、類似波形解析によって、異常兆候があるか否かを判定する第1波形解析部と、
を備え、
前記学習済データは、正常なデータである正常データのN周期前差分値を用いて類似波形解析によって生成された正常波形と正常であると判定するための正常判定しきい値とを含むことを特徴とする異常兆候検知装置。 An abnormality sign detection device that detects an abnormality sign using learned data,
When a predetermined time length is defined as one cycle and N is an integer of 2 or more, the value of each point for one cycle of the detection target data, which is the data to be detected for abnormal signs, is calculated from one cycle to N cycles before. A preprocessing unit that calculates a difference value before N cycles by subtracting the average value of each corresponding point in the cycle of the detection target data up to
a first waveform analysis unit that determines whether or not there is an abnormality sign by similar waveform analysis using the difference value before N cycles and the learned data;
with
The learned data includes a normal waveform generated by similar waveform analysis using a differential value of N cycles before normal data, which is normal data, and a normal judgment threshold value for judging normality. Abnormal symptom detection device characterized by: - 第2波形解析部、
を備え、
前記学習済データは、異常兆候のあるデータである異常兆候データを用いて類似波形解析によって生成された異常兆候波形と異常兆候があるか否かの判定に用いられる異常兆候判定しきい値とを含み、
前記第2波形解析部は、前記第1波形解析部によって異常兆候があると判定された場合に、前記検知対象データと前記異常兆候波形と前記異常兆候判定しきい値とを用いて、異常兆候があるか否かを判定することを特徴とする請求項9に記載の異常兆候検知装置。 a second waveform analysis unit,
with
The learned data includes an abnormal sign waveform generated by similar waveform analysis using abnormal sign data, which is data having an abnormal sign, and an abnormal sign determination threshold value used to determine whether or not there is an abnormal sign. including
When the first waveform analysis unit determines that there is an abnormal sign, the second waveform analysis unit uses the detection target data, the abnormal sign waveform, and the abnormal sign judgment threshold to determine the abnormal sign 10. The abnormality sign detection device according to claim 9, wherein it is determined whether or not there is a - 差分解析部、
を備え、
前記正常データは、電圧および電流のうち少なくとも一方である計測対象の瞬時値の計測データであり、
前記学習済データは、正常な前記計測対象の実効値の計測データの1階差分値を用いて算出された、正常であるか否かを判定するためのしきい値を含み、
前記差分解析部は、前記計測対象の検知対象の実効値の計測データの1階差分値を算出し、算出した1階差分値と前記しきい値とを用いて、異常兆候があるか否かを判定し、
前記第1波形解析部は、前記差分解析部によって異常兆候があると判定された場合に、前記N周期前差分値と前記正常波形と前記正常判定しきい値とを用いて、類似波形解析によって、異常兆候があるか否かを判定することを特徴とする請求項9に記載の異常兆候検知装置。 difference analysis unit,
with
The normal data is measurement data of an instantaneous value to be measured, which is at least one of voltage and current,
The learned data includes a threshold value for determining whether it is normal, which is calculated using the first-order difference value of the normal measurement data of the effective value of the measurement target,
The difference analysis unit calculates a first-order difference value of the measurement data of the effective value of the detection target of the measurement object, and uses the calculated first-order difference value and the threshold value to determine whether there is an abnormality sign. to determine
When the difference analysis unit determines that there is an abnormal symptom, the first waveform analysis unit performs similar waveform analysis using the difference value before N cycles, the normal waveform, and the normal determination threshold value. 10. The abnormality sign detection device according to claim 9, wherein it is determined whether or not there is an abnormality sign. - 学習済データを用いて異常兆候の検知を行う異常兆候検知装置であって、
電圧および電流のうち少なくとも一方である計測対象の実効値の計測データの1階差分値を算出し、算出した1階差分値としきい値とを用いて、異常兆候があるか否かを判定する差分解析部と、
前記差分解析部によって異常兆候があると判定された場合に、前記計測対象の瞬時値の計測データと異常兆候波形と異常兆候判定しきい値とを用いて、異常兆候があるか否かを判定する異常兆候波形解析部と、
を備え、
前記しきい値は、正常な前記計測対象の実効値の計測データの1階差分値を算出された前記学習済データであり、
前記異常兆候波形および前記異常兆候判定しきい値は、異常兆候のある前記計測対象の瞬時値の計測データである異常兆候データを用いて類似波形解析によって生成された前記学習済データであることを特徴とする異常兆候検知装置。 An abnormality sign detection device that detects an abnormality sign using learned data,
Calculate a first-order difference value of measurement data of the effective value of the object to be measured, which is at least one of voltage and current, and use the calculated first-order difference value and a threshold value to determine whether or not there is an abnormality sign. a differential analysis unit;
If the difference analysis unit determines that there is an abnormal sign, it is determined whether or not there is an abnormal sign using the measurement data of the instantaneous value of the measurement target, the abnormal sign waveform, and the abnormal sign determination threshold value. an abnormal sign waveform analysis unit for
with
The threshold value is the learned data obtained by calculating the first-order difference value of the normal measurement data of the effective value of the measurement object,
The abnormal sign waveform and the abnormal sign determination threshold are the learned data generated by similar waveform analysis using abnormal sign data, which is measurement data of instantaneous values of the measurement object with an abnormal sign. Abnormal symptom detection device characterized by: - 配電系統を区分する開閉器を制御する子局であり、前記配電系統の零相電圧および零相電流のうちの少なくとも一方の計測データに対して前記学習済データを用いた前記異常兆候の検知を行うことを特徴とする請求項9から12のいずれか1つに記載の異常兆候検知装置。 A slave station that controls a switch that divides a distribution system, and detects the sign of abnormality using the learned data for measurement data of at least one of zero-phase voltage and zero-phase current of the distribution system. 13. The abnormality sign detection device according to any one of claims 9 to 12, characterized in that:
- 異常兆候の検知に用いられる学習済データを生成する学習装置と、
前記学習済データを用いて異常兆候を検知する異常兆候検知装置と、
を備え、
前記学習装置は、
定められた時間長を1周期とし、Nを2以上の整数とするとき、正常なデータである正常データの1周期分の各点の値から、1周期前からN周期前までの前記正常データの周期内の対応する各点の平均値をそれぞれ減じたN周期前差分値を算出する前処理部と、
前記N周期前差分値を用いて、類似波形解析によって、正常波形と正常であるか否かの判定に用いられる正常判定しきい値とを前記学習済データとして生成する第1波形解析部と、
を備え、
前記異常兆候検知装置は、
異常兆候の検知対象のデータである検知対象データの1周期分の各点の値から、1周期前からN周期前までの前記検知対象データの周期内の対応する各点の平均値をそれぞれ減じたN周期前差分値を算出する前処理部と、
前記異常兆候検知装置の前記前処理部によって算出された前記N周期前差分値と前記学習済データとを用いて、類似波形解析によって、異常兆候があるか否かを判定する第1波形解析部と、
を備えることを特徴とする異常兆候検知システム。 a learning device that generates learned data used for detecting signs of abnormality;
an abnormality sign detection device that detects an abnormality sign using the learned data;
with
The learning device
When a predetermined time length is one cycle and N is an integer of 2 or more, the normal data from one cycle before to N cycles before from the value of each point for one cycle of the normal data which is normal data. A preprocessing unit that calculates the difference value before N cycles by subtracting the average value of each corresponding point in the cycle of
a first waveform analysis unit that generates, as the learned data, a normal waveform and a normality determination threshold value used for determining whether the waveform is normal or not by similar waveform analysis using the difference value before N cycles;
with
The abnormal sign detection device is
Subtracting the average value of each corresponding point within the cycle of the detection target data from 1 cycle to N cycles before from the value of each point of the detection target data, which is data to be detected for signs of abnormality, for one cycle. a preprocessing unit that calculates the difference value before N cycles;
A first waveform analysis unit that determines whether or not there is an abnormality sign by similar waveform analysis using the N-cycle previous difference value calculated by the preprocessing unit of the abnormality sign detection device and the learned data. and,
An anomaly sign detection system comprising: - 異常兆候の検知に用いられる学習済データを生成する学習装置と、
前記学習済データを用いて異常兆候を検知する異常兆候検知装置と、
を備え、
前記学習装置は、正常なデータである正常データを用いた正常波形学習と、異常兆候のあるデータである異常兆候データを用いた異常兆候波形学習とを行うことにより、前記学習済データを生成することを特徴とする異常兆候検知システム。 a learning device that generates learned data used for detecting signs of abnormality;
an abnormality sign detection device that detects an abnormality sign using the learned data;
with
The learning device generates the learned data by performing normal waveform learning using normal data that is normal data and abnormal sign waveform learning using abnormal sign data that is data with abnormal signs. An anomaly sign detection system characterized by: - 異常兆候の検知に用いられる学習済データを生成する学習装置における学習方法であって、
定められた時間長を1周期とし、Nを2以上の整数とするとき、正常なデータである正常データの1周期分の各点の値から、1周期前からN周期前までの前記正常データの周期内の対応する各点の平均値をそれぞれ減じたN周期前差分値を算出するステップと、
前記N周期前差分値を用いて、類似波形解析によって、正常波形と正常であるか否かの判定に用いられる正常判定しきい値とを前記学習済データとして生成するステップと、
を含むことを特徴とする学習方法。 A learning method in a learning device that generates learned data used for detecting abnormal signs,
When a predetermined time length is one cycle and N is an integer of 2 or more, the normal data from one cycle before to N cycles before from the value of each point for one cycle of the normal data which is normal data. A step of calculating a difference value before N cycles by subtracting the average value of each corresponding point in the cycle of
a step of generating, as the learned data, a normal waveform and a normality determination threshold value used for determining whether the waveform is normal or not by similar waveform analysis using the difference value before N cycles;
A learning method comprising: - 異常兆候の検知に用いられる学習済データを生成する学習装置における学習方法であって、
正常なデータである正常データを用いた正常波形学習を行うステップと、
異常兆候のあるデータである異常兆候データを用いた異常兆候波形学習を行うステップと、を含み、
前記学習済データは、前記正常波形学習および前記異常兆候波形学習によって生成されることを特徴とする学習方法。 A learning method in a learning device that generates learned data used for detecting abnormal signs,
a step of performing normal waveform learning using normal data, which is normal data;
performing abnormal sign waveform learning using abnormal sign data that is data with abnormal signs,
The learning method, wherein the learned data is generated by the normal waveform learning and the abnormal sign waveform learning. - 異常兆候の検知に用いられる学習済データを生成するコンピュータシステムに、
定められた時間長を1周期とし、Nを2以上の整数とするとき、正常なデータである正常データの1周期分の各点の値から、1周期前からN周期前までの前記正常データの周期内の対応する各点の平均値をそれぞれ減じたN周期前差分値を算出するステップと、
前記N周期前差分値を用いて、類似波形解析によって、正常波形と正常であるか否かの判定に用いられる正常判定しきい値とを前記学習済データとして生成するステップと、
を実行させることを特徴とするプログラム。 A computer system that generates learned data used for detecting abnormal signs,
When a predetermined time length is one cycle and N is an integer of 2 or more, the normal data from one cycle before to N cycles before from the value of each point for one cycle of the normal data which is normal data. A step of calculating a difference value before N cycles by subtracting the average value of each corresponding point in the cycle of
a step of generating, as the learned data, a normal waveform and a normality determination threshold value used for determining whether the waveform is normal or not by similar waveform analysis using the difference value before N cycles;
A program characterized by causing the execution of - 異常兆候の検知に用いられる学習済データを生成するコンピュータシステムに、
正常なデータである正常データを用いた正常波形学習を行うステップと、
異常兆候のあるデータである異常兆候データを用いた異常兆候波形学習を行うステップと、
を実行させ、
前記学習済データは、前記正常波形学習および前記異常兆候波形学習によって生成されることを特徴とするプログラム。 A computer system that generates learned data used for detecting abnormal signs,
a step of performing normal waveform learning using normal data, which is normal data;
a step of performing abnormal sign waveform learning using abnormal sign data that is data with an abnormal sign;
and
The program, wherein the learned data is generated by the normal waveform learning and the abnormal symptom waveform learning.
Priority Applications (5)
| Application Number | Priority Date | Filing Date | Title |
|---|---|---|---|
| PCT/JP2021/043847 WO2023100243A1 (en) | 2021-11-30 | 2021-11-30 | Learning device, abnormality sign detection device, abnormality sign detection system, learning method, and program |
| JP2022549925A JP7278499B1 (en) | 2021-11-30 | 2021-11-30 | LEARNING DEVICE, ANORMAL SIGNS DETECTION DEVICE, ANORMAL SIGNS DETECTION SYSTEM, LEARNING METHOD AND PROGRAM |
| TW111144576A TWI823684B (en) | 2021-11-30 | 2022-11-22 | Learning device, abnormal sign detection device, abnormal sign detection system, learning method and recording medium |
| TW112134061A TW202401308A (en) | 2021-11-30 | 2022-11-22 | Learning device, abnormal sign detection device, abnormal sign detection system, learning method and recording medium |
| JP2023073761A JP2023109769A (en) | 2021-11-30 | 2023-04-27 | Learning device, abnormal sign detection device, abnormal sign detection system, learning method, and program |
Applications Claiming Priority (1)
| Application Number | Priority Date | Filing Date | Title |
|---|---|---|---|
| PCT/JP2021/043847 WO2023100243A1 (en) | 2021-11-30 | 2021-11-30 | Learning device, abnormality sign detection device, abnormality sign detection system, learning method, and program |
Publications (1)
| Publication Number | Publication Date |
|---|---|
| WO2023100243A1 true WO2023100243A1 (en) | 2023-06-08 |
Family
ID=86382593
Family Applications (1)
| Application Number | Title | Priority Date | Filing Date |
|---|---|---|---|
| PCT/JP2021/043847 WO2023100243A1 (en) | 2021-11-30 | 2021-11-30 | Learning device, abnormality sign detection device, abnormality sign detection system, learning method, and program |
Country Status (3)
| Country | Link |
|---|---|
| JP (2) | JP7278499B1 (en) |
| TW (2) | TWI823684B (en) |
| WO (1) | WO2023100243A1 (en) |
Citations (3)
| Publication number | Priority date | Publication date | Assignee | Title |
|---|---|---|---|---|
| JPH05163993A (en) * | 1991-12-10 | 1993-06-29 | Japan Electron Control Syst Co Ltd | Detecting device for generation of blow-by gas and diagnostic device for abnormality of fuel supply system in internal combustion engine |
| JP2013133799A (en) * | 2011-12-27 | 2013-07-08 | Denso Corp | Engine control device |
| US20190362245A1 (en) * | 2018-05-24 | 2019-11-28 | International Business Machines Corporation | Anomaly detection |
Family Cites Families (3)
| Publication number | Priority date | Publication date | Assignee | Title |
|---|---|---|---|---|
| CN110215202A (en) * | 2019-05-14 | 2019-09-10 | 杭州电子科技大学 | The pre- measuring/correlation method in Cardiac RR interval based on gait nonlinear characteristic |
| CN112199252A (en) * | 2020-09-30 | 2021-01-08 | 中国民航信息网络股份有限公司 | Abnormity monitoring method and device and electronic equipment |
| CN113095355B (en) * | 2021-03-03 | 2022-08-23 | 上海工程技术大学 | Rolling bearing fault diagnosis method for optimizing random forest by improved differential evolution algorithm |
-
2021
- 2021-11-30 WO PCT/JP2021/043847 patent/WO2023100243A1/en active Application Filing
- 2021-11-30 JP JP2022549925A patent/JP7278499B1/en active Active
-
2022
- 2022-11-22 TW TW111144576A patent/TWI823684B/en active
- 2022-11-22 TW TW112134061A patent/TW202401308A/en unknown
-
2023
- 2023-04-27 JP JP2023073761A patent/JP2023109769A/en active Pending
Patent Citations (3)
| Publication number | Priority date | Publication date | Assignee | Title |
|---|---|---|---|---|
| JPH05163993A (en) * | 1991-12-10 | 1993-06-29 | Japan Electron Control Syst Co Ltd | Detecting device for generation of blow-by gas and diagnostic device for abnormality of fuel supply system in internal combustion engine |
| JP2013133799A (en) * | 2011-12-27 | 2013-07-08 | Denso Corp | Engine control device |
| US20190362245A1 (en) * | 2018-05-24 | 2019-11-28 | International Business Machines Corporation | Anomaly detection |
Also Published As
| Publication number | Publication date |
|---|---|
| TWI823684B (en) | 2023-11-21 |
| TW202401308A (en) | 2024-01-01 |
| TW202324225A (en) | 2023-06-16 |
| JP2023109769A (en) | 2023-08-08 |
| JP7278499B1 (en) | 2023-05-19 |
| JPWO2023100243A1 (en) | 2023-06-08 |
Similar Documents
| Publication | Publication Date | Title |
|---|---|---|
| CN111459700B (en) | Equipment fault diagnosis method, diagnosis device, diagnosis equipment and storage medium | |
| CN102016607B (en) | Method and apparatus for analyzing waveform signals of a power system | |
| CN110458248B (en) | Transformer abnormal state detection method based on multi-point vibration signals | |
| CN105203936A (en) | Method for determining power cable partial discharge defect type based on spectral analysis | |
| CN110222765B (en) | Method and system for monitoring health state of permanent magnet synchronous motor | |
| CN112036505A (en) | Method and device for determining equipment state of turnout switch machine and electronic equipment | |
| CN115128345B (en) | Power grid safety early warning method and system based on harmonic monitoring | |
| KR20210046356A (en) | Diagnosis apparatus of partial discharge | |
| US20140058615A1 (en) | Fleet anomaly detection system and method | |
| CN109255201B (en) | SOM-MQE-based ball screw pair health assessment method | |
| CN103999316A (en) | Method for generating a signal indicating an oscillation in an electrical energy supply network | |
| CN107147143B (en) | Method for establishing early warning model of fan interlocking off-line fault | |
| JP7278499B1 (en) | LEARNING DEVICE, ANORMAL SIGNS DETECTION DEVICE, ANORMAL SIGNS DETECTION SYSTEM, LEARNING METHOD AND PROGRAM | |
| US20230351158A1 (en) | Apparatus, system and method for detecting anomalies in a grid | |
| JP7062505B2 (en) | Equipment management support system | |
| KR20210059322A (en) | Partial discharge position estimation appratus and method | |
| CN116596301A (en) | Cable multi-state variable evaluation model design method and device based on zero-order learning method | |
| KR20230104526A (en) | Partial Discharge Monitoring System And Partial Discharge Monitoring Method | |
| KR102216513B1 (en) | Methods and Apparatus for Motor Deterioration Detection by Real-Time Motor Current Analysis | |
| CN112731208B (en) | Low-voltage line fault and abnormity on-line monitoring method, equipment and medium | |
| JP4497412B2 (en) | Accident cause determination method and apparatus for transmission and distribution lines | |
| KR20210077496A (en) | Equipment failure prediction system having multi-channel sensors for receiving acoustic signals in the ultrasonic band | |
| CN117668751B (en) | High-low voltage power system fault diagnosis method and device | |
| EP3457609A1 (en) | System and method for computing of anomalies based on frequency driven transformation and computing of new features based on point anomaly density | |
| de Andrade et al. | Power quality disturbances segmentation based on wavelet decomposition and adaptive thresholds |
Legal Events
| Date | Code | Title | Description |
|---|---|---|---|
| WWE | Wipo information: entry into national phase |
Ref document number: 2022549925 Country of ref document: JP |
|
| 121 | Ep: the epo has been informed by wipo that ep was designated in this application |
Ref document number: 21966329 Country of ref document: EP Kind code of ref document: A1 |