WO2023089773A1 - 異常診断装置、異常診断システム、及び記憶媒体 - Google Patents
異常診断装置、異常診断システム、及び記憶媒体 Download PDFInfo
- Publication number
- WO2023089773A1 WO2023089773A1 PCT/JP2021/042610 JP2021042610W WO2023089773A1 WO 2023089773 A1 WO2023089773 A1 WO 2023089773A1 JP 2021042610 W JP2021042610 W JP 2021042610W WO 2023089773 A1 WO2023089773 A1 WO 2023089773A1
- Authority
- WO
- WIPO (PCT)
- Prior art keywords
- anomaly
- abnormality
- analysis
- detection
- data
- Prior art date
- Legal status (The legal status is an assumption and is not a legal conclusion. Google has not performed a legal analysis and makes no representation as to the accuracy of the status listed.)
- Ceased
Links
Images

Classifications
-
- G—PHYSICS
- G05—CONTROLLING; REGULATING
- G05B—CONTROL OR REGULATING SYSTEMS IN GENERAL; FUNCTIONAL ELEMENTS OF SUCH SYSTEMS; MONITORING OR TESTING ARRANGEMENTS FOR SUCH SYSTEMS OR ELEMENTS
- G05B23/00—Testing or monitoring of control systems or parts thereof
- G05B23/02—Electric testing or monitoring
-
- G—PHYSICS
- G05—CONTROLLING; REGULATING
- G05B—CONTROL OR REGULATING SYSTEMS IN GENERAL; FUNCTIONAL ELEMENTS OF SUCH SYSTEMS; MONITORING OR TESTING ARRANGEMENTS FOR SUCH SYSTEMS OR ELEMENTS
- G05B19/00—Program-control systems
- G05B19/02—Program-control systems electric
- G05B19/418—Total factory control, i.e. centrally controlling a plurality of machines, e.g. direct or distributed numerical control [DNC], flexible manufacturing systems [FMS], integrated manufacturing systems [IMS] or computer integrated manufacturing [CIM]
- G05B19/4184—Total factory control, i.e. centrally controlling a plurality of machines, e.g. direct or distributed numerical control [DNC], flexible manufacturing systems [FMS], integrated manufacturing systems [IMS] or computer integrated manufacturing [CIM] characterised by fault tolerance, reliability of production system
Definitions
- the present invention relates to an abnormality diagnosis device, an abnormality diagnosis system, and a storage medium.
- an abnormality factor identification device that identifies the cause of an abnormality that occurs in a machine
- sensor signals related to the physical state of the machine are acquired, the operating status of the machine is determined based on the information acquired from the machine, and each operating status of the machine is determined.
- Another known technique is to calculate the degree of anomaly of a sensor signal and diagnose the cause of an anomaly of a machine from history data, which is a sequence of the degree of anomaly for each operating situation. For example, see Patent Document 1.
- the abnormality factor identifying device described in Patent Document 1 detects signs of abnormality based on signals from sensors, and identifies the cause of abnormality by isolating signals that can identify that an abnormality has occurred.
- the identification result is stored in the memory, and the abnormal site and abnormal type are diagnosed.
- the computational load and the accuracy of diagnosis are in a conflicting relationship.
- Increasing the accuracy of diagnosis increases the computational load, and in order to reduce the computational load, it is necessary to adjust the accuracy of diagnosis.
- An abnormality diagnosis device that diagnoses an abnormality that occurs in a factory, and includes an abnormality detection data acquisition unit that acquires data used for abnormality detection, and an abnormality detection data acquisition unit that acquires An anomaly detection unit that uses data to detect an anomaly to be diagnosed, an anomaly notification unit that notifies the anomaly detected by the anomaly detection unit, an anomaly analysis data acquisition unit that acquires data used for anomaly analysis, and the anomaly Analyzing candidates for anomaly factors using the data used for the anomaly analysis of the time including the time when the anomaly occurred, or the data used for the anomaly detection and the data used for the anomaly analysis of the time including the time when the anomaly was detected. and an anomaly analysis unit.
- An abnormality diagnosis system is an abnormality diagnosis device that diagnoses an abnormality that occurs in a factory, and includes an abnormality detection data acquisition unit that acquires data used for abnormality detection, and an abnormality detection data acquisition unit that acquires An anomaly detection unit that uses data to detect an anomaly to be diagnosed, an anomaly notification unit that notifies the anomaly detected by the anomaly detection unit, an anomaly analysis data acquisition unit that acquires data used for anomaly analysis, and the anomaly Analyzing candidates for anomaly factors using the data used for the anomaly analysis of the time including the time when the anomaly occurred, or the data used for the anomaly detection and the data used for the anomaly analysis of the time including the time when the anomaly was detected. and an anomaly analysis unit.
- a computer-readable storage medium which is one aspect of the present disclosure, is executed by one or more processors to acquire data used for detecting an abnormality that occurs in a factory, and use the data used for detecting an abnormality. Then, based on the model used for abnormality detection, an abnormality to be diagnosed is detected, the detected abnormality is notified, data used for abnormality analysis is acquired, and data used for the abnormality analysis during the time including the time when the abnormality occurred. Alternatively, it stores computer-readable instructions for analyzing candidate causes of anomalies using the data used for the anomaly detection and the data used for the anomaly analysis at a time including the time when the anomaly was detected.
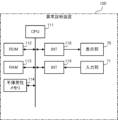
- FIG. 2 is a hardware configuration diagram of an abnormality diagnosis device
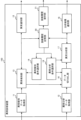
- FIG. 1 is a block diagram of an abnormality diagnosis device of the first disclosure
- FIG. It is an example of an abnormality detection condition selection screen. It is a figure which shows the difference of the number of data of precision emphasis and speed emphasis.
- It is an example of an abnormality notification screen. It is a figure explaining an example of cut-out of the data for anomaly detection. It is a figure explaining an example of the extraction of the data for abnormality analysis. It is an example of the display screen of an analysis result. It is an example of an abnormality analysis condition selection screen. It is a flow chart explaining the operation of the abnormality diagnosis device.
- FIG. 12 is a diagram showing the abnormality diagnosis system of the second disclosure;
- the anomaly diagnosis device 100 detects and diagnoses anomalies in factories, machines and equipment in the factories, and products manufactured in the factories.
- the abnormality diagnosis device 100 may be implemented in a numerical control device, a PLC (Programmable Logic Controller), a server, a personal computer, etc., which are information processing devices in the factory. components may be distributed throughout the factory system.
- the abnormality diagnosis device 100 is an information processing device such as an abnormality detection device for factory equipment and machines provided inside the factory, a PC (personal computer) for monitoring the state of the factory, and a numerical control device for monitoring the state of the machine tool.
- a CPU 111 included in the abnormality diagnosis device 100 is a processor that controls the abnormality diagnosis device 100 as a whole.
- the CPU 111 reads out the system program processed in the ROM 112 via the bus, and controls the entire abnormality diagnosis device 100 according to the system program.
- the RAM 113 temporarily stores calculation data, display data, various data input by the user via the input unit 71, and the like.
- the display unit 70 is a monitor or the like attached to the abnormality diagnosis device 100 .
- the display unit 70 displays an operation screen, a setting screen, and the like of the abnormality diagnosis device 100 .
- the input unit 71 is integrated with the display unit 70 or is a keyboard, touch panel, or the like that is separate from the display unit 70 .
- the user operates the input unit 71 to perform input to the screen displayed on the display unit 70 .
- the display unit 70 and the input unit 71 may be mobile terminals.
- the non-volatile memory 114 is, for example, a memory that is backed up by a battery (not shown) so that the memory state is retained even when the abnormality diagnosis device 100 is powered off.
- the non-volatile memory 114 stores a program read from an external device via an interface (not shown), a program input via the input unit 71, and various data acquired from each unit of the abnormality diagnosis device 100 and sensors in the factory. be done. Programs and various data stored in the non-volatile memory 114 may be developed in the RAM 113 at the time of execution/use. Various system programs are pre-written in the ROM 112 .
- FIG. 2 is a block diagram of the abnormality diagnosis device 100 of the first disclosure.
- the abnormality diagnosis device 100 includes an abnormality detection data acquisition unit 11, an abnormality analysis data acquisition unit 12, an abnormality detection unit 13, an abnormality detection condition selection unit 14, an abnormality notification unit 15, a data extraction unit 16, an abnormality analysis unit 17, and an analysis result notification. It includes a section 18 , an abnormality analysis condition selection section 19 , a diagnosis history storage section 20 and a diagnosis history presentation section 21 .
- the anomaly detection data acquisition unit 11 acquires data used for anomaly detection. Data used for abnormality detection is selected by an abnormality detection condition selection unit 14, which will be described later.
- the data acquired by the abnormality detection data acquisition unit 11 includes operation data from control devices such as numerical controllers and PLCs, sensors installed in factories, internal sensors of industrial machines including machine tools, etc. We have data.
- the anomaly analysis data acquisition unit 12 acquires data used for anomaly analysis. Data used for abnormality analysis are selected by the abnormality analysis condition selection unit 19, which will be described later.
- the data acquired by the abnormality analysis data acquisition unit 12 includes operation data from control devices such as numerical controllers and PLCs, sensors installed in factories, internal sensors of industrial machines including machine tools, etc. We have data.
- the data used for the abnormality detection acquired by the abnormality detection data acquiring unit 11 is also included in the abnormality analysis data.
- the anomaly detection unit 13 detects an anomaly using the data acquired by the anomaly detection data acquisition unit 11 .
- the data used for abnormality detection is time-series data such as motor torque, vibration, temperature, and pressure. Anomaly detection is performed in real time.
- the anomaly detection unit 13 determines whether or not there is an anomaly in the anomaly detection data, or calculates the degree of anomaly. In the detection of the presence or absence of abnormality and the calculation of the degree of abnormality, it is desirable to calculate the feature amount of abnormality analysis data related to the occurrence of abnormality.
- the feature amount is calculated from motor torque, vibration, control signal, and the like.
- the feature amount includes the cut-out interval of each data, statistics (RMS: Root Mean Square, maximum value, minimum value, standard deviation, skewness, kurtosis), or frequency domain values after Fourier transform (PSD: Power Spectral Density, amplitude at each frequency, phase) and the like.
- the feature quantity is not determined in advance, but is selected from normal and abnormal data from the viewpoint of suitability and versatility. Several feature quantity candidates are selected in advance, the suitability and versatility of the feature quantity are evaluated based on certain criteria, and the optimum feature quantity is determined through repetition.
- the suitability means the feature amount that deviates most between normality and abnormality. It also includes combinations of such feature quantities.
- the anomaly notification unit 15 may notify the operator of the feature amount of the anomaly analysis data.
- the anomaly detection unit 13 may also calculate the degree of anomaly based on the feature amount of the anomaly analysis data.
- the anomaly notification unit 15 notifies the operator of the anomaly degree of the anomaly analysis data calculated by the anomaly detection unit 13 . The operator can confirm the degree of abnormality of multiple types of data.
- the anomaly detection condition selection unit 14 accepts selection of an anomaly detection condition from the operator.
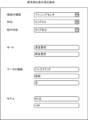
- FIG. 3 is an example of an abnormality detection condition selection screen.
- the type of machine or equipment to be diagnosed the parts to be used, the setting information of the machine or equipment, the operation details of the machine or equipment, the mode of abnormality detection, the type of data used for abnormality detection, You can enter the model used for anomaly detection.
- anomaly detection condition selection screen in Fig. 3 it is possible to input conditions such as "machining center” as the type of machine tool, "end mill” as the part to be used, and “tapping” as the operation content.
- Abnormality detection modes include "precision-oriented” and "speed-oriented".
- the model of anomaly detection and the type of data used for anomaly detection suitable for the selected mode are determined.
- Types of data used for anomaly detection include current/voltage, temperature, humidity, infrared rays, acceleration, magnetism, pressure, tilt, fluid velocity, vibration, rotation speed, and torque.
- data such as a torque command, vibration, and sound are used to detect an abnormality in a motor and a movable part caused by the motor.
- speed-oriented mode selection is selected for abnormality detection, a model for detecting abnormality using one type or a small number of data (for example, torque command) is selected. In order to improve the accuracy, a model combining a plurality of data or a large number of data is selected in addition to the torque command.
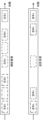
- Fig. 4 shows the difference in the number of data between "accuracy-oriented” and "speed-oriented".
- "precision-oriented” signal processing for processing a plurality of data, a plurality of signals (signal A to signal N) are input for each time block.
- signal A In “speed-oriented” signal processing, one signal (signal A) is input for each time block.
- the abnormality detection unit 13 sequentially processes the input data, and the smaller the number of data, the faster the processing.
- Anomaly detection models include the MT method, Variational auto-encoder (VAE), and the like.
- the MT method is a method of quantifying whether or not a subject is within the standard when normal data is used as a standard.
- a method of calculating the degree of anomaly using an average value, a standard deviation, etc. like the MT method has a low calculation load.
- a variational autoencoder is one of the models using deep learning. Accuracy improves when there is a large amount of well-organized data, but the computational load is high.
- a model with a low calculation load such as the MT method is selected. If the emphasis on accuracy is selected, a model such as VAE, which has a high computational load but relatively high accuracy, is selected.
- the model used for anomaly detection can also be directly selected by the operator.
- the selection screen in FIG. 3 is provided with selection areas for the model used for anomaly detection and the type of data used for anomaly detection.
- the abnormality detection unit 13 and the abnormality analysis unit 17 store the results of abnormality detection and abnormality analysis in the diagnosis history storage unit 20 .
- the diagnosis history storage unit 20 stores a model created by performing learning for each condition in advance.
- the anomaly notification unit 15 monitors anomaly detection data and notifies an operator when an anomaly is detected.
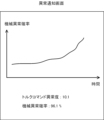
- FIG. 5 is an example of an anomaly notification screen. On this screen, the degree of abnormality of the data (torque command in this case) used for abnormality detection, "Torque command abnormality degree: 10.1", and the abnormality probability for the abnormality degree "Machine abnormality probability 96.1%" are displayed. be.
- the graph of FIG. 5 shows the transition of the machine abnormality probability.
- the error notification screen is always displayed. Operators can check the results of anomaly detection in real time.
- the abnormality notification unit 15 displays the abnormality degree of the abnormality analysis data on the abnormality notification screen. The operator can analyze the factors of anomalies based on the anomaly degrees of a plurality of data.
- the data extraction unit 16 extracts data based on the result of abnormality detection.
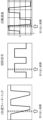
- the upper part shows the torque command of the motor in the normal state
- the lower part shows the torque command of the motor in the abnormal state.
- the area between dotted lines in the figure indicates the range to be cut out. It is assumed that the cut-out range is determined by a predetermined rule. As an example, data before and after including the point in time when the abnormality was detected are cut out for a predetermined period of time.
- the extraction rule is not particularly limited. It can be seen from FIG. 6 that the waveforms of the extracted data differ greatly between normal and abnormal conditions.
- the data extraction unit 16 also extracts data used for anomaly analysis based on the results of anomaly detection.
- FIG. 7 shows the Z-axis position feedback, cutting signal, and cutting range of rotation speed.
- the data clipping unit also clips other data based on the result of the abnormality detection.
- the abnormality analysis unit 17 acquires the data extracted by the data extraction unit 16 and analyzes the cause of the abnormality.
- the diagnosis history storage unit 20 stores a model for abnormality analysis generated from past clipped data.
- the abnormality analysis unit 17 uses a model for abnormality analysis to analyze the cause of abnormality from the extracted data.
- the analysis result notification unit 18 notifies the operator of the abnormality analysis result.
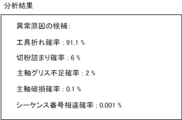
- FIG. 8 shows an example of the display screen of the analysis result of the cause of abnormality.
- "probability of tool breakage: 91.1%” indicates the analysis result in terms of probability.
- "probability of chip clogging: 6%” indicates the analysis result in terms of probability.
- "probability of spindle grease shortage: 2%” indicates the analysis result in terms of probability.
- the abnormality analysis condition selection unit 19 accepts selection of abnormality analysis conditions by the operator. An appropriate model can be selected by setting anomaly analysis conditions.
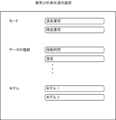
- FIG. 9 is an example of an abnormality analysis condition selection screen. On the selection screen, it is possible to select the mode of abnormality analysis, the type of data used for abnormality analysis, the model used for abnormality analysis, and the like.
- the diagnosis history storage unit 20 stores anomaly detection conditions, anomaly detection results, extracted data, anomaly analysis conditions, anomaly analysis results, anomaly detection models, anomaly analysis models, and the like.
- Past diagnosis history is used for model construction, anomaly detection, and anomaly analysis.
- the diagnosis history presentation unit 21 presents the past diagnosis history stored in the diagnosis history storage unit 20 to the operator.
- the past diagnosis history can be used when selecting conditions for abnormality detection and conditions for abnormality analysis.
- Past diagnosis history can be used as a reference when selecting models and types of data to use in anomaly detection and anomaly analysis.
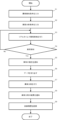
- the abnormality diagnosis device 100 acquires abnormality detection conditions from an operator (step S1).
- the abnormality diagnosis device 100 displays, for example, a selection screen for abnormality detection conditions and accepts input from the operator. On the selection screen, you can select the mode of anomaly detection, the type of data used for anomaly detection, the model used for anomaly detection, and so on.
- the abnormality diagnosis device 100 acquires abnormality analysis conditions from the operator (step S2).
- the abnormality diagnosis device 100 displays, for example, an abnormality analysis condition selection screen and accepts an operator's input. On the selection screen, the mode of anomaly analysis, the type of data used for anomaly analysis, the model used for anomaly analysis, etc. can be selected.
- the abnormality analysis conditions may be selected before the abnormality analysis in step S7.
- the abnormality diagnosis device 100 acquires data from the equipment and machines in the factory and from the sensors placed in the factory.
- the abnormality diagnosis device 100 performs abnormality detection under the conditions selected in step S1 (step S3).
- the abnormality detection in step S3 is performed in real time using a smaller number of data than the abnormality analysis.
- the abnormality diagnosis device 100 When the occurrence of an abnormality is detected (step S4; Yes), the abnormality diagnosis device 100 notifies the operator of the occurrence of the abnormality (step S5).
- the anomaly diagnosis device 100 displays, for example, an anomaly notification screen, and displays the degree of anomaly of data subject to anomaly detection and the probability of occurrence of an anomaly.
- step S4 If no abnormality is detected (step S4; No), the process proceeds to step S3 to continue abnormality detection.
- the anomaly diagnosis device 100 extracts data to be used for anomaly analysis (step S6).
- the type of data used for anomaly analysis is selected in step S2. It is assumed that the data extraction range is determined by a predetermined rule.
- the abnormality diagnosis device 100 uses the extracted data to perform abnormality analysis under the conditions selected in step S2 (step S7).
- the abnormality analysis in step S7 need not be performed in real time.
- Using a large number of data from the abnormality detection in step S3, the location of the abnormality, the cause of the abnormality, and the like are estimated.
- the abnormality diagnosis device 100 notifies the operator of the result of the abnormality analysis (step S8).
- the abnormality diagnosis device 100 displays, for example, the result of abnormality analysis on the display screen.
- the display screen displays the estimated cause of abnormality and the probability.
- the operator identifies the actual cause of the abnormality with reference to the results of the abnormality analysis.
- the operator's confirmation result is fed back to the abnormality diagnosis device as the true cause of abnormality.
- the abnormality diagnosis device 100 uses conditions for abnormality detection, models for abnormality detection, results of abnormality detection, extracted data, conditions for abnormality analysis, results of abnormality analysis, models for abnormality analysis, and true causes of abnormality fed back by the operator. etc. is recorded in the diagnosis history storage unit (step S9).
- the abnormality diagnosis device 100 of the first disclosure divides the abnormality diagnosis into two stages of abnormality detection and abnormality analysis.
- a model used for anomaly detection a model that uses less data and has a lower computational load than a model used for anomaly analysis is used.
- the abnormality diagnosis apparatuses 100 of the first and second disclosures hold a plurality of models that can identify the cause of abnormality.
- the abnormality diagnosis data before and after the occurrence of the abnormality, including the point of time when the abnormality occurred are extracted, and the degree of divergence from the normal data is calculated to identify the cause of the abnormality.
- Conditions for anomaly analysis can be set by the operator.
- the operator can set an appropriate diagnosis method while considering calculation load, communication load, and which of accuracy and speed is more important. According to the present disclosure, it is possible to improve the productivity and reliability of the factory while suppressing calculation costs, communication costs, and the like.
- the anomaly diagnosis device 100 displays in real time the degree of anomaly, which is the result of the anomaly detection.
- the operator can monitor changes in the degree of anomaly and predict the occurrence of an anomaly.
- the anomaly diagnosis device 100 records anomaly detection conditions, anomaly detection results, anomaly detection estimation accuracy, anomaly analysis conditions, anomaly analysis results, anomaly analysis estimation accuracy, and extracted data.
- the operator can select an appropriate model based on the estimation accuracy of past abnormality diagnoses.
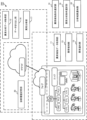
- FIG. 11 is an example of a factory system.
- the factory system consists of edge, fog, and cloud.
- An edge is an area close to sensors and control devices in terms of a network.
- Edge computing performs real-time processing of a large amount of data obtained from many sensors placed in a factory, as well as factory equipment and machine control devices.
- the cloud is an external system over the internet rather than an internal hard drive or local server. Cloud computing analyzes and analyzes large amounts of data collected at the edge and stored in the cloud. Fog sits network-wise between the cloud and the edge. Fog may perform data processing that is done in the cloud. Because data is processed before being sent over the Internet, it can respond quickly to changes in the environment.
- the abnormality detection data acquisition unit 11 and the abnormality detection unit 13 are mounted on the edge or fog.
- an anomaly detection data acquisition unit 11 and an anomaly notification unit 15 are implemented.
- the abnormality analysis data acquisition unit 12, the data extraction unit 16, and the abnormality analysis unit 17 are implemented in an information processing device on the cloud or an information processing device close to fog.
- the diagnosis history storage unit 20 is implemented in a storage device on the cloud.
- the anomaly detection condition selection unit 14, the anomaly analysis condition selection unit 19, and the analysis result notification unit 18 may be implemented in any of edge, fog, and cloud.
- abnormality detection is performed by an information processing device near the edge or fog
- abnormality analysis is performed by the information processing device near fog or the cloud.
- anomaly diagnosis system anomaly detection conditions and anomaly analysis conditions can be selected in advance, and an appropriate anomaly diagnosis method can be set by considering calculation load, communication load, accuracy or speed, etc. .
- the anomaly diagnosis system can perform real-time anomaly detection using edge or fog, and can analyze data from which anomalies are detected using fog or cloud.
- abnormality diagnosis device 100 abnormality diagnosis device 200 abnormality diagnosis system 11 abnormality detection data acquisition unit 12 abnormality analysis data acquisition unit 13 abnormality detection unit 14 abnormality detection condition selection unit 15 abnormality notification unit 16 data extraction unit 17 abnormality analysis unit 18 analysis result notification unit 19 abnormality analysis Condition selection unit 20 Diagnosis history storage unit 21 Diagnosis history presentation unit 111 CPU 112 ROMs 113 RAM 114 non-volatile memory
Landscapes
- Engineering & Computer Science (AREA)
- Physics & Mathematics (AREA)
- General Physics & Mathematics (AREA)
- Automation & Control Theory (AREA)
- General Engineering & Computer Science (AREA)
- Manufacturing & Machinery (AREA)
- Quality & Reliability (AREA)
- Testing And Monitoring For Control Systems (AREA)
Priority Applications (5)
| Application Number | Priority Date | Filing Date | Title |
|---|---|---|---|
| DE112021008222.1T DE112021008222T5 (de) | 2021-11-19 | 2021-11-19 | Anomaliediagnosevorrichtung, anomaliediagnosesystem und speichermedium |
| US18/704,455 US20250238020A1 (en) | 2021-11-19 | 2021-11-19 | Abnormality diagnostic device, abnormality diagnostic system, and storage medium |
| PCT/JP2021/042610 WO2023089773A1 (ja) | 2021-11-19 | 2021-11-19 | 異常診断装置、異常診断システム、及び記憶媒体 |
| JP2023562049A JP7783297B2 (ja) | 2021-11-19 | 2021-11-19 | 異常診断装置、異常診断システム、及び記憶媒体 |
| CN202180104074.8A CN118215892A (zh) | 2021-11-19 | 2021-11-19 | 异常诊断装置、异常诊断系统以及存储介质 |
Applications Claiming Priority (1)
| Application Number | Priority Date | Filing Date | Title |
|---|---|---|---|
| PCT/JP2021/042610 WO2023089773A1 (ja) | 2021-11-19 | 2021-11-19 | 異常診断装置、異常診断システム、及び記憶媒体 |
Publications (2)
| Publication Number | Publication Date |
|---|---|
| WO2023089773A1 true WO2023089773A1 (ja) | 2023-05-25 |
| WO2023089773A9 WO2023089773A9 (ja) | 2024-03-07 |
Family
ID=86396486
Family Applications (1)
| Application Number | Title | Priority Date | Filing Date |
|---|---|---|---|
| PCT/JP2021/042610 Ceased WO2023089773A1 (ja) | 2021-11-19 | 2021-11-19 | 異常診断装置、異常診断システム、及び記憶媒体 |
Country Status (5)
| Country | Link |
|---|---|
| US (1) | US20250238020A1 (cg-RX-API-DMAC7.html) |
| JP (1) | JP7783297B2 (cg-RX-API-DMAC7.html) |
| CN (1) | CN118215892A (cg-RX-API-DMAC7.html) |
| DE (1) | DE112021008222T5 (cg-RX-API-DMAC7.html) |
| WO (1) | WO2023089773A1 (cg-RX-API-DMAC7.html) |
Citations (6)
| Publication number | Priority date | Publication date | Assignee | Title |
|---|---|---|---|---|
| JPH05322603A (ja) * | 1992-05-21 | 1993-12-07 | Toshiba Corp | プラントの異常検出装置 |
| JP2007165721A (ja) * | 2005-12-15 | 2007-06-28 | Omron Corp | プロセス異常分析装置及びプログラム |
| JP2012138044A (ja) * | 2010-12-28 | 2012-07-19 | Toshiba Corp | プロセス状態監視装置 |
| JP2016012240A (ja) * | 2014-06-30 | 2016-01-21 | 株式会社日立製作所 | 異常検知システム |
| JP2018109851A (ja) * | 2016-12-28 | 2018-07-12 | 三菱日立パワーシステムズ株式会社 | 診断装置、診断方法及びプログラム |
| JP2019061565A (ja) * | 2017-09-27 | 2019-04-18 | パナソニック インテレクチュアル プロパティ コーポレーション オブ アメリカPanasonic Intellectual Property Corporation of America | 異常診断方法および異常診断装置 |
Family Cites Families (4)
| Publication number | Priority date | Publication date | Assignee | Title |
|---|---|---|---|---|
| US10719577B2 (en) * | 2014-12-05 | 2020-07-21 | Nec Corporation | System analyzing device, system analyzing method and storage medium |
| WO2019138891A1 (ja) * | 2018-01-12 | 2019-07-18 | 日本電信電話株式会社 | 異常箇所特定装置、異常箇所特定方法及びプログラム |
| JP7016459B2 (ja) * | 2020-01-23 | 2022-02-04 | 三菱電機株式会社 | アノマリ検知装置、アノマリ検知方法及びアノマリ検知プログラム |
| JP2022176700A (ja) | 2021-05-17 | 2022-11-30 | ロザイ工業株式会社 | 工業炉保全支援システム |
-
2021
- 2021-11-19 US US18/704,455 patent/US20250238020A1/en active Pending
- 2021-11-19 JP JP2023562049A patent/JP7783297B2/ja active Active
- 2021-11-19 WO PCT/JP2021/042610 patent/WO2023089773A1/ja not_active Ceased
- 2021-11-19 CN CN202180104074.8A patent/CN118215892A/zh active Pending
- 2021-11-19 DE DE112021008222.1T patent/DE112021008222T5/de active Pending
Patent Citations (6)
| Publication number | Priority date | Publication date | Assignee | Title |
|---|---|---|---|---|
| JPH05322603A (ja) * | 1992-05-21 | 1993-12-07 | Toshiba Corp | プラントの異常検出装置 |
| JP2007165721A (ja) * | 2005-12-15 | 2007-06-28 | Omron Corp | プロセス異常分析装置及びプログラム |
| JP2012138044A (ja) * | 2010-12-28 | 2012-07-19 | Toshiba Corp | プロセス状態監視装置 |
| JP2016012240A (ja) * | 2014-06-30 | 2016-01-21 | 株式会社日立製作所 | 異常検知システム |
| JP2018109851A (ja) * | 2016-12-28 | 2018-07-12 | 三菱日立パワーシステムズ株式会社 | 診断装置、診断方法及びプログラム |
| JP2019061565A (ja) * | 2017-09-27 | 2019-04-18 | パナソニック インテレクチュアル プロパティ コーポレーション オブ アメリカPanasonic Intellectual Property Corporation of America | 異常診断方法および異常診断装置 |
Also Published As
| Publication number | Publication date |
|---|---|
| WO2023089773A9 (ja) | 2024-03-07 |
| JP7783297B2 (ja) | 2025-12-09 |
| JPWO2023089773A1 (cg-RX-API-DMAC7.html) | 2023-05-25 |
| DE112021008222T5 (de) | 2024-08-22 |
| CN118215892A (zh) | 2024-06-18 |
| US20250238020A1 (en) | 2025-07-24 |
Similar Documents
| Publication | Publication Date | Title |
|---|---|---|
| US12220816B2 (en) | Learning data confirmation support device, machine learning device, and failure predicting device | |
| CN109001649B (zh) | 一种电源智能诊断系统及保护方法 | |
| CN209297151U (zh) | 异常因素确定装置 | |
| EP3385800A1 (en) | Management system and management program | |
| JP2003280707A (ja) | 工作機械の異常診断装置、異常診断方法及び異常診断プログラム | |
| US7571022B2 (en) | System and method for monitoring machine health | |
| JP7166839B2 (ja) | ヘルスモニタリングシステム | |
| CN110543147A (zh) | 分析装置、分析方法及记录了分析程序的计算机可读介质 | |
| KR20240089185A (ko) | 머신 툴의 상태를 모니터링하는 방법 | |
| Prickett | An integrated approach to autonomous maintenance management | |
| US20220088802A1 (en) | Information processing method, information processing apparatus, display method, display apparatus, recording medium, method of manufacturing products, and method of acquiring learning data | |
| WO2020031225A1 (ja) | 異常診断装置及び異常診断方法 | |
| US20070088454A1 (en) | System and method for troubleshooting a machine | |
| CN115635365A (zh) | 加工判断系统、加工判断方法 | |
| JP2021076597A (ja) | 過渡速度動作中の振動傾向を決定することによるロータ異常の検出 | |
| Jain et al. | Dynamic optimization of process quality control and maintenance planning | |
| JP2022076660A (ja) | 稼働監視装置、及び稼働監視方法 | |
| JP7853331B2 (ja) | 診断装置及びコンピュータ読み取り可能な記録媒体 | |
| JP7571613B2 (ja) | 情報処理装置、情報処理プログラムおよび情報処理方法 | |
| US10955829B2 (en) | System and a method to enable zero defect production | |
| JP7783297B2 (ja) | 異常診断装置、異常診断システム、及び記憶媒体 | |
| WO2018176212A1 (en) | Method, apparatus and system for monitoring industrial robot | |
| WO2021199054A1 (en) | A system and a method to enable zero defect production in a manufacturing process and system | |
| JP2018073060A (ja) | 診断装置における診断結果表示方法及び診断装置 | |
| EP4733874A2 (en) | System and methods for health assessment and predictive maintenance of machines with motion axes |
Legal Events
| Date | Code | Title | Description |
|---|---|---|---|
| 121 | Ep: the epo has been informed by wipo that ep was designated in this application |
Ref document number: 21964788 Country of ref document: EP Kind code of ref document: A1 |
|
| WWE | Wipo information: entry into national phase |
Ref document number: 2023562049 Country of ref document: JP |
|
| WWE | Wipo information: entry into national phase |
Ref document number: 18704455 Country of ref document: US |
|
| WWE | Wipo information: entry into national phase |
Ref document number: 112021008222 Country of ref document: DE |
|
| WWE | Wipo information: entry into national phase |
Ref document number: 202180104074.8 Country of ref document: CN |
|
| 122 | Ep: pct application non-entry in european phase |
Ref document number: 21964788 Country of ref document: EP Kind code of ref document: A1 |
|
| WWP | Wipo information: published in national office |
Ref document number: 18704455 Country of ref document: US |