WO2023032320A1 - 粒子解析システム、粒子解析方法及びフローサイトメータシステム - Google Patents
粒子解析システム、粒子解析方法及びフローサイトメータシステム Download PDFInfo
- Publication number
- WO2023032320A1 WO2023032320A1 PCT/JP2022/013376 JP2022013376W WO2023032320A1 WO 2023032320 A1 WO2023032320 A1 WO 2023032320A1 JP 2022013376 W JP2022013376 W JP 2022013376W WO 2023032320 A1 WO2023032320 A1 WO 2023032320A1
- Authority
- WO
- WIPO (PCT)
- Prior art keywords
- unit
- container
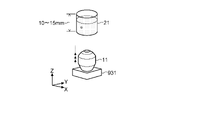
- light
- event
- imaging
- Prior art date
- Legal status (The legal status is an assumption and is not a legal conclusion. Google has not performed a legal analysis and makes no representation as to the accuracy of the status listed.)
- Ceased
Links
Images














Classifications
-
- G—PHYSICS
- G01—MEASURING; TESTING
- G01N—INVESTIGATING OR ANALYSING MATERIALS BY DETERMINING THEIR CHEMICAL OR PHYSICAL PROPERTIES
- G01N15/00—Investigating characteristics of particles; Investigating permeability, pore-volume or surface-area of porous materials
- G01N15/10—Investigating individual particles
- G01N15/14—Optical investigation techniques, e.g. flow cytometry
- G01N15/149—Optical investigation techniques, e.g. flow cytometry specially adapted for sorting particles, e.g. by their size or optical properties
-
- G—PHYSICS
- G01—MEASURING; TESTING
- G01N—INVESTIGATING OR ANALYSING MATERIALS BY DETERMINING THEIR CHEMICAL OR PHYSICAL PROPERTIES
- G01N15/00—Investigating characteristics of particles; Investigating permeability, pore-volume or surface-area of porous materials
- G01N15/01—Investigating characteristics of particles; Investigating permeability, pore-volume or surface-area of porous materials specially adapted for biological cells, e.g. blood cells
-
- G—PHYSICS
- G01—MEASURING; TESTING
- G01N—INVESTIGATING OR ANALYSING MATERIALS BY DETERMINING THEIR CHEMICAL OR PHYSICAL PROPERTIES
- G01N15/00—Investigating characteristics of particles; Investigating permeability, pore-volume or surface-area of porous materials
- G01N15/10—Investigating individual particles
- G01N15/14—Optical investigation techniques, e.g. flow cytometry
- G01N15/1429—Signal processing
- G01N15/1433—Signal processing using image recognition
-
- G—PHYSICS
- G01—MEASURING; TESTING
- G01N—INVESTIGATING OR ANALYSING MATERIALS BY DETERMINING THEIR CHEMICAL OR PHYSICAL PROPERTIES
- G01N15/00—Investigating characteristics of particles; Investigating permeability, pore-volume or surface-area of porous materials
- G01N15/10—Investigating individual particles
- G01N15/14—Optical investigation techniques, e.g. flow cytometry
- G01N15/1434—Optical arrangements
-
- G—PHYSICS
- G02—OPTICS
- G02B—OPTICAL ELEMENTS, SYSTEMS OR APPARATUS
- G02B21/00—Microscopes
- G02B21/36—Microscopes arranged for photographic purposes or projection purposes or digital imaging or video purposes including associated control and data processing arrangements
- G02B21/365—Control or image processing arrangements for digital or video microscopes
- G02B21/367—Control or image processing arrangements for digital or video microscopes providing an output produced by processing a plurality of individual source images, e.g. image tiling, montage, composite images, depth sectioning, image comparison
-
- G—PHYSICS
- G01—MEASURING; TESTING
- G01N—INVESTIGATING OR ANALYSING MATERIALS BY DETERMINING THEIR CHEMICAL OR PHYSICAL PROPERTIES
- G01N15/00—Investigating characteristics of particles; Investigating permeability, pore-volume or surface-area of porous materials
- G01N15/10—Investigating individual particles
- G01N2015/1006—Investigating individual particles for cytology
-
- G—PHYSICS
- G01—MEASURING; TESTING
- G01N—INVESTIGATING OR ANALYSING MATERIALS BY DETERMINING THEIR CHEMICAL OR PHYSICAL PROPERTIES
- G01N15/00—Investigating characteristics of particles; Investigating permeability, pore-volume or surface-area of porous materials
- G01N15/10—Investigating individual particles
- G01N15/14—Optical investigation techniques, e.g. flow cytometry
- G01N15/1434—Optical arrangements
- G01N2015/1452—Adjustment of focus; Alignment
Definitions
- the present disclosure relates to a particle analysis system, particle analysis method, and flow cytometer system.
- flow cytometry exists as a method for analyzing (or analyzing, in the present disclosure, analysis includes analysis) proteins of biologically relevant microparticles such as cells, microorganisms, and liposomes.
- a device used for this flow cytometry is called a flow cytometer (FCM).
- FCM flow cytometer
- microparticles flowing in a line in a channel are irradiated with a laser beam of a specific wavelength, and fluorescence, forward scattered light, side scattered light, and other light emitted from each microparticle is emitted as light.
- the type, size, structure, etc. of each microparticle can be determined by converting it into an electric signal by a detector, digitizing it, and performing statistical analysis on the result.
- microparticles In a particle analysis system that sorts microparticles, such as a cell sorter-type flow cytometer, it is necessary to check whether the microparticles are sorted correctly.
- the cells to be sorted are subjected to genetic analysis and culturing on a cell-by-cell basis.
- index sorting is used in which each identified cell is individually sorted into a well plate.
- more than a few errors occur, such as sorting two or more cells into the same well or failing to sort even a single cell.
- the present disclosure provides a particle analysis system, a particle analysis method, and a flow cytometer system capable of reducing work time.
- a particle analysis system includes an imaging unit that detects, as an event, a change in the brightness of light from particles in a container, and a focus position of the imaging unit on the container. a first scanning unit that scans in a depth direction; and a processing unit that measures the state inside the container based on events detected at a plurality of focal positions of the imaging unit by scanning by the first scanning unit.
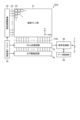
- FIG. 1 is a schematic diagram showing a configuration example of a particle analysis system according to the present disclosure
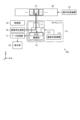
- FIG. 2 is a block diagram showing a more specific configuration example of the particle analysis system according to the first embodiment
- FIG. 1 is a block diagram showing a schematic configuration example of an image sensor according to a first embodiment
- FIG. 1 is a block diagram showing a schematic configuration example of an EVS according to a first embodiment
- FIG. 3 is a block diagram showing a schematic configuration example of a particle number measuring unit according to the first embodiment
- FIG. FIG. 2 is a diagram showing a configuration example of a well plate according to the first embodiment
- FIG. 7 is a diagram showing an excerpt from the well plate shown in FIG. 6.
- FIG. 4 is a diagram for explaining a case of measuring bioparticles dispensed in each well using a frame-type image sensor; 9 is a diagram showing an example of image data acquired in the case shown in FIG. 8; FIG. FIG. 4 is a diagram for explaining a case of measuring bioparticles dispensed in each well using the EVS according to the first embodiment; 11 is a diagram showing an example of a three-dimensional map (hereinafter also referred to as a 3D map) constructed in the case shown in FIG. 10; FIG.
- 4 is a flow chart showing an example of a particle number measurement operation flow according to the first embodiment
- 6 is a flowchart showing an example of particle number measurement processing according to the first embodiment
- It is a figure which shows the number of particles measured by the particle number measurement process which concerns on 1st Embodiment (particle number 2).
- It is a figure which shows an example of the user interface which concerns on 1st Embodiment.
- FIG. 1 is a block diagram showing an example of a device form of a particle analysis system according to a first embodiment
- FIG. FIG. 4 is a block diagram showing another configuration example of the particle analysis system according to the first embodiment
- FIG. 7 is a block diagram showing a schematic configuration example of a particle number measuring unit according to a first modified example of the first embodiment
- FIG. 9 is a block diagram showing a schematic configuration example of a particle number measuring unit according to a second modified example of the first embodiment
- FIG. 9 is a block diagram showing an example of the schematic configuration of a particle number measuring unit according to the second embodiment; 9 is a flow chart showing an example of a particle number measurement operation flow according to the second embodiment; 1 is a hardware configuration diagram showing an example of a computer that implements functions of an information processing apparatus according to the present disclosure; FIG.
- index sorting in which the identified cells are sorted one by one into a well plate, it is important for the reliability of subsequent analysis and culturing processes that each well can be sorted with single cells as intended. Importantly, random disturbances in the sorting mechanism of the flow cytometer often cause errors such as sorting two or more cells into the same well or failing to sort even a single cell. do. It is desirable to detect such erroneous wells in advance and remove them prior to further processing.
- Optical microscopy is an effective method for detecting errors without damaging living cells.
- the depth of focus at an optical magnification that can detect cells with a size of about several micrometers is usually 0.1 mm (millimeter) or less, which is very small compared to the liquid depth in the well, which is about 10 mm. Therefore, in order to measure the number of cells in the liquid without omission, it is necessary to scan the focal plane of the optical microscope in the depth direction.
- the following embodiments provide a particle analysis system, a particle analysis method, and a flow cytometer system capable of reducing working time.
- particle analysis that can shorten the time required to confirm whether microparticles are correctly fractionated while suppressing increases in device cost and device size.
- Systems, particle analysis methods and flow cytometer systems are provided.
- FIG. 1 shows a schematic configuration example of a particle analysis system according to the present disclosure.
- a particle analysis system 100 shown in FIG. It includes an information processing unit 103 that processes information about light.
- Examples of particle analysis system 100 include, for example, flow cytometers and imaging flow cytometers.
- the particle analysis system 100 includes a sorting section 104 that sorts out specific microparticles (in this description, bioparticles) P in the biological sample S.
- FIG. An example of the particle analysis system 100 including the sorting unit 104 is a cell sorter.
- the biological sample S may be a liquid sample containing biological particles P.
- the bioparticles P are, for example, cells or non-cellular bioparticles.
- the biological particles P may be microorganisms such as yeast and bacteria.
- the cells may be living cells, and more specific examples include blood cells such as red blood cells and white blood cells, and germ cells such as sperm and fertilized eggs.
- the cells may be directly collected from a sample such as whole blood, or may be cultured cells obtained after culturing.
- the noncellular bioparticles include extracellular vesicles, particularly exosomes and microvesicles.
- the bioparticle P may be labeled with one or a plurality of labeling substances (for example, a dye (especially a fluorescent dye) and a fluorescent dye-labeled antibody).
- labeling substances for example, a dye (especially a fluorescent dye) and a fluorescent dye-labeled antibody.
- Particles other than biological particles may be analyzed by the particle analysis system 100 of the present disclosure, and beads or the like may be analyzed for calibration or the like.
- the flow path C can be configured so that the biological sample S flows, particularly such that the biological particles P contained in the biological sample S are arranged substantially in a line to form a flow.
- the flow channel structure including the flow channel C may be designed to form a laminar flow, and in particular, to form a laminar flow in which the flow of the biological sample S (sample flow) is surrounded by the flow of the sheath liquid.
- the design of the flow channel structure may be appropriately selected by those skilled in the art, and known ones may be adopted.
- the channel C may be formed in a flow channel structure such as a microchip (a chip having a channel on the order of micrometers) or a flow cell.
- the width of the flow channel C may be 1 mm (millimeter) or less, particularly 10 ⁇ m (micrometer) or more and 1 mm or less.
- the channel C and the channel structure including it may be made of a material such as plastic or glass.
- the apparatus of the present disclosure may be configured such that the biological sample S flowing in the flow path C, particularly the biological particles P in the biological sample S, is irradiated with light from the light irradiation unit 101 .
- the apparatus of the present disclosure may be configured such that the light irradiation point (interrogation point) for the biological sample S is in the channel structure in which the channel C is formed, or the light irradiation point is , may be configured to be outside the channel structure.
- the former there is a configuration in which the light is applied to the channel C in the microchip or the flow cell. In the latter, the light may be applied to the biological particles P after exiting the flow path structure (especially the nozzle section thereof).
- the light irradiation unit 101 includes a light source unit for detection that emits light and a light guiding optical system that guides the light to the channel C. As shown in FIG.
- the detection light source unit includes one or more light sources.
- the type of light source may be, for example, a laser light source or an LED (Light Emitting Diode).
- the wavelength of light emitted from each light source may be any wavelength of ultraviolet light, visible light, or infrared light.
- the light guiding optics include optical components such as beam splitter groups, mirror groups or optical fibers.
- the light guiding optics may also include a lens group for condensing the light, for example an objective lens.
- the number of light irradiation points on the biological sample S may be one or more.
- the light irradiation unit 101 may be configured to condense light irradiated from one or different light sources to one irradiation point.
- the detection unit 102 includes at least one photodetector that detects light generated by light irradiation of the particles by the light irradiation unit 101 .
- the light to be detected is, for example, fluorescent light, scattered light (for example, one or more of forward scattered light, backscattered light, and side scattered light), transmitted light, and reflected light.
- Each photodetector includes one or more photodetectors, such as a photodetector array.
- Each photodetector may include photodiodes such as one or more PMTs (photomultiplier tubes) and/or APDs (Avalanche Photodiodes) and MPPCs (Multi-Pixel Photon Counters) as light receiving elements.
- the photodetector includes, for example, a PMT array in which a plurality of PMTs are arranged in a one-dimensional direction.
- the detection unit 102 may also include an imaging device such as a CCD (Charge Coupled Device) or a CMOS (Complementary Metal-Oxide-Semiconductor).
- the detection unit 102 can acquire bioparticle information about the bioparticle P using the imaging device.
- the bioparticle information can include at least one of bioparticle images of bioparticles, bioparticle feature amounts, bioparticle attribute information, and the like.
- the bioparticle image of the bioparticle may include, for example, a brightfield image, a darkfield image, a fluorescence image, and the like.
- the detection unit 102 includes a detection optical system that causes light of a predetermined detection wavelength to reach a corresponding photodetector.
- the detection optical system includes a spectroscopic section such as a prism or a diffraction grating, or a wavelength separating section such as a dichroic mirror or an optical filter.
- the detection optical system may be configured, for example, to disperse the light from the bioparticle P and detect light in different wavelength ranges with a plurality of photodetectors, the number of which is greater than the number of fluorescent dyes.
- a flow cytometer including such a detection optical system is called a spectral flow cytometer.
- the detection optical system may be configured, for example, to separate the light corresponding to the fluorescence wavelength range of the fluorescent dye from the light from the bioparticle P and cause the separated light to be detected by the corresponding photodetector. .
- the detection unit 102 may include a signal processing unit that converts the electrical signal obtained by the photodetector into a digital signal.
- the signal processing unit may include an A/D converter as a device that performs the conversion.
- a digital signal obtained by conversion by the signal processing unit can be transmitted to the information processing unit 103 .
- the digital signal can be handled by the information processing section 103 as data related to light (hereinafter also referred to as “optical data”).
- the optical data may be optical data including fluorescence data, for example. More specifically, the light data may be light intensity data, and the light intensity may be light intensity data of light containing fluorescence (which may include feature amounts such as Area, Height, Width, etc.) good.
- the information processing unit 103 includes, for example, a processing unit that processes various data (for example, optical data) and a storage unit that stores various data.
- the processing unit can perform fluorescence leakage correction (compensation processing) on the light intensity data.
- the processing unit performs fluorescence separation processing on the optical data and acquires light intensity data corresponding to the fluorescent dye.
- the fluorescence separation process may be performed, for example, according to the unmixing method described in JP-A-2011-232259.
- the processing unit may acquire morphological information of the biological particles P based on the image acquired by the imaging device.
- the storage unit may be configured to store the acquired optical data.
- the storage unit may further be configured to store spectral reference data used in the unmixing process.
- the particle analysis system 100 includes a sorting unit 104, which will be described later, and the information processing unit 103 can determine whether to sort the biological particles P based on the optical data and/or the morphological information. Then, the information processing section 103 can control the sorting section 104 based on the result of the determination, and sorting of the bioparticles P by the sorting section 104 can be performed.
- the information processing unit 103 may be configured to output various data (for example, optical data and images). For example, the information processing section 103 can output various data (for example, two-dimensional plots, spectral plots, etc.) generated based on the optical data. Further, the information processing unit 103 may be configured to be able to receive input of various data, and for example, receives gating processing on the plot by the user.
- the information processing unit 103 may include an output unit (such as a display) or an input unit (such as a keyboard) for executing the output or the input.
- the information processing unit 103 may be configured as a general-purpose computer, and may be configured as an information processing device including, for example, a CPU (Central Processing Unit), RAM (Random Access Memory), and ROM (Read only memory).
- the information processing unit 103 may be included in the housing in which the light irradiation unit 101 and the detection unit 102 are provided, or may be outside the housing.
- Various processing or functions by the information processing unit 103 may be implemented by a server computer or cloud connected via a network.
- the sorting unit 104 can sort the bioparticles P according to the determination result by the information processing unit 103, for example.
- the sorting method may be a method of generating a droplet containing the biological particles P by vibration, applying an electric charge to the droplet to be sorted, and controlling the traveling direction of the droplet with an electrode.
- the sorting method may be a method of sorting by controlling the traveling direction of the bioparticles P in the channel structure.
- the channel structure is provided with a control mechanism, for example, by pressure (jetting or suction) or electric charge.
- the channel C has a channel structure in which the channel C is branched into a recovery channel and a waste liquid channel downstream thereof, and the specific biological particles P are recovered in the recovery channel.
- a chip for example, a chip described in Japanese Patent Application Laid-Open No. 2020-76736, can be used.
- FIG. 2 is a block diagram of a more specific configuration example of the particle analysis system according to this embodiment.
- the particle analysis system may be configured as a system in which a plurality of devices are combined.
- the particle analysis system 100 includes a detection light source unit 111 and a light guide optical system 112 that constitute a light irradiation unit 101, a detection optical system 121 that constitutes a detection unit 102, an imaging 122, a signal processing unit 123, a velocity measurement unit 124, an information processing unit 103, a sorting unit 104, and a particle number measurement unit 105. Images of the emitted fluorescence, reflected light and/or transmitted light are observed in real time, and the target bioparticles P are dispensed into the wells of the well plate 20 based on the observation results.
- the detection light source unit 111, the light guide optical system 112, the detection optical system 121, the information processing unit 103, and the fractionation unit 104 may be the same as those described above with reference to FIG.
- the light output from the detection light source unit 111 (hereinafter also referred to as excitation light) is condensed by the light guiding optical system 112 .
- the condensed light irradiates the bioparticles P flowing at high speed in the channel C through which the biosample S with the bioparticles P floating is flowed.
- Reflected light or transmitted light and/or fluorescence emitted from the biological particles P irradiated with light are imaged on the light receiving surface of the imaging unit 122 through the detection optical system 121 .
- the imaging unit 122 has, for example, pixels arranged in a two-dimensional grid.
- the imaging unit 122 may be a frame-type image sensor that outputs image data (also referred to as frame data) at a predetermined frame rate, or may include event pixels that detect an event based on a change in luminance of incident light. It may be an EVS (Event-based Vision Sensor) arranged in a two-dimensional grid. Although the details will be described later, the EVS includes position information (X address and Y address) of the pixel where the event was detected, polarity information (positive event/negative event) of the detected event, and It may be a sensor that synchronously or asynchronously outputs event data including information (timestamp) of the time when an event was detected.
- image data also referred to as frame data
- EVS Event-based Vision Sensor
- Frame data acquired at a predetermined frame rate in the imaging unit 122, or a series of event data (hereinafter referred to as event stream ) is sent to the signal processing unit 123 .
- the speed measurement unit 124 measures the relative speed of the biological particles P flowing through the flow path C with respect to the speed measurement unit 124, for example. In this example, since the case where the speed measuring unit 124 is stationary with respect to the flow channel C is illustrated, the speed measuring unit 124 measures the speed of the biological particles P in the following description.
- Various detection methods capable of detecting the speed of the biological particles P such as an electrostatic method and an optical method, may be adopted for this speed measurement unit 124 .
- the velocity of the biological particles P detected by the velocity measuring section 124 is sent to the signal processing section 123 at any time.
- the speed of the biological particles P flowing through the flow path C is controlled so as to be maintained at a desired speed by controlling the pump system for feeding the biological sample S
- the speed of the biological particles P is known.
- the velocity measurement unit 124 may be omitted.
- the velocity of the biological particles P may fluctuate due to changes in the ambient temperature, the resistance of the liquid feeding system, and the like. may
- the signal processing unit 123 performs predetermined processing such as white balance adjustment and distortion correction on the input frame data, and outputs the processed frame data. It is sent to the information processing section 103 .
- the signal processing unit 123 reconstructs frame data of the image of the biological particles P from the event stream input from the imaging unit 122 and the velocity of the biological particles P, and reconstructs the frame data. The received frame data is sent to the information processing section 103 .
- the velocity of the bioparticles P used to reconstruct the frame data is not limited to the velocity of the bioparticles P themselves included in the reconstructed frame data. , an average value, or the like.
- the information processing unit 103 analyzes the frame data input from the signal processing unit 123, corrects to offset the rotation of the biological particles P moving in the flow channel C, extracts the feature amount, and determines the type of the biological particles P. , etc., is executed.
- the information processing unit 103 may also include a display unit, and present bioparticle information used for analysis, feature amounts and statistical data based on analysis results, classification results, and the like to the user. Further, the information processing section 103 may control the sorting section 104 based on the type determination result of the bioparticles P to separate and collect the bioparticles P of a specific type.
- the sorting unit 104 sorts the bioparticles P moving in the channel C one by one into each well of the well plate 20 based on the result of the type discrimination of the bioparticles P by the information processing unit 103 . Specific types of biological particles P are collected separately in the wells of the well plate 20 .
- the particle number measuring unit 105 which will be described in detail later, includes a light source unit, an imaging unit, and a scanning mechanism. By scanning, the number of bioparticles P dispensed into each well is counted.
- FIG. 3 is a block diagram showing a schematic configuration example of a frame-type image sensor according to this embodiment.
- a CMOS (Complementary Metal-Oxide-Semiconductor) type image sensor is exemplified, but it is not limited to this, and a CCD (Charge-Coupled Device) type or the like can acquire color or monochrome image data.
- CMOS Complementary Metal-Oxide-Semiconductor
- CCD Charge-Coupled Device
- the CMOS image sensor may be an image sensor manufactured by applying or partially using a CMOS process.
- the image sensor 122a has, for example, a stacked structure in which a semiconductor chip in which the pixel array section 31 is formed and a semiconductor chip in which a peripheral circuit is formed are stacked.
- Peripheral circuits may include, for example, a vertical drive circuit 32 , a column processing circuit 33 , a horizontal drive circuit 34 and a system controller 35 .
- the image sensor 122a further includes a signal processing section 38 and a data storage section 39.
- the signal processing unit 38 and the data storage unit 39 may be provided on the same semiconductor chip as the peripheral circuit, or may be provided on a separate semiconductor chip.
- the pixel array section 31 has a configuration in which pixels 30 each having a photoelectric conversion element that generates and accumulates an electric charge according to the amount of received light are arranged in a two-dimensional lattice in rows and columns, that is, in rows and columns.
- the row direction refers to the arrangement direction of pixels in a pixel row (horizontal direction in the drawing)
- the column direction refers to the arrangement direction of pixels in a pixel column (vertical direction in the drawing).
- pixel drive lines LD are wired along the row direction for each pixel row, and vertical signal lines VSL are wired along the column direction for each pixel column, with respect to the matrix-like pixel array.
- the pixel drive line LD transmits a drive signal for driving when reading a signal from a pixel.
- the pixel drive lines LD are shown as wirings one by one, but the number of the pixel drive lines LD is not limited to one each.
- One end of the pixel drive line LD is connected to an output terminal corresponding to each row of the vertical drive circuit 32 .
- the vertical drive circuit 32 is composed of a shift register, an address decoder, etc., and drives each pixel of the pixel array section 31 simultaneously or in units of rows. That is, the vertical drive circuit 32 constitutes a drive section that controls the operation of each pixel of the pixel array section 31 together with a system control section 35 that controls the vertical drive circuit 32 .
- the vertical drive circuit 32 generally has two scanning systems, a readout scanning system and a discharge scanning system, although the specific configuration thereof is not shown.
- the readout scanning system sequentially selectively scans the pixels 30 of the pixel array section 31 row by row in order to read out signals from the pixels 30 .
- a signal read out from the pixel 30 is an analog signal.
- the sweep-scanning system performs sweep-scanning ahead of the read-out scanning by the exposure time for the read-out rows to be read-scanned by the read-out scanning system.
- a so-called electronic shutter operation is performed by sweeping out (resetting) the unnecessary charges in this sweeping scanning system.
- the electronic shutter operation means an operation of discarding the charge of the photoelectric conversion element and newly starting exposure (starting charge accumulation).
- the signal read out by the readout operation by the readout scanning system corresponds to the amount of light received after the immediately preceding readout operation or the electronic shutter operation.
- the period from the readout timing of the previous readout operation or the sweep timing of the electronic shutter operation to the readout timing of the current readout operation is a charge accumulation period (also referred to as an exposure period) in the pixels 30 .
- a signal output from each pixel 30 in a pixel row selectively scanned by the vertical drive circuit 32 is input to the column processing circuit 33 through each vertical signal line VSL for each pixel column.
- the column processing circuit 33 performs predetermined signal processing on a signal output from each pixel of the selected row through the vertical signal line VSL for each pixel column of the pixel array section 31, and temporarily stores the pixel signal after the signal processing. to be retained.
- the column processing circuit 33 performs at least noise removal processing, such as CDS (Correlated Double Sampling) processing and DDS (Double Data Sampling) processing, as signal processing.
- CDS Correlated Double Sampling
- DDS Double Data Sampling
- the CDS processing removes pixel-specific fixed pattern noise such as reset noise and variations in threshold values of amplification transistors in pixels.
- the column processing circuit 33 also has an AD (analog-digital) conversion function, for example, and converts analog pixel signals read from the photoelectric conversion elements into digital signals and outputs the digital signals.
- AD analog-digital
- the horizontal driving circuit 34 is composed of shift registers, address decoders, etc., and sequentially selects readout circuits (hereinafter referred to as pixel circuits) corresponding to the pixel columns of the column processing circuit 33 .
- pixel circuits readout circuits
- the system control unit 35 is composed of a timing generator that generates various timing signals. and other drive control.
- the signal processing unit 38 has at least an arithmetic processing function, and performs various signal processing such as arithmetic processing on pixel signals output from the column processing circuit 33 .
- the data storage unit 39 temporarily stores data necessary for signal processing in the signal processing unit 38 . Note that if the signal processing unit 38 has arithmetic functions such as white balance adjustment and distortion correction, the signal processing unit 123 in FIG. 2 may be omitted.
- FIG. 4 is a block diagram showing a schematic configuration example of the EVS according to this embodiment.
- the EVS 122b includes a pixel array section 41, an X arbiter 42 and a Y arbiter 43, an event signal processing circuit 44, a system control circuit 45, and an output interface (I/F) 46.
- the pixel array section 41 has a configuration in which a plurality of event pixels 40 each detecting an event based on a change in luminance of incident light are arranged in a two-dimensional lattice.
- the row direction also referred to as row direction
- the column direction also referred to as column direction
- the arrangement of pixels in pixel columns It refers to the direction (vertical direction in the drawing).
- Each event pixel 40 has a photoelectric conversion element that generates a charge corresponding to the luminance of incident light, and requests reading from itself when a change in luminance of incident light is detected based on a photocurrent that flows from the photoelectric conversion element. request to the X arbiter 42 and the Y arbiter 43, and according to the arbitration by the X arbiter 42 and the Y arbiter 43, an event signal indicating that an event has been detected is output.
- Each event pixel 40 detects the presence or absence of an event depending on whether or not the photocurrent corresponding to the luminance of incident light has changed by exceeding a predetermined threshold. For example, each event pixel 40 detects, as an event, that the luminance change exceeds (positive event) or falls below (negative event) a predetermined threshold.
- the event pixel 40 When the event pixel 40 detects an event, it outputs a request to the X arbiter 42 and the Y arbiter 43 to request permission to output an event signal representing the occurrence of the event. Then, the event pixel 40 outputs the event signal to the event signal processing circuit 44 when receiving a response indicating permission to output the event signal from each of the X arbiter 42 and the Y arbiter 43 .
- the X arbiter 42 and the Y arbiter 43 arbitrate requests requesting the output of event signals supplied from the plurality of event pixels 40 respectively, and respond based on the arbitration results (permission/non-permission of event signal output), and , sends a reset signal for resetting event detection to the event pixel 40 that output the request.
- the event signal processing circuit 44 generates and outputs event data by executing predetermined signal processing on the event signal input from the event pixel 40 .
- the change in the photocurrent generated by the event pixel 40 can also be regarded as the change in the amount of light (luminance change) incident on the photoelectric conversion portion of the event pixel 40 . Therefore, an event can also be said to be a light amount change (brightness change) of the event pixel 40 exceeding a predetermined threshold.
- the event data representing the occurrence of an event includes at least position information such as coordinates representing the position of the event pixel 40 where the change in the amount of light has occurred as an event.
- the event data can include the polarity of the change in the amount of light in addition to the positional information.
- the event data is the relative time when the event occurred. It can be said that it implicitly includes time information representing
- the event signal processing circuit 44 includes time information such as a time stamp in the event data representing the relative time when the event occurred before the interval between the event data is no longer maintained as it was when the event occurred. good too.
- the system control circuit 45 is composed of a timing generator that generates various timing signals, and controls the X arbiter 42, the Y arbiter 43, the event signal processing circuit 44, etc. based on the various timings generated by the timing generator. drive control.
- the output I/F 46 sequentially outputs the event data output in units of rows from the event signal processing circuit 44 to the signal processing section 123 as an event stream.
- the signal processing unit 123 generates image data (also referred to as frame data) at a predetermined frame rate by accumulating event data input as an event stream for a predetermined frame period.
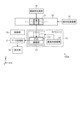
- FIG. 5 is a block diagram showing a schematic configuration example of the particle number measuring unit according to this embodiment.
- the particle number measuring unit 105 includes a camera unit 10, an in-plane scanning mechanism 15, an imaging light source unit 16, a data processing unit 17, a display unit 18, and a control unit 19. .
- Imaging light source unit 16 The imaging light source unit 16 outputs excitation light for exciting the bioparticles P dispensed into the wells of the well plate 20, similarly to the detection light source unit 111 in FIG.
- the camera unit 10 includes an objective lens 11 , a beam splitter 12 , an imaging section 13 and a vertical scanning mechanism 14 .
- the beam splitter 12 includes, for example, a spectral beam splitter such as a dichroic mirror that reflects light in a specific wavelength band and transmits light in other specific wavelength bands. It reflects the excitation light and transmits fluorescence emitted from the bioparticles P in the well irradiated with the excitation light.
- a spectral beam splitter such as a dichroic mirror that reflects light in a specific wavelength band and transmits light in other specific wavelength bands. It reflects the excitation light and transmits fluorescence emitted from the bioparticles P in the well irradiated with the excitation light.
- the objective lens 11 is composed of, for example, one or more lenses and a lens barrel that holds them.
- the objective lens 11 converges the excitation light reflected by the beam splitter 12 so as to irradiate the entire one well to be observed in the well plate 20 .
- the objective lens 11 also functions as an imaging lens that forms an image of the fluorescence emitted from the bioparticles P in the well irradiated with the excitation light on the light receiving surface of the imaging unit 13 .
- the beam splitter 12 or the imaging unit 13 has an imaging lens that forms a fluorescent image, the objective lens 11 does not have to function as an imaging lens.
- the vertical scanning mechanism 14 is a scanning unit that scans the focal position of the objective lens 11 along the Z direction, that is, along the depth direction of each well in the well plate 20 .
- This vertical scanning mechanism 14 may scan the focal position of the objective lens 11 in the depth direction of the well by moving the objective lens 11 in the Z direction. (or a plate to which the structure is fixed) may be moved in the Z direction to scan the focal position of the objective lens 11 in the depth direction of the well.
- the focal position of the objective lens 11 may be scanned in the depth direction of the well by moving one or more of the one or more lenses. Further, the vertical scanning mechanism 14 may scan the focal position of the objective lens 11 from the bottom side of the well toward the top side, or may scan the well from the top side toward the bottom side.
- the focal position of the objective lens 11 is recorded in a storage unit such as a memory (not shown) at two or more different points in time.
- the focal position of the objective lens 11 may be recorded at predetermined time intervals, and may be recorded together with the recording time (time stamp, etc.).
- the recorded focal position of the objective lens 11 it is possible to estimate the focal position where the event data is detected based on the elapsed time from the start of scanning and the time stamp included in the event data. This also makes it possible to construct a more accurate 3D map.
- the focal position can be estimated based on the elapsed time from the start of scanning.
- the imaging unit 13 includes an EVS 131.
- An image of fluorescence emitted from the biological particles P in the well is formed on the light receiving surface of the EVS 131 .
- the EVS 131 may have, for example, the same configuration as the EVS 122b illustrated in FIG.
- the in-plane scanning mechanism 15 is a scanning mechanism for sequentially changing the wells positioned on the optical axis of the objective lens 11 in the well plate 20, that is, the wells to be observed. For example, the in-plane scanning mechanism 15 horizontally moves the well plate 20 one well at a time within the XY plane, thereby sequentially replacing the wells positioned on the optical axis of the objective lens 11 .
- an in-plane scanning mechanism 15 is provided in the camera unit 10, and a structure composed of the objective lens 11, the beam splitter 12, and the imaging section 13 (may include the imaging light source section 16). may be horizontally moved to sequentially replace the wells located on the optical axis of the objective lens 11 .
- the data processing unit 17 converts an event stream input from the imaging unit 13 along with vertical scanning of the focal plane of the objective lens 11 into a 3D image in which events are mapped in a three-dimensional space consisting of a pixel coordinate axis and an event occurrence time axis. build a map. Then, the data processing unit 17 counts the number of bioparticles P sorted into each well based on the constructed 3D map. At that time, the data processing unit 17 may specify the position of the bioparticle P in each well. For example, the data processing unit 17 converts the time axis in the constructed 3D map to the position in the Z direction and creates the three-dimensional spatial coordinates of each well, thereby detecting the number and position of the bioparticles P in each well. You may
- the data processing unit 17 Based on the measured number and position of the bioparticles P, the data processing unit 17 also determines how many bioparticles P are collected in each well of the well plate 20 and where in each well the bioparticles P are present.
- a user interface (hereinafter also simply referred to as UI) for presenting to the user whether or not, etc. may be generated and displayed on the display unit 18 .
- the display unit 18 is configured by, for example, a display, and displays the UI generated by the data processing unit 17 to the user. Moreover, the display unit 18 may display a three-dimensional map of each well generated by the data processing unit 17 .
- the display unit 18 may be a display unit of a smartphone, a tablet terminal, a personal computer, or the like instead of the display.
- the data processing unit 17 and the display unit 18 may have a communication unit for communicating via a predetermined network.
- control unit 19 The control unit 19 is composed of, for example, an information processing device such as a CPU (Central Processing Unit), and controls the operation of each unit of the particle number measuring unit 105 in an integrated manner.
- an information processing device such as a CPU (Central Processing Unit)
- CPU Central Processing Unit
- FIG. 6 is a diagram showing a configuration example of a well plate according to this embodiment.
- FIG. 7 is a diagram showing a portion of the well plate shown in FIG. 6.
- well plate 20 is configured such that wells 21, which are containers for sorting bioparticles P whose falling trajectory has been changed by sorting section 104, are arranged in a matrix and held by frame 22.
- the opening shape and/or horizontal cross-sectional shape of each well 21 may be circular, elliptical, or polygonal such as triangular, quadrangular, or hexagonal.
- a 96-well plate or a 384-well plate may be used.
- the container for sorting the bioparticles P is not limited to the well, and a liquid drop standing on a plate may be used as the vessel for sorting the bioparticles P.
- Each well 21 is configured using a member transparent to excitation light emitted from the imaging light source unit 16 and fluorescence emitted from the biological particles P, which will be described later.
- the bottom of the frame 22 that supports each well 212 may also be made of a member transparent to excitation light and fluorescence.
- the excitation light is irradiated from the bottom side of each well 21 (however, the beam splitter 12 is omitted) is illustrated, but the present invention is not limited to this.
- the excitation light may be irradiated from the opening side (upper side) of 21 . In that case, the beam splitter 12 in the camera unit 10 may be omitted.
- each well 21 has an opening of about 3 to 7 mm, for example, in order to ensure the sorting accuracy of the bioparticles P whose falling trajectory is controlled by the sorting section 104, for example.
- each well 21 has a depth of about 10-15 mm in order to sufficiently reduce the impact applied to the biological particles P during collection.
- a predetermined liquid for example, a sheath liquid
- the number of bioparticles P is measured by the particle number measurement unit 105 according to the present embodiment, that is, when the bioparticles P are correctly dispensed into the wells 21 of the well plate 20.
- FIG. 8 is a diagram for explaining the case of measuring bioparticles dispensed into each well using a frame-type image sensor
- FIG. 9 shows image data acquired in the case shown in FIG. It is a figure which shows an example.
- FIG. 10 is a diagram for explaining the case of measuring bioparticles dispensed in each well using EVS
- FIG. 11 is a three-dimensional map (hereinafter referred to as a , also referred to as a 3D map).
- the entire horizontal cross section of the well 21 with a diameter of several mm can be imaged at a resolution that can detect biological particles P with a diameter of several macrometers.
- Imaging with a number of pixels of one million or more, which is necessary to fit in a corner, is performed over a depth of ten-odd millimeters with a depth of focus of approximately 0.1 mm.
- the well 21 has a diameter of 3 to 7 mm and a depth of 10 to 15 mm, it is necessary to perform 100 to 100-odd times of imaging with one million or more pixels. Therefore, even if the pixel gradation is assumed to be 8 bits, for example, the total amount of image data that needs to be acquired and transferred will be a huge amount of 800 Mbits (megabits) or more. is required.
- the vertical scanning mechanism 14 scans the focal position of the objective lens 11 in the depth direction of the well 21 at an arbitrary speed that is not necessarily constant.
- the fluorescent image of the biological particles P formed on the light receiving surface of the EVS 131 is at the focal point.
- the position is far from the bioparticle P, it does not have enough brightness to confirm its existence, and as the focal position approaches the bioparticle P, it changes from a blurred state to a clear state, and the focal position matches the bioparticle P.
- the clearest state is obtained when the As the focal position moves away from the biological particle P, the clear state changes to a blurred state.
- the EVS 131 detects the luminance change while the vertical scanning mechanism 14 is scanning the well 21 in the depth direction, and the time axis t corresponds to the depth direction in the well 21.
- the position of the bioparticle P in the well 21 in the depth direction can be specified by additionally installing means for detecting and storing the scanning position in the depth direction at the time when the event occurs.
- means for detecting and storing the scanning position there is a position sensor that performs reading and recording in conjunction with detection of an event corresponding to the bioparticle P.
- the shape of the generated event group corresponding to the fluorescence of the bioparticle P obtained by scanning the focal position of the objective lens 11 in the depth direction on the 3D map is an hourglass-like shape extending in the scanning direction. .
- the EVS 131 synchronously or asynchronously outputs the event as an event when the light incident on each event pixel 40 changes to increase or decrease. Therefore, event data is not output from the event pixels 40 that do not change in brightness, and the event data is instantaneously output asynchronously when an event occurs. With a smaller amount of data transfer and data processing compared to the image sensor of the above, detection of the biological particles P is possible with a faster response.
- the vertical scanning mechanism 14 since there is no need to synchronize the pixel readout timing with the vertical scanning position, high positional accuracy and high speed control by the vertical scanning mechanism 14 are not required. For example, using a simple configuration in which the vertical scanning mechanism 14 simply shifts the camera unit 10 from the start point to the end point of vertical scanning by means of a spring, the liquid depth of 10 mm can be scanned in several hundred milliseconds. Even in this case, the number of bioparticles P present in the well 21 can be accurately measured. As a result, it is possible to reduce the cost and size of the vertical scanning mechanism 14 while shortening the measurement time to about 1/10 compared to when a frame-type image sensor is used (for example, several seconds).
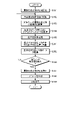
- FIG. 12 is a flow chart showing an example of the particle number measurement operation flow according to this embodiment. Note that the operation shown in FIG. 12 may be controlled by the control unit 19, so the following description focuses on the operation of the control unit 19.
- FIG. 12 is a flow chart showing an example of the particle number measurement operation flow according to this embodiment. Note that the operation shown in FIG. 12 may be controlled by the control unit 19, so the following description focuses on the operation of the control unit 19.
- FIG. 12 is a flow chart showing an example of the particle number measurement operation flow according to this embodiment. Note that the operation shown in FIG. 12 may be controlled by the control unit 19, so the following description focuses on the operation of the control unit 19. FIG.
- the control unit 19 starts driving the imaging light source unit 16 (step S101).
- the well plate 20 is irradiated with the excitation light output from the imaging light source unit 16 through the objective lens 11 .
- the EVS 131 of the imaging unit 13 may be activated.
- the control unit 19 controls the vertical scanning mechanism 14 to move, for example, the focal position (also referred to as the focal plane) of the objective lens 11 to the initial position (step S102).
- the initial position may be a position corresponding to the bottom surface of the well 21 when the well 21 is scanned from the bottom surface to the top surface, and may be a position corresponding to the top surface of the well 21 when the well 21 is scanned from the top surface to the bottom surface. .
- control unit 19 controls the in-plane scanning mechanism 15 to move the well plate 20, thereby arranging the observation target wells 21 within the angle of view of the imaging unit 13 (step S103).
- the in-plane scanning mechanism 15 horizontally moves the well plate 20 so that the center of the well 21 to be observed is positioned on the optical axis of the EVS 131 .
- the wells 21 to be observed may be selected in order from the wells 21 positioned at any of the four corners of the well plate 20, for example.
- control unit 19 controls the vertical scanning mechanism 14 to scan the focal position of the objective lens 11 from the initial position in the depth direction, and acquires event data output from the EVS 131 during the scanning (step S104).
- the event data output from the EVS 131 is input to the data processing unit 17 and accumulated in a predetermined storage area for each well 21.
- control unit 19 instructs the data processing unit 17 based on the event data accumulated in association with the well 21 to be observed to determine the number and/or position of the bioparticles P collected in the well 21 to be observed. is executed (step S105). Details of the particle number measurement process will be described later with reference to FIG. 13 . Further, in step S105, the data processing section 17 may generate a 3D map of each well 21. FIG.
- control unit 19 determines whether or not the particle number counting process has been executed for all the wells 21 from which the bioparticles P are sorted in the well plate 20 (step S106), If not executed (NO in step S106), the process returns to step S102 and the subsequent operations are executed for the next well 21.
- step S106 if the particle number counting process has already been executed for all the wells 21 that are selected as collection destinations (YES in step S106), the control unit 19 stops driving the imaging light source unit 16 (step S107).
- control unit 19 presents the number and/or positions of the bioparticles P per well 21 to the user based on the number and positions of the bioparticles P per well 21 measured in step S105. is generated (step S108), the generated UI is displayed on the display unit 18 (step S109), and then this operation is terminated.
- FIG. 13 is a flowchart showing an example of particle number measurement processing according to this embodiment.
- the data processing unit 17 first constructs a 3D map (for example, see FIG. 11) of the well 21 to be observed from the event data acquired in step S104 of FIG. (Step S120).
- the data processing unit 17 selects one of the event data (target event) included in the 3D map (step S121).
- the target event may be selected based on, for example, a time stamp, pixel position information, or the like.
- target events may be selected in chronological order from event data indicated by timestamps, or target events may be selected in order from the upper left event pixel 40 in the pixel array section 41 along the X direction.
- the data processing unit 17 measures the number of events (hereinafter also referred to as neighboring events) that occurred in the vicinity of the selected target event (hereinafter also referred to as the number of neighboring events) (step S122).
- the nearby event may be, for example, an event located nearby in the X-axis direction and the Y-axis direction (that is, in the XY plane), or an event located in the X-axis direction, the Y-axis direction, and the t-axis direction (that is, the XYt space) may be events located nearby.
- the neighborhood may be an area within a predetermined number of pixels (for example, 5 pixels) in the X-axis direction and the Y-axis direction with respect to the event pixel 40 where the target event is detected, as long as it is on the XY plane. If it is on the axis, it may be within a predetermined time (for example, several tens of microseconds) from the time indicated by the time stamp of the target event.
- the data processing unit 17 determines whether the number of neighboring events measured in step S122 is equal to or greater than a preset threshold. (Step S122). If the number of neighboring events is less than the threshold (NO in step S122), the data processing unit 17 determines that the target event is noise (step S124), and proceeds to step S128.
- the data processing unit 17 determines that the event is an event to be measured derived from the biological particle P.
- a group of events including the target event is specified from accumulated event data or a 3D map constructed from these event data. can also be performed (step S125).
- the data processing unit 17 excludes the event data included in the event group identified in step S125 from the target event candidates in step S121 in order to prevent duplicate counting of the same bioparticle P (step S126).
- the data processing unit 17 counts up the number of bioparticles P in the observation target well 21 (step S127), and proceeds to step S128. At that time, the data processing unit 17 determines the position of the center of the distribution range or the center of gravity specified as the group of events, that is, the event group corresponding to one biological particle P in step S125. It may be specified as the position of the particle P.
- step S127 instead of counting the number of bioparticles P in the well 21 to be observed, the positions of the bioparticles P in the well 21 to be observed may be measured. At that time, when two or more bioparticles P are present in the well 21, the position of each bioparticle P may be measured.
- step S1208 the data processing unit 17 determines whether or not all event data included in the 3D map (excluding the excluded event data) have been selected as target events in step S121. If so (YES in step S128), this operation is terminated. Thereby, the particle number measurement operation shown in FIG. 12 proceeds to the next step S106. On the other hand, if unselected event data exists (NO in step S128), the data processing unit 17 returns to step S121, selects the unselected event data as the target event, and executes the subsequent operations.
- steps S123 and S124 of FIG. 13 if the number of event data located near the target event is equal to or less than a predetermined threshold (NO in step S123), in other words, if the target event is an isolated event,
- a predetermined threshold NO in step S123
- the determination as to whether the target event is based on the biological particles P or the noise is not limited to the above method, and various modifications are possible. may be For example, if the distribution shape of the event data distributed in a certain amount of time has a predetermined shape (for example, an hourglass shape), the event data belonging to the event group is the event data in which the bioparticle P is detected. It may be determined that there is event data, and other event data may be determined to be noise.
- the particle number counting process performed for each well 21 may be performed each time each well 21 is vertically scanned, or after the vertical scanning for all wells 21 is completed, for all wells 21 They may be executed collectively.
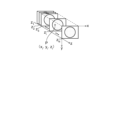
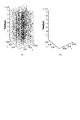
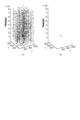
- FIGS. 14 to 16 are diagrams showing the number of particles measured by the particle number measurement processing according to the present embodiment, and FIG. FIG. 15 shows a case where one bioparticle P has been collected in the well 21, and FIG. 16 shows a case where two bioparticles P have been collected in the well 21.
- showing. 14 to 16 (a) are 3D maps showing all the event data output from the EVS 131
- FIGS. 14 to 16 (b) are 3D maps of the event data shown in (a).
- 2 is a 3D map showing bioparticles P extracted from .
- the in-plane axes X and Y are the pixel coordinates of the sensor
- the vertical axis Time is the event occurrence time.
- FIG. 17 is a diagram showing an example of the UI presented to the user in step S109 of FIG.
- the squares corresponding to the wells 21 of the well plate 20 are arranged according to the arrangement of the wells 21 of the well plate 20 .
- This array may be given an index (A to H, 1 to 12) for identifying each row and each column.
- Each square displays the number of bioparticles P dispensed in the corresponding well 21 .
- squares that are less than the prescribed number (one in this example) or larger than the prescribed number may be highlighted using visual effects such as color, blinking, or bold.
- information indicating the position of the bioparticle P in the well 21 may be displayed in each square.
- the positions corresponding to the positions of the bioparticles P in the XY plane in the well 21 may be displayed by dots in the grid.
- a two-dimensional map hereinafter also referred to as a 2D map
- a 3D map of the well 21 corresponding to the square selected by the user using an input interface such as a mouse, keyboard, or touch panel is displayed when the screen or window is switched or a new window is displayed. and so on may be displayed to the user.
- the 2D map may be image data of the XY plane in which the biological particles P are present in the 3D map, or may be image data created from a 3D map constructed from event data.
- a particle identification mechanism 52 for example, the light irradiation unit 101, the detection unit 102 and information processing unit 103
- an index sorting mechanism 53 e.g., corresponding to the sorting unit 104 in FIG.
- a sorter-type flow cytometer (equivalent to the flow cytometer 100A in FIG. 19) that analyzes and fractionates a sample 51 containing particles P may be of a built-in type in which the particle number measuring unit 105 is incorporated. , as shown in FIG. 19, a separate type in which a particle number measuring device 100B having a particle number measuring unit 105 is provided separately from the sorter type flow cytometer 100A.
- the in-plane scanning mechanism 55 that moves the well plate 20 for index sorting may be used as it is as the in-plane scanning mechanism 15 of the particle number measuring unit 105 .
- the index-sorted well plate 20 is taken out from the flow cytometer 100A and placed on the particle number measuring device 100B to count the bioparticles P collected in each well 21. is executed.
- photographing by a camera is effective for non-contact measurement of the number of biological particles P floating in the liquid filled in the well 21.
- the depth of the liquid is large relative to the focal depth of the camera, it is necessary to scan the focal plane of the camera in the depth direction of the container in order to count the number of particles without omission.
- the EVS 131 which is an event-type image sensor
- scanning in the depth direction can be performed continuously and at high speed.
- the number of fractionated particles can be accurately measured in a shorter time, so damage to the biological particles P can be minimized.
- the simplification of the scanning mechanism in the depth direction makes it possible to reduce the size and cost of the device.
- FIG. 20 is a block diagram showing a schematic configuration example of a particle number measuring unit according to a first modification of the present embodiment.
- the particle number measurement unit 105A according to this modification has the same configuration as the particle number measurement unit 105 described in the first embodiment with reference to FIG. It is configured to illuminate the well 21 from above. Also, the beam splitter 12 in the camera unit 10 is omitted in accordance with this change in illumination direction.
- the configuration of the camera unit 10 can be further simplified.
- FIG. 21 is a block diagram showing a schematic configuration example of a particle number measuring unit according to a second modification of the present embodiment.
- the particle number measuring unit 105B according to this modification has the same configuration as the particle number measuring unit 105 according to the first embodiment, but the vertical scanning mechanism 14 scans the well plate 20 in the depth direction. configured to scan.
- the configuration for scanning the focal position of the objective lens 11 in the depth direction may be modified in various ways as long as the relative position between the objective lens 11 and the well plate 20 is changed in the depth direction.
- vertically scanning the well plate 20 as in this modification it is possible to use a simpler scanning mechanism than when vertically scanning the camera unit 10 side. Miniaturization and cost reduction are also possible.
- the fluorescence emitted from the bioparticles P is observed by the EVS 131, and the number of the bioparticles P dispensed into each well 21 is calculated.
- the configuration is not limited to such a configuration.
- a half mirror or the like may be used as the beam splitter 12 instead of the spectral beam splitter.
- the position information of the bioparticles P in the well 21 is presented to the user using a 2D map or a 3D map constructed from the event data acquired by the EVS 131.
- the imaging unit 13 includes a frame-type image sensor in addition to the EVS 131, and position information of the bioparticles P in the well 21 is obtained using image data acquired by this image sensor. A case of presentation to the user will be exemplified.
- FIG. 22 is a block diagram showing a schematic configuration example of the particle number measuring section according to the present embodiment.
- the particle number measurement unit 205 according to the present embodiment has the same configuration as the particle number measurement unit 105 described in the first embodiment with reference to FIG. 13 is replaced with an imaging unit 213 .
- the imaging unit 213 includes an EVS 131 , a frame-type image sensor (hereinafter also referred to as CIS) 232 and a half mirror 233 .
- CIS frame-type image sensor
- the half mirror 233 is, for example, inclined at a predetermined angle (eg, 45 degrees) with respect to the optical axis of the objective lens 11.
- the EVS 131 is arranged, for example, at a position that receives light transmitted through the half mirror 233
- the CIS 232 is arranged, for example, at a position that receives light reflected by the half mirror 233 .
- FIG. 23 is a flow chart showing an example of the particle number measurement operation flow according to this embodiment. Since the operation shown in FIG. 23 may be controlled by the control unit 19 in the same manner as in FIG. 12, attention will be focused on the operation of the control unit 19 in the following description.
- the number and positions of bioparticles P in the well 21 to be observed are specified by operations similar to steps S101 to S105 in FIG.
- control unit 19 controls the vertical scanning mechanism 14 based on the positions of the biological particles P within the well 21 specified in the particle number counting process in step S105, thereby adjusting the focal position of the objective lens 11 to the biological particles. It is moved to a position in the depth direction where the particle P exists (step S201).
- control unit 19 drives the CIS 232 in a state in which the bioparticles P in the well 21 to be observed are in focus, thereby obtaining image data of the XY plane in which the bioparticles P are present in the well 21.
- Acquire step S202.
- the acquired image data is transmitted to the data processing unit 17 .
- control unit 19 determines whether or not the particle number counting process has been executed for all the wells 21 from which the bioparticles P are sorted in the well plate 20. If not executed (NO in step S106), the control unit 19 returns to step S102, and if executed (YES in step S106), the control unit 19 stops driving the imaging light source unit 16. (Step S107).
- the control unit 19 presents the number and/or positions of the bioparticles P per well 21 to the user based on the number and positions of the bioparticles P per well 21 measured in step S105.
- UI is generated (step S208).
- the image data acquired in step S202 may be used as the information indicating the position of the bioparticle P for each well 21 .
- the bioparticles P in the well 21 may be presented to the user indicating the location of the .
- the image data of the well 21 corresponding to the square selected by the user using an input interface such as a mouse, keyboard, or touch panel may be displayed to the user by switching the screen or window, or by switching a new window.
- control unit 19 causes the display unit 18 to display the UI generated in step S208 (step S109), and ends this operation.
- image data acquired by the frame-type image sensor is displayed to the user as information indicating the position of the bioparticle P for each well 21. . This makes it possible to provide the user with clearer and more detailed positional information of the biological particles P.
- FIG. 1 image data acquired by the frame-type image sensor (CIS232) is displayed to the user as information indicating the position of the bioparticle P for each well 21. . This makes it possible to provide the user with clearer and more detailed positional information of the biological particles P.
- FIG. 24 is a hardware configuration diagram showing an example of a computer 1000 that implements the functions of the signal processing section 123, the information processing section 103, and the data processing section 17.
- the computer 1000 has a CPU 1100 , a RAM 1200 , a ROM (Read Only Memory) 1300 , a HDD (Hard Disk Drive) 1400 , a communication interface 1500 and an input/output interface 1600 .
- Each part of computer 1000 is connected by bus 1050 .
- the CPU 1100 operates based on programs stored in the ROM 1300 or HDD 1400 and controls each section. For example, the CPU 1100 loads programs stored in the ROM 1300 or HDD 1400 into the RAM 1200 and executes processes corresponding to various programs.
- the ROM 1300 stores a boot program such as BIOS (Basic Input Output System) executed by the CPU 1100 when the computer 1000 is started, and programs dependent on the hardware of the computer 1000.
- BIOS Basic Input Output System
- the HDD 1400 is a computer-readable recording medium that non-temporarily records programs executed by the CPU 1100 and data used by such programs.
- HDD 1400 is a recording medium that records a program for realizing each operation according to the present disclosure, which is an example of program data 1450 .
- a communication interface 1500 is an interface for connecting the computer 1000 to an external network 1550 (for example, the Internet).
- the CPU 1100 receives data from another device via the communication interface 1500, and transmits data generated by the CPU 1100 to another device.
- the input/output interface 1600 is an interface for connecting the input/output device 1650 and the computer 1000 .
- the CPU 1100 receives data from input devices such as a keyboard and mouse via the input/output interface 1600 .
- the CPU 1100 transmits data to an output device such as a display, a speaker, or a printer via the input/output interface 1600 .
- the input/output interface 1600 may function as a media interface for reading a program or the like recorded on a predetermined recording medium.
- Media include, for example, optical recording media such as DVD (Digital Versatile Disc) and PD (Phase change rewritable disk), magneto-optical recording media such as MO (Magneto-Optical disk), tape media, magnetic recording media, semiconductor memories, etc. is.
- optical recording media such as DVD (Digital Versatile Disc) and PD (Phase change rewritable disk)
- magneto-optical recording media such as MO (Magneto-Optical disk)
- tape media magnetic recording media
- magnetic recording media semiconductor memories, etc. is.
- the CPU 1100 of the computer 1000 executes the program loaded on the RAM 1200 to process the signal.
- the functions of the processing unit 123, the information processing unit 103, and the data processing unit 17 are realized.
- the HDD 1400 also stores programs and the like according to the present disclosure.
- CPU 1100 reads and executes program data 1450 from HDD 1400 , as another example, these programs may be obtained from another device via external network 1550 .
- the present technology can also take the following configuration.
- an imaging unit that detects changes in brightness of light from particles in the container as events; a first scanning unit that scans the focal position of the imaging unit in the depth direction of the container; a processing unit that measures the state inside the container based on events detected at a plurality of focal positions of the imaging unit by scanning by the first scanning unit;
- the imaging unit is an objective lens facing the container; a first sensor unit comprising a plurality of pixels each configured to detect, as the event, a change in brightness of light from the particles in the container incident through the objective lens; with The particle analysis system according to (1) or (2), wherein the first scanning unit scans the focal position of the objective lens in the depth direction of the container. (4) The first scanning unit scans the focal position in the depth direction of the container by changing the relative position between the objective lens and the container in the depth direction. analysis system. (5)
- the objective lens comprises one or more lenses, The first scanning unit scans the focal position in the depth direction of the container by moving at least one lens among the one or more lenses of the objective lens in the depth direction.
- the particle analysis system according to 3).
- the imaging unit further comprises an optical system that reflects light from the imaging light source unit and transmits light from the particles in the container, The light from the imaging light source unit reflected by the optical system is applied to the particles in the container, The particle analysis system according to (6) or (7), wherein the light from the particles in the container passes through the optical system and enters the imaging section.
- the imaging light source unit irradiates the container with light from a first side, The particle analysis system according to (6) or (7), wherein the imaging unit detects, as the event, a change in brightness of light from the particles traveling to a second side opposite to the first side.
- the processing unit measures the state inside the container based on the number of events located in the vicinity of one event in the spatial direction and/or the temporal direction.
- the particle analysis system described. (11) The particle analysis system according to any one of (1) to (10), wherein the processing unit measures the number of particles in the container as the state inside the container based on the event. (12) The particle analysis system according to any one of (1) to (11), wherein the processing unit measures the position of the particle within the container as the state within the container based on the event. (13) The particle analysis system according to any one of (1) to (12), wherein the processing unit generates a user interface that presents the measured state inside the container to the user.
- the particle analysis system according to (13), wherein the processing unit generates, as the user interface, a two-dimensional map or a three-dimensional map of the interior of the container constructed from the event.
- the imaging unit further includes a second sensor unit that captures light from the particles in the container to generate image data,
- the first scanning unit moves the focal position of the imaging unit in the depth direction of the container based on the state inside the container measured based on the event
- the second sensor unit generates the image data by capturing the light from the particles within the container while the focal position of the imaging unit is moved based on the state within the container.
- the particle analysis system according to any one of (1) to (18), further comprising: (20) The container is a droplet that stands on its own on a plane, The particle analysis system according to any one of (1) to (18) above.
- a particle analysis method for a particle analysis system comprising an imaging unit that detects changes in brightness of light from particles in a container as events, a step of scanning the focal position of the imaging unit in the depth direction of the container; a step of measuring the state inside the container based on events detected at a plurality of focal positions of the imaging unit by scanning the focal position;
- a particle analysis method comprising: (22) The container is a droplet that stands on its own on a plane, The particle analysis method according to (21) above.
- a light source unit for detection that irradiates light onto biological particles passing through a predetermined flow path; a detection unit that detects the light emitted from the biological particles by the irradiation of the light from the detection light source unit; a collection unit that collects the bioparticles into a predetermined container based on the detection result of the detection unit; an imaging light source unit for irradiating the biological particles in the container with light; an imaging unit that detects, as an event, a change in brightness of light from the biological particles in the container in response to irradiation of light from the imaging light source unit; a scanning unit that scans the focal position of the imaging unit in the depth direction of the container; a processing unit that measures the state inside the container based on events detected at a plurality of focal positions of the imaging unit by scanning of the scanning unit;
- a flow cytometer system comprising:
Landscapes
- Chemical & Material Sciences (AREA)
- Physics & Mathematics (AREA)
- Analytical Chemistry (AREA)
- General Physics & Mathematics (AREA)
- Biochemistry (AREA)
- Dispersion Chemistry (AREA)
- Health & Medical Sciences (AREA)
- Life Sciences & Earth Sciences (AREA)
- General Health & Medical Sciences (AREA)
- Immunology (AREA)
- Pathology (AREA)
- Engineering & Computer Science (AREA)
- Multimedia (AREA)
- Computer Vision & Pattern Recognition (AREA)
- Optics & Photonics (AREA)
- Signal Processing (AREA)
- Investigating, Analyzing Materials By Fluorescence Or Luminescence (AREA)
Priority Applications (4)
| Application Number | Priority Date | Filing Date | Title |
|---|---|---|---|
| US18/293,373 US12535401B2 (en) | 2021-09-03 | 2022-03-23 | Particle analysis system, particle analysis method, and flow cytometer system |
| JP2023545062A JPWO2023032320A1 (https=) | 2021-09-03 | 2022-03-23 | |
| EP22863910.0A EP4386358A4 (en) | 2021-09-03 | 2022-03-23 | PARTICLE ANALYSIS SYSTEM, PARTICLE ANALYSIS METHODS AND FLOW CYTOMETER SYSTEM |
| CN202280057897.4A CN117881955A (zh) | 2021-09-03 | 2022-03-23 | 粒子分析系统、粒子分析方法和流式细胞仪系统 |
Applications Claiming Priority (2)
| Application Number | Priority Date | Filing Date | Title |
|---|---|---|---|
| JP2021144272 | 2021-09-03 | ||
| JP2021-144272 | 2021-09-03 |
Publications (1)
| Publication Number | Publication Date |
|---|---|
| WO2023032320A1 true WO2023032320A1 (ja) | 2023-03-09 |
Family
ID=85411679
Family Applications (1)
| Application Number | Title | Priority Date | Filing Date |
|---|---|---|---|
| PCT/JP2022/013376 Ceased WO2023032320A1 (ja) | 2021-09-03 | 2022-03-23 | 粒子解析システム、粒子解析方法及びフローサイトメータシステム |
Country Status (5)
| Country | Link |
|---|---|
| US (1) | US12535401B2 (https=) |
| EP (1) | EP4386358A4 (https=) |
| JP (1) | JPWO2023032320A1 (https=) |
| CN (1) | CN117881955A (https=) |
| WO (1) | WO2023032320A1 (https=) |
Cited By (1)
| Publication number | Priority date | Publication date | Assignee | Title |
|---|---|---|---|---|
| WO2025205054A1 (ja) * | 2024-03-29 | 2025-10-02 | ソニーグループ株式会社 | 解析システム、解析方法、およびプログラム |
Citations (10)
| Publication number | Priority date | Publication date | Assignee | Title |
|---|---|---|---|---|
| JP2010263872A (ja) * | 2009-05-18 | 2010-11-25 | Olympus Corp | 細胞画像解析装置 |
| JP2011226970A (ja) | 2010-04-22 | 2011-11-10 | Inst For Systems Biology | 明視野顕微鏡を使用する画像の自動分析 |
| JP2011232259A (ja) | 2010-04-28 | 2011-11-17 | Sony Corp | 蛍光強度補正方法、蛍光強度算出方法及び蛍光強度算出装置 |
| WO2014057713A1 (ja) * | 2012-10-09 | 2014-04-17 | 古河電気工業株式会社 | スクリーニング装置およびスクリーニング方法 |
| US20160265970A1 (en) * | 2015-03-09 | 2016-09-15 | Samsung Electronics Co., Ltd. | Event-based vision sensor and difference amplifier with reduced noise and removed offset |
| JP2017091518A (ja) * | 2015-11-16 | 2017-05-25 | 三星電子株式会社Samsung Electronics Co.,Ltd. | イメージ生成方法及び装置 |
| JP2018007587A (ja) * | 2016-07-11 | 2018-01-18 | オリンパス株式会社 | 観察装置 |
| JP2020076736A (ja) | 2018-09-10 | 2020-05-21 | ソニー株式会社 | 微小粒子分取装置、細胞治療薬製造装置、微小粒子分取方法、及びプログラム |
| WO2021019830A1 (ja) * | 2019-07-29 | 2021-02-04 | 株式会社日立ハイテク | 粒子定量装置 |
| WO2021241757A1 (ja) * | 2020-05-29 | 2021-12-02 | ソニーグループ株式会社 | 情報処理装置、生体試料解析方法、生体試料検出装置、および生体試料検出システム |
Family Cites Families (1)
| Publication number | Priority date | Publication date | Assignee | Title |
|---|---|---|---|---|
| EP1825317B1 (en) * | 2004-11-24 | 2013-04-17 | Battelle Memorial Institute | Optical system for cell imaging |
-
2022
- 2022-03-23 CN CN202280057897.4A patent/CN117881955A/zh active Pending
- 2022-03-23 EP EP22863910.0A patent/EP4386358A4/en active Pending
- 2022-03-23 JP JP2023545062A patent/JPWO2023032320A1/ja active Pending
- 2022-03-23 WO PCT/JP2022/013376 patent/WO2023032320A1/ja not_active Ceased
- 2022-03-23 US US18/293,373 patent/US12535401B2/en active Active
Patent Citations (10)
| Publication number | Priority date | Publication date | Assignee | Title |
|---|---|---|---|---|
| JP2010263872A (ja) * | 2009-05-18 | 2010-11-25 | Olympus Corp | 細胞画像解析装置 |
| JP2011226970A (ja) | 2010-04-22 | 2011-11-10 | Inst For Systems Biology | 明視野顕微鏡を使用する画像の自動分析 |
| JP2011232259A (ja) | 2010-04-28 | 2011-11-17 | Sony Corp | 蛍光強度補正方法、蛍光強度算出方法及び蛍光強度算出装置 |
| WO2014057713A1 (ja) * | 2012-10-09 | 2014-04-17 | 古河電気工業株式会社 | スクリーニング装置およびスクリーニング方法 |
| US20160265970A1 (en) * | 2015-03-09 | 2016-09-15 | Samsung Electronics Co., Ltd. | Event-based vision sensor and difference amplifier with reduced noise and removed offset |
| JP2017091518A (ja) * | 2015-11-16 | 2017-05-25 | 三星電子株式会社Samsung Electronics Co.,Ltd. | イメージ生成方法及び装置 |
| JP2018007587A (ja) * | 2016-07-11 | 2018-01-18 | オリンパス株式会社 | 観察装置 |
| JP2020076736A (ja) | 2018-09-10 | 2020-05-21 | ソニー株式会社 | 微小粒子分取装置、細胞治療薬製造装置、微小粒子分取方法、及びプログラム |
| WO2021019830A1 (ja) * | 2019-07-29 | 2021-02-04 | 株式会社日立ハイテク | 粒子定量装置 |
| WO2021241757A1 (ja) * | 2020-05-29 | 2021-12-02 | ソニーグループ株式会社 | 情報処理装置、生体試料解析方法、生体試料検出装置、および生体試料検出システム |
Non-Patent Citations (1)
| Title |
|---|
| See also references of EP4386358A4 |
Cited By (1)
| Publication number | Priority date | Publication date | Assignee | Title |
|---|---|---|---|---|
| WO2025205054A1 (ja) * | 2024-03-29 | 2025-10-02 | ソニーグループ株式会社 | 解析システム、解析方法、およびプログラム |
Also Published As
| Publication number | Publication date |
|---|---|
| CN117881955A (zh) | 2024-04-12 |
| US12535401B2 (en) | 2026-01-27 |
| EP4386358A4 (en) | 2024-12-25 |
| EP4386358A1 (en) | 2024-06-19 |
| US20240337584A1 (en) | 2024-10-10 |
| JPWO2023032320A1 (https=) | 2023-03-09 |
Similar Documents
| Publication | Publication Date | Title |
|---|---|---|
| US8098956B2 (en) | Digital microscope slide scanning system and methods | |
| US5548395A (en) | Particle analyzer | |
| US5457526A (en) | Apparatus for analyzing particles in fluid samples | |
| US20230417671A1 (en) | Biological sample analysis system, information processing device, information processing method, and biological sample analysis method | |
| US20240205546A1 (en) | Impulse rescan system | |
| US11131839B2 (en) | Sample observation device and sample observation method | |
| US20110017915A1 (en) | Drift scanner for rare cell detection | |
| CN112996900A (zh) | 细胞分选装置及方法 | |
| EP4365572B1 (en) | Biological sample analysis device | |
| US12535401B2 (en) | Particle analysis system, particle analysis method, and flow cytometer system | |
| CN107103604A (zh) | 一种微粒子色度自动聚类分析系统 | |
| JP4163301B2 (ja) | 走査型サイトメータ | |
| US8073219B2 (en) | Nucleic acid analyzing apparatus | |
| WO2023276298A1 (ja) | 生体試料分析システム、情報処理装置、情報処理方法及び生体試料分析方法 | |
| JP2002062251A (ja) | フロー式粒子画像解析方法及び装置 | |
| US20250377281A1 (en) | Biological sample analysis system and biological sample analysis method | |
| EP4528250A1 (en) | Biological sample analysis system, information processing device, information processing method, and biological sample analysis method | |
| JP3165272B2 (ja) | フロー式粒子画像解析方法及びフロー式粒子画像解析装置 | |
| JPH06221986A (ja) | フロー式粒子画像解析方法及びフロー式粒子画像解析装置 | |
| WO2020241652A1 (ja) | 光学測定装置及び光学測定システム | |
| CN117836606A (zh) | 粒子分选装置和粒子分选方法 | |
| WO2024243036A1 (en) | Methods and systems for co-linear laser scanning | |
| Charlot | Automation in image cytometry: continuous HCS and kinetic image cytometry | |
| JPH0763665A (ja) | フロ−式粒子画像解析装置 | |
| JPH09101235A (ja) | 光学的特性測定装置 |
Legal Events
| Date | Code | Title | Description |
|---|---|---|---|
| 121 | Ep: the epo has been informed by wipo that ep was designated in this application |
Ref document number: 22863910 Country of ref document: EP Kind code of ref document: A1 |
|
| WWE | Wipo information: entry into national phase |
Ref document number: 2023545062 Country of ref document: JP |
|
| WWE | Wipo information: entry into national phase |
Ref document number: 18293373 Country of ref document: US |
|
| WWE | Wipo information: entry into national phase |
Ref document number: 202280057897.4 Country of ref document: CN |
|
| WWE | Wipo information: entry into national phase |
Ref document number: 2022863910 Country of ref document: EP |
|
| NENP | Non-entry into the national phase |
Ref country code: DE |
|
| ENP | Entry into the national phase |
Ref document number: 2022863910 Country of ref document: EP Effective date: 20240315 |
|
| WWG | Wipo information: grant in national office |
Ref document number: 18293373 Country of ref document: US |