WO2023032320A1 - Particle analysis system, particle analysis method, and flow cytometer system - Google Patents
Particle analysis system, particle analysis method, and flow cytometer system Download PDFInfo
- Publication number
- WO2023032320A1 WO2023032320A1 PCT/JP2022/013376 JP2022013376W WO2023032320A1 WO 2023032320 A1 WO2023032320 A1 WO 2023032320A1 JP 2022013376 W JP2022013376 W JP 2022013376W WO 2023032320 A1 WO2023032320 A1 WO 2023032320A1
- Authority
- WO
- WIPO (PCT)
- Prior art keywords
- unit
- container
- light
- event
- imaging
- Prior art date
Links
- 239000002245 particle Substances 0.000 title claims abstract description 257
- 238000004458 analytical method Methods 0.000 title claims abstract description 88
- 238000012545 processing Methods 0.000 claims abstract description 125
- 238000003384 imaging method Methods 0.000 claims abstract description 115
- 230000008859 change Effects 0.000 claims abstract description 27
- 238000001514 detection method Methods 0.000 claims description 53
- 230000003287 optical effect Effects 0.000 claims description 42
- 238000003860 storage Methods 0.000 claims description 7
- 230000004044 response Effects 0.000 claims description 4
- 230000001413 cellular effect Effects 0.000 claims description 3
- 238000005194 fractionation Methods 0.000 claims description 3
- 239000011159 matrix material Substances 0.000 claims description 3
- 230000001678 irradiating effect Effects 0.000 claims description 2
- 230000002123 temporal effect Effects 0.000 claims description 2
- 230000007246 mechanism Effects 0.000 description 39
- 238000005259 measurement Methods 0.000 description 37
- 230000010365 information processing Effects 0.000 description 32
- 238000010586 diagram Methods 0.000 description 31
- 210000004027 cell Anatomy 0.000 description 30
- 238000000034 method Methods 0.000 description 29
- 238000012986 modification Methods 0.000 description 24
- 230000004048 modification Effects 0.000 description 24
- 230000000875 corresponding effect Effects 0.000 description 22
- 230000008569 process Effects 0.000 description 18
- 230000006870 function Effects 0.000 description 14
- 239000007788 liquid Substances 0.000 description 14
- 239000012472 biological sample Substances 0.000 description 13
- 230000005284 excitation Effects 0.000 description 13
- 238000006243 chemical reaction Methods 0.000 description 11
- 239000011859 microparticle Substances 0.000 description 11
- 230000000694 effects Effects 0.000 description 7
- 239000007850 fluorescent dye Substances 0.000 description 7
- 239000004065 semiconductor Substances 0.000 description 7
- 230000003595 spectral effect Effects 0.000 description 6
- 230000015654 memory Effects 0.000 description 5
- 239000000523 sample Substances 0.000 description 5
- 230000000007 visual effect Effects 0.000 description 5
- 238000004891 communication Methods 0.000 description 4
- 238000013500 data storage Methods 0.000 description 4
- 238000010408 sweeping Methods 0.000 description 4
- 206010036618 Premenstrual syndrome Diseases 0.000 description 3
- 230000001276 controlling effect Effects 0.000 description 3
- 238000012937 correction Methods 0.000 description 3
- 238000012258 culturing Methods 0.000 description 3
- 238000007689 inspection Methods 0.000 description 3
- 230000002093 peripheral effect Effects 0.000 description 3
- 238000009825 accumulation Methods 0.000 description 2
- 230000000295 complement effect Effects 0.000 description 2
- 238000009826 distribution Methods 0.000 description 2
- 238000007667 floating Methods 0.000 description 2
- 238000000684 flow cytometry Methods 0.000 description 2
- 244000005700 microbiome Species 0.000 description 2
- 230000000877 morphologic effect Effects 0.000 description 2
- 238000011084 recovery Methods 0.000 description 2
- 238000005070 sampling Methods 0.000 description 2
- 238000000926 separation method Methods 0.000 description 2
- 238000012546 transfer Methods 0.000 description 2
- 239000002699 waste material Substances 0.000 description 2
- 241000894006 Bacteria Species 0.000 description 1
- 244000290594 Ficus sycomorus Species 0.000 description 1
- 240000004808 Saccharomyces cerevisiae Species 0.000 description 1
- 230000003321 amplification Effects 0.000 description 1
- 238000013459 approach Methods 0.000 description 1
- 238000000098 azimuthal photoelectron diffraction Methods 0.000 description 1
- 239000011324 bead Substances 0.000 description 1
- 230000004397 blinking Effects 0.000 description 1
- 210000004369 blood Anatomy 0.000 description 1
- 239000008280 blood Substances 0.000 description 1
- 210000000601 blood cell Anatomy 0.000 description 1
- 238000012790 confirmation Methods 0.000 description 1
- 230000002596 correlated effect Effects 0.000 description 1
- 210000004748 cultured cell Anatomy 0.000 description 1
- 230000001419 dependent effect Effects 0.000 description 1
- 238000013461 design Methods 0.000 description 1
- 239000000975 dye Substances 0.000 description 1
- 235000013601 eggs Nutrition 0.000 description 1
- 238000005516 engineering process Methods 0.000 description 1
- 210000003743 erythrocyte Anatomy 0.000 description 1
- 210000001808 exosome Anatomy 0.000 description 1
- 239000000284 extract Substances 0.000 description 1
- 238000002073 fluorescence micrograph Methods 0.000 description 1
- 238000001506 fluorescence spectroscopy Methods 0.000 description 1
- 238000001215 fluorescent labelling Methods 0.000 description 1
- 238000012252 genetic analysis Methods 0.000 description 1
- 210000004602 germ cell Anatomy 0.000 description 1
- 239000011521 glass Substances 0.000 description 1
- 230000005484 gravity Effects 0.000 description 1
- 238000005286 illumination Methods 0.000 description 1
- 238000010191 image analysis Methods 0.000 description 1
- 238000002372 labelling Methods 0.000 description 1
- 210000000265 leukocyte Anatomy 0.000 description 1
- 239000002502 liposome Substances 0.000 description 1
- 239000000463 material Substances 0.000 description 1
- 238000003199 nucleic acid amplification method Methods 0.000 description 1
- 239000013307 optical fiber Substances 0.000 description 1
- 238000000399 optical microscopy Methods 0.000 description 1
- 230000001151 other effect Effects 0.000 description 1
- 238000002360 preparation method Methods 0.000 description 1
- 102000004169 proteins and genes Human genes 0.000 description 1
- 108090000623 proteins and genes Proteins 0.000 description 1
- 238000010223 real-time analysis Methods 0.000 description 1
- 230000009467 reduction Effects 0.000 description 1
- 230000000717 retained effect Effects 0.000 description 1
- 238000004904 shortening Methods 0.000 description 1
- 238000007619 statistical method Methods 0.000 description 1
- 239000000126 substance Substances 0.000 description 1
Images


Classifications
-
- G—PHYSICS
- G01—MEASURING; TESTING
- G01N—INVESTIGATING OR ANALYSING MATERIALS BY DETERMINING THEIR CHEMICAL OR PHYSICAL PROPERTIES
- G01N15/00—Investigating characteristics of particles; Investigating permeability, pore-volume, or surface-area of porous materials
- G01N15/10—Investigating individual particles
- G01N15/14—Electro-optical investigation, e.g. flow cytometers
Definitions
- the present disclosure relates to a particle analysis system, particle analysis method, and flow cytometer system.
- flow cytometry exists as a method for analyzing (or analyzing, in the present disclosure, analysis includes analysis) proteins of biologically relevant microparticles such as cells, microorganisms, and liposomes.
- a device used for this flow cytometry is called a flow cytometer (FCM).
- FCM flow cytometer
- microparticles flowing in a line in a channel are irradiated with a laser beam of a specific wavelength, and fluorescence, forward scattered light, side scattered light, and other light emitted from each microparticle is emitted as light.
- the type, size, structure, etc. of each microparticle can be determined by converting it into an electric signal by a detector, digitizing it, and performing statistical analysis on the result.
- microparticles In a particle analysis system that sorts microparticles, such as a cell sorter-type flow cytometer, it is necessary to check whether the microparticles are sorted correctly.
- the cells to be sorted are subjected to genetic analysis and culturing on a cell-by-cell basis.
- index sorting is used in which each identified cell is individually sorted into a well plate.
- more than a few errors occur, such as sorting two or more cells into the same well or failing to sort even a single cell.
- the present disclosure provides a particle analysis system, a particle analysis method, and a flow cytometer system capable of reducing work time.
- a particle analysis system includes an imaging unit that detects, as an event, a change in the brightness of light from particles in a container, and a focus position of the imaging unit on the container. a first scanning unit that scans in a depth direction; and a processing unit that measures the state inside the container based on events detected at a plurality of focal positions of the imaging unit by scanning by the first scanning unit.
- FIG. 1 is a schematic diagram showing a configuration example of a particle analysis system according to the present disclosure
- FIG. 2 is a block diagram showing a more specific configuration example of the particle analysis system according to the first embodiment
- FIG. 1 is a block diagram showing a schematic configuration example of an image sensor according to a first embodiment
- FIG. 1 is a block diagram showing a schematic configuration example of an EVS according to a first embodiment
- FIG. 3 is a block diagram showing a schematic configuration example of a particle number measuring unit according to the first embodiment
- FIG. FIG. 2 is a diagram showing a configuration example of a well plate according to the first embodiment
- FIG. 7 is a diagram showing an excerpt from the well plate shown in FIG. 6.
- FIG. 4 is a diagram for explaining a case of measuring bioparticles dispensed in each well using a frame-type image sensor; 9 is a diagram showing an example of image data acquired in the case shown in FIG. 8; FIG. FIG. 4 is a diagram for explaining a case of measuring bioparticles dispensed in each well using the EVS according to the first embodiment; 11 is a diagram showing an example of a three-dimensional map (hereinafter also referred to as a 3D map) constructed in the case shown in FIG. 10; FIG.
- 4 is a flow chart showing an example of a particle number measurement operation flow according to the first embodiment
- 6 is a flowchart showing an example of particle number measurement processing according to the first embodiment
- It is a figure which shows the number of particles measured by the particle number measurement process which concerns on 1st Embodiment (particle number 2).
- It is a figure which shows an example of the user interface which concerns on 1st Embodiment.
- FIG. 1 is a block diagram showing an example of a device form of a particle analysis system according to a first embodiment
- FIG. FIG. 4 is a block diagram showing another configuration example of the particle analysis system according to the first embodiment
- FIG. 7 is a block diagram showing a schematic configuration example of a particle number measuring unit according to a first modified example of the first embodiment
- FIG. 9 is a block diagram showing a schematic configuration example of a particle number measuring unit according to a second modified example of the first embodiment
- FIG. 9 is a block diagram showing an example of the schematic configuration of a particle number measuring unit according to the second embodiment; 9 is a flow chart showing an example of a particle number measurement operation flow according to the second embodiment; 1 is a hardware configuration diagram showing an example of a computer that implements functions of an information processing apparatus according to the present disclosure; FIG.
- index sorting in which the identified cells are sorted one by one into a well plate, it is important for the reliability of subsequent analysis and culturing processes that each well can be sorted with single cells as intended. Importantly, random disturbances in the sorting mechanism of the flow cytometer often cause errors such as sorting two or more cells into the same well or failing to sort even a single cell. do. It is desirable to detect such erroneous wells in advance and remove them prior to further processing.
- Optical microscopy is an effective method for detecting errors without damaging living cells.
- the depth of focus at an optical magnification that can detect cells with a size of about several micrometers is usually 0.1 mm (millimeter) or less, which is very small compared to the liquid depth in the well, which is about 10 mm. Therefore, in order to measure the number of cells in the liquid without omission, it is necessary to scan the focal plane of the optical microscope in the depth direction.
- the following embodiments provide a particle analysis system, a particle analysis method, and a flow cytometer system capable of reducing working time.
- particle analysis that can shorten the time required to confirm whether microparticles are correctly fractionated while suppressing increases in device cost and device size.
- Systems, particle analysis methods and flow cytometer systems are provided.
- FIG. 1 shows a schematic configuration example of a particle analysis system according to the present disclosure.
- a particle analysis system 100 shown in FIG. It includes an information processing unit 103 that processes information about light.
- Examples of particle analysis system 100 include, for example, flow cytometers and imaging flow cytometers.
- the particle analysis system 100 includes a sorting section 104 that sorts out specific microparticles (in this description, bioparticles) P in the biological sample S.
- FIG. An example of the particle analysis system 100 including the sorting unit 104 is a cell sorter.
- the biological sample S may be a liquid sample containing biological particles P.
- the bioparticles P are, for example, cells or non-cellular bioparticles.
- the biological particles P may be microorganisms such as yeast and bacteria.
- the cells may be living cells, and more specific examples include blood cells such as red blood cells and white blood cells, and germ cells such as sperm and fertilized eggs.
- the cells may be directly collected from a sample such as whole blood, or may be cultured cells obtained after culturing.
- the noncellular bioparticles include extracellular vesicles, particularly exosomes and microvesicles.
- the bioparticle P may be labeled with one or a plurality of labeling substances (for example, a dye (especially a fluorescent dye) and a fluorescent dye-labeled antibody).
- labeling substances for example, a dye (especially a fluorescent dye) and a fluorescent dye-labeled antibody.
- Particles other than biological particles may be analyzed by the particle analysis system 100 of the present disclosure, and beads or the like may be analyzed for calibration or the like.
- the flow path C can be configured so that the biological sample S flows, particularly such that the biological particles P contained in the biological sample S are arranged substantially in a line to form a flow.
- the flow channel structure including the flow channel C may be designed to form a laminar flow, and in particular, to form a laminar flow in which the flow of the biological sample S (sample flow) is surrounded by the flow of the sheath liquid.
- the design of the flow channel structure may be appropriately selected by those skilled in the art, and known ones may be adopted.
- the channel C may be formed in a flow channel structure such as a microchip (a chip having a channel on the order of micrometers) or a flow cell.
- the width of the flow channel C may be 1 mm (millimeter) or less, particularly 10 ⁇ m (micrometer) or more and 1 mm or less.
- the channel C and the channel structure including it may be made of a material such as plastic or glass.
- the apparatus of the present disclosure may be configured such that the biological sample S flowing in the flow path C, particularly the biological particles P in the biological sample S, is irradiated with light from the light irradiation unit 101 .
- the apparatus of the present disclosure may be configured such that the light irradiation point (interrogation point) for the biological sample S is in the channel structure in which the channel C is formed, or the light irradiation point is , may be configured to be outside the channel structure.
- the former there is a configuration in which the light is applied to the channel C in the microchip or the flow cell. In the latter, the light may be applied to the biological particles P after exiting the flow path structure (especially the nozzle section thereof).
- the light irradiation unit 101 includes a light source unit for detection that emits light and a light guiding optical system that guides the light to the channel C. As shown in FIG.
- the detection light source unit includes one or more light sources.
- the type of light source may be, for example, a laser light source or an LED (Light Emitting Diode).
- the wavelength of light emitted from each light source may be any wavelength of ultraviolet light, visible light, or infrared light.
- the light guiding optics include optical components such as beam splitter groups, mirror groups or optical fibers.
- the light guiding optics may also include a lens group for condensing the light, for example an objective lens.
- the number of light irradiation points on the biological sample S may be one or more.
- the light irradiation unit 101 may be configured to condense light irradiated from one or different light sources to one irradiation point.
- the detection unit 102 includes at least one photodetector that detects light generated by light irradiation of the particles by the light irradiation unit 101 .
- the light to be detected is, for example, fluorescent light, scattered light (for example, one or more of forward scattered light, backscattered light, and side scattered light), transmitted light, and reflected light.
- Each photodetector includes one or more photodetectors, such as a photodetector array.
- Each photodetector may include photodiodes such as one or more PMTs (photomultiplier tubes) and/or APDs (Avalanche Photodiodes) and MPPCs (Multi-Pixel Photon Counters) as light receiving elements.
- the photodetector includes, for example, a PMT array in which a plurality of PMTs are arranged in a one-dimensional direction.
- the detection unit 102 may also include an imaging device such as a CCD (Charge Coupled Device) or a CMOS (Complementary Metal-Oxide-Semiconductor).
- the detection unit 102 can acquire bioparticle information about the bioparticle P using the imaging device.
- the bioparticle information can include at least one of bioparticle images of bioparticles, bioparticle feature amounts, bioparticle attribute information, and the like.
- the bioparticle image of the bioparticle may include, for example, a brightfield image, a darkfield image, a fluorescence image, and the like.
- the detection unit 102 includes a detection optical system that causes light of a predetermined detection wavelength to reach a corresponding photodetector.
- the detection optical system includes a spectroscopic section such as a prism or a diffraction grating, or a wavelength separating section such as a dichroic mirror or an optical filter.
- the detection optical system may be configured, for example, to disperse the light from the bioparticle P and detect light in different wavelength ranges with a plurality of photodetectors, the number of which is greater than the number of fluorescent dyes.
- a flow cytometer including such a detection optical system is called a spectral flow cytometer.
- the detection optical system may be configured, for example, to separate the light corresponding to the fluorescence wavelength range of the fluorescent dye from the light from the bioparticle P and cause the separated light to be detected by the corresponding photodetector. .
- the detection unit 102 may include a signal processing unit that converts the electrical signal obtained by the photodetector into a digital signal.
- the signal processing unit may include an A/D converter as a device that performs the conversion.
- a digital signal obtained by conversion by the signal processing unit can be transmitted to the information processing unit 103 .
- the digital signal can be handled by the information processing section 103 as data related to light (hereinafter also referred to as “optical data”).
- the optical data may be optical data including fluorescence data, for example. More specifically, the light data may be light intensity data, and the light intensity may be light intensity data of light containing fluorescence (which may include feature amounts such as Area, Height, Width, etc.) good.
- the information processing unit 103 includes, for example, a processing unit that processes various data (for example, optical data) and a storage unit that stores various data.
- the processing unit can perform fluorescence leakage correction (compensation processing) on the light intensity data.
- the processing unit performs fluorescence separation processing on the optical data and acquires light intensity data corresponding to the fluorescent dye.
- the fluorescence separation process may be performed, for example, according to the unmixing method described in JP-A-2011-232259.
- the processing unit may acquire morphological information of the biological particles P based on the image acquired by the imaging device.
- the storage unit may be configured to store the acquired optical data.
- the storage unit may further be configured to store spectral reference data used in the unmixing process.
- the particle analysis system 100 includes a sorting unit 104, which will be described later, and the information processing unit 103 can determine whether to sort the biological particles P based on the optical data and/or the morphological information. Then, the information processing section 103 can control the sorting section 104 based on the result of the determination, and sorting of the bioparticles P by the sorting section 104 can be performed.
- the information processing unit 103 may be configured to output various data (for example, optical data and images). For example, the information processing section 103 can output various data (for example, two-dimensional plots, spectral plots, etc.) generated based on the optical data. Further, the information processing unit 103 may be configured to be able to receive input of various data, and for example, receives gating processing on the plot by the user.
- the information processing unit 103 may include an output unit (such as a display) or an input unit (such as a keyboard) for executing the output or the input.
- the information processing unit 103 may be configured as a general-purpose computer, and may be configured as an information processing device including, for example, a CPU (Central Processing Unit), RAM (Random Access Memory), and ROM (Read only memory).
- the information processing unit 103 may be included in the housing in which the light irradiation unit 101 and the detection unit 102 are provided, or may be outside the housing.
- Various processing or functions by the information processing unit 103 may be implemented by a server computer or cloud connected via a network.
- the sorting unit 104 can sort the bioparticles P according to the determination result by the information processing unit 103, for example.
- the sorting method may be a method of generating a droplet containing the biological particles P by vibration, applying an electric charge to the droplet to be sorted, and controlling the traveling direction of the droplet with an electrode.
- the sorting method may be a method of sorting by controlling the traveling direction of the bioparticles P in the channel structure.
- the channel structure is provided with a control mechanism, for example, by pressure (jetting or suction) or electric charge.
- the channel C has a channel structure in which the channel C is branched into a recovery channel and a waste liquid channel downstream thereof, and the specific biological particles P are recovered in the recovery channel.
- a chip for example, a chip described in Japanese Patent Application Laid-Open No. 2020-76736, can be used.
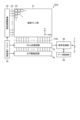
- FIG. 2 is a block diagram of a more specific configuration example of the particle analysis system according to this embodiment.
- the particle analysis system may be configured as a system in which a plurality of devices are combined.
- the particle analysis system 100 includes a detection light source unit 111 and a light guide optical system 112 that constitute a light irradiation unit 101, a detection optical system 121 that constitutes a detection unit 102, an imaging 122, a signal processing unit 123, a velocity measurement unit 124, an information processing unit 103, a sorting unit 104, and a particle number measurement unit 105. Images of the emitted fluorescence, reflected light and/or transmitted light are observed in real time, and the target bioparticles P are dispensed into the wells of the well plate 20 based on the observation results.
- the detection light source unit 111, the light guide optical system 112, the detection optical system 121, the information processing unit 103, and the fractionation unit 104 may be the same as those described above with reference to FIG.
- the light output from the detection light source unit 111 (hereinafter also referred to as excitation light) is condensed by the light guiding optical system 112 .
- the condensed light irradiates the bioparticles P flowing at high speed in the channel C through which the biosample S with the bioparticles P floating is flowed.
- Reflected light or transmitted light and/or fluorescence emitted from the biological particles P irradiated with light are imaged on the light receiving surface of the imaging unit 122 through the detection optical system 121 .
- the imaging unit 122 has, for example, pixels arranged in a two-dimensional grid.
- the imaging unit 122 may be a frame-type image sensor that outputs image data (also referred to as frame data) at a predetermined frame rate, or may include event pixels that detect an event based on a change in luminance of incident light. It may be an EVS (Event-based Vision Sensor) arranged in a two-dimensional grid. Although the details will be described later, the EVS includes position information (X address and Y address) of the pixel where the event was detected, polarity information (positive event/negative event) of the detected event, and It may be a sensor that synchronously or asynchronously outputs event data including information (timestamp) of the time when an event was detected.
- image data also referred to as frame data
- EVS Event-based Vision Sensor
- Frame data acquired at a predetermined frame rate in the imaging unit 122, or a series of event data (hereinafter referred to as event stream ) is sent to the signal processing unit 123 .
- the speed measurement unit 124 measures the relative speed of the biological particles P flowing through the flow path C with respect to the speed measurement unit 124, for example. In this example, since the case where the speed measuring unit 124 is stationary with respect to the flow channel C is illustrated, the speed measuring unit 124 measures the speed of the biological particles P in the following description.
- Various detection methods capable of detecting the speed of the biological particles P such as an electrostatic method and an optical method, may be adopted for this speed measurement unit 124 .
- the velocity of the biological particles P detected by the velocity measuring section 124 is sent to the signal processing section 123 at any time.
- the speed of the biological particles P flowing through the flow path C is controlled so as to be maintained at a desired speed by controlling the pump system for feeding the biological sample S
- the speed of the biological particles P is known.
- the velocity measurement unit 124 may be omitted.
- the velocity of the biological particles P may fluctuate due to changes in the ambient temperature, the resistance of the liquid feeding system, and the like. may
- the signal processing unit 123 performs predetermined processing such as white balance adjustment and distortion correction on the input frame data, and outputs the processed frame data. It is sent to the information processing section 103 .
- the signal processing unit 123 reconstructs frame data of the image of the biological particles P from the event stream input from the imaging unit 122 and the velocity of the biological particles P, and reconstructs the frame data. The received frame data is sent to the information processing section 103 .
- the velocity of the bioparticles P used to reconstruct the frame data is not limited to the velocity of the bioparticles P themselves included in the reconstructed frame data. , an average value, or the like.
- the information processing unit 103 analyzes the frame data input from the signal processing unit 123, corrects to offset the rotation of the biological particles P moving in the flow channel C, extracts the feature amount, and determines the type of the biological particles P. , etc., is executed.
- the information processing unit 103 may also include a display unit, and present bioparticle information used for analysis, feature amounts and statistical data based on analysis results, classification results, and the like to the user. Further, the information processing section 103 may control the sorting section 104 based on the type determination result of the bioparticles P to separate and collect the bioparticles P of a specific type.
- the sorting unit 104 sorts the bioparticles P moving in the channel C one by one into each well of the well plate 20 based on the result of the type discrimination of the bioparticles P by the information processing unit 103 . Specific types of biological particles P are collected separately in the wells of the well plate 20 .
- the particle number measuring unit 105 which will be described in detail later, includes a light source unit, an imaging unit, and a scanning mechanism. By scanning, the number of bioparticles P dispensed into each well is counted.
- FIG. 3 is a block diagram showing a schematic configuration example of a frame-type image sensor according to this embodiment.
- a CMOS (Complementary Metal-Oxide-Semiconductor) type image sensor is exemplified, but it is not limited to this, and a CCD (Charge-Coupled Device) type or the like can acquire color or monochrome image data.
- CMOS Complementary Metal-Oxide-Semiconductor
- CCD Charge-Coupled Device
- the CMOS image sensor may be an image sensor manufactured by applying or partially using a CMOS process.
- the image sensor 122a has, for example, a stacked structure in which a semiconductor chip in which the pixel array section 31 is formed and a semiconductor chip in which a peripheral circuit is formed are stacked.
- Peripheral circuits may include, for example, a vertical drive circuit 32 , a column processing circuit 33 , a horizontal drive circuit 34 and a system controller 35 .
- the image sensor 122a further includes a signal processing section 38 and a data storage section 39.
- the signal processing unit 38 and the data storage unit 39 may be provided on the same semiconductor chip as the peripheral circuit, or may be provided on a separate semiconductor chip.
- the pixel array section 31 has a configuration in which pixels 30 each having a photoelectric conversion element that generates and accumulates an electric charge according to the amount of received light are arranged in a two-dimensional lattice in rows and columns, that is, in rows and columns.
- the row direction refers to the arrangement direction of pixels in a pixel row (horizontal direction in the drawing)
- the column direction refers to the arrangement direction of pixels in a pixel column (vertical direction in the drawing).
- pixel drive lines LD are wired along the row direction for each pixel row, and vertical signal lines VSL are wired along the column direction for each pixel column, with respect to the matrix-like pixel array.
- the pixel drive line LD transmits a drive signal for driving when reading a signal from a pixel.
- the pixel drive lines LD are shown as wirings one by one, but the number of the pixel drive lines LD is not limited to one each.
- One end of the pixel drive line LD is connected to an output terminal corresponding to each row of the vertical drive circuit 32 .
- the vertical drive circuit 32 is composed of a shift register, an address decoder, etc., and drives each pixel of the pixel array section 31 simultaneously or in units of rows. That is, the vertical drive circuit 32 constitutes a drive section that controls the operation of each pixel of the pixel array section 31 together with a system control section 35 that controls the vertical drive circuit 32 .
- the vertical drive circuit 32 generally has two scanning systems, a readout scanning system and a discharge scanning system, although the specific configuration thereof is not shown.
- the readout scanning system sequentially selectively scans the pixels 30 of the pixel array section 31 row by row in order to read out signals from the pixels 30 .
- a signal read out from the pixel 30 is an analog signal.
- the sweep-scanning system performs sweep-scanning ahead of the read-out scanning by the exposure time for the read-out rows to be read-scanned by the read-out scanning system.
- a so-called electronic shutter operation is performed by sweeping out (resetting) the unnecessary charges in this sweeping scanning system.
- the electronic shutter operation means an operation of discarding the charge of the photoelectric conversion element and newly starting exposure (starting charge accumulation).
- the signal read out by the readout operation by the readout scanning system corresponds to the amount of light received after the immediately preceding readout operation or the electronic shutter operation.
- the period from the readout timing of the previous readout operation or the sweep timing of the electronic shutter operation to the readout timing of the current readout operation is a charge accumulation period (also referred to as an exposure period) in the pixels 30 .
- a signal output from each pixel 30 in a pixel row selectively scanned by the vertical drive circuit 32 is input to the column processing circuit 33 through each vertical signal line VSL for each pixel column.
- the column processing circuit 33 performs predetermined signal processing on a signal output from each pixel of the selected row through the vertical signal line VSL for each pixel column of the pixel array section 31, and temporarily stores the pixel signal after the signal processing. to be retained.
- the column processing circuit 33 performs at least noise removal processing, such as CDS (Correlated Double Sampling) processing and DDS (Double Data Sampling) processing, as signal processing.
- CDS Correlated Double Sampling
- DDS Double Data Sampling
- the CDS processing removes pixel-specific fixed pattern noise such as reset noise and variations in threshold values of amplification transistors in pixels.
- the column processing circuit 33 also has an AD (analog-digital) conversion function, for example, and converts analog pixel signals read from the photoelectric conversion elements into digital signals and outputs the digital signals.
- AD analog-digital
- the horizontal driving circuit 34 is composed of shift registers, address decoders, etc., and sequentially selects readout circuits (hereinafter referred to as pixel circuits) corresponding to the pixel columns of the column processing circuit 33 .
- pixel circuits readout circuits
- the system control unit 35 is composed of a timing generator that generates various timing signals. and other drive control.
- the signal processing unit 38 has at least an arithmetic processing function, and performs various signal processing such as arithmetic processing on pixel signals output from the column processing circuit 33 .
- the data storage unit 39 temporarily stores data necessary for signal processing in the signal processing unit 38 . Note that if the signal processing unit 38 has arithmetic functions such as white balance adjustment and distortion correction, the signal processing unit 123 in FIG. 2 may be omitted.
- FIG. 4 is a block diagram showing a schematic configuration example of the EVS according to this embodiment.
- the EVS 122b includes a pixel array section 41, an X arbiter 42 and a Y arbiter 43, an event signal processing circuit 44, a system control circuit 45, and an output interface (I/F) 46.
- the pixel array section 41 has a configuration in which a plurality of event pixels 40 each detecting an event based on a change in luminance of incident light are arranged in a two-dimensional lattice.
- the row direction also referred to as row direction
- the column direction also referred to as column direction
- the arrangement of pixels in pixel columns It refers to the direction (vertical direction in the drawing).
- Each event pixel 40 has a photoelectric conversion element that generates a charge corresponding to the luminance of incident light, and requests reading from itself when a change in luminance of incident light is detected based on a photocurrent that flows from the photoelectric conversion element. request to the X arbiter 42 and the Y arbiter 43, and according to the arbitration by the X arbiter 42 and the Y arbiter 43, an event signal indicating that an event has been detected is output.
- Each event pixel 40 detects the presence or absence of an event depending on whether or not the photocurrent corresponding to the luminance of incident light has changed by exceeding a predetermined threshold. For example, each event pixel 40 detects, as an event, that the luminance change exceeds (positive event) or falls below (negative event) a predetermined threshold.
- the event pixel 40 When the event pixel 40 detects an event, it outputs a request to the X arbiter 42 and the Y arbiter 43 to request permission to output an event signal representing the occurrence of the event. Then, the event pixel 40 outputs the event signal to the event signal processing circuit 44 when receiving a response indicating permission to output the event signal from each of the X arbiter 42 and the Y arbiter 43 .
- the X arbiter 42 and the Y arbiter 43 arbitrate requests requesting the output of event signals supplied from the plurality of event pixels 40 respectively, and respond based on the arbitration results (permission/non-permission of event signal output), and , sends a reset signal for resetting event detection to the event pixel 40 that output the request.
- the event signal processing circuit 44 generates and outputs event data by executing predetermined signal processing on the event signal input from the event pixel 40 .
- the change in the photocurrent generated by the event pixel 40 can also be regarded as the change in the amount of light (luminance change) incident on the photoelectric conversion portion of the event pixel 40 . Therefore, an event can also be said to be a light amount change (brightness change) of the event pixel 40 exceeding a predetermined threshold.
- the event data representing the occurrence of an event includes at least position information such as coordinates representing the position of the event pixel 40 where the change in the amount of light has occurred as an event.
- the event data can include the polarity of the change in the amount of light in addition to the positional information.
- the event data is the relative time when the event occurred. It can be said that it implicitly includes time information representing
- the event signal processing circuit 44 includes time information such as a time stamp in the event data representing the relative time when the event occurred before the interval between the event data is no longer maintained as it was when the event occurred. good too.
- the system control circuit 45 is composed of a timing generator that generates various timing signals, and controls the X arbiter 42, the Y arbiter 43, the event signal processing circuit 44, etc. based on the various timings generated by the timing generator. drive control.
- the output I/F 46 sequentially outputs the event data output in units of rows from the event signal processing circuit 44 to the signal processing section 123 as an event stream.
- the signal processing unit 123 generates image data (also referred to as frame data) at a predetermined frame rate by accumulating event data input as an event stream for a predetermined frame period.
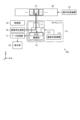
- FIG. 5 is a block diagram showing a schematic configuration example of the particle number measuring unit according to this embodiment.
- the particle number measuring unit 105 includes a camera unit 10, an in-plane scanning mechanism 15, an imaging light source unit 16, a data processing unit 17, a display unit 18, and a control unit 19. .
- Imaging light source unit 16 The imaging light source unit 16 outputs excitation light for exciting the bioparticles P dispensed into the wells of the well plate 20, similarly to the detection light source unit 111 in FIG.
- the camera unit 10 includes an objective lens 11 , a beam splitter 12 , an imaging section 13 and a vertical scanning mechanism 14 .
- the beam splitter 12 includes, for example, a spectral beam splitter such as a dichroic mirror that reflects light in a specific wavelength band and transmits light in other specific wavelength bands. It reflects the excitation light and transmits fluorescence emitted from the bioparticles P in the well irradiated with the excitation light.
- a spectral beam splitter such as a dichroic mirror that reflects light in a specific wavelength band and transmits light in other specific wavelength bands. It reflects the excitation light and transmits fluorescence emitted from the bioparticles P in the well irradiated with the excitation light.
- the objective lens 11 is composed of, for example, one or more lenses and a lens barrel that holds them.
- the objective lens 11 converges the excitation light reflected by the beam splitter 12 so as to irradiate the entire one well to be observed in the well plate 20 .
- the objective lens 11 also functions as an imaging lens that forms an image of the fluorescence emitted from the bioparticles P in the well irradiated with the excitation light on the light receiving surface of the imaging unit 13 .
- the beam splitter 12 or the imaging unit 13 has an imaging lens that forms a fluorescent image, the objective lens 11 does not have to function as an imaging lens.
- the vertical scanning mechanism 14 is a scanning unit that scans the focal position of the objective lens 11 along the Z direction, that is, along the depth direction of each well in the well plate 20 .
- This vertical scanning mechanism 14 may scan the focal position of the objective lens 11 in the depth direction of the well by moving the objective lens 11 in the Z direction. (or a plate to which the structure is fixed) may be moved in the Z direction to scan the focal position of the objective lens 11 in the depth direction of the well.
- the focal position of the objective lens 11 may be scanned in the depth direction of the well by moving one or more of the one or more lenses. Further, the vertical scanning mechanism 14 may scan the focal position of the objective lens 11 from the bottom side of the well toward the top side, or may scan the well from the top side toward the bottom side.
- the focal position of the objective lens 11 is recorded in a storage unit such as a memory (not shown) at two or more different points in time.
- the focal position of the objective lens 11 may be recorded at predetermined time intervals, and may be recorded together with the recording time (time stamp, etc.).
- the recorded focal position of the objective lens 11 it is possible to estimate the focal position where the event data is detected based on the elapsed time from the start of scanning and the time stamp included in the event data. This also makes it possible to construct a more accurate 3D map.
- the focal position can be estimated based on the elapsed time from the start of scanning.
- the imaging unit 13 includes an EVS 131.
- An image of fluorescence emitted from the biological particles P in the well is formed on the light receiving surface of the EVS 131 .
- the EVS 131 may have, for example, the same configuration as the EVS 122b illustrated in FIG.
- the in-plane scanning mechanism 15 is a scanning mechanism for sequentially changing the wells positioned on the optical axis of the objective lens 11 in the well plate 20, that is, the wells to be observed. For example, the in-plane scanning mechanism 15 horizontally moves the well plate 20 one well at a time within the XY plane, thereby sequentially replacing the wells positioned on the optical axis of the objective lens 11 .
- an in-plane scanning mechanism 15 is provided in the camera unit 10, and a structure composed of the objective lens 11, the beam splitter 12, and the imaging section 13 (may include the imaging light source section 16). may be horizontally moved to sequentially replace the wells located on the optical axis of the objective lens 11 .
- the data processing unit 17 converts an event stream input from the imaging unit 13 along with vertical scanning of the focal plane of the objective lens 11 into a 3D image in which events are mapped in a three-dimensional space consisting of a pixel coordinate axis and an event occurrence time axis. build a map. Then, the data processing unit 17 counts the number of bioparticles P sorted into each well based on the constructed 3D map. At that time, the data processing unit 17 may specify the position of the bioparticle P in each well. For example, the data processing unit 17 converts the time axis in the constructed 3D map to the position in the Z direction and creates the three-dimensional spatial coordinates of each well, thereby detecting the number and position of the bioparticles P in each well. You may
- the data processing unit 17 Based on the measured number and position of the bioparticles P, the data processing unit 17 also determines how many bioparticles P are collected in each well of the well plate 20 and where in each well the bioparticles P are present.
- a user interface (hereinafter also simply referred to as UI) for presenting to the user whether or not, etc. may be generated and displayed on the display unit 18 .
- the display unit 18 is configured by, for example, a display, and displays the UI generated by the data processing unit 17 to the user. Moreover, the display unit 18 may display a three-dimensional map of each well generated by the data processing unit 17 .
- the display unit 18 may be a display unit of a smartphone, a tablet terminal, a personal computer, or the like instead of the display.
- the data processing unit 17 and the display unit 18 may have a communication unit for communicating via a predetermined network.
- control unit 19 The control unit 19 is composed of, for example, an information processing device such as a CPU (Central Processing Unit), and controls the operation of each unit of the particle number measuring unit 105 in an integrated manner.
- an information processing device such as a CPU (Central Processing Unit)
- CPU Central Processing Unit
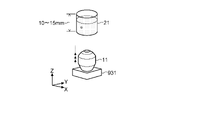
- FIG. 6 is a diagram showing a configuration example of a well plate according to this embodiment.
- FIG. 7 is a diagram showing a portion of the well plate shown in FIG. 6.
- well plate 20 is configured such that wells 21, which are containers for sorting bioparticles P whose falling trajectory has been changed by sorting section 104, are arranged in a matrix and held by frame 22.
- the opening shape and/or horizontal cross-sectional shape of each well 21 may be circular, elliptical, or polygonal such as triangular, quadrangular, or hexagonal.
- a 96-well plate or a 384-well plate may be used.
- the container for sorting the bioparticles P is not limited to the well, and a liquid drop standing on a plate may be used as the vessel for sorting the bioparticles P.
- Each well 21 is configured using a member transparent to excitation light emitted from the imaging light source unit 16 and fluorescence emitted from the biological particles P, which will be described later.
- the bottom of the frame 22 that supports each well 212 may also be made of a member transparent to excitation light and fluorescence.
- the excitation light is irradiated from the bottom side of each well 21 (however, the beam splitter 12 is omitted) is illustrated, but the present invention is not limited to this.
- the excitation light may be irradiated from the opening side (upper side) of 21 . In that case, the beam splitter 12 in the camera unit 10 may be omitted.
- each well 21 has an opening of about 3 to 7 mm, for example, in order to ensure the sorting accuracy of the bioparticles P whose falling trajectory is controlled by the sorting section 104, for example.
- each well 21 has a depth of about 10-15 mm in order to sufficiently reduce the impact applied to the biological particles P during collection.
- a predetermined liquid for example, a sheath liquid
- the number of bioparticles P is measured by the particle number measurement unit 105 according to the present embodiment, that is, when the bioparticles P are correctly dispensed into the wells 21 of the well plate 20.
- FIG. 8 is a diagram for explaining the case of measuring bioparticles dispensed into each well using a frame-type image sensor
- FIG. 9 shows image data acquired in the case shown in FIG. It is a figure which shows an example.
- FIG. 10 is a diagram for explaining the case of measuring bioparticles dispensed in each well using EVS
- FIG. 11 is a three-dimensional map (hereinafter referred to as a , also referred to as a 3D map).
- the entire horizontal cross section of the well 21 with a diameter of several mm can be imaged at a resolution that can detect biological particles P with a diameter of several macrometers.
- Imaging with a number of pixels of one million or more, which is necessary to fit in a corner, is performed over a depth of ten-odd millimeters with a depth of focus of approximately 0.1 mm.
- the well 21 has a diameter of 3 to 7 mm and a depth of 10 to 15 mm, it is necessary to perform 100 to 100-odd times of imaging with one million or more pixels. Therefore, even if the pixel gradation is assumed to be 8 bits, for example, the total amount of image data that needs to be acquired and transferred will be a huge amount of 800 Mbits (megabits) or more. is required.
- the vertical scanning mechanism 14 scans the focal position of the objective lens 11 in the depth direction of the well 21 at an arbitrary speed that is not necessarily constant.
- the fluorescent image of the biological particles P formed on the light receiving surface of the EVS 131 is at the focal point.
- the position is far from the bioparticle P, it does not have enough brightness to confirm its existence, and as the focal position approaches the bioparticle P, it changes from a blurred state to a clear state, and the focal position matches the bioparticle P.
- the clearest state is obtained when the As the focal position moves away from the biological particle P, the clear state changes to a blurred state.
- the EVS 131 detects the luminance change while the vertical scanning mechanism 14 is scanning the well 21 in the depth direction, and the time axis t corresponds to the depth direction in the well 21.
- the position of the bioparticle P in the well 21 in the depth direction can be specified by additionally installing means for detecting and storing the scanning position in the depth direction at the time when the event occurs.
- means for detecting and storing the scanning position there is a position sensor that performs reading and recording in conjunction with detection of an event corresponding to the bioparticle P.
- the shape of the generated event group corresponding to the fluorescence of the bioparticle P obtained by scanning the focal position of the objective lens 11 in the depth direction on the 3D map is an hourglass-like shape extending in the scanning direction. .
- the EVS 131 synchronously or asynchronously outputs the event as an event when the light incident on each event pixel 40 changes to increase or decrease. Therefore, event data is not output from the event pixels 40 that do not change in brightness, and the event data is instantaneously output asynchronously when an event occurs. With a smaller amount of data transfer and data processing compared to the image sensor of the above, detection of the biological particles P is possible with a faster response.
- the vertical scanning mechanism 14 since there is no need to synchronize the pixel readout timing with the vertical scanning position, high positional accuracy and high speed control by the vertical scanning mechanism 14 are not required. For example, using a simple configuration in which the vertical scanning mechanism 14 simply shifts the camera unit 10 from the start point to the end point of vertical scanning by means of a spring, the liquid depth of 10 mm can be scanned in several hundred milliseconds. Even in this case, the number of bioparticles P present in the well 21 can be accurately measured. As a result, it is possible to reduce the cost and size of the vertical scanning mechanism 14 while shortening the measurement time to about 1/10 compared to when a frame-type image sensor is used (for example, several seconds).
- FIG. 12 is a flow chart showing an example of the particle number measurement operation flow according to this embodiment. Note that the operation shown in FIG. 12 may be controlled by the control unit 19, so the following description focuses on the operation of the control unit 19.
- FIG. 12 is a flow chart showing an example of the particle number measurement operation flow according to this embodiment. Note that the operation shown in FIG. 12 may be controlled by the control unit 19, so the following description focuses on the operation of the control unit 19.
- FIG. 12 is a flow chart showing an example of the particle number measurement operation flow according to this embodiment. Note that the operation shown in FIG. 12 may be controlled by the control unit 19, so the following description focuses on the operation of the control unit 19. FIG.
- the control unit 19 starts driving the imaging light source unit 16 (step S101).
- the well plate 20 is irradiated with the excitation light output from the imaging light source unit 16 through the objective lens 11 .
- the EVS 131 of the imaging unit 13 may be activated.
- the control unit 19 controls the vertical scanning mechanism 14 to move, for example, the focal position (also referred to as the focal plane) of the objective lens 11 to the initial position (step S102).
- the initial position may be a position corresponding to the bottom surface of the well 21 when the well 21 is scanned from the bottom surface to the top surface, and may be a position corresponding to the top surface of the well 21 when the well 21 is scanned from the top surface to the bottom surface. .
- control unit 19 controls the in-plane scanning mechanism 15 to move the well plate 20, thereby arranging the observation target wells 21 within the angle of view of the imaging unit 13 (step S103).
- the in-plane scanning mechanism 15 horizontally moves the well plate 20 so that the center of the well 21 to be observed is positioned on the optical axis of the EVS 131 .
- the wells 21 to be observed may be selected in order from the wells 21 positioned at any of the four corners of the well plate 20, for example.
- control unit 19 controls the vertical scanning mechanism 14 to scan the focal position of the objective lens 11 from the initial position in the depth direction, and acquires event data output from the EVS 131 during the scanning (step S104).
- the event data output from the EVS 131 is input to the data processing unit 17 and accumulated in a predetermined storage area for each well 21.
- control unit 19 instructs the data processing unit 17 based on the event data accumulated in association with the well 21 to be observed to determine the number and/or position of the bioparticles P collected in the well 21 to be observed. is executed (step S105). Details of the particle number measurement process will be described later with reference to FIG. 13 . Further, in step S105, the data processing section 17 may generate a 3D map of each well 21. FIG.
- control unit 19 determines whether or not the particle number counting process has been executed for all the wells 21 from which the bioparticles P are sorted in the well plate 20 (step S106), If not executed (NO in step S106), the process returns to step S102 and the subsequent operations are executed for the next well 21.
- step S106 if the particle number counting process has already been executed for all the wells 21 that are selected as collection destinations (YES in step S106), the control unit 19 stops driving the imaging light source unit 16 (step S107).
- control unit 19 presents the number and/or positions of the bioparticles P per well 21 to the user based on the number and positions of the bioparticles P per well 21 measured in step S105. is generated (step S108), the generated UI is displayed on the display unit 18 (step S109), and then this operation is terminated.
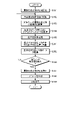
- FIG. 13 is a flowchart showing an example of particle number measurement processing according to this embodiment.
- the data processing unit 17 first constructs a 3D map (for example, see FIG. 11) of the well 21 to be observed from the event data acquired in step S104 of FIG. (Step S120).
- the data processing unit 17 selects one of the event data (target event) included in the 3D map (step S121).
- the target event may be selected based on, for example, a time stamp, pixel position information, or the like.
- target events may be selected in chronological order from event data indicated by timestamps, or target events may be selected in order from the upper left event pixel 40 in the pixel array section 41 along the X direction.
- the data processing unit 17 measures the number of events (hereinafter also referred to as neighboring events) that occurred in the vicinity of the selected target event (hereinafter also referred to as the number of neighboring events) (step S122).
- the nearby event may be, for example, an event located nearby in the X-axis direction and the Y-axis direction (that is, in the XY plane), or an event located in the X-axis direction, the Y-axis direction, and the t-axis direction (that is, the XYt space) may be events located nearby.
- the neighborhood may be an area within a predetermined number of pixels (for example, 5 pixels) in the X-axis direction and the Y-axis direction with respect to the event pixel 40 where the target event is detected, as long as it is on the XY plane. If it is on the axis, it may be within a predetermined time (for example, several tens of microseconds) from the time indicated by the time stamp of the target event.
- the data processing unit 17 determines whether the number of neighboring events measured in step S122 is equal to or greater than a preset threshold. (Step S122). If the number of neighboring events is less than the threshold (NO in step S122), the data processing unit 17 determines that the target event is noise (step S124), and proceeds to step S128.
- the data processing unit 17 determines that the event is an event to be measured derived from the biological particle P.
- a group of events including the target event is specified from accumulated event data or a 3D map constructed from these event data. can also be performed (step S125).
- the data processing unit 17 excludes the event data included in the event group identified in step S125 from the target event candidates in step S121 in order to prevent duplicate counting of the same bioparticle P (step S126).
- the data processing unit 17 counts up the number of bioparticles P in the observation target well 21 (step S127), and proceeds to step S128. At that time, the data processing unit 17 determines the position of the center of the distribution range or the center of gravity specified as the group of events, that is, the event group corresponding to one biological particle P in step S125. It may be specified as the position of the particle P.
- step S127 instead of counting the number of bioparticles P in the well 21 to be observed, the positions of the bioparticles P in the well 21 to be observed may be measured. At that time, when two or more bioparticles P are present in the well 21, the position of each bioparticle P may be measured.
- step S1208 the data processing unit 17 determines whether or not all event data included in the 3D map (excluding the excluded event data) have been selected as target events in step S121. If so (YES in step S128), this operation is terminated. Thereby, the particle number measurement operation shown in FIG. 12 proceeds to the next step S106. On the other hand, if unselected event data exists (NO in step S128), the data processing unit 17 returns to step S121, selects the unselected event data as the target event, and executes the subsequent operations.
- steps S123 and S124 of FIG. 13 if the number of event data located near the target event is equal to or less than a predetermined threshold (NO in step S123), in other words, if the target event is an isolated event,
- a predetermined threshold NO in step S123
- the determination as to whether the target event is based on the biological particles P or the noise is not limited to the above method, and various modifications are possible. may be For example, if the distribution shape of the event data distributed in a certain amount of time has a predetermined shape (for example, an hourglass shape), the event data belonging to the event group is the event data in which the bioparticle P is detected. It may be determined that there is event data, and other event data may be determined to be noise.
- the particle number counting process performed for each well 21 may be performed each time each well 21 is vertically scanned, or after the vertical scanning for all wells 21 is completed, for all wells 21 They may be executed collectively.
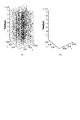
- FIGS. 14 to 16 are diagrams showing the number of particles measured by the particle number measurement processing according to the present embodiment, and FIG. FIG. 15 shows a case where one bioparticle P has been collected in the well 21, and FIG. 16 shows a case where two bioparticles P have been collected in the well 21.
- showing. 14 to 16 (a) are 3D maps showing all the event data output from the EVS 131
- FIGS. 14 to 16 (b) are 3D maps of the event data shown in (a).
- 2 is a 3D map showing bioparticles P extracted from .
- the in-plane axes X and Y are the pixel coordinates of the sensor
- the vertical axis Time is the event occurrence time.
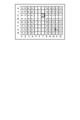
- FIG. 17 is a diagram showing an example of the UI presented to the user in step S109 of FIG.
- the squares corresponding to the wells 21 of the well plate 20 are arranged according to the arrangement of the wells 21 of the well plate 20 .
- This array may be given an index (A to H, 1 to 12) for identifying each row and each column.
- Each square displays the number of bioparticles P dispensed in the corresponding well 21 .
- squares that are less than the prescribed number (one in this example) or larger than the prescribed number may be highlighted using visual effects such as color, blinking, or bold.
- information indicating the position of the bioparticle P in the well 21 may be displayed in each square.
- the positions corresponding to the positions of the bioparticles P in the XY plane in the well 21 may be displayed by dots in the grid.
- a two-dimensional map hereinafter also referred to as a 2D map
- a 3D map of the well 21 corresponding to the square selected by the user using an input interface such as a mouse, keyboard, or touch panel is displayed when the screen or window is switched or a new window is displayed. and so on may be displayed to the user.
- the 2D map may be image data of the XY plane in which the biological particles P are present in the 3D map, or may be image data created from a 3D map constructed from event data.
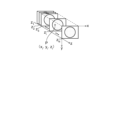
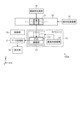
- a particle identification mechanism 52 for example, the light irradiation unit 101, the detection unit 102 and information processing unit 103
- an index sorting mechanism 53 e.g., corresponding to the sorting unit 104 in FIG.
- a sorter-type flow cytometer (equivalent to the flow cytometer 100A in FIG. 19) that analyzes and fractionates a sample 51 containing particles P may be of a built-in type in which the particle number measuring unit 105 is incorporated. , as shown in FIG. 19, a separate type in which a particle number measuring device 100B having a particle number measuring unit 105 is provided separately from the sorter type flow cytometer 100A.
- the in-plane scanning mechanism 55 that moves the well plate 20 for index sorting may be used as it is as the in-plane scanning mechanism 15 of the particle number measuring unit 105 .
- the index-sorted well plate 20 is taken out from the flow cytometer 100A and placed on the particle number measuring device 100B to count the bioparticles P collected in each well 21. is executed.
- photographing by a camera is effective for non-contact measurement of the number of biological particles P floating in the liquid filled in the well 21.
- the depth of the liquid is large relative to the focal depth of the camera, it is necessary to scan the focal plane of the camera in the depth direction of the container in order to count the number of particles without omission.
- the EVS 131 which is an event-type image sensor
- scanning in the depth direction can be performed continuously and at high speed.
- the number of fractionated particles can be accurately measured in a shorter time, so damage to the biological particles P can be minimized.
- the simplification of the scanning mechanism in the depth direction makes it possible to reduce the size and cost of the device.
- FIG. 20 is a block diagram showing a schematic configuration example of a particle number measuring unit according to a first modification of the present embodiment.
- the particle number measurement unit 105A according to this modification has the same configuration as the particle number measurement unit 105 described in the first embodiment with reference to FIG. It is configured to illuminate the well 21 from above. Also, the beam splitter 12 in the camera unit 10 is omitted in accordance with this change in illumination direction.
- the configuration of the camera unit 10 can be further simplified.
- FIG. 21 is a block diagram showing a schematic configuration example of a particle number measuring unit according to a second modification of the present embodiment.
- the particle number measuring unit 105B according to this modification has the same configuration as the particle number measuring unit 105 according to the first embodiment, but the vertical scanning mechanism 14 scans the well plate 20 in the depth direction. configured to scan.
- the configuration for scanning the focal position of the objective lens 11 in the depth direction may be modified in various ways as long as the relative position between the objective lens 11 and the well plate 20 is changed in the depth direction.
- vertically scanning the well plate 20 as in this modification it is possible to use a simpler scanning mechanism than when vertically scanning the camera unit 10 side. Miniaturization and cost reduction are also possible.
- the fluorescence emitted from the bioparticles P is observed by the EVS 131, and the number of the bioparticles P dispensed into each well 21 is calculated.
- the configuration is not limited to such a configuration.
- a half mirror or the like may be used as the beam splitter 12 instead of the spectral beam splitter.
- the position information of the bioparticles P in the well 21 is presented to the user using a 2D map or a 3D map constructed from the event data acquired by the EVS 131.
- the imaging unit 13 includes a frame-type image sensor in addition to the EVS 131, and position information of the bioparticles P in the well 21 is obtained using image data acquired by this image sensor. A case of presentation to the user will be exemplified.
- FIG. 22 is a block diagram showing a schematic configuration example of the particle number measuring section according to the present embodiment.
- the particle number measurement unit 205 according to the present embodiment has the same configuration as the particle number measurement unit 105 described in the first embodiment with reference to FIG. 13 is replaced with an imaging unit 213 .
- the imaging unit 213 includes an EVS 131 , a frame-type image sensor (hereinafter also referred to as CIS) 232 and a half mirror 233 .
- CIS frame-type image sensor
- the half mirror 233 is, for example, inclined at a predetermined angle (eg, 45 degrees) with respect to the optical axis of the objective lens 11.
- the EVS 131 is arranged, for example, at a position that receives light transmitted through the half mirror 233
- the CIS 232 is arranged, for example, at a position that receives light reflected by the half mirror 233 .
- FIG. 23 is a flow chart showing an example of the particle number measurement operation flow according to this embodiment. Since the operation shown in FIG. 23 may be controlled by the control unit 19 in the same manner as in FIG. 12, attention will be focused on the operation of the control unit 19 in the following description.
- the number and positions of bioparticles P in the well 21 to be observed are specified by operations similar to steps S101 to S105 in FIG.
- control unit 19 controls the vertical scanning mechanism 14 based on the positions of the biological particles P within the well 21 specified in the particle number counting process in step S105, thereby adjusting the focal position of the objective lens 11 to the biological particles. It is moved to a position in the depth direction where the particle P exists (step S201).
- control unit 19 drives the CIS 232 in a state in which the bioparticles P in the well 21 to be observed are in focus, thereby obtaining image data of the XY plane in which the bioparticles P are present in the well 21.
- Acquire step S202.
- the acquired image data is transmitted to the data processing unit 17 .
- control unit 19 determines whether or not the particle number counting process has been executed for all the wells 21 from which the bioparticles P are sorted in the well plate 20. If not executed (NO in step S106), the control unit 19 returns to step S102, and if executed (YES in step S106), the control unit 19 stops driving the imaging light source unit 16. (Step S107).
- the control unit 19 presents the number and/or positions of the bioparticles P per well 21 to the user based on the number and positions of the bioparticles P per well 21 measured in step S105.
- UI is generated (step S208).
- the image data acquired in step S202 may be used as the information indicating the position of the bioparticle P for each well 21 .
- the bioparticles P in the well 21 may be presented to the user indicating the location of the .
- the image data of the well 21 corresponding to the square selected by the user using an input interface such as a mouse, keyboard, or touch panel may be displayed to the user by switching the screen or window, or by switching a new window.
- control unit 19 causes the display unit 18 to display the UI generated in step S208 (step S109), and ends this operation.
- image data acquired by the frame-type image sensor is displayed to the user as information indicating the position of the bioparticle P for each well 21. . This makes it possible to provide the user with clearer and more detailed positional information of the biological particles P.
- FIG. 1 image data acquired by the frame-type image sensor (CIS232) is displayed to the user as information indicating the position of the bioparticle P for each well 21. . This makes it possible to provide the user with clearer and more detailed positional information of the biological particles P.
- FIG. 24 is a hardware configuration diagram showing an example of a computer 1000 that implements the functions of the signal processing section 123, the information processing section 103, and the data processing section 17.
- the computer 1000 has a CPU 1100 , a RAM 1200 , a ROM (Read Only Memory) 1300 , a HDD (Hard Disk Drive) 1400 , a communication interface 1500 and an input/output interface 1600 .
- Each part of computer 1000 is connected by bus 1050 .
- the CPU 1100 operates based on programs stored in the ROM 1300 or HDD 1400 and controls each section. For example, the CPU 1100 loads programs stored in the ROM 1300 or HDD 1400 into the RAM 1200 and executes processes corresponding to various programs.
- the ROM 1300 stores a boot program such as BIOS (Basic Input Output System) executed by the CPU 1100 when the computer 1000 is started, and programs dependent on the hardware of the computer 1000.
- BIOS Basic Input Output System
- the HDD 1400 is a computer-readable recording medium that non-temporarily records programs executed by the CPU 1100 and data used by such programs.
- HDD 1400 is a recording medium that records a program for realizing each operation according to the present disclosure, which is an example of program data 1450 .
- a communication interface 1500 is an interface for connecting the computer 1000 to an external network 1550 (for example, the Internet).
- the CPU 1100 receives data from another device via the communication interface 1500, and transmits data generated by the CPU 1100 to another device.
- the input/output interface 1600 is an interface for connecting the input/output device 1650 and the computer 1000 .
- the CPU 1100 receives data from input devices such as a keyboard and mouse via the input/output interface 1600 .
- the CPU 1100 transmits data to an output device such as a display, a speaker, or a printer via the input/output interface 1600 .
- the input/output interface 1600 may function as a media interface for reading a program or the like recorded on a predetermined recording medium.
- Media include, for example, optical recording media such as DVD (Digital Versatile Disc) and PD (Phase change rewritable disk), magneto-optical recording media such as MO (Magneto-Optical disk), tape media, magnetic recording media, semiconductor memories, etc. is.
- optical recording media such as DVD (Digital Versatile Disc) and PD (Phase change rewritable disk)
- magneto-optical recording media such as MO (Magneto-Optical disk)
- tape media magnetic recording media
- magnetic recording media semiconductor memories, etc. is.
- the CPU 1100 of the computer 1000 executes the program loaded on the RAM 1200 to process the signal.
- the functions of the processing unit 123, the information processing unit 103, and the data processing unit 17 are realized.
- the HDD 1400 also stores programs and the like according to the present disclosure.
- CPU 1100 reads and executes program data 1450 from HDD 1400 , as another example, these programs may be obtained from another device via external network 1550 .
- the present technology can also take the following configuration.
- an imaging unit that detects changes in brightness of light from particles in the container as events; a first scanning unit that scans the focal position of the imaging unit in the depth direction of the container; a processing unit that measures the state inside the container based on events detected at a plurality of focal positions of the imaging unit by scanning by the first scanning unit;
- the imaging unit is an objective lens facing the container; a first sensor unit comprising a plurality of pixels each configured to detect, as the event, a change in brightness of light from the particles in the container incident through the objective lens; with The particle analysis system according to (1) or (2), wherein the first scanning unit scans the focal position of the objective lens in the depth direction of the container. (4) The first scanning unit scans the focal position in the depth direction of the container by changing the relative position between the objective lens and the container in the depth direction. analysis system. (5)
- the objective lens comprises one or more lenses, The first scanning unit scans the focal position in the depth direction of the container by moving at least one lens among the one or more lenses of the objective lens in the depth direction.
- the particle analysis system according to 3).
- the imaging unit further comprises an optical system that reflects light from the imaging light source unit and transmits light from the particles in the container, The light from the imaging light source unit reflected by the optical system is applied to the particles in the container, The particle analysis system according to (6) or (7), wherein the light from the particles in the container passes through the optical system and enters the imaging section.
- the imaging light source unit irradiates the container with light from a first side, The particle analysis system according to (6) or (7), wherein the imaging unit detects, as the event, a change in brightness of light from the particles traveling to a second side opposite to the first side.
- the processing unit measures the state inside the container based on the number of events located in the vicinity of one event in the spatial direction and/or the temporal direction.
- the particle analysis system described. (11) The particle analysis system according to any one of (1) to (10), wherein the processing unit measures the number of particles in the container as the state inside the container based on the event. (12) The particle analysis system according to any one of (1) to (11), wherein the processing unit measures the position of the particle within the container as the state within the container based on the event. (13) The particle analysis system according to any one of (1) to (12), wherein the processing unit generates a user interface that presents the measured state inside the container to the user.
- the particle analysis system according to (13), wherein the processing unit generates, as the user interface, a two-dimensional map or a three-dimensional map of the interior of the container constructed from the event.
- the imaging unit further includes a second sensor unit that captures light from the particles in the container to generate image data,
- the first scanning unit moves the focal position of the imaging unit in the depth direction of the container based on the state inside the container measured based on the event
- the second sensor unit generates the image data by capturing the light from the particles within the container while the focal position of the imaging unit is moved based on the state within the container.
- the particle analysis system according to any one of (1) to (18), further comprising: (20) The container is a droplet that stands on its own on a plane, The particle analysis system according to any one of (1) to (18) above.
- a particle analysis method for a particle analysis system comprising an imaging unit that detects changes in brightness of light from particles in a container as events, a step of scanning the focal position of the imaging unit in the depth direction of the container; a step of measuring the state inside the container based on events detected at a plurality of focal positions of the imaging unit by scanning the focal position;
- a particle analysis method comprising: (22) The container is a droplet that stands on its own on a plane, The particle analysis method according to (21) above.
- a light source unit for detection that irradiates light onto biological particles passing through a predetermined flow path; a detection unit that detects the light emitted from the biological particles by the irradiation of the light from the detection light source unit; a collection unit that collects the bioparticles into a predetermined container based on the detection result of the detection unit; an imaging light source unit for irradiating the biological particles in the container with light; an imaging unit that detects, as an event, a change in brightness of light from the biological particles in the container in response to irradiation of light from the imaging light source unit; a scanning unit that scans the focal position of the imaging unit in the depth direction of the container; a processing unit that measures the state inside the container based on events detected at a plurality of focal positions of the imaging unit by scanning of the scanning unit;
- a flow cytometer system comprising:
Abstract
The present invention shortens work time. The particle analysis system according to an embodiment of the present invention comprises an imaging unit (13) for detecting a change in luminance of light from particles in a container as an event, a first scanning unit (14) for causing the focal position of the imaging unit to scan in the depth direction of the container, and a processing unit (103) for measuring a state in the container on the basis of an event detected at a plurality of focal positions of the imaging unit due to scanning by the first scanning unit.
Description
本開示は、粒子解析システム、粒子解析方法及びフローサイトメータシステムに関する。
The present disclosure relates to a particle analysis system, particle analysis method, and flow cytometer system.
従来、細胞、微生物、リポソームなどの生体関連微小粒子の蛋白質を分析(又は解析。本開示において、分析は解析を含むものとする)するための方法として、フローサイトメトリー(Flow Cytometry)が存在する。このフローサイトメトリーに用いられる装置は、フローサイトメータ(Flow Cytometer:FCM)と称される。フローサイトメータでは、流路内を1列になって流れる微小粒子に特定波長のレーザ光を照射して、各微小粒子から発せられた蛍光や前方散乱光や側方散乱光などの光を光検出器で電気信号に変換して数値化し、その結果に対して統計解析を行うことにより、個々の微小粒子の種類、大きさ、構造などが判定される。
Conventionally, flow cytometry exists as a method for analyzing (or analyzing, in the present disclosure, analysis includes analysis) proteins of biologically relevant microparticles such as cells, microorganisms, and liposomes. A device used for this flow cytometry is called a flow cytometer (FCM). In a flow cytometer, microparticles flowing in a line in a channel are irradiated with a laser beam of a specific wavelength, and fluorescence, forward scattered light, side scattered light, and other light emitted from each microparticle is emitted as light. The type, size, structure, etc. of each microparticle can be determined by converting it into an electric signal by a detector, digitizing it, and performing statistical analysis on the result.
また、近年では、微小粒子に対するリアルタイムな解析結果に基づいて、シース流から目的の微小粒子を分取する、いわゆるセルソータ型のフローサイトメータも開発されてきている。
In recent years, so-called cell sorter-type flow cytometers have also been developed that sort target microparticles from the sheath flow based on real-time analysis results for microparticles.
セルソータ型のフローサイトメータなど、微小粒子を分取する粒子解析システムでは、微小粒子が正しく分取されているかを確認する必要がある。
In a particle analysis system that sorts microparticles, such as a cell sorter-type flow cytometer, it is necessary to check whether the microparticles are sorted correctly.
例えば、液体中に多くの細胞が浮遊する生体試料から蛍光標識により特定の細胞を識別して分取するフローサイトメータにおいて、分取対象とする細胞を一細胞単位で遺伝子解析や培養等の後続処理に繋げる必要がある場合には、識別した細胞をひとつずつウェルプレートに個別分取するインデックスソーティングが用いられる。このようなインデックスソーティングでは、各ウェルに目的通り単一細胞で分取できていることが、その後の分析・培養工程の信頼性にとって重要になるが、フローサイトメータの分取機構のランダムな乱れにより、2つ以上の細胞を同じウェルに分取してしまったり、1つの細胞も分取できていなかったりするエラーが少なからず発生する。このようにエラーの発生したウェルを後続処理の前に取り除くためには、ウェルに細胞が1つずつ正しく分取されているかを確認する必要がある。
For example, in a flow cytometer that distinguishes and separates specific cells from a biological sample in which many cells are suspended in a liquid by fluorescent labeling, the cells to be sorted are subjected to genetic analysis and culturing on a cell-by-cell basis. When it is necessary to lead to processing, index sorting is used in which each identified cell is individually sorted into a well plate. In such index sorting, it is important for the reliability of subsequent analysis and culture processes to be able to sort single cells as intended in each well. As a result, more than a few errors occur, such as sorting two or more cells into the same well or failing to sort even a single cell. In order to remove such wells in which errors have occurred before subsequent processing, it is necessary to confirm whether the cells are correctly sorted into the wells one by one.
しかしながら、従来では、微小粒子が正しく分取されているかの確認に、目視や焦点深度の浅いフレーム型のカメラが用いられていたため、確認作業に要する時間が長くなってしまうという課題が存在した。
However, conventionally, visual observation and a frame-type camera with a shallow depth of focus were used to confirm whether the microparticles were correctly sorted, so there was a problem that the confirmation work took a long time.
そこで本開示では、作業時間を短縮することが可能な粒子解析システム、粒子解析方法及びフローサイトメータシステムを提供する。
Therefore, the present disclosure provides a particle analysis system, a particle analysis method, and a flow cytometer system capable of reducing work time.
上記の課題を解決するために、本開示に係る一形態の粒子解析システムは、容器内の粒子からの光の輝度変化をイベントとして検出する撮像部と、前記撮像部の焦点位置を前記容器の深さ方向に走査する第1走査部と、前記第1走査部の走査による前記撮像部の複数の焦点位置で検出されたイベントに基づいて、前記容器内の状態を計測する処理部と、を備える。
In order to solve the above problems, a particle analysis system according to one embodiment of the present disclosure includes an imaging unit that detects, as an event, a change in the brightness of light from particles in a container, and a focus position of the imaging unit on the container. a first scanning unit that scans in a depth direction; and a processing unit that measures the state inside the container based on events detected at a plurality of focal positions of the imaging unit by scanning by the first scanning unit. Prepare.
以下に、本開示の実施形態について図面に基づいて詳細に説明する。なお、以下の実施形態において、同一の部位には同一の符号を付することにより重複する説明を省略する。
Below, embodiments of the present disclosure will be described in detail based on the drawings. In addition, in the following embodiment, the overlapping description is abbreviate|omitted by attaching|subjecting the same code|symbol to the same site|part.
また、以下に示す項目順序に従って本開示を説明する。
1.はじめに
2.粒子解析システムの概略構成例
3.第1の実施形態
3.1 システム構成例
3.2 イメージセンサの構成例
3.3 EVSの構成例
3.4 粒子数計測部の概略構成例
3.5 ウェルプレート及びウェルの構成例
3.6 生体粒子数の計測について
3.7 粒子数計測動作のフロー例
3.8 粒子数計測処理の例
3.9 粒子数計測処理の具体例
3.10 ユーザインタフェースの具体例
3.11 粒子解析システムの装置形態
3.12 作用・効果
3.13 変形例
3.13.1 第1変形例
3.13.2 第2変形例
3.13.3 他の変形例
4.第2の実施形態
4.1 粒子数計測部の概略構成例
4.2 粒子数計測動作のフロー例
4.3 作用・効果
5.ハードウエア構成 Also, the present disclosure will be described according to the order of items shown below.
1.Introduction 2. Schematic configuration example of particle analysis system 3 . First Embodiment 3.1 System Configuration Example 3.2 Image Sensor Configuration Example 3.3 EVS Configuration Example 3.4 Schematic Configuration Example of Particle Number Measuring Unit 3.5 Well Plate and Well Configuration Example 3.6 Measurement of the number of biological particles 3.7 Flow example of particle number measurement operation 3.8 Example of particle number measurement processing 3.9 Specific example of particle number measurement processing 3.10 Specific example of user interface 3.11 Particle analysis system Apparatus form 3.12 Actions and effects 3.13 Modifications 3.13.1 First modification 3.13.2 Second modification 3.13.3 Other modifications 4. Second Embodiment 4.1 Schematic Configuration Example of Particle Number Measuring Unit 4.2 Flow Example of Particle Number Measuring Operation 4.3 Functions and Effects5. Hardware configuration
1.はじめに
2.粒子解析システムの概略構成例
3.第1の実施形態
3.1 システム構成例
3.2 イメージセンサの構成例
3.3 EVSの構成例
3.4 粒子数計測部の概略構成例
3.5 ウェルプレート及びウェルの構成例
3.6 生体粒子数の計測について
3.7 粒子数計測動作のフロー例
3.8 粒子数計測処理の例
3.9 粒子数計測処理の具体例
3.10 ユーザインタフェースの具体例
3.11 粒子解析システムの装置形態
3.12 作用・効果
3.13 変形例
3.13.1 第1変形例
3.13.2 第2変形例
3.13.3 他の変形例
4.第2の実施形態
4.1 粒子数計測部の概略構成例
4.2 粒子数計測動作のフロー例
4.3 作用・効果
5.ハードウエア構成 Also, the present disclosure will be described according to the order of items shown below.
1.
1.はじめに
上述のように、識別した細胞をひとつずつウェルプレートに個別分取するインデックスソーティングでは、各ウェルに目的通り単一細胞で分取できていることが、その後の分析・培養工程の信頼性にとって重要になるが、フローサイトメータの分取機構のランダムな乱れにより、2つ以上の細胞を同じウェルに分取してしまったり、1つの細胞も分取できていなかったりするエラーが少なからず発生する。このようにエラーの発生したウェルを予め検出し、後続処理の前に取り除くことが望ましい。 1. Introduction As mentioned above, in index sorting, in which the identified cells are sorted one by one into a well plate, it is important for the reliability of subsequent analysis and culturing processes that each well can be sorted with single cells as intended. Importantly, random disturbances in the sorting mechanism of the flow cytometer often cause errors such as sorting two or more cells into the same well or failing to sort even a single cell. do. It is desirable to detect such erroneous wells in advance and remove them prior to further processing.
上述のように、識別した細胞をひとつずつウェルプレートに個別分取するインデックスソーティングでは、各ウェルに目的通り単一細胞で分取できていることが、その後の分析・培養工程の信頼性にとって重要になるが、フローサイトメータの分取機構のランダムな乱れにより、2つ以上の細胞を同じウェルに分取してしまったり、1つの細胞も分取できていなかったりするエラーが少なからず発生する。このようにエラーの発生したウェルを予め検出し、後続処理の前に取り除くことが望ましい。 1. Introduction As mentioned above, in index sorting, in which the identified cells are sorted one by one into a well plate, it is important for the reliability of subsequent analysis and culturing processes that each well can be sorted with single cells as intended. Importantly, random disturbances in the sorting mechanism of the flow cytometer often cause errors such as sorting two or more cells into the same well or failing to sort even a single cell. do. It is desirable to detect such erroneous wells in advance and remove them prior to further processing.
生細胞へダメージを与えずにエラーを検出する方法としては、光学顕微鏡観察が有効である。しかしながら、大きさが数マイクロメータ程度の細胞を検出可能な光学倍率における焦点深度は通常0.1mm(ミリメートル)以下であり、10mm程度あるウェル中の液体深さに対して非常に小さい。そのため、液体中の細胞数を漏れなく計測するには、光学顕微鏡の焦点面を深さ方向に走査する必要がある。
Optical microscopy is an effective method for detecting errors without damaging living cells. However, the depth of focus at an optical magnification that can detect cells with a size of about several micrometers is usually 0.1 mm (millimeter) or less, which is very small compared to the liquid depth in the well, which is about 10 mm. Therefore, in order to measure the number of cells in the liquid without omission, it is necessary to scan the focal plane of the optical microscope in the depth direction.
光学顕微鏡の焦点面を走査しながら各焦点面における細胞数をカウントする場合、従来では、作業者が目視でカウントすること、または、フレーム型のカメラで各焦点面における画像を逐一取得することが行われていた。
When counting the number of cells in each focal plane while scanning the focal plane of an optical microscope, conventionally, an operator has to visually count the cells, or an image of each focal plane can be acquired one by one with a frame-type camera. It was done.
目視でカウントする場合、動きブレを感じず細胞像を明瞭に識別できる程度に焦点面の走査速度を留める必要があるのに加え、手動で検査結果を記録する操作時間が必要となり、深さ10mmのウェルひとつの検査に5~10秒程度を要してしまう。
In the case of visual counting, it is necessary to keep the scanning speed of the focal plane to the extent that the cell image can be clearly identified without feeling any movement blur, and in addition, it takes time to manually record the inspection results, and the depth is 10 mm. It takes about 5 to 10 seconds to inspect one well.
一方、フレーム型カメラを用いる場合、目視の場合と比較してより速い焦点面走査速度での検査が可能ではあるが、直径数マクロメートルの細胞を検出可能な解像度で直径数mmのウェル全体を画角に収めるために必要となる100万以上の画素数による撮像を、焦点深度0.1mm単位で10mmの深さに渡って100回程度行うことになる。そのため、例えば画素階調を8bitと仮定した場合でも、取得・転送を要する画像データの総データ量が800Mbit程度の膨大なデータ量になってしまい、取得・転送に数秒程度の長い時間を要することとなる。更に、フレームの取得タイミングを走査の焦点深度間隔に同期させる必要があるため、高速で且つ位置精度の高い、位置センサ内蔵のステッピングモータのような走査機構が必要となり、デバイスコストの増加やデバイスサイズの増大化といった課題も発生する。
On the other hand, when using a frame-type camera, although inspection at a faster focal plane scanning speed is possible compared to visual observation, it is possible to scan an entire well several mm in diameter with a resolution that can detect cells several micrometers in diameter. Imaging with a number of pixels of 1,000,000 or more required to fit within the angle of view is performed about 100 times over a depth of 10 mm in units of 0.1 mm of focal depth. Therefore, even if the pixel gradation is assumed to be 8 bits, for example, the total amount of image data to be obtained and transferred becomes a huge amount of about 800 Mbit, and it takes a long time of about several seconds to obtain and transfer. becomes. Furthermore, since it is necessary to synchronize the frame acquisition timing with the scanning focal depth interval, a scanning mechanism such as a stepping motor with a built-in position sensor with high speed and high position accuracy is required, which increases the device cost and device size. The problem of an increase in
そこで、以下の実施形態では、作業時間を短縮することが可能な粒子解析システム、粒子解析方法及びフローサイトメータシステムを提供する。例えば、以下の実施形態の一部では、デバイスコストの増加やデバイスサイズの増大化を抑制しつつ、微小粒子が正しく分取されているかの確認作業に要する時間を短縮することが可能な粒子解析システム、粒子解析方法及びフローサイトメータシステムを提供する。
Therefore, the following embodiments provide a particle analysis system, a particle analysis method, and a flow cytometer system capable of reducing working time. For example, in some of the following embodiments, particle analysis that can shorten the time required to confirm whether microparticles are correctly fractionated while suppressing increases in device cost and device size. Systems, particle analysis methods and flow cytometer systems are provided.
2.粒子解析システムの概略構成例
本開示に係る粒子解析システムの概略構成例を図1に示す。図1に示される粒子解析システム100は、流路Cを流れる生体試料Sに光を照射する光照射部101、前記照射によって生じた光を検出する検出部102、及び前記検出部102により検出された光に関する情報を処理する情報処理部103を含む。粒子解析システム100の例としては、例えばフローサイトメータ及びイメージングフローサイトメータを挙げることができる。粒子解析システム100は、生体試料S内の特定の微小粒子(本説明では、生体粒子とする)Pの分取を行う分取部104を含む。分取部104を含む粒子解析システム100の例としては、例えばセルソータを挙げることができる。 2. Schematic Configuration Example of Particle Analysis System FIG. 1 shows a schematic configuration example of a particle analysis system according to the present disclosure. Aparticle analysis system 100 shown in FIG. It includes an information processing unit 103 that processes information about light. Examples of particle analysis system 100 include, for example, flow cytometers and imaging flow cytometers. The particle analysis system 100 includes a sorting section 104 that sorts out specific microparticles (in this description, bioparticles) P in the biological sample S. FIG. An example of the particle analysis system 100 including the sorting unit 104 is a cell sorter.
本開示に係る粒子解析システムの概略構成例を図1に示す。図1に示される粒子解析システム100は、流路Cを流れる生体試料Sに光を照射する光照射部101、前記照射によって生じた光を検出する検出部102、及び前記検出部102により検出された光に関する情報を処理する情報処理部103を含む。粒子解析システム100の例としては、例えばフローサイトメータ及びイメージングフローサイトメータを挙げることができる。粒子解析システム100は、生体試料S内の特定の微小粒子(本説明では、生体粒子とする)Pの分取を行う分取部104を含む。分取部104を含む粒子解析システム100の例としては、例えばセルソータを挙げることができる。 2. Schematic Configuration Example of Particle Analysis System FIG. 1 shows a schematic configuration example of a particle analysis system according to the present disclosure. A
(生体試料)
生体試料Sは、生体粒子Pを含む液状試料であってよい。当該生体粒子Pは、例えば細胞又は非細胞性生体粒子である。また、前記生体粒子Pは酵母や細菌などの微生物であってもよい。前記細胞は、生細胞であってよく、より具体的な例として、赤血球や白血球などの血液細胞、及び精子や受精卵等生殖細胞を挙げることができる。また、前記細胞は全血等検体から直接採取されたものでもよいし、培養後に取得された培養細胞であってもよい。前記非細胞性生体粒子として、細胞外小胞、特にはエクソソーム及びマイクロベシクルなどを挙げることができる。前記生体粒子Pは、1つ又は複数の標識物質(例えば色素(特には蛍光色素)及び蛍光色素標識抗体など)によって標識されていてもよい。なお、本開示の粒子解析システム100により、生体粒子以外の粒子が分析されてもよく、キャリブレーションなどのために、ビーズなどが分析されてもよい。 (biological sample)
The biological sample S may be a liquid sample containing biological particles P. The bioparticles P are, for example, cells or non-cellular bioparticles. Moreover, the biological particles P may be microorganisms such as yeast and bacteria. The cells may be living cells, and more specific examples include blood cells such as red blood cells and white blood cells, and germ cells such as sperm and fertilized eggs. The cells may be directly collected from a sample such as whole blood, or may be cultured cells obtained after culturing. Examples of the noncellular bioparticles include extracellular vesicles, particularly exosomes and microvesicles. The bioparticle P may be labeled with one or a plurality of labeling substances (for example, a dye (especially a fluorescent dye) and a fluorescent dye-labeled antibody). Particles other than biological particles may be analyzed by theparticle analysis system 100 of the present disclosure, and beads or the like may be analyzed for calibration or the like.
生体試料Sは、生体粒子Pを含む液状試料であってよい。当該生体粒子Pは、例えば細胞又は非細胞性生体粒子である。また、前記生体粒子Pは酵母や細菌などの微生物であってもよい。前記細胞は、生細胞であってよく、より具体的な例として、赤血球や白血球などの血液細胞、及び精子や受精卵等生殖細胞を挙げることができる。また、前記細胞は全血等検体から直接採取されたものでもよいし、培養後に取得された培養細胞であってもよい。前記非細胞性生体粒子として、細胞外小胞、特にはエクソソーム及びマイクロベシクルなどを挙げることができる。前記生体粒子Pは、1つ又は複数の標識物質(例えば色素(特には蛍光色素)及び蛍光色素標識抗体など)によって標識されていてもよい。なお、本開示の粒子解析システム100により、生体粒子以外の粒子が分析されてもよく、キャリブレーションなどのために、ビーズなどが分析されてもよい。 (biological sample)
The biological sample S may be a liquid sample containing biological particles P. The bioparticles P are, for example, cells or non-cellular bioparticles. Moreover, the biological particles P may be microorganisms such as yeast and bacteria. The cells may be living cells, and more specific examples include blood cells such as red blood cells and white blood cells, and germ cells such as sperm and fertilized eggs. The cells may be directly collected from a sample such as whole blood, or may be cultured cells obtained after culturing. Examples of the noncellular bioparticles include extracellular vesicles, particularly exosomes and microvesicles. The bioparticle P may be labeled with one or a plurality of labeling substances (for example, a dye (especially a fluorescent dye) and a fluorescent dye-labeled antibody). Particles other than biological particles may be analyzed by the
(流路)
流路Cは、生体試料Sが流れるように、特に前記生体試料Sに含まれる生体粒子Pが略一列に並んだ流れが形成されるように構成され得る。流路Cを含む流路構造は、層流が形成されるように設計されてよく、特には生体試料Sの流れ(サンプル流)がシース液の流れによって包まれた層流が形成されるように設計される。当該流路構造の設計は、当業者により適宜選択されてよく、既知のものが採用されてもよい。流路Cは、マイクロチップ(マイクロメートルオーダーの流路を有するチップ)又はフローセルなどの流路構造体(Flow Channel Structure)中に形成されてよい。流路Cの幅は、1mm(ミリメートル)以下であり、特には10μm(マイクロメートル)以上1mm以下であってよい。流路C及びそれを含む流路構造体は、プラスチックやガラスなどの材料から形成されてよい。 (Flow path)
The flow path C can be configured so that the biological sample S flows, particularly such that the biological particles P contained in the biological sample S are arranged substantially in a line to form a flow. The flow channel structure including the flow channel C may be designed to form a laminar flow, and in particular, to form a laminar flow in which the flow of the biological sample S (sample flow) is surrounded by the flow of the sheath liquid. designed to The design of the flow channel structure may be appropriately selected by those skilled in the art, and known ones may be adopted. The channel C may be formed in a flow channel structure such as a microchip (a chip having a channel on the order of micrometers) or a flow cell. The width of the flow channel C may be 1 mm (millimeter) or less, particularly 10 μm (micrometer) or more and 1 mm or less. The channel C and the channel structure including it may be made of a material such as plastic or glass.
流路C内を流れる生体試料S、特には当該生体試料S中の生体粒子Pに、前記光照射部101からの光が照射されるように、本開示の装置は構成されてよい。本開示の装置は、生体試料Sに対する光の照射点(Interrogation Point)が、流路Cが形成されている流路構造体中にあるように構成されてよく、又は、当該光の照射点が、当該流路構造体の外にあるように構成されてもよい。前者の例として、マイクロチップ又はフローセル内の流路Cに前記光が照射される構成を挙げることができる。後者では、流路構造体(特にはそのノズル部)から出た後の生体粒子Pに前記光が照射されてよく、例えばJet in Air方式のフローサイトメータを挙げることができる。
The apparatus of the present disclosure may be configured such that the biological sample S flowing in the flow path C, particularly the biological particles P in the biological sample S, is irradiated with light from the light irradiation unit 101 . The apparatus of the present disclosure may be configured such that the light irradiation point (interrogation point) for the biological sample S is in the channel structure in which the channel C is formed, or the light irradiation point is , may be configured to be outside the channel structure. As an example of the former, there is a configuration in which the light is applied to the channel C in the microchip or the flow cell. In the latter, the light may be applied to the biological particles P after exiting the flow path structure (especially the nozzle section thereof).
(光照射部)
光照射部101は、光を出射する検出用光源部と、当該光を流路Cへと導く導光光学系とを含む。前記検出用光源部は、1又は複数の光源を含む。光源の種類は、例えばレーザ光源又はLED(Light Emitting Diode)であり得る。各光源から出射される光の波長は、紫外光、可視光、又は赤外光のいずれかの波長であってよい。導光光学系は、例えばビームスプリッター群、ミラー群又は光ファイバなどの光学部品を含む。また、導光光学系は、光を集光するためのレンズ群を含んでよく、例えば対物レンズを含み得る。生体試料Sに対する光の照射点は、1つ又は複数であってよい。光照射部101は、一の照射点に対して、一つ又は異なる複数の光源から照射された光を集光するよう構成されていてもよい。 (light irradiation part)
Thelight irradiation unit 101 includes a light source unit for detection that emits light and a light guiding optical system that guides the light to the channel C. As shown in FIG. The detection light source unit includes one or more light sources. The type of light source may be, for example, a laser light source or an LED (Light Emitting Diode). The wavelength of light emitted from each light source may be any wavelength of ultraviolet light, visible light, or infrared light. The light guiding optics include optical components such as beam splitter groups, mirror groups or optical fibers. The light guiding optics may also include a lens group for condensing the light, for example an objective lens. The number of light irradiation points on the biological sample S may be one or more. The light irradiation unit 101 may be configured to condense light irradiated from one or different light sources to one irradiation point.
光照射部101は、光を出射する検出用光源部と、当該光を流路Cへと導く導光光学系とを含む。前記検出用光源部は、1又は複数の光源を含む。光源の種類は、例えばレーザ光源又はLED(Light Emitting Diode)であり得る。各光源から出射される光の波長は、紫外光、可視光、又は赤外光のいずれかの波長であってよい。導光光学系は、例えばビームスプリッター群、ミラー群又は光ファイバなどの光学部品を含む。また、導光光学系は、光を集光するためのレンズ群を含んでよく、例えば対物レンズを含み得る。生体試料Sに対する光の照射点は、1つ又は複数であってよい。光照射部101は、一の照射点に対して、一つ又は異なる複数の光源から照射された光を集光するよう構成されていてもよい。 (light irradiation part)
The
(検出部)
検出部102は、光照射部101による粒子への光照射により生じた光を検出する少なくとも一つの光検出器を備えている。検出する光は、例えば蛍光又は散乱光(例えば前方散乱光、後方散乱光、及び側方散乱光のいずれか1つ以上)、透過光、反射光である。各光検出器は、1以上の受光素子を含み、例えば受光素子アレイを有する。各光検出器は、受光素子として、1又は複数のPMT(光電子増倍管)及び/又はAPD(Avalanche Photodiode)及びMPPC(Multi-Pixel Photon Counter)等のフォトダイオードを含んでよい。当該光検出器は、例えば複数のPMTを一次元方向に配列したPMTアレイを含む。また、検出部102は、CCD(Charge Coupled Device)又はCMOS(Complementary Metal-Oxide-Semiconductor)などの撮像素子を含んでもよい。検出部102は、当該撮像素子により、生体粒子Pに関する生体粒子情報を取得し得る。 (Detection unit)
Thedetection unit 102 includes at least one photodetector that detects light generated by light irradiation of the particles by the light irradiation unit 101 . The light to be detected is, for example, fluorescent light, scattered light (for example, one or more of forward scattered light, backscattered light, and side scattered light), transmitted light, and reflected light. Each photodetector includes one or more photodetectors, such as a photodetector array. Each photodetector may include photodiodes such as one or more PMTs (photomultiplier tubes) and/or APDs (Avalanche Photodiodes) and MPPCs (Multi-Pixel Photon Counters) as light receiving elements. The photodetector includes, for example, a PMT array in which a plurality of PMTs are arranged in a one-dimensional direction. The detection unit 102 may also include an imaging device such as a CCD (Charge Coupled Device) or a CMOS (Complementary Metal-Oxide-Semiconductor). The detection unit 102 can acquire bioparticle information about the bioparticle P using the imaging device.
検出部102は、光照射部101による粒子への光照射により生じた光を検出する少なくとも一つの光検出器を備えている。検出する光は、例えば蛍光又は散乱光(例えば前方散乱光、後方散乱光、及び側方散乱光のいずれか1つ以上)、透過光、反射光である。各光検出器は、1以上の受光素子を含み、例えば受光素子アレイを有する。各光検出器は、受光素子として、1又は複数のPMT(光電子増倍管)及び/又はAPD(Avalanche Photodiode)及びMPPC(Multi-Pixel Photon Counter)等のフォトダイオードを含んでよい。当該光検出器は、例えば複数のPMTを一次元方向に配列したPMTアレイを含む。また、検出部102は、CCD(Charge Coupled Device)又はCMOS(Complementary Metal-Oxide-Semiconductor)などの撮像素子を含んでもよい。検出部102は、当該撮像素子により、生体粒子Pに関する生体粒子情報を取得し得る。 (Detection unit)
The
上述したように、生体粒子情報には、生体粒子の生体粒子画像、生体粒子の特徴量、生体粒子の属性情報等のうちの少なくとも1つが含まれ得る。また、生体粒子の生体粒子画像には、例えば、明視野画像、暗視野画像、蛍光画像などが含まれてよい。
As described above, the bioparticle information can include at least one of bioparticle images of bioparticles, bioparticle feature amounts, bioparticle attribute information, and the like. Also, the bioparticle image of the bioparticle may include, for example, a brightfield image, a darkfield image, a fluorescence image, and the like.
検出部102は、所定の検出波長の光を、対応する光検出器に到達させる検出光学系を含む。検出光学系は、プリズムや回折格子等の分光部又はダイクロイックミラーや光学フィルタ等の波長分離部を含む。検出光学系は、例えば生体粒子Pからの光を分光し、蛍光色素の数より多い複数の光検出器にて異なる波長域の光が検出されるよう構成されてもよい。このような検出光学系を含むフローサイトメータはスペクトル型フローサイトメータと呼ぶ。また、検出光学系は、例えば生体粒子Pからの光より蛍光色素の蛍光波長域に対応する光を分離し、当該分離された光を、対応する光検出器に検出させるよう構成されてもよい。
The detection unit 102 includes a detection optical system that causes light of a predetermined detection wavelength to reach a corresponding photodetector. The detection optical system includes a spectroscopic section such as a prism or a diffraction grating, or a wavelength separating section such as a dichroic mirror or an optical filter. The detection optical system may be configured, for example, to disperse the light from the bioparticle P and detect light in different wavelength ranges with a plurality of photodetectors, the number of which is greater than the number of fluorescent dyes. A flow cytometer including such a detection optical system is called a spectral flow cytometer. Further, the detection optical system may be configured, for example, to separate the light corresponding to the fluorescence wavelength range of the fluorescent dye from the light from the bioparticle P and cause the separated light to be detected by the corresponding photodetector. .
また、検出部102は、光検出器により得られた電気信号をデジタル信号に変換する信号処理部を含み得る。当該信号処理部が、当該変換を行う装置としてA/D変換器を含んでよい。当該信号処理部による変換により得られたデジタル信号が、情報処理部103に送信され得る。前記デジタル信号が、情報処理部103により、光に関するデータ(以下「光データ」ともいう)として取り扱われ得る。前記光データは、例えば蛍光データを含む光データであってよい。より具体的には、前記光データは、光強度データであってよく、当該光強度は、蛍光を含む光の光強度データ(Area、Height、Width等の特徴量を含んでもよい)であってよい。
Also, the detection unit 102 may include a signal processing unit that converts the electrical signal obtained by the photodetector into a digital signal. The signal processing unit may include an A/D converter as a device that performs the conversion. A digital signal obtained by conversion by the signal processing unit can be transmitted to the information processing unit 103 . The digital signal can be handled by the information processing section 103 as data related to light (hereinafter also referred to as “optical data”). The optical data may be optical data including fluorescence data, for example. More specifically, the light data may be light intensity data, and the light intensity may be light intensity data of light containing fluorescence (which may include feature amounts such as Area, Height, Width, etc.) good.
(情報処理部)
情報処理部103は、例えば各種データ(例えば光データ)の処理を実行する処理部及び各種データを記憶する記憶部を含む。処理部は、蛍光色素に対応する光データを検出部102より取得した場合、光強度データに対し蛍光漏れ込み補正(コンペンセーション処理)を行い得る。また、処理部は、スペクトル型フローサイトメータの場合、光データに対して蛍光分離処理を実行し、蛍光色素に対応する光強度データを取得する。 (Information processing department)
Theinformation processing unit 103 includes, for example, a processing unit that processes various data (for example, optical data) and a storage unit that stores various data. When optical data corresponding to a fluorescent dye is acquired from the detection unit 102, the processing unit can perform fluorescence leakage correction (compensation processing) on the light intensity data. Also, in the case of a spectral flow cytometer, the processing unit performs fluorescence separation processing on the optical data and acquires light intensity data corresponding to the fluorescent dye.
情報処理部103は、例えば各種データ(例えば光データ)の処理を実行する処理部及び各種データを記憶する記憶部を含む。処理部は、蛍光色素に対応する光データを検出部102より取得した場合、光強度データに対し蛍光漏れ込み補正(コンペンセーション処理)を行い得る。また、処理部は、スペクトル型フローサイトメータの場合、光データに対して蛍光分離処理を実行し、蛍光色素に対応する光強度データを取得する。 (Information processing department)
The
前記蛍光分離処理は、例えば特開2011-232259号公報に記載されたアンミキシング方法に従い行われてよい。検出部102が撮像素子を含む場合、処理部は、撮像素子により取得された画像に基づき、生体粒子Pの形態情報を取得してもよい。記憶部は、取得された光データを格納できるように構成されていてよい。記憶部は、さらに、前記アンミキシング処理において用いられるスペクトラルリファレンスデータを格納できるように構成されていてよい。
The fluorescence separation process may be performed, for example, according to the unmixing method described in JP-A-2011-232259. When the detection unit 102 includes an imaging device, the processing unit may acquire morphological information of the biological particles P based on the image acquired by the imaging device. The storage unit may be configured to store the acquired optical data. The storage unit may further be configured to store spectral reference data used in the unmixing process.
粒子解析システム100は後述の分取部104を含んでおり、情報処理部103は、光データ及び/又は形態情報に基づき、生体粒子Pを分取するかの判定を実行し得る。そして、情報処理部103は、当該判定の結果に基づき当該分取部104を制御し、分取部104による生体粒子Pの分取が行われ得る。
The particle analysis system 100 includes a sorting unit 104, which will be described later, and the information processing unit 103 can determine whether to sort the biological particles P based on the optical data and/or the morphological information. Then, the information processing section 103 can control the sorting section 104 based on the result of the determination, and sorting of the bioparticles P by the sorting section 104 can be performed.
情報処理部103は、各種データ(例えば光データや画像)を出力することができるように構成されていてよい。例えば、情報処理部103は、当該光データに基づき生成された各種データ(例えば二次元プロット、スペクトルプロットなど)を出力し得る。また、情報処理部103は、各種データの入力を受け付けることができるように構成されていてよく、例えばユーザによるプロット上へのゲーティング処理を受け付ける。情報処理部103は、当該出力又は当該入力を実行させるための出力部(例えばディスプレイなど)又は入力部(例えばキーボードなど)を含み得る。
The information processing unit 103 may be configured to output various data (for example, optical data and images). For example, the information processing section 103 can output various data (for example, two-dimensional plots, spectral plots, etc.) generated based on the optical data. Further, the information processing unit 103 may be configured to be able to receive input of various data, and for example, receives gating processing on the plot by the user. The information processing unit 103 may include an output unit (such as a display) or an input unit (such as a keyboard) for executing the output or the input.
情報処理部103は、汎用のコンピュータとして構成されてよく、例えばCPU(Central Processing Unit)、RAM(Random Access Memory)、及びROM(Read only memory)を備えている情報処理装置として構成されてよい。情報処理部103は、光照射部101及び検出部102が備えられている筐体内に含まれていてよく、又は、当該筐体の外にあってもよい。また、情報処理部103による各種処理又は機能は、ネットワークを介して接続されたサーバコンピュータ又はクラウドにより実現されてもよい。
The information processing unit 103 may be configured as a general-purpose computer, and may be configured as an information processing device including, for example, a CPU (Central Processing Unit), RAM (Random Access Memory), and ROM (Read only memory). The information processing unit 103 may be included in the housing in which the light irradiation unit 101 and the detection unit 102 are provided, or may be outside the housing. Various processing or functions by the information processing unit 103 may be implemented by a server computer or cloud connected via a network.
(分取部)
分取部104は、例えば情報処理部103による判定結果に応じて、生体粒子Pの分取を実行し得る。分取の方式は、振動により生体粒子Pを含む液滴を生成し、分取対象の液滴に対して電荷をかけ、当該液滴の進行方向を電極により制御する方式であってよい。分取の方式は、流路構造体内にて生体粒子Pの進行方向を制御し分取を行う方式であってもよい。当該流路構造体には、例えば、圧力(噴射若しくは吸引)又は電荷による制御機構が設けられる。当該流路構造体の例として、流路Cがその下流で回収流路及び廃液流路へと分岐している流路構造を有し、特定の生体粒子Pが当該回収流路へ回収されるチップ(例えば特開2020-76736号公報に記載されたチップ)を挙げることができる。 (Preparation part)
Thesorting unit 104 can sort the bioparticles P according to the determination result by the information processing unit 103, for example. The sorting method may be a method of generating a droplet containing the biological particles P by vibration, applying an electric charge to the droplet to be sorted, and controlling the traveling direction of the droplet with an electrode. The sorting method may be a method of sorting by controlling the traveling direction of the bioparticles P in the channel structure. The channel structure is provided with a control mechanism, for example, by pressure (jetting or suction) or electric charge. As an example of the channel structure, the channel C has a channel structure in which the channel C is branched into a recovery channel and a waste liquid channel downstream thereof, and the specific biological particles P are recovered in the recovery channel. A chip (for example, a chip described in Japanese Patent Application Laid-Open No. 2020-76736) can be used.
分取部104は、例えば情報処理部103による判定結果に応じて、生体粒子Pの分取を実行し得る。分取の方式は、振動により生体粒子Pを含む液滴を生成し、分取対象の液滴に対して電荷をかけ、当該液滴の進行方向を電極により制御する方式であってよい。分取の方式は、流路構造体内にて生体粒子Pの進行方向を制御し分取を行う方式であってもよい。当該流路構造体には、例えば、圧力(噴射若しくは吸引)又は電荷による制御機構が設けられる。当該流路構造体の例として、流路Cがその下流で回収流路及び廃液流路へと分岐している流路構造を有し、特定の生体粒子Pが当該回収流路へ回収されるチップ(例えば特開2020-76736号公報に記載されたチップ)を挙げることができる。 (Preparation part)
The
3.第1の実施形態
つづいて、本開示の第1の実施形態に係る粒子解析システム、粒子解析方法及びフローサイトメータシステムについて、図面を参照して詳細に説明する。 3. First Embodiment Subsequently, a particle analysis system, a particle analysis method, and a flow cytometer system according to a first embodiment of the present disclosure will be described in detail with reference to the drawings.
つづいて、本開示の第1の実施形態に係る粒子解析システム、粒子解析方法及びフローサイトメータシステムについて、図面を参照して詳細に説明する。 3. First Embodiment Subsequently, a particle analysis system, a particle analysis method, and a flow cytometer system according to a first embodiment of the present disclosure will be described in detail with reference to the drawings.
3.1 システム構成例
図2は、本実施形態に係る粒子解析システムのより具体的な構成例をブロック図である。なお、本実施形態及び以下の実施形態において、粒子解析システムは、複数の装置が組み合わされたシステムとして構成されてもよい。 3.1 System Configuration Example FIG. 2 is a block diagram of a more specific configuration example of the particle analysis system according to this embodiment. In addition, in this embodiment and the following embodiments, the particle analysis system may be configured as a system in which a plurality of devices are combined.
図2は、本実施形態に係る粒子解析システムのより具体的な構成例をブロック図である。なお、本実施形態及び以下の実施形態において、粒子解析システムは、複数の装置が組み合わされたシステムとして構成されてもよい。 3.1 System Configuration Example FIG. 2 is a block diagram of a more specific configuration example of the particle analysis system according to this embodiment. In addition, in this embodiment and the following embodiments, the particle analysis system may be configured as a system in which a plurality of devices are combined.
図2に示すように、本実施形態に係る粒子解析システム100は、光照射部101を構成する検出用光源部111及び導光光学系112と、検出部102を構成する検出光学系121、撮像部122、信号処理部123及び速度計測部124と、情報処理部103と、分取部104と、粒子数計測部105とを備え、流路Cを流れる生体試料S中の生体粒子Pから放射された蛍光、反射光及び/又は透過光の像をリアルタイムに観察し、この観察結果に基づいて、目的の生体粒子Pをウェルプレート20の各ウェルに分取する。そして、ウェルプレート20の各ウェルに分取された生体粒子Pの数が粒子数計測部105により計測される。なお、検出用光源部111、導光光学系112、検出光学系121、情報処理部103、及び、分取部104は、上述において図1を用いて説明したそれらと同様であってよい。
As shown in FIG. 2, the particle analysis system 100 according to the present embodiment includes a detection light source unit 111 and a light guide optical system 112 that constitute a light irradiation unit 101, a detection optical system 121 that constitutes a detection unit 102, an imaging 122, a signal processing unit 123, a velocity measurement unit 124, an information processing unit 103, a sorting unit 104, and a particle number measurement unit 105. Images of the emitted fluorescence, reflected light and/or transmitted light are observed in real time, and the target bioparticles P are dispensed into the wells of the well plate 20 based on the observation results. Then, the number of bioparticles P dispensed into each well of the well plate 20 is counted by the particle number measuring unit 105 . The detection light source unit 111, the light guide optical system 112, the detection optical system 121, the information processing unit 103, and the fractionation unit 104 may be the same as those described above with reference to FIG.
より具体的には、検出用光源部111から出力された光(以下、励起光ともいう)は、導光光学系112により集光される。集光された光は、生体粒子Pが浮遊した生体試料Sを流した流路C中を高速に流れる生体粒子Pに照射される。光が照射された生体粒子Pから発せられる反射光もしくは透過光及び/又は蛍光は、検出光学系121を通して撮像部122の受光面上に結像される。
More specifically, the light output from the detection light source unit 111 (hereinafter also referred to as excitation light) is condensed by the light guiding optical system 112 . The condensed light irradiates the bioparticles P flowing at high speed in the channel C through which the biosample S with the bioparticles P floating is flowed. Reflected light or transmitted light and/or fluorescence emitted from the biological particles P irradiated with light are imaged on the light receiving surface of the imaging unit 122 through the detection optical system 121 .
撮像部122は、例えば、2次元格子状に配列する画素を備える。この撮像部122には、所定のフレームレートで画像データ(フレームデータともいう)を出力するフレーム型のイメージセンサであってもよいし、入射光の輝度変化に基づいてイベントを検出するイベント画素が2次元格子状に配列するEVS(Event-based Vision Sensor)であってもよい。なお、その詳細については後述するが、EVSは、フレームデータに代えて、イベントを検出した画素の位置情報(Xアドレス及びYアドレス)、検出されたイベントの極性情報(正イベント/負イベント)、イベントを検出した時刻の情報(タイムスタンプ)等を含むイベントデータを同期又は非同期で出力するセンサであってよい。
The imaging unit 122 has, for example, pixels arranged in a two-dimensional grid. The imaging unit 122 may be a frame-type image sensor that outputs image data (also referred to as frame data) at a predetermined frame rate, or may include event pixels that detect an event based on a change in luminance of incident light. It may be an EVS (Event-based Vision Sensor) arranged in a two-dimensional grid. Although the details will be described later, the EVS includes position information (X address and Y address) of the pixel where the event was detected, polarity information (positive event/negative event) of the detected event, and It may be a sensor that synchronously or asynchronously outputs event data including information (timestamp) of the time when an event was detected.
撮像部122において所定のフレームレートで取得されたフレームデータ、又は、撮像部122の受光面上を移動する生体粒子Pの像に対応して各画素で発生する一連のイベントデータ(以下、イベントストリームともいう)は、信号処理部123に送られる。
Frame data acquired at a predetermined frame rate in the imaging unit 122, or a series of event data (hereinafter referred to as event stream ) is sent to the signal processing unit 123 .
速度計測部124は、例えば、流路Cを流れる生体粒子Pの速度計測部124に対する相対速度を計測する。本例では、速度計測部124が流路Cに対して静止している場合を例示するため、以下の説明では、速度計測部124が生体粒子Pの速度を計測すると称する。
The speed measurement unit 124 measures the relative speed of the biological particles P flowing through the flow path C with respect to the speed measurement unit 124, for example. In this example, since the case where the speed measuring unit 124 is stationary with respect to the flow channel C is illustrated, the speed measuring unit 124 measures the speed of the biological particles P in the following description.
この速度計測部124には、静電方式や光学方式など、生体粒子Pの速度を検出可能な種々の検出方式が採用されてよい。速度計測部124で検出された生体粒子Pの速度は、随時、信号処理部123に送られる。
Various detection methods capable of detecting the speed of the biological particles P, such as an electrostatic method and an optical method, may be adopted for this speed measurement unit 124 . The velocity of the biological particles P detected by the velocity measuring section 124 is sent to the signal processing section 123 at any time.
なお、流路Cを流れる生体粒子Pの速度が生体試料Sを送出するポンプ系を制御することで所望の速度に維持されるように制御されている場合など、生体粒子Pの速度が既知の場合では、速度計測部124が省略されてもよい。ただし、生体粒子Pの速度が既知の場合でも、周辺温度や送液系の抵抗変化等により生体粒子Pの速度が変動し得るため、速度計測部124を用いて生体粒子Pの速度を実測してもよい。
In addition, when the speed of the biological particles P flowing through the flow path C is controlled so as to be maintained at a desired speed by controlling the pump system for feeding the biological sample S, the speed of the biological particles P is known. In some cases, the velocity measurement unit 124 may be omitted. However, even if the velocity of the biological particles P is known, the velocity of the biological particles P may fluctuate due to changes in the ambient temperature, the resistance of the liquid feeding system, and the like. may
信号処理部123は、例えば、撮像部122がフレーム型のイメージセンサである場合、入力されたフレームデータに対してホワイトバランス調整やディストーション補正などの所定の処理を実行し、処理後のフレームデータを情報処理部103に送る。一方、撮像部122がEVSである場合、信号処理部123は、撮像部122から入力されたイベントストリームと生体粒子Pの速度とから生体粒子Pの像のフレームデータを再構成し、再構成されたフレームデータを情報処理部103に送る。
For example, when the imaging unit 122 is a frame-type image sensor, the signal processing unit 123 performs predetermined processing such as white balance adjustment and distortion correction on the input frame data, and outputs the processed frame data. It is sent to the information processing section 103 . On the other hand, when the imaging unit 122 is an EVS, the signal processing unit 123 reconstructs frame data of the image of the biological particles P from the event stream input from the imaging unit 122 and the velocity of the biological particles P, and reconstructs the frame data. The received frame data is sent to the information processing section 103 .
なお、撮像部122がEVSである場合、生体粒子Pの速度変化は生体粒子Pの到来頻度と比べて十分に緩やかである。そのため、フレームデータの再構成に使用する生体粒子Pの速度は、再構成されるフレームデータに含まれる生体粒子Pそのものの速度に限定されず、その前及び/又は後に到来した生体粒子Pの速度や平均値等であってもよい。
It should be noted that when the imaging unit 122 is an EVS, the speed change of the biological particles P is sufficiently moderate compared to the arrival frequency of the biological particles P. Therefore, the velocity of the bioparticles P used to reconstruct the frame data is not limited to the velocity of the bioparticles P themselves included in the reconstructed frame data. , an average value, or the like.
情報処理部103は、信号処理部123から入力したフレームデータを分析し、流路C内を移動中の生体粒子Pの回転を相殺する補正や、その特徴量の抽出や、生体粒子Pの種別の判別等を実行する。また、情報処理部103は、表示部を備え、分析に使用した生体粒子情報や分析の結果に基づいた特徴量や統計データや種別の判別結果等をユーザに提示してもよい。さらに、情報処理部103は、生体粒子Pの種別判別結果に基づいて分取部104を制御することで、特定の種別の生体粒子Pを分別して捕集してもよい。
The information processing unit 103 analyzes the frame data input from the signal processing unit 123, corrects to offset the rotation of the biological particles P moving in the flow channel C, extracts the feature amount, and determines the type of the biological particles P. , etc., is executed. The information processing unit 103 may also include a display unit, and present bioparticle information used for analysis, feature amounts and statistical data based on analysis results, classification results, and the like to the user. Further, the information processing section 103 may control the sorting section 104 based on the type determination result of the bioparticles P to separate and collect the bioparticles P of a specific type.
分取部104は、情報処理部103による生体粒子Pの種別判別結果に基づいて、流路C内を移動中の生体粒子Pをウェルプレート20の各ウェルに1つずつ分取する。特定の種別の生体粒子Pがウェルプレート20の各ウェルに分別して捕集される。
The sorting unit 104 sorts the bioparticles P moving in the channel C one by one into each well of the well plate 20 based on the result of the type discrimination of the bioparticles P by the information processing unit 103 . Specific types of biological particles P are collected separately in the wells of the well plate 20 .
粒子数計測部105は、その詳細については後述するが、光源部と撮像部と走査機構とを備え、ウェルプレート20の各ウェルを光源部で照明しつつ深さ方向(垂直方向ともいう)に走査することで、各ウェル内に分取された生体粒子Pの数を計測する。
The particle number measuring unit 105, which will be described in detail later, includes a light source unit, an imaging unit, and a scanning mechanism. By scanning, the number of bioparticles P dispensed into each well is counted.
3.2 イメージセンサの構成例
ここで、撮像部122として使用され得るフレーム型のイメージセンサの概略構成例について説明する。図3は、本実施形態に係るフレーム型のイメージセンサの概略構成例を示すブロック図である。なお、本例では、CMOS(Complementary Metal-Oxide-Semiconductor)型のイメージセンサを例示するが、これに限定されず、CCD(Charge-Coupled Device)型など、カラー又はモノクロの画像データを取得可能な種々のイメージセンサであってよい。また、CMOS型のイメージセンサとは、CMOSプロセスを応用して、または、部分的に使用して作成されたイメージセンサであってよい。 3.2 Configuration Example of Image Sensor Here, a schematic configuration example of a frame-type image sensor that can be used as theimaging unit 122 will be described. FIG. 3 is a block diagram showing a schematic configuration example of a frame-type image sensor according to this embodiment. In this example, a CMOS (Complementary Metal-Oxide-Semiconductor) type image sensor is exemplified, but it is not limited to this, and a CCD (Charge-Coupled Device) type or the like can acquire color or monochrome image data. Various image sensors may be used. Also, the CMOS image sensor may be an image sensor manufactured by applying or partially using a CMOS process.
ここで、撮像部122として使用され得るフレーム型のイメージセンサの概略構成例について説明する。図3は、本実施形態に係るフレーム型のイメージセンサの概略構成例を示すブロック図である。なお、本例では、CMOS(Complementary Metal-Oxide-Semiconductor)型のイメージセンサを例示するが、これに限定されず、CCD(Charge-Coupled Device)型など、カラー又はモノクロの画像データを取得可能な種々のイメージセンサであってよい。また、CMOS型のイメージセンサとは、CMOSプロセスを応用して、または、部分的に使用して作成されたイメージセンサであってよい。 3.2 Configuration Example of Image Sensor Here, a schematic configuration example of a frame-type image sensor that can be used as the
図3に示すように、イメージセンサ122aは、例えば、画素アレイ部31が形成された半導体チップと、周辺回路が形成された半導体チップとが積層されたスタック構造を有する。周辺回路には、例えば、垂直駆動回路32、カラム処理回路33、水平駆動回路34及びシステム制御部35が含まれ得る。
As shown in FIG. 3, the image sensor 122a has, for example, a stacked structure in which a semiconductor chip in which the pixel array section 31 is formed and a semiconductor chip in which a peripheral circuit is formed are stacked. Peripheral circuits may include, for example, a vertical drive circuit 32 , a column processing circuit 33 , a horizontal drive circuit 34 and a system controller 35 .
イメージセンサ122aは更に、信号処理部38及びデータ格納部39を備えている。信号処理部38及びデータ格納部39は、周辺回路と同じ半導体チップに設けられてもよいし、別の半導体チップに設けられてもよい。
The image sensor 122a further includes a signal processing section 38 and a data storage section 39. The signal processing unit 38 and the data storage unit 39 may be provided on the same semiconductor chip as the peripheral circuit, or may be provided on a separate semiconductor chip.
画素アレイ部31は、受光した光量に応じた電荷を生成しかつ蓄積する光電変換素子を有する画素30が行方向及び列方向に、すなわち、行列状に2次元格子状に配置された構成を有する。ここで、行方向とは画素行の画素の配列方向(図面中、横方向)をいい、列方向とは画素列の画素の配列方向(図面中、縦方向)をいう。
The pixel array section 31 has a configuration in which pixels 30 each having a photoelectric conversion element that generates and accumulates an electric charge according to the amount of received light are arranged in a two-dimensional lattice in rows and columns, that is, in rows and columns. . Here, the row direction refers to the arrangement direction of pixels in a pixel row (horizontal direction in the drawing), and the column direction refers to the arrangement direction of pixels in a pixel column (vertical direction in the drawing).
画素アレイ部31では、行列状の画素配列に対し、画素行ごとに画素駆動線LDが行方向に沿って配線され、画素列ごとに垂直信号線VSLが列方向に沿って配線されている。画素駆動線LDは、画素から信号を読み出す際の駆動を行うための駆動信号を伝送する。図3では、画素駆動線LDが1本ずつの配線として示されているが、1本ずつに限られるものではない。画素駆動線LDの一端は、垂直駆動回路32の各行に対応した出力端に接続されている。
In the pixel array section 31, pixel drive lines LD are wired along the row direction for each pixel row, and vertical signal lines VSL are wired along the column direction for each pixel column, with respect to the matrix-like pixel array. The pixel drive line LD transmits a drive signal for driving when reading a signal from a pixel. In FIG. 3, the pixel drive lines LD are shown as wirings one by one, but the number of the pixel drive lines LD is not limited to one each. One end of the pixel drive line LD is connected to an output terminal corresponding to each row of the vertical drive circuit 32 .
垂直駆動回路32は、シフトレジスタやアドレスデコーダなどによって構成され、画素アレイ部31の各画素を全画素同時あるいは行単位等で駆動する。すなわち、垂直駆動回路32は、当該垂直駆動回路32を制御するシステム制御部35と共に、画素アレイ部31の各画素の動作を制御する駆動部を構成している。この垂直駆動回路32はその具体的な構成については図示を省略するが、一般的に、読出し走査系と掃出し走査系との2つの走査系を備えている。
The vertical drive circuit 32 is composed of a shift register, an address decoder, etc., and drives each pixel of the pixel array section 31 simultaneously or in units of rows. That is, the vertical drive circuit 32 constitutes a drive section that controls the operation of each pixel of the pixel array section 31 together with a system control section 35 that controls the vertical drive circuit 32 . The vertical drive circuit 32 generally has two scanning systems, a readout scanning system and a discharge scanning system, although the specific configuration thereof is not shown.
読出し走査系は、画素30から信号を読み出すために、画素アレイ部31の画素30を行単位で順に選択走査する。画素30から読み出される信号はアナログ信号である。掃出し走査系は、読出し走査系によって読出し走査が行われる読出し行に対して、その読出し走査よりも露光時間分だけ先行して掃出し走査を行う。
The readout scanning system sequentially selectively scans the pixels 30 of the pixel array section 31 row by row in order to read out signals from the pixels 30 . A signal read out from the pixel 30 is an analog signal. The sweep-scanning system performs sweep-scanning ahead of the read-out scanning by the exposure time for the read-out rows to be read-scanned by the read-out scanning system.
この掃出し走査系による掃出し走査により、読出し行の画素30の光電変換素子から不要な電荷が掃き出されることによって当該光電変換素子がリセットされる。そして、この掃出し走査系で不要電荷を掃き出す(リセットする)ことにより、所謂電子シャッタ動作が行われる。ここで、電子シャッタ動作とは、光電変換素子の電荷を捨てて、新たに露光を開始する(電荷の蓄積を開始する)動作のことを言う。
Due to sweeping scanning by this sweeping scanning system, unnecessary charges are swept out from the photoelectric conversion elements of the pixels 30 in the readout row, thereby resetting the photoelectric conversion elements. A so-called electronic shutter operation is performed by sweeping out (resetting) the unnecessary charges in this sweeping scanning system. Here, the electronic shutter operation means an operation of discarding the charge of the photoelectric conversion element and newly starting exposure (starting charge accumulation).
読出し走査系による読出し動作によって読み出される信号は、その直前の読出し動作または電子シャッタ動作以降に受光した光量に対応している。そして、直前の読出し動作による読出しタイミングまたは電子シャッタ動作による掃出しタイミングから、今回の読出し動作による読出しタイミングまでの期間が、画素30における電荷の蓄積期間(露光期間ともいう)となる。
The signal read out by the readout operation by the readout scanning system corresponds to the amount of light received after the immediately preceding readout operation or the electronic shutter operation. The period from the readout timing of the previous readout operation or the sweep timing of the electronic shutter operation to the readout timing of the current readout operation is a charge accumulation period (also referred to as an exposure period) in the pixels 30 .
垂直駆動回路32によって選択走査された画素行の各画素30から出力される信号は、画素列ごとに垂直信号線VSLの各々を通してカラム処理回路33に入力される。カラム処理回路33は、画素アレイ部31の画素列ごとに、選択行の各画素から垂直信号線VSLを通して出力される信号に対して所定の信号処理を行うとともに、信号処理後の画素信号を一時的に保持する。
A signal output from each pixel 30 in a pixel row selectively scanned by the vertical drive circuit 32 is input to the column processing circuit 33 through each vertical signal line VSL for each pixel column. The column processing circuit 33 performs predetermined signal processing on a signal output from each pixel of the selected row through the vertical signal line VSL for each pixel column of the pixel array section 31, and temporarily stores the pixel signal after the signal processing. to be retained.
具体的には、カラム処理回路33は、信号処理として少なくとも、ノイズ除去処理、例えばCDS(Correlated Double Sampling:相関二重サンプリング)処理や、DDS(Double Data Sampling)処理を行う。例えば、CDS処理により、リセットノイズや画素内の増幅トランジスタの閾値ばらつき等の画素固有の固定パターンノイズが除去される。カラム処理回路33は、その他にも、例えば、AD(アナログ-デジタル)変換機能を備え、光電変換素子から読み出され得たアナログの画素信号をデジタル信号に変換して出力する。
Specifically, the column processing circuit 33 performs at least noise removal processing, such as CDS (Correlated Double Sampling) processing and DDS (Double Data Sampling) processing, as signal processing. For example, the CDS processing removes pixel-specific fixed pattern noise such as reset noise and variations in threshold values of amplification transistors in pixels. The column processing circuit 33 also has an AD (analog-digital) conversion function, for example, and converts analog pixel signals read from the photoelectric conversion elements into digital signals and outputs the digital signals.
水平駆動回路34は、シフトレジスタやアドレスデコーダなどによって構成され、カラム処理回路33の画素列に対応する読出し回路(以下、画素回路という)を順番に選択する。この水平駆動回路34による選択走査により、カラム処理回路33において画素回路ごとに信号処理された画素信号が順番に出力される。
The horizontal driving circuit 34 is composed of shift registers, address decoders, etc., and sequentially selects readout circuits (hereinafter referred to as pixel circuits) corresponding to the pixel columns of the column processing circuit 33 . By selective scanning by the horizontal drive circuit 34, pixel signals that have undergone signal processing for each pixel circuit in the column processing circuit 33 are sequentially output.
システム制御部35は、各種のタイミング信号を生成するタイミングジェネレータなどによって構成され、当該タイミングジェネレータで生成された各種のタイミングを基に、垂直駆動回路32、カラム処理回路33、及び、水平駆動回路34などの駆動制御を行う。
The system control unit 35 is composed of a timing generator that generates various timing signals. and other drive control.
信号処理部38は、少なくとも演算処理機能を有し、カラム処理回路33から出力される画素信号に対して演算処理等の種々の信号処理を行う。データ格納部39は、信号処理部38での信号処理にあたって、その処理に必要なデータを一時的に格納する。なお、信号処理部38がホワイトバランス調整やディストーション補正などの演算機能を備えている場合、図2の信号処理部123は省略されてもよい。
The signal processing unit 38 has at least an arithmetic processing function, and performs various signal processing such as arithmetic processing on pixel signals output from the column processing circuit 33 . The data storage unit 39 temporarily stores data necessary for signal processing in the signal processing unit 38 . Note that if the signal processing unit 38 has arithmetic functions such as white balance adjustment and distortion correction, the signal processing unit 123 in FIG. 2 may be omitted.
3.3 EVSの構成例
つづいて、撮像部122として使用され得るEVSの概略構成例について説明する。図4は、本実施形態に係るEVSの概略構成例を示すブロック図である。図4に示すように、EVS122bは、画素アレイ部41と、Xアービタ42及びYアービタ43と、イベント信号処理回路44と、システム制御回路45と、出力インタフェース(I/F)46とを備える。 3.3 Configuration Example of EVS Next, a schematic configuration example of an EVS that can be used as theimaging unit 122 will be described. FIG. 4 is a block diagram showing a schematic configuration example of the EVS according to this embodiment. As shown in FIG. 4, the EVS 122b includes a pixel array section 41, an X arbiter 42 and a Y arbiter 43, an event signal processing circuit 44, a system control circuit 45, and an output interface (I/F) 46.
つづいて、撮像部122として使用され得るEVSの概略構成例について説明する。図4は、本実施形態に係るEVSの概略構成例を示すブロック図である。図4に示すように、EVS122bは、画素アレイ部41と、Xアービタ42及びYアービタ43と、イベント信号処理回路44と、システム制御回路45と、出力インタフェース(I/F)46とを備える。 3.3 Configuration Example of EVS Next, a schematic configuration example of an EVS that can be used as the
画素アレイ部41は、それぞれ入射光の輝度変化に基づいてイベントを検出する複数のイベント画素40が2次元格子状に配列した構成を備える。なお、以下の説明において、行方向(ロウ方向ともいう)とは画素行の画素の配列方向(図面中、横方向)をいい、列方向(カラム方向ともいう)とは画素列の画素の配列方向(図面中、縦方向)をいう。
The pixel array section 41 has a configuration in which a plurality of event pixels 40 each detecting an event based on a change in luminance of incident light are arranged in a two-dimensional lattice. In the following description, the row direction (also referred to as row direction) refers to the arrangement direction of pixels in pixel rows (horizontal direction in the drawings), and the column direction (also referred to as column direction) refers to the arrangement of pixels in pixel columns. It refers to the direction (vertical direction in the drawing).
各イベント画素40は、入射光の輝度に応じた電荷を生成する光電変換素子を備え、光電変換素子から流れ出した光電流に基づいて入射光の輝度変化を検出した場合、自身からの読出しを要求するリクエストをXアービタ42及びYアービタ43へ出力し、Xアービタ42及びYアービタ43による調停に従って、イベントを検出したことを示すイベント信号を出力する。
Each event pixel 40 has a photoelectric conversion element that generates a charge corresponding to the luminance of incident light, and requests reading from itself when a change in luminance of incident light is detected based on a photocurrent that flows from the photoelectric conversion element. request to the X arbiter 42 and the Y arbiter 43, and according to the arbitration by the X arbiter 42 and the Y arbiter 43, an event signal indicating that an event has been detected is output.
各イベント画素40は、入射光の輝度に応じた光電流に、所定の閾値を超える変化が生じたか否かによって、イベントの有無を検出する。例えば、各イベント画素40は、輝度変化が所定の閾値を超えたこと(正イベント)、又は、下回ったこと(負イベント)をイベントとして検出する。
Each event pixel 40 detects the presence or absence of an event depending on whether or not the photocurrent corresponding to the luminance of incident light has changed by exceeding a predetermined threshold. For example, each event pixel 40 detects, as an event, that the luminance change exceeds (positive event) or falls below (negative event) a predetermined threshold.
イベント画素40は、イベントを検出した際に、イベントの発生を表すイベント信号の出力許可を要求するリクエストをXアービタ42及びYアービタ43にそれぞれに出力する。そして、イベント画素40は、イベント信号の出力許可を表す応答をXアービタ42及びYアービタ43それぞれから受け取った場合、イベント信号処理回路44に対してイベント信号を出力する。
When the event pixel 40 detects an event, it outputs a request to the X arbiter 42 and the Y arbiter 43 to request permission to output an event signal representing the occurrence of the event. Then, the event pixel 40 outputs the event signal to the event signal processing circuit 44 when receiving a response indicating permission to output the event signal from each of the X arbiter 42 and the Y arbiter 43 .
Xアービタ42及びYアービタ43は、複数のイベント画素40それぞれから供給されるイベント信号の出力を要求するリクエストを調停し、その調停結果(イベント信号の出力の許可/不許可)に基づく応答、及び、イベント検出をリセットするリセット信号を、リクエストを出力したイベント画素40に送信する。
The X arbiter 42 and the Y arbiter 43 arbitrate requests requesting the output of event signals supplied from the plurality of event pixels 40 respectively, and respond based on the arbitration results (permission/non-permission of event signal output), and , sends a reset signal for resetting event detection to the event pixel 40 that output the request.
イベント信号処理回路44は、イベント画素40から入力されたイベント信号に対して所定の信号処理を実行することで、イベントデータを生成して出力する。
The event signal processing circuit 44 generates and outputs event data by executing predetermined signal processing on the event signal input from the event pixel 40 .
上述したように、イベント画素40で生成される光電流の変化は、イベント画素40の光電変換部に入射する光の光量変化(輝度変化)とも捉えることができる。従って、イベントは、所定の閾値を超えるイベント画素40の光量変化(輝度変化)であるとも言うことができる。イベントの発生を表すイベントデータには、少なくとも、イベントとしての光量変化が発生したイベント画素40の位置を表す座標等の位置情報が含まれる。イベントデータには、位置情報の他、光量変化の極性を含ませることができる。
As described above, the change in the photocurrent generated by the event pixel 40 can also be regarded as the change in the amount of light (luminance change) incident on the photoelectric conversion portion of the event pixel 40 . Therefore, an event can also be said to be a light amount change (brightness change) of the event pixel 40 exceeding a predetermined threshold. The event data representing the occurrence of an event includes at least position information such as coordinates representing the position of the event pixel 40 where the change in the amount of light has occurred as an event. The event data can include the polarity of the change in the amount of light in addition to the positional information.
イベント画素40からイベントが発生したタイミングで出力されるイベントデータの系列については、イベントデータ同士の間隔がイベントの発生時のまま維持されている限り、イベントデータは、イベントが発生した相対的な時刻を表す時間情報を暗示的に含んでいるということができる。
As for the series of event data output from the event pixel 40 at the timing when the event occurs, as long as the interval between the event data is maintained at the time when the event occurred, the event data is the relative time when the event occurred. It can be said that it implicitly includes time information representing
但し、イベントデータがメモリに記憶されること等により、イベントデータ同士の間隔がイベントの発生時のまま維持されなくなると、イベントデータに暗示的に含まれる時間情報が失われる。そのため、イベント信号処理回路44は、イベントデータ同士の間隔がイベントの発生時のまま維持されなくなる前に、イベントデータに、タイムスタンプ等のイベントが発生した相対的な時刻を表す時間情報を含めてもよい。
However, if the interval between the event data is not maintained as it was when the event occurred due to the event data being stored in the memory, the time information implicitly included in the event data is lost. Therefore, the event signal processing circuit 44 includes time information such as a time stamp in the event data representing the relative time when the event occurred before the interval between the event data is no longer maintained as it was when the event occurred. good too.
(その他構成)
システム制御回路45は、各種のタイミング信号を生成するタイミングジェネレータなどによって構成され、当該タイミングジェネレータで生成された各種のタイミングを基に、Xアービタ42、Yアービタ43、及び、イベント信号処理回路44などの駆動制御を行う。 (Other configurations)
Thesystem control circuit 45 is composed of a timing generator that generates various timing signals, and controls the X arbiter 42, the Y arbiter 43, the event signal processing circuit 44, etc. based on the various timings generated by the timing generator. drive control.
システム制御回路45は、各種のタイミング信号を生成するタイミングジェネレータなどによって構成され、当該タイミングジェネレータで生成された各種のタイミングを基に、Xアービタ42、Yアービタ43、及び、イベント信号処理回路44などの駆動制御を行う。 (Other configurations)
The
出力I/F46は、イベント信号処理回路44から行単位で出力されたイベントデータを順次、イベントストリームとして信号処理部123へ出力する。それに対し、信号処理部123は、イベントストリームとして入力されたイベントデータを所定のフレーム期間蓄積することで、所定のフレームレートの画像データ(フレームデータともいう)を生成する。
The output I/F 46 sequentially outputs the event data output in units of rows from the event signal processing circuit 44 to the signal processing section 123 as an event stream. On the other hand, the signal processing unit 123 generates image data (also referred to as frame data) at a predetermined frame rate by accumulating event data input as an event stream for a predetermined frame period.
3.4 粒子数計測部の概略構成例
次に、本実施形態に係る粒子数計測部105の概略構成例について説明する。図5は、本実施形態に係る粒子数計測部の概略構成例を示すブロック図である。図5に示すように、粒子数計測部105は、カメラユニット10と、面内走査機構15と、撮像用光源部16と、データ処理部17と、表示部18と、制御部19とを備える。 3.4 Schematic Configuration Example of Particle Number Measuring Unit Next, a schematic configuration example of the particlenumber measuring unit 105 according to the present embodiment will be described. FIG. 5 is a block diagram showing a schematic configuration example of the particle number measuring unit according to this embodiment. As shown in FIG. 5, the particle number measuring unit 105 includes a camera unit 10, an in-plane scanning mechanism 15, an imaging light source unit 16, a data processing unit 17, a display unit 18, and a control unit 19. .
次に、本実施形態に係る粒子数計測部105の概略構成例について説明する。図5は、本実施形態に係る粒子数計測部の概略構成例を示すブロック図である。図5に示すように、粒子数計測部105は、カメラユニット10と、面内走査機構15と、撮像用光源部16と、データ処理部17と、表示部18と、制御部19とを備える。 3.4 Schematic Configuration Example of Particle Number Measuring Unit Next, a schematic configuration example of the particle
(撮像用光源部16)
撮像用光源部16は、図2における検出用光源部111と同様に、ウェルプレート20の各ウェルに分取された生体粒子Pを励起するための励起光を出力する。 (Imaging light source unit 16)
The imaginglight source unit 16 outputs excitation light for exciting the bioparticles P dispensed into the wells of the well plate 20, similarly to the detection light source unit 111 in FIG.
撮像用光源部16は、図2における検出用光源部111と同様に、ウェルプレート20の各ウェルに分取された生体粒子Pを励起するための励起光を出力する。 (Imaging light source unit 16)
The imaging
(カメラユニット10)
カメラユニット10は、対物レンズ11と、ビームスプリッタ12と、撮像部13と、垂直走査機構14とを備える。 (Camera unit 10)
Thecamera unit 10 includes an objective lens 11 , a beam splitter 12 , an imaging section 13 and a vertical scanning mechanism 14 .
カメラユニット10は、対物レンズ11と、ビームスプリッタ12と、撮像部13と、垂直走査機構14とを備える。 (Camera unit 10)
The
ビームスプリッタ12は、例えば、ダイクロイックミラーなど、特定の波長帯の光を反射し、他の特定の波長帯の光を透過する分光ビームスプリッタを含んで構成され、撮像用光源部16から出力された励起光を反射し、この励起光が照射されたウェル内の生体粒子Pから放射された蛍光を透過する。
The beam splitter 12 includes, for example, a spectral beam splitter such as a dichroic mirror that reflects light in a specific wavelength band and transmits light in other specific wavelength bands. It reflects the excitation light and transmits fluorescence emitted from the bioparticles P in the well irradiated with the excitation light.
対物レンズ11は、例えば、1以上のレンズとこれを保持する鏡筒から構成される。この対物レンズ11は、ビームスプリッタ12で反射された励起光を、ウェルプレート20における観測対象の1つのウェル全体を照射するように集光する。また、対物レンズ11は、励起光が照射されたウェル内の生体粒子Pから放射された蛍光の像を撮像部13の受光面に結像する結像レンズとしての機能も備える。ただし、ビームスプリッタ12又は撮像部13が蛍光像を結像する結像レンズを備えている場合、対物レンズ11は、結像レンズとしての機能を備えていなくてもよい。
The objective lens 11 is composed of, for example, one or more lenses and a lens barrel that holds them. The objective lens 11 converges the excitation light reflected by the beam splitter 12 so as to irradiate the entire one well to be observed in the well plate 20 . The objective lens 11 also functions as an imaging lens that forms an image of the fluorescence emitted from the bioparticles P in the well irradiated with the excitation light on the light receiving surface of the imaging unit 13 . However, if the beam splitter 12 or the imaging unit 13 has an imaging lens that forms a fluorescent image, the objective lens 11 does not have to function as an imaging lens.
垂直走査機構14は、対物レンズ11の焦点位置をZ方向、すなわち、ウェルプレート20における各ウェルの深さ方向に沿って走査する走査部である。この垂直走査機構14は、対物レンズ11をZ方向に移動させることで対物レンズ11の焦点位置をウェルの深さ方向に走査してもよいし、対物レンズ11とビームスプリッタ12と撮像部13とから構成される構造体全体(又は構造体が固定されたプレート)をZ方向に移動させることで対物レンズ11の焦点位置をウェルの深さ方向に走査してもよいし、対物レンズ11を構成する1つ以上のレンズのうちの1又は2以上を移動させることで対物レンズ11の焦点位置をウェルの深さ方向に走査してもよい。また、垂直走査機構14は、対物レンズ11の焦点位置を、ウェルの底面側から上面側に向けて走査してもよいし、上面側から底面側へ向けて走査してもよい。
The vertical scanning mechanism 14 is a scanning unit that scans the focal position of the objective lens 11 along the Z direction, that is, along the depth direction of each well in the well plate 20 . This vertical scanning mechanism 14 may scan the focal position of the objective lens 11 in the depth direction of the well by moving the objective lens 11 in the Z direction. (or a plate to which the structure is fixed) may be moved in the Z direction to scan the focal position of the objective lens 11 in the depth direction of the well. The focal position of the objective lens 11 may be scanned in the depth direction of the well by moving one or more of the one or more lenses. Further, the vertical scanning mechanism 14 may scan the focal position of the objective lens 11 from the bottom side of the well toward the top side, or may scan the well from the top side toward the bottom side.
なお、垂直走査機構14が対物レンズ11の焦点位置をZ方向に走査している期間中、対物レンズ11の焦点位置は、異なる2以上の時点で不図示のメモリ等記憶部に記録される。ここで、対物レンズ11の焦点位置は、所定の時間間隔で記録されてもよく、その際、記録時間(タイムスタンプ等)と共に記録されてもよい。記録された対物レンズ11の焦点位置を用いることにより、走査開始からの経過時間とイベントデータに含まれるタイムスタンプとに基づいて、イベントデータが検出された焦点位置を推定することが可能である。これにより、より正確な3Dマップを構築することも可能となる。また、垂直走査機構14が対物レンズ11の焦点位置をZ方向に走査する速度が予め決められている場合、焦点位置は走査開始からの経過時間に基づき推定することも可能である。
Note that while the vertical scanning mechanism 14 is scanning the focal position of the objective lens 11 in the Z direction, the focal position of the objective lens 11 is recorded in a storage unit such as a memory (not shown) at two or more different points in time. Here, the focal position of the objective lens 11 may be recorded at predetermined time intervals, and may be recorded together with the recording time (time stamp, etc.). By using the recorded focal position of the objective lens 11, it is possible to estimate the focal position where the event data is detected based on the elapsed time from the start of scanning and the time stamp included in the event data. This also makes it possible to construct a more accurate 3D map. Further, when the speed at which the vertical scanning mechanism 14 scans the focal position of the objective lens 11 in the Z direction is predetermined, the focal position can be estimated based on the elapsed time from the start of scanning.
撮像部13は、EVS131を備える。ウェル内の生体粒子Pから放射された蛍光の像は、EVS131の受光面に結像される。EVS131は、例えば、図4で例示したEVS122bと同様の構成であってよい。
The imaging unit 13 includes an EVS 131. An image of fluorescence emitted from the biological particles P in the well is formed on the light receiving surface of the EVS 131 . The EVS 131 may have, for example, the same configuration as the EVS 122b illustrated in FIG.
(面内走査機構15)
面内走査機構15は、ウェルプレート20における対物レンズ11の光軸上に位置するウェル、すなわち、観察対象のウェルを順番に入れ替えるための走査機構である。例えば、面内走査機構15は、XY平面内においてウェルプレート20をウェル1つ分ずつ水平移動させることで、対物レンズ11の光軸上に位置するウェルを順次入れ替える。ただし、これに限定されず、面内走査機構15がカメラユニット10に設けられ、対物レンズ11とビームスプリッタ12と撮像部13とから構成される構造体(撮像用光源部16を含んでもよい)を水平移動させることで、対物レンズ11の光軸上に位置するウェルが順番に入れ替えられる構成としてもよい。 (In-plane scanning mechanism 15)
The in-plane scanning mechanism 15 is a scanning mechanism for sequentially changing the wells positioned on the optical axis of the objective lens 11 in the well plate 20, that is, the wells to be observed. For example, the in-plane scanning mechanism 15 horizontally moves the well plate 20 one well at a time within the XY plane, thereby sequentially replacing the wells positioned on the optical axis of the objective lens 11 . However, it is not limited to this, and an in-plane scanning mechanism 15 is provided in the camera unit 10, and a structure composed of the objective lens 11, the beam splitter 12, and the imaging section 13 (may include the imaging light source section 16). may be horizontally moved to sequentially replace the wells located on the optical axis of the objective lens 11 .
面内走査機構15は、ウェルプレート20における対物レンズ11の光軸上に位置するウェル、すなわち、観察対象のウェルを順番に入れ替えるための走査機構である。例えば、面内走査機構15は、XY平面内においてウェルプレート20をウェル1つ分ずつ水平移動させることで、対物レンズ11の光軸上に位置するウェルを順次入れ替える。ただし、これに限定されず、面内走査機構15がカメラユニット10に設けられ、対物レンズ11とビームスプリッタ12と撮像部13とから構成される構造体(撮像用光源部16を含んでもよい)を水平移動させることで、対物レンズ11の光軸上に位置するウェルが順番に入れ替えられる構成としてもよい。 (In-plane scanning mechanism 15)
The in-
(データ処理部17)
データ処理部17は、例えば、対物レンズ11の焦点面の垂直走査に伴って撮像部13から入力されたイベントストリームから、画素座標軸とイベント発生時間軸から成る3次元空間にイベントがマッピングされた3Dマップを構築する。そして、データ処理部17は、構築された3Dマップに基づいて各ウェルに分取された生体粒子Pの数を計測する。その際、データ処理部17は、各ウェルにおける生体粒子Pの位置を特定してもよい。例えば、データ処理部17は、構築された3Dマップにおける時間軸をZ方向の位置に変換し各ウェルの3次元空間座標を作成することで、各ウェルにおける生体粒子Pの数及びその位置を検出してもよい。 (Data processing unit 17)
For example, the data processing unit 17 converts an event stream input from theimaging unit 13 along with vertical scanning of the focal plane of the objective lens 11 into a 3D image in which events are mapped in a three-dimensional space consisting of a pixel coordinate axis and an event occurrence time axis. build a map. Then, the data processing unit 17 counts the number of bioparticles P sorted into each well based on the constructed 3D map. At that time, the data processing unit 17 may specify the position of the bioparticle P in each well. For example, the data processing unit 17 converts the time axis in the constructed 3D map to the position in the Z direction and creates the three-dimensional spatial coordinates of each well, thereby detecting the number and position of the bioparticles P in each well. You may
データ処理部17は、例えば、対物レンズ11の焦点面の垂直走査に伴って撮像部13から入力されたイベントストリームから、画素座標軸とイベント発生時間軸から成る3次元空間にイベントがマッピングされた3Dマップを構築する。そして、データ処理部17は、構築された3Dマップに基づいて各ウェルに分取された生体粒子Pの数を計測する。その際、データ処理部17は、各ウェルにおける生体粒子Pの位置を特定してもよい。例えば、データ処理部17は、構築された3Dマップにおける時間軸をZ方向の位置に変換し各ウェルの3次元空間座標を作成することで、各ウェルにおける生体粒子Pの数及びその位置を検出してもよい。 (Data processing unit 17)
For example, the data processing unit 17 converts an event stream input from the
また、データ処理部17は、計測した生体粒子Pの数や位置に基づいて、ウェルプレート20の各ウェルに生体粒子Pがいくつ分取されているかや、各ウェルのどこに生体粒子Pが存在するか等をユーザに提示するユーザインタフェース(以下、単にUIともいう)を生成し、これを表示部18に表示してもよい。
Based on the measured number and position of the bioparticles P, the data processing unit 17 also determines how many bioparticles P are collected in each well of the well plate 20 and where in each well the bioparticles P are present. A user interface (hereinafter also simply referred to as UI) for presenting to the user whether or not, etc. may be generated and displayed on the display unit 18 .
(表示部18)
表示部18は、例えば、ディスプレイで構成され、データ処理部17により生成されたUIをユーザに対して表示する。また、表示部18は、データ処理部17により生成された各ウェルの3次元マップを表示してもよい。 (Display unit 18)
The display unit 18 is configured by, for example, a display, and displays the UI generated by the data processing unit 17 to the user. Moreover, the display unit 18 may display a three-dimensional map of each well generated by the data processing unit 17 .
なお、表示部18は、ディスプレイの代わりに、スマートフォンやタブレット端末やパーソナルコンピュータなどの表示部であってもよい。その場合、データ処理部17及び表示部18は、所定のネットワークを介して通信を行うための通信部を備えていてよい。
Note that the display unit 18 may be a display unit of a smartphone, a tablet terminal, a personal computer, or the like instead of the display. In that case, the data processing unit 17 and the display unit 18 may have a communication unit for communicating via a predetermined network.
(制御部19)
制御部19は、例えば、CPU(Central Processing Unit)などの情報処理装置で構成され、粒子数計測部105の各部の動作を統括的に制御する。 (control unit 19)
Thecontrol unit 19 is composed of, for example, an information processing device such as a CPU (Central Processing Unit), and controls the operation of each unit of the particle number measuring unit 105 in an integrated manner.
制御部19は、例えば、CPU(Central Processing Unit)などの情報処理装置で構成され、粒子数計測部105の各部の動作を統括的に制御する。 (control unit 19)
The
3.5 ウェルプレート及びウェルの構成例
つづいて、本実施形態に係るウェルプレート及びウェルについて説明する。図6は、本実施形態に係るウェルプレートの構成例を示す図である。図7は、図6に示すウェルプレートの一部を抜粋して示す図である。 3.5 Configuration Examples of Well Plate and Wells Next, the well plate and wells according to this embodiment will be described. FIG. 6 is a diagram showing a configuration example of a well plate according to this embodiment. FIG. 7 is a diagram showing a portion of the well plate shown in FIG. 6. FIG.
つづいて、本実施形態に係るウェルプレート及びウェルについて説明する。図6は、本実施形態に係るウェルプレートの構成例を示す図である。図7は、図6に示すウェルプレートの一部を抜粋して示す図である。 3.5 Configuration Examples of Well Plate and Wells Next, the well plate and wells according to this embodiment will be described. FIG. 6 is a diagram showing a configuration example of a well plate according to this embodiment. FIG. 7 is a diagram showing a portion of the well plate shown in FIG. 6. FIG.
図6に示すように、ウェルプレート20は、分取部104により落下軌道が変更された生体粒子Pを分取する容器であるウェル21が行列状に配列した状態でフレーム22により保持された構成を備える。各ウェル21の開口形状及び/又は水平断面形状は、円形や楕円形であってもよいし、三角形や四角形や六角形などの多角形であってもよい。例えば、96ウェルプレートや384ウェルプレートが用いられてもよい。また、生体粒子Pを分取する容器は、ウェルに限らず、プレート上に自立静置した液滴を生体粒子Pを分取する容器として使用してもよい。
As shown in FIG. 6, well plate 20 is configured such that wells 21, which are containers for sorting bioparticles P whose falling trajectory has been changed by sorting section 104, are arranged in a matrix and held by frame 22. Prepare. The opening shape and/or horizontal cross-sectional shape of each well 21 may be circular, elliptical, or polygonal such as triangular, quadrangular, or hexagonal. For example, a 96-well plate or a 384-well plate may be used. Moreover, the container for sorting the bioparticles P is not limited to the well, and a liquid drop standing on a plate may be used as the vessel for sorting the bioparticles P.
各ウェル21は、後述する撮像用光源部16から出射された励起光及び生体粒子Pから放射した蛍光に対して透明な部材を用いて構成される。各ウェル21の底面全体がフレーム22により支持される構成の場合には、各ウェル212を支持するフレーム22の底部も、励起光及び蛍光に対して透明な部材で構成されてよい。
Each well 21 is configured using a member transparent to excitation light emitted from the imaging light source unit 16 and fluorescence emitted from the biological particles P, which will be described later. In the case of a configuration in which the entire bottom surface of each well 21 is supported by the frame 22, the bottom of the frame 22 that supports each well 212 may also be made of a member transparent to excitation light and fluorescence.
なお、図5、図6及び以下の説明では、各ウェル21の底面側から励起光を照射する場合(ただし、ビームスプリッタ12は省略)を例示するが、これに限定されず、例えば、各ウェル21の開口側(上側)から励起光を照射する構成とされてもよい。その場合、カメラユニット10におけるビームスプリッタ12は省略されてよい。
In FIGS. 5 and 6 and the following description, the case where the excitation light is irradiated from the bottom side of each well 21 (however, the beam splitter 12 is omitted) is illustrated, but the present invention is not limited to this. The excitation light may be irradiated from the opening side (upper side) of 21 . In that case, the beam splitter 12 in the camera unit 10 may be omitted.
また、図7に示すように、各ウェル21は、例えば、分取部104により落下軌道が制御された生体粒子Pの分取精度を確保するため、例えば3~7mm程度の開口を有する。加えて、各ウェル21は、回収時に生体粒子Pに加わる衝撃を十分に低減するために、10~15mm程度の深さを有する。なお、各ウェル21には、生体粒子Pの回収時の衝撃緩和や回収された生体粒子Pの鮮度を保つため、予め所定の液体(例えば、シース液)が蓄えられていてよい。
In addition, as shown in FIG. 7, each well 21 has an opening of about 3 to 7 mm, for example, in order to ensure the sorting accuracy of the bioparticles P whose falling trajectory is controlled by the sorting section 104, for example. In addition, each well 21 has a depth of about 10-15 mm in order to sufficiently reduce the impact applied to the biological particles P during collection. In each well 21, a predetermined liquid (for example, a sheath liquid) may be stored in advance in order to absorb the impact of the biological particles P when collected and to keep the collected biological particles P fresh.
3.6 生体粒子数の計測について
次に、本実施形態に係る粒子数計測部105による生体粒子Pの数の計測、すなわち、ウェルプレート20の各ウェル21に生体粒子Pが正しく分取されているか否かの確認作業について説明する。 3.6 Measurement of the number of bioparticles Next, the number of bioparticles P is measured by the particlenumber measurement unit 105 according to the present embodiment, that is, when the bioparticles P are correctly dispensed into the wells 21 of the well plate 20. The following describes the work of confirming whether or not there is
次に、本実施形態に係る粒子数計測部105による生体粒子Pの数の計測、すなわち、ウェルプレート20の各ウェル21に生体粒子Pが正しく分取されているか否かの確認作業について説明する。 3.6 Measurement of the number of bioparticles Next, the number of bioparticles P is measured by the particle
図8は、フレーム型のイメージセンサを用いて各ウェルに分取された生体粒子を計測する場合を説明するための図であり、図9は、図8に示す場合に取得される画像データの一例を示す図である。また、図10は、EVSを用いて各ウェルに分取された生体粒子を計測する場合を説明するための図であり、図11は、図10に示す場合に構成される3次元マップ(以下、3Dマップともいう)の一例を示す図である。
FIG. 8 is a diagram for explaining the case of measuring bioparticles dispensed into each well using a frame-type image sensor, and FIG. 9 shows image data acquired in the case shown in FIG. It is a figure which shows an example. FIG. 10 is a diagram for explaining the case of measuring bioparticles dispensed in each well using EVS, and FIG. 11 is a three-dimensional map (hereinafter referred to as a , also referred to as a 3D map).
図8に示すように、フレーム型のイメージセンサ931を用いる場合、フレームの取得タイミングを走査の焦点深度間隔に同期させる必要があるため、高速で且つ位置精度の高い、位置センサ内蔵のステッピングモータのような走査機構が必要となり、デバイスコストの増加やデバイスサイズの増大化といった課題が発生する。
As shown in FIG. 8, when a frame-type image sensor 931 is used, it is necessary to synchronize the acquisition timing of frames with the intervals of the depth of focus of scanning. Such a scanning mechanism is required, and problems such as an increase in device cost and an increase in device size arise.
また、目視の場合と比較してより速い焦点面走査速度での検査が可能ではあるが、直径数マクロメートルの生体粒子Pを検出可能な解像度で直径数mmのウェル21の水平断面全体を画角に収めるために必要となる100万以上の画素数による撮像を、焦点深度が略0.1mm単位で十数mmの深さに渡って行うことになる。例えば、ウェル21の直径を3~7mmとし、深さを10~15mmとした場合、100万以上の画素数による撮像を百~百数十回行う必要がある。そのため、例えば画素階調を8bitと仮定した場合でも、取得・転送を要する画像データの総データ量が800Mbit(メガビット)以上の膨大なデータ量になってしまい、取得・転送に数秒程度の長い時間を要することとなる。
In addition, although inspection at a faster focal plane scanning speed than in the case of visual observation is possible, the entire horizontal cross section of the well 21 with a diameter of several mm can be imaged at a resolution that can detect biological particles P with a diameter of several macrometers. Imaging with a number of pixels of one million or more, which is necessary to fit in a corner, is performed over a depth of ten-odd millimeters with a depth of focus of approximately 0.1 mm. For example, when the well 21 has a diameter of 3 to 7 mm and a depth of 10 to 15 mm, it is necessary to perform 100 to 100-odd times of imaging with one million or more pixels. Therefore, even if the pixel gradation is assumed to be 8 bits, for example, the total amount of image data that needs to be acquired and transferred will be a huge amount of 800 Mbits (megabits) or more. is required.
更に、図9に示すように、ウェル21をZ方向(深さ方向)に略0.1mm単位でスライスした百~百数十枚の画像データを解析することで、ウェル21中の生体粒子Pの個数や位置を検出する必要があるため、解析すべきデータ量が膨大となり、その結果、画像解析に要する時間が長くなるという課題も存在する。
Furthermore, as shown in FIG. 9, by analyzing the image data of 100 to 100-odd pieces obtained by slicing the well 21 in approximately 0.1 mm units in the Z direction (depth direction), bioparticles P in the well 21 Since it is necessary to detect the number and position of the image, the amount of data to be analyzed becomes enormous, and as a result, there is also the problem that the time required for image analysis becomes long.
一方、図10に示すように、EVS131を用いる場合、垂直走査機構14は、対物レンズ11の焦点位置をウェル21の深さ方向に対して必ずしも一定では無い、任意の速度で走査する。このように、垂直走査機構14を用いて対物レンズ11の焦点位置を観察対象のウェル21の深さ方向に走査した場合、EVS131の受光面に結像される生体粒子Pの蛍光像は、焦点位置が生体粒子Pから離れている状態では存在を確認できるほどの輝度を持たず、焦点位置が生体粒子Pに近づくにつれてぼやけた状態から鮮明な状態に変化し、焦点位置が生体粒子Pに一致した状態で最も鮮明な状態となる。そして、焦点位置が生体粒子Pから遠ざかるにつれて鮮明な状態からぼやけた状態に変化し、焦点位置が生体粒子Pから大きく遠ざかると存在を確認できるほどの輝度を持たなくなる。
On the other hand, as shown in FIG. 10, when the EVS 131 is used, the vertical scanning mechanism 14 scans the focal position of the objective lens 11 in the depth direction of the well 21 at an arbitrary speed that is not necessarily constant. In this way, when the vertical scanning mechanism 14 is used to scan the focal position of the objective lens 11 in the depth direction of the well 21 to be observed, the fluorescent image of the biological particles P formed on the light receiving surface of the EVS 131 is at the focal point. When the position is far from the bioparticle P, it does not have enough brightness to confirm its existence, and as the focal position approaches the bioparticle P, it changes from a blurred state to a clear state, and the focal position matches the bioparticle P. The clearest state is obtained when the As the focal position moves away from the biological particle P, the clear state changes to a blurred state.
そのため、図11に示すように、垂直走査機構14をウェル21の深さ方向に走査している最中の輝度変化をEVS131で検出してウェル21内の深さ方向に時間軸tが対応した3Dマップを構築することで、生体粒子Pがウェル21内に何個存在しているかを検出することが可能となる。その際、イベントの発生時間における深さ方向の走査位置を検出保存する手段を別途搭載しておくことで、ウェル21内における生体粒子Pの深さ方向の位置を特定することもできる。走査位置を検出保存する手段としては、生体粒子Pに対応したイベントの検出に連動して読出し及び記録が行われる位置センサなどがある。なお、対物レンズ11の焦点位置を深さ方向に走査することで得られる生体粒子Pの蛍光に対応した発生イベント群の3Dマップ上における形状は、走査方向に延びた砂時計のような形状となる。
Therefore, as shown in FIG. 11, the EVS 131 detects the luminance change while the vertical scanning mechanism 14 is scanning the well 21 in the depth direction, and the time axis t corresponds to the depth direction in the well 21. By constructing a 3D map, it becomes possible to detect how many bioparticles P are present in the well 21 . In this case, the position of the bioparticle P in the well 21 in the depth direction can be specified by additionally installing means for detecting and storing the scanning position in the depth direction at the time when the event occurs. As means for detecting and storing the scanning position, there is a position sensor that performs reading and recording in conjunction with detection of an event corresponding to the bioparticle P. The shape of the generated event group corresponding to the fluorescence of the bioparticle P obtained by scanning the focal position of the objective lens 11 in the depth direction on the 3D map is an hourglass-like shape extending in the scanning direction. .
このように、EVS131は、各イベント画素40に入射する光が増加もしくは減少の変化を伴った際に、その事象をイベントとして同期又は非同期に出力する。そのため、輝度変化の生じないイベント画素40からはイベントデータが出力されないこと、イベント発生時に非同期で瞬時に出力されることなどの理由から、生体粒子Pの検出手段としてEVS131を用いることで、フレーム型のイメージセンサと比較してより少ないデータ転送量及びデータ処理量で、より高速な応答による生体粒子Pの検出が可能となる。
In this way, the EVS 131 synchronously or asynchronously outputs the event as an event when the light incident on each event pixel 40 changes to increase or decrease. Therefore, event data is not output from the event pixels 40 that do not change in brightness, and the event data is instantaneously output asynchronously when an event occurs. With a smaller amount of data transfer and data processing compared to the image sensor of the above, detection of the biological particles P is possible with a faster response.
また、画素の読出しタイミングを垂直走査の位置と同期させる必要も無いため、垂直走査機構14による高い位置精度及び高い速度制御が不要となる。例えば、垂直走査機構14がバネによりカメラユニット10を垂直走査の開始点から終了点まで単純にシフトさせるような簡便な構成を用いて数100ミリ秒程度の時間で10mmの液体深さを走査させる場合であっても、ウェル21内に存在する生体粒子Pの個数を正確に測定することができる。その結果、フレーム型のイメージセンサを用いた場合(例えば、数秒)と比べて測定時間を約1/10に短縮しつつ、垂直走査機構14のコスト及びサイズを低減することが可能となる。
Also, since there is no need to synchronize the pixel readout timing with the vertical scanning position, high positional accuracy and high speed control by the vertical scanning mechanism 14 are not required. For example, using a simple configuration in which the vertical scanning mechanism 14 simply shifts the camera unit 10 from the start point to the end point of vertical scanning by means of a spring, the liquid depth of 10 mm can be scanned in several hundred milliseconds. Even in this case, the number of bioparticles P present in the well 21 can be accurately measured. As a result, it is possible to reduce the cost and size of the vertical scanning mechanism 14 while shortening the measurement time to about 1/10 compared to when a frame-type image sensor is used (for example, several seconds).
3.7 粒子数計測動作のフロー例
次に、本実施形態に係る粒子数計測部105が実行する粒子数計測動作のフロー例について説明する。図12は、本実施形態に係る粒子数計測動作フローの一例を示すフローチャートである。なお、図12に示す動作は、制御部19により統括されてよいため、以下の説明では、制御部19の動作に着目する。 3.7 Flow Example of Particle Number Measuring Operation Next, a flow example of the particle number measuring operation executed by the particlenumber measuring unit 105 according to the present embodiment will be described. FIG. 12 is a flow chart showing an example of the particle number measurement operation flow according to this embodiment. Note that the operation shown in FIG. 12 may be controlled by the control unit 19, so the following description focuses on the operation of the control unit 19. FIG.
次に、本実施形態に係る粒子数計測部105が実行する粒子数計測動作のフロー例について説明する。図12は、本実施形態に係る粒子数計測動作フローの一例を示すフローチャートである。なお、図12に示す動作は、制御部19により統括されてよいため、以下の説明では、制御部19の動作に着目する。 3.7 Flow Example of Particle Number Measuring Operation Next, a flow example of the particle number measuring operation executed by the particle
図12に示すように、本実施形態に係る粒子数計測動作では、まず、計測開始にあたり、制御部19は、撮像用光源部16の駆動を開始する(ステップS101)。それにより、撮像用光源部16から出力された励起光が対物レンズ11を介してウェルプレート20へ照射される。なお、この時点で撮像部13のEVS131がアクティブ状態とされてよい。
As shown in FIG. 12, in the particle number measurement operation according to the present embodiment, first, at the start of measurement, the control unit 19 starts driving the imaging light source unit 16 (step S101). As a result, the well plate 20 is irradiated with the excitation light output from the imaging light source unit 16 through the objective lens 11 . At this time, the EVS 131 of the imaging unit 13 may be activated.
次に、制御部19は、垂直走査機構14を制御することで、例えば、対物レンズ11の焦点位置(焦点面ともいう)を初期位置に移動させる(ステップS102)。なお、初期位置は、ウェル21を底面から上面にかけて走査する場合、ウェル21の底面に相当する位置であってよく、上面から底面にかけて走査する場合、ウェル21の上面に相当する位置であってよい。
Next, the control unit 19 controls the vertical scanning mechanism 14 to move, for example, the focal position (also referred to as the focal plane) of the objective lens 11 to the initial position (step S102). The initial position may be a position corresponding to the bottom surface of the well 21 when the well 21 is scanned from the bottom surface to the top surface, and may be a position corresponding to the top surface of the well 21 when the well 21 is scanned from the top surface to the bottom surface. .
次に、制御部19は、面内走査機構15を制御してウェルプレート20を移動させることで、観測対象のウェル21を撮像部13の画角内に配置する(ステップS103)。例えば、面内走査機構15は、観測対象のウェル21の中心がEVS131の光軸上に位置するように、ウェルプレート20を水平移動させる。なお、観測対象とするウェル21は、例えば、ウェルプレート20の四隅のいずれかに位置するウェル21から順番に選択されてよい。
Next, the control unit 19 controls the in-plane scanning mechanism 15 to move the well plate 20, thereby arranging the observation target wells 21 within the angle of view of the imaging unit 13 (step S103). For example, the in-plane scanning mechanism 15 horizontally moves the well plate 20 so that the center of the well 21 to be observed is positioned on the optical axis of the EVS 131 . Note that the wells 21 to be observed may be selected in order from the wells 21 positioned at any of the four corners of the well plate 20, for example.
次に、制御部19は、垂直走査機構14を制御することで、対物レンズ11の焦点位置を初期位置から深さ方向に走査させ、その最中にEVS131から出力されたイベントデータを取得する(ステップS104)。なお、EVS131から出力されたイベントデータは、データ処理部17に入力され、ウェル21ごとに所定の記憶領域に蓄積される。
Next, the control unit 19 controls the vertical scanning mechanism 14 to scan the focal position of the objective lens 11 from the initial position in the depth direction, and acquires event data output from the EVS 131 during the scanning ( step S104). The event data output from the EVS 131 is input to the data processing unit 17 and accumulated in a predetermined storage area for each well 21. FIG.
次に、制御部19は、データ処理部17に対し、観測対象のウェル21に対応付けて蓄積されているイベントデータに基づいて当該ウェル21に分取された生体粒子Pの数及び/又は位置を検出する粒子数計測処理を実行させる(ステップS105)。なお、粒子数計測処理の詳細については、後述において図13を用いて説明する。また、ステップS105において、データ処理部17は、各ウェル21の3Dマップを生成してもよい。
Next, the control unit 19 instructs the data processing unit 17 based on the event data accumulated in association with the well 21 to be observed to determine the number and/or position of the bioparticles P collected in the well 21 to be observed. is executed (step S105). Details of the particle number measurement process will be described later with reference to FIG. 13 . Further, in step S105, the data processing section 17 may generate a 3D map of each well 21. FIG.
次に、制御部19は、ウェルプレート20における生体粒子Pの分取先とされた全てのウェル21に対して、粒子数計測処理を実行済みであるか否かを判定し(ステップS106)、実行済みでない場合(ステップS106のNO)、ステップS102へ戻り、次のウェル21に対して以降の動作を実行する。
Next, the control unit 19 determines whether or not the particle number counting process has been executed for all the wells 21 from which the bioparticles P are sorted in the well plate 20 (step S106), If not executed (NO in step S106), the process returns to step S102 and the subsequent operations are executed for the next well 21. FIG.
一方、分取先とされた全てのウェル21に対する粒子数計測処理を実行済みである場合(ステップS106のYES)、制御部19は、撮像用光源部16の駆動を停止する(ステップS107)。
On the other hand, if the particle number counting process has already been executed for all the wells 21 that are selected as collection destinations (YES in step S106), the control unit 19 stops driving the imaging light source unit 16 (step S107).
つづいて、制御部19は、ステップS105で計測されたウェル21ごとの生体粒子Pの数及びその位置に基づいて、ウェル21ごとの生体粒子Pの数及び/又はその位置をユーザに提示するためのUIを生成し(ステップS108)、生成されたUIを表示部18に表示させ(ステップS109)、その後、本動作を終了する。
Subsequently, the control unit 19 presents the number and/or positions of the bioparticles P per well 21 to the user based on the number and positions of the bioparticles P per well 21 measured in step S105. is generated (step S108), the generated UI is displayed on the display unit 18 (step S109), and then this operation is terminated.
3.8 粒子数計測処理の例
つづいて、図12のステップS105に示す粒子数計測処理の例について説明する。図13は、本実施形態に係る粒子数計測処理の一例を示すフローチャートである。 3.8 Example of Particle Number Measurement Processing Next, an example of the particle number measurement processing shown in step S105 of FIG. 12 will be described. FIG. 13 is a flowchart showing an example of particle number measurement processing according to this embodiment.
つづいて、図12のステップS105に示す粒子数計測処理の例について説明する。図13は、本実施形態に係る粒子数計測処理の一例を示すフローチャートである。 3.8 Example of Particle Number Measurement Processing Next, an example of the particle number measurement processing shown in step S105 of FIG. 12 will be described. FIG. 13 is a flowchart showing an example of particle number measurement processing according to this embodiment.
図13に示すように、本動作では、データ処理部17は、まず、図12のステップS104で取得されたイベントデータから観察対象であるウェル21の3Dマップ(例えば、図11参照)を構築する(ステップS120)。
As shown in FIG. 13, in this operation, the data processing unit 17 first constructs a 3D map (for example, see FIG. 11) of the well 21 to be observed from the event data acquired in step S104 of FIG. (Step S120).
次に、データ処理部17は、3Dマップに含まれるイベントデータのうちの1つ(対象イベント)を選択する(ステップS121)。なお、対象イベントは、例えば、タイムスタンプや画素の位置情報などに基づいて選択されてよい。例えば、タイムスタンプが示す時刻が古いイベントデータから順に対象イベントが選択されてもよいし、画素アレイ部41における左上のイベント画素40から順にX方向に沿って対象イベントが選択されてもよい。
Next, the data processing unit 17 selects one of the event data (target event) included in the 3D map (step S121). Note that the target event may be selected based on, for example, a time stamp, pixel position information, or the like. For example, target events may be selected in chronological order from event data indicated by timestamps, or target events may be selected in order from the upper left event pixel 40 in the pixel array section 41 along the X direction.
次に、データ処理部17は、選択した対象イベントの近傍に発生したイベント(以下、近傍イベントともいう)の数(以下、近傍イベント数ともいう)を計測する(ステップS122)。なお、近傍イベントは、例えば、X軸方向及びY軸方向(すなわち、XY平面内)において近傍に位置するイベントであってもよいし、X軸方向、Y軸方向及びt軸方向(すなわち、XYt空間内)において近傍に位置するイベントであってもよい。また、近傍とは、XY平面上であれば、対象イベントを検出したイベント画素40を基準としてX軸方向及びY軸方向に所定画素(例えば5画素)以内の領域であってよく、また、t軸上であれば、対象イベントのタイムスタンプが示す時刻から所定時間(例えば、数十マイクロ秒)以内の範囲であってよい。
Next, the data processing unit 17 measures the number of events (hereinafter also referred to as neighboring events) that occurred in the vicinity of the selected target event (hereinafter also referred to as the number of neighboring events) (step S122). Note that the nearby event may be, for example, an event located nearby in the X-axis direction and the Y-axis direction (that is, in the XY plane), or an event located in the X-axis direction, the Y-axis direction, and the t-axis direction (that is, the XYt space) may be events located nearby. The neighborhood may be an area within a predetermined number of pixels (for example, 5 pixels) in the X-axis direction and the Y-axis direction with respect to the event pixel 40 where the target event is detected, as long as it is on the XY plane. If it is on the axis, it may be within a predetermined time (for example, several tens of microseconds) from the time indicated by the time stamp of the target event.
次に、データ処理部17は、対象イベントがノイズであるか否かを判定するために、ステップS122で計測された近傍イベント数が予め設定しておいた閾値以上であるか否かを判定する(ステップS122)。近傍イベント数が閾値未満である場合(ステップS122のNO)、データ処理部17は、対象イベントをノイズと判定し(ステップS124)、ステップS128へ進む。
Next, in order to determine whether the target event is noise, the data processing unit 17 determines whether the number of neighboring events measured in step S122 is equal to or greater than a preset threshold. (Step S122). If the number of neighboring events is less than the threshold (NO in step S122), the data processing unit 17 determines that the target event is noise (step S124), and proceeds to step S128.
一方、近傍イベント数が閾値以上である場合(ステップS122のYES)、データ処理部17は、生体粒子Pに由来した計測対象のイベントであると判断する。同一の生体粒子Pを検出したイベントデータの集まりを特定するために、蓄積されているイベントデータ若しくはこれらのイベントデータにより構築された3Dマップから、対象イベントを含む一纏まりのイベント群を特定することもできる(ステップS125)。
On the other hand, if the number of neighboring events is equal to or greater than the threshold (YES in step S122), the data processing unit 17 determines that the event is an event to be measured derived from the biological particle P. In order to specify a group of event data in which the same bioparticle P is detected, a group of events including the target event is specified from accumulated event data or a 3D map constructed from these event data. can also be performed (step S125).
次に、データ処理部17は、同一の生体粒子Pの重複カウントを防止するために、ステップS125で特定されたイベント群に含まれるイベントデータを、ステップS121における対象イベントの候補から除外する(ステップS126)。
Next, the data processing unit 17 excludes the event data included in the event group identified in step S125 from the target event candidates in step S121 in order to prevent duplicate counting of the same bioparticle P (step S126).
その後、データ処理部17は、観察対象のウェル21に対する生体粒子Pの数をカウントアップし(ステップS127)、ステップS128へ進む。その際、データ処理部17は、ステップS125において一纏まりのイベント群、すなわち、1つの生体粒子Pに対応するイベント群として特定した分布範囲の中心や重心の位置を、観察対象のウェル21における生体粒子Pの位置として特定してもよい。
After that, the data processing unit 17 counts up the number of bioparticles P in the observation target well 21 (step S127), and proceeds to step S128. At that time, the data processing unit 17 determines the position of the center of the distribution range or the center of gravity specified as the group of events, that is, the event group corresponding to one biological particle P in step S125. It may be specified as the position of the particle P.
なお、ステップS127では、観察対象のウェル21に対する生体粒子Pの数の計数に代えて、観察対象のウェル21における生体粒子Pの位置が計測されてもよい。その際、ウェル21内に2以上の生体粒子Pが存在する場合には、それぞれの生体粒子Pの位置が計測されてもよい。
Note that in step S127, instead of counting the number of bioparticles P in the well 21 to be observed, the positions of the bioparticles P in the well 21 to be observed may be measured. At that time, when two or more bioparticles P are present in the well 21, the position of each bioparticle P may be measured.
ステップS128では、データ処理部17は、3Dマップに含まれる全てのイベントデータ(ただし、除外されたイベントデータを除く)をステップS121において対象イベントとして選択済みであるか否かを判定し、選択済みである場合(ステップS128のYES)、本動作を終了する。それにより、図12に示す粒子数計測動作が次のステップS106へ進む。一方、未選択のイベントデータが存在する場合(ステップS128のNO)、データ処理部17は、ステップS121へ戻り、未選択のイベントデータを対象イベントとして選択し、以降の動作を実行する。
In step S128, the data processing unit 17 determines whether or not all event data included in the 3D map (excluding the excluded event data) have been selected as target events in step S121. If so (YES in step S128), this operation is terminated. Thereby, the particle number measurement operation shown in FIG. 12 proceeds to the next step S106. On the other hand, if unselected event data exists (NO in step S128), the data processing unit 17 returns to step S121, selects the unselected event data as the target event, and executes the subsequent operations.
なお、図13のステップS123~S124では、対象イベントの近傍に位置するイベントデータの数が所定の閾値以下である場合(ステップS123のNO)、言い換えれば、対象イベントが孤立したイベントである場合、この対象イベントがランダムに発生したノイズであると判定する場合(ステップS124)を例示したが、対象イベントが生体粒子Pに基づくものかノイズであるか判定は、上記手法に限定されず、種々変形されてよい。例えば、ある程度のまとまりをもって分布するイベントデータの分布形状が所定の形状(例えば、砂時計のような形状)を有している場合、そのイベント群に属するイベントデータは生体粒子Pを検出したイベントデータであると判定し、それ以外のイベントデータをノイズであると判定してもよい。
Note that in steps S123 and S124 of FIG. 13, if the number of event data located near the target event is equal to or less than a predetermined threshold (NO in step S123), in other words, if the target event is an isolated event, Although the case where the target event is determined to be randomly generated noise (step S124) has been exemplified, the determination as to whether the target event is based on the biological particles P or the noise is not limited to the above method, and various modifications are possible. may be For example, if the distribution shape of the event data distributed in a certain amount of time has a predetermined shape (for example, an hourglass shape), the event data belonging to the event group is the event data in which the bioparticle P is detected. It may be determined that there is event data, and other event data may be determined to be noise.
また、ウェル21ごとに実行される粒子数計測処理は、各ウェル21が垂直走査される度に実行されてもよいし、全てのウェル21に対する垂直走査が完了した後に、全ウェル21に対してまとめて実行されてもよい。
In addition, the particle number counting process performed for each well 21 may be performed each time each well 21 is vertically scanned, or after the vertical scanning for all wells 21 is completed, for all wells 21 They may be executed collectively.
3.9 粒子数計測処理の具体例
図14~図16は、本実施形態に係る粒子数計測処理により計測された粒子数を示す図であり、図14は、ウェル21に生体粒子Pが分取されていない場合を示し、図15は、ウェル21に1つの生体粒子Pが分取されていた場合を示し、図16は、ウェル21に2つの生体粒子Pが分取されていた場合を示している。また、図14~図16の(a)は、EVS131から出力された全てのイベントデータを示す3Dマップであり、図14~図16の(b)は、(a)に示すイベントデータの3Dマップから抽出された生体粒子Pを示す3Dマップである。なお、図14~図16において、面内軸X,Yがセンサの画素座標であり、垂直軸Timeがイベントの発生時間となっている。 3.9 Specific Example of Particle Number Measurement Processing FIGS. 14 to 16 are diagrams showing the number of particles measured by the particle number measurement processing according to the present embodiment, and FIG. FIG. 15 shows a case where one bioparticle P has been collected in the well 21, and FIG. 16 shows a case where two bioparticles P have been collected in thewell 21. showing. 14 to 16 (a) are 3D maps showing all the event data output from the EVS 131, and FIGS. 14 to 16 (b) are 3D maps of the event data shown in (a). 2 is a 3D map showing bioparticles P extracted from . In FIGS. 14 to 16, the in-plane axes X and Y are the pixel coordinates of the sensor, and the vertical axis Time is the event occurrence time.
図14~図16は、本実施形態に係る粒子数計測処理により計測された粒子数を示す図であり、図14は、ウェル21に生体粒子Pが分取されていない場合を示し、図15は、ウェル21に1つの生体粒子Pが分取されていた場合を示し、図16は、ウェル21に2つの生体粒子Pが分取されていた場合を示している。また、図14~図16の(a)は、EVS131から出力された全てのイベントデータを示す3Dマップであり、図14~図16の(b)は、(a)に示すイベントデータの3Dマップから抽出された生体粒子Pを示す3Dマップである。なお、図14~図16において、面内軸X,Yがセンサの画素座標であり、垂直軸Timeがイベントの発生時間となっている。 3.9 Specific Example of Particle Number Measurement Processing FIGS. 14 to 16 are diagrams showing the number of particles measured by the particle number measurement processing according to the present embodiment, and FIG. FIG. 15 shows a case where one bioparticle P has been collected in the well 21, and FIG. 16 shows a case where two bioparticles P have been collected in the
生体粒子Pの数が0,1,2の各条件において、図14~図16それぞれの(a)に示すように、ノイズ除去前は多数のイベントが存在しているが、(b)に示すように、近傍イベント数の閾値による判定を適用したノイズ除去後には、生体粒子Pに対応したイベント群だけとなり、粒子数の計測が可能となっている。
Under the conditions where the number of bioparticles P is 0, 1, and 2, as shown in (a) of FIGS. As described above, after the noise is removed by applying the determination based on the threshold of the number of neighboring events, only the event group corresponding to the biological particles P remains, and the number of particles can be measured.
なお、図14~図16では、XY平面内で5画素以内であって時間軸(Z軸)方向で10ms以内の範囲に存在する近傍イベントの数が5以下のイベントをノイズと判定する場合を例示しているが、これに限定されず、その他の設定範囲や閾値が用いられてもよく、また、近傍探索以外の方法が用いられてもよい。
In FIGS. 14 to 16, it is assumed that an event having 5 or less neighboring events existing within 5 pixels in the XY plane and within 10 ms in the time axis (Z axis) direction is determined as noise. Although exemplified, it is not limited to this, and other set ranges and thresholds may be used, and methods other than neighborhood search may be used.
3.10 ユーザインタフェースの具体例
図17は、図12のステップS109においてユーザに提示されるUIの一例を示す図である。図17に示すように、UIでは、例えば、ウェルプレート20の各ウェル21に対応するマスが、ウェルプレート20におけるウェル21の配列に従って配列されている。この配列には、各行及び各列を識別するためのインデックス(A~H,1~12)が付与されていてよい。 3.10 Specific Example of User Interface FIG. 17 is a diagram showing an example of the UI presented to the user in step S109 of FIG. As shown in FIG. 17 , on the UI, for example, the squares corresponding to thewells 21 of the well plate 20 are arranged according to the arrangement of the wells 21 of the well plate 20 . This array may be given an index (A to H, 1 to 12) for identifying each row and each column.
図17は、図12のステップS109においてユーザに提示されるUIの一例を示す図である。図17に示すように、UIでは、例えば、ウェルプレート20の各ウェル21に対応するマスが、ウェルプレート20におけるウェル21の配列に従って配列されている。この配列には、各行及び各列を識別するためのインデックス(A~H,1~12)が付与されていてよい。 3.10 Specific Example of User Interface FIG. 17 is a diagram showing an example of the UI presented to the user in step S109 of FIG. As shown in FIG. 17 , on the UI, for example, the squares corresponding to the
各マスには、対応するウェル21に分取された生体粒子Pの数が表示されている。その際、規定数(本例では1つ)を満たないマスや規定数より多いマスについては、色や点滅やボールドなどの視覚的効果を用いて強調表示されてもよい。
Each square displays the number of bioparticles P dispensed in the corresponding well 21 . At that time, squares that are less than the prescribed number (one in this example) or larger than the prescribed number may be highlighted using visual effects such as color, blinking, or bold.
また、各マスには、ウェル21中における生体粒子Pの位置を示す情報が表示されてもよい。例えば、ウェル21中における生体粒子PのXY平面内の位置に対応する位置がマス内のドットなどにより表示されてもよい。若しくは、マウスやキーボードやタッチパネルなどの入力インタフェースを用いてユーザにより選択されたマスに対応するウェル21の2次元マップ(以下、2Dマップともいう)若しくは3Dマップが、画面又はウィンドウの切替えや新規ウィンドウなどによりユーザに表示されてもよい。なお、2Dマップとは、3Dマップにおいて生体粒子Pが存在するXY平面の画像データであってよく、イベントデータより構築された3Dマップから作成された画像データであってよい。
In addition, information indicating the position of the bioparticle P in the well 21 may be displayed in each square. For example, the positions corresponding to the positions of the bioparticles P in the XY plane in the well 21 may be displayed by dots in the grid. Alternatively, a two-dimensional map (hereinafter also referred to as a 2D map) or a 3D map of the well 21 corresponding to the square selected by the user using an input interface such as a mouse, keyboard, or touch panel is displayed when the screen or window is switched or a new window is displayed. and so on may be displayed to the user. The 2D map may be image data of the XY plane in which the biological particles P are present in the 3D map, or may be image data created from a 3D map constructed from event data.
3.11 粒子解析システムの装置形態
本実施形態に係る粒子解析システム100の装置形態としては、図18に示すような、粒子識別機構52(例えば、図2における光照射部101、検出部102及び情報処理部103に相当)と、インデックスソーティング機構53(例えば、図2における分取部104に相当)と、生体粒子Pを分取する際の廃液54を貯留又は廃棄する機構とを備え、生体粒子Pが含まれる試料51を解析して分取するソータ型のフローサイトメータ(図19のフローサイトメータ100Aに相当)に粒子数計測部105が組み込まれた組込型であってもよいし、図19に示すような、ソータ型のフローサイトメータ100Aとは別に粒子数計測部105を備える粒子数計測装置100Bが設けられた別体型であってもよい。 3.11 Apparatus form of particle analysis system As an apparatus form of theparticle analysis system 100 according to the present embodiment, a particle identification mechanism 52 (for example, the light irradiation unit 101, the detection unit 102 and information processing unit 103), an index sorting mechanism 53 (e.g., corresponding to the sorting unit 104 in FIG. A sorter-type flow cytometer (equivalent to the flow cytometer 100A in FIG. 19) that analyzes and fractionates a sample 51 containing particles P may be of a built-in type in which the particle number measuring unit 105 is incorporated. , as shown in FIG. 19, a separate type in which a particle number measuring device 100B having a particle number measuring unit 105 is provided separately from the sorter type flow cytometer 100A.
本実施形態に係る粒子解析システム100の装置形態としては、図18に示すような、粒子識別機構52(例えば、図2における光照射部101、検出部102及び情報処理部103に相当)と、インデックスソーティング機構53(例えば、図2における分取部104に相当)と、生体粒子Pを分取する際の廃液54を貯留又は廃棄する機構とを備え、生体粒子Pが含まれる試料51を解析して分取するソータ型のフローサイトメータ(図19のフローサイトメータ100Aに相当)に粒子数計測部105が組み込まれた組込型であってもよいし、図19に示すような、ソータ型のフローサイトメータ100Aとは別に粒子数計測部105を備える粒子数計測装置100Bが設けられた別体型であってもよい。 3.11 Apparatus form of particle analysis system As an apparatus form of the
図18に示す組込型の場合、インデックスソーティングの為にウェルプレート20を移動させる面内走査機構55がそのまま粒子数計測部105の面内走査機構15として使用されてもよい。一方、図19に示す別体型の場合、インデックスソーティングされたウェルプレート20をフローサイトメータ100Aから取り出し、粒子数計測装置100Bに載せ替えることで、各ウェル21に分取された生体粒子Pの計数が実行される。
In the case of the built-in type shown in FIG. 18 , the in-plane scanning mechanism 55 that moves the well plate 20 for index sorting may be used as it is as the in-plane scanning mechanism 15 of the particle number measuring unit 105 . On the other hand, in the case of the separate type shown in FIG. 19, the index-sorted well plate 20 is taken out from the flow cytometer 100A and placed on the particle number measuring device 100B to count the bioparticles P collected in each well 21. is executed.
3.12 作用・効果
以上のように、本実施形態によれば、ウェル21中に満たされた液体中を浮遊する生体粒子Pの個数を非接触で計測するにはカメラによる撮影が有効であるが、液体の深さがカメラの焦点深度に対して大きい場合、粒子数を漏れなく計測するにはカメラの焦点面を容器の深さ方向に走査する必要がある。その際に、本実施形態のように、フレーム型のイメージセンサに代えて、イベント型のイメージセンサであるEVS131を用いることにより、深さ方向の走査を連続的かつ高速に行えるようになる。それにより、分取された粒子数をより短時間で正確に計測できるため、生体粒子Pへのダメージを最小限に抑制することが可能となる。また、深さ方向の走査機構の簡略化による装置の小型化及びコストダウンも可能となる。 3.12 Functions and Effects As described above, according to the present embodiment, photographing by a camera is effective for non-contact measurement of the number of biological particles P floating in the liquid filled in thewell 21. However, if the depth of the liquid is large relative to the focal depth of the camera, it is necessary to scan the focal plane of the camera in the depth direction of the container in order to count the number of particles without omission. In this case, by using the EVS 131, which is an event-type image sensor, instead of the frame-type image sensor as in this embodiment, scanning in the depth direction can be performed continuously and at high speed. As a result, the number of fractionated particles can be accurately measured in a shorter time, so damage to the biological particles P can be minimized. In addition, the simplification of the scanning mechanism in the depth direction makes it possible to reduce the size and cost of the device.
以上のように、本実施形態によれば、ウェル21中に満たされた液体中を浮遊する生体粒子Pの個数を非接触で計測するにはカメラによる撮影が有効であるが、液体の深さがカメラの焦点深度に対して大きい場合、粒子数を漏れなく計測するにはカメラの焦点面を容器の深さ方向に走査する必要がある。その際に、本実施形態のように、フレーム型のイメージセンサに代えて、イベント型のイメージセンサであるEVS131を用いることにより、深さ方向の走査を連続的かつ高速に行えるようになる。それにより、分取された粒子数をより短時間で正確に計測できるため、生体粒子Pへのダメージを最小限に抑制することが可能となる。また、深さ方向の走査機構の簡略化による装置の小型化及びコストダウンも可能となる。 3.12 Functions and Effects As described above, according to the present embodiment, photographing by a camera is effective for non-contact measurement of the number of biological particles P floating in the liquid filled in the
3.13 変形例
次に、上述した実施形態の変形例について、いくつか例を挙げて説明する。 3.13 Modifications Next, several modifications of the above-described embodiment will be described.
次に、上述した実施形態の変形例について、いくつか例を挙げて説明する。 3.13 Modifications Next, several modifications of the above-described embodiment will be described.
3.13.1 第1変形例
図20は、本実施形態の第1変形例に係る粒子数計測部の概略構成例を示すブロック図である。図20に示すように、本変形例に係る粒子数計測部105Aは、第1の実施形態において図5を用いて説明した粒子数計測部105と同様の構成において、撮像用光源部16が、上側からウェル21を照明するように構成されている。また、この照明方向の変更に伴い、カメラユニット10におけるビームスプリッタ12が省略されている。 3.13.1 First Modification FIG. 20 is a block diagram showing a schematic configuration example of a particle number measuring unit according to a first modification of the present embodiment. As shown in FIG. 20, the particlenumber measurement unit 105A according to this modification has the same configuration as the particle number measurement unit 105 described in the first embodiment with reference to FIG. It is configured to illuminate the well 21 from above. Also, the beam splitter 12 in the camera unit 10 is omitted in accordance with this change in illumination direction.
図20は、本実施形態の第1変形例に係る粒子数計測部の概略構成例を示すブロック図である。図20に示すように、本変形例に係る粒子数計測部105Aは、第1の実施形態において図5を用いて説明した粒子数計測部105と同様の構成において、撮像用光源部16が、上側からウェル21を照明するように構成されている。また、この照明方向の変更に伴い、カメラユニット10におけるビームスプリッタ12が省略されている。 3.13.1 First Modification FIG. 20 is a block diagram showing a schematic configuration example of a particle number measuring unit according to a first modification of the present embodiment. As shown in FIG. 20, the particle
このように、ウェル21を照明する側(本例では上側)と反対側(本例では底面側)からウェル21を撮像することで、生体粒子Pを励起するための励起光と、生体粒子Pから放射した蛍光とを分離するためのビームスプリッタ12を省略することが可能となるため、カメラユニット10の構成をより簡略化することが可能となる。
In this way, by imaging the well 21 from the side (upper side in this example) that illuminates the well 21 and the opposite side (bottom side in this example), the excitation light for exciting the bioparticles P and the excitation light for the bioparticles P Since it is possible to omit the beam splitter 12 for separating the fluorescence emitted from the camera unit 10, the configuration of the camera unit 10 can be further simplified.
その他の構成、動作及び効果は、上述した実施形態と同様であってよいため、ここでは詳細な説明を省略する。
Other configurations, operations, and effects may be the same as in the above-described embodiment, so detailed description is omitted here.
3.13.2 第2変形例
図21は、本実施形態の第2変形例に係る粒子数計測部の概略構成例を示すブロック図である。図21に示すように、本変形例に係る粒子数計測部105Bは、第1の実施形態に係る粒子数計測部105と同様の構成において、垂直走査機構14がウェルプレート20を深さ方向に走査するように構成されている。 3.13.2 Second Modification FIG. 21 is a block diagram showing a schematic configuration example of a particle number measuring unit according to a second modification of the present embodiment. As shown in FIG. 21, the particlenumber measuring unit 105B according to this modification has the same configuration as the particle number measuring unit 105 according to the first embodiment, but the vertical scanning mechanism 14 scans the well plate 20 in the depth direction. configured to scan.
図21は、本実施形態の第2変形例に係る粒子数計測部の概略構成例を示すブロック図である。図21に示すように、本変形例に係る粒子数計測部105Bは、第1の実施形態に係る粒子数計測部105と同様の構成において、垂直走査機構14がウェルプレート20を深さ方向に走査するように構成されている。 3.13.2 Second Modification FIG. 21 is a block diagram showing a schematic configuration example of a particle number measuring unit according to a second modification of the present embodiment. As shown in FIG. 21, the particle
このように、対物レンズ11の焦点位置を深さ方向に走査する構成は、対物レンズ11とウェルプレート20との相対位置を深さ方向に変化させる構成であれば種々変形されてよい。本変形例のように、ウェルプレート20を垂直走査することで、カメラユニット10側を垂直走査する場合と比較して、より簡便な走査機構を使用することが可能となるため、装置の更なる小型化及びコストダウンも可能となる。
Thus, the configuration for scanning the focal position of the objective lens 11 in the depth direction may be modified in various ways as long as the relative position between the objective lens 11 and the well plate 20 is changed in the depth direction. By vertically scanning the well plate 20 as in this modification, it is possible to use a simpler scanning mechanism than when vertically scanning the camera unit 10 side. Miniaturization and cost reduction are also possible.
その他の構成、動作及び効果は、上述した実施形態又はその変形例と同様であってよいため、ここでは詳細な説明を省略する。
Other configurations, operations, and effects may be the same as those of the above-described embodiment or its modification, so detailed descriptions are omitted here.
3.13.3 他の変形例
また、上述した実施形態及びその変形例では、生体粒子Pから放射された蛍光をEVS131で観察することで、各ウェル21に分取された生体粒子Pの数及び位置を計測する場合を例示したが、このような構成に限定されるものではない。例えば、撮像用光源部16から出力された光の反射光や散乱光をEVS131で検察することでも、各ウェル21に分取された生体粒子Pの数及び位置を計測するは可能である。その場合、ウェル21を照明する側と同じ側からウェル21を撮像する構成では、分光ビームスプリッタの代わりにハーフミラー等がビームスプリッタ12として使用されてよい。 3.13.3 Other Modifications In addition, in the above-described embodiment and its modifications, the fluorescence emitted from the bioparticles P is observed by theEVS 131, and the number of the bioparticles P dispensed into each well 21 is calculated. Although the case of measuring the position and position has been exemplified, the configuration is not limited to such a configuration. For example, it is possible to measure the number and position of the bioparticles P collected in each well 21 by detecting the reflected light and scattered light of the light output from the imaging light source unit 16 with the EVS 131 . In that case, in a configuration in which the well 21 is imaged from the same side as the well 21 is illuminated, a half mirror or the like may be used as the beam splitter 12 instead of the spectral beam splitter.
また、上述した実施形態及びその変形例では、生体粒子Pから放射された蛍光をEVS131で観察することで、各ウェル21に分取された生体粒子Pの数及び位置を計測する場合を例示したが、このような構成に限定されるものではない。例えば、撮像用光源部16から出力された光の反射光や散乱光をEVS131で検察することでも、各ウェル21に分取された生体粒子Pの数及び位置を計測するは可能である。その場合、ウェル21を照明する側と同じ側からウェル21を撮像する構成では、分光ビームスプリッタの代わりにハーフミラー等がビームスプリッタ12として使用されてよい。 3.13.3 Other Modifications In addition, in the above-described embodiment and its modifications, the fluorescence emitted from the bioparticles P is observed by the
4.第2の実施形態
次に、本開示の第2の実施形態に係る粒子解析システム、粒子解析方法及びフローサイトメータシステムについて、図面を参照して詳細に説明する。なお、以下の説明において、第1の実施形態又はその変形例と同様の構成及び動作については、それらを引用することで、重複する説明を省略する。 4. Second Embodiment Next, a particle analysis system, a particle analysis method, and a flow cytometer system according to a second embodiment of the present disclosure will be described in detail with reference to the drawings. It should be noted that in the following description, configurations and operations that are the same as those of the first embodiment or its modification will be referred to, and redundant description will be omitted.
次に、本開示の第2の実施形態に係る粒子解析システム、粒子解析方法及びフローサイトメータシステムについて、図面を参照して詳細に説明する。なお、以下の説明において、第1の実施形態又はその変形例と同様の構成及び動作については、それらを引用することで、重複する説明を省略する。 4. Second Embodiment Next, a particle analysis system, a particle analysis method, and a flow cytometer system according to a second embodiment of the present disclosure will be described in detail with reference to the drawings. It should be noted that in the following description, configurations and operations that are the same as those of the first embodiment or its modification will be referred to, and redundant description will be omitted.
上述した第1の実施形態及びその変形例では、ウェル21内における生体粒子Pの位置情報を、EVS131で取得されたイベントデータから構築された2Dマップ又は3Dマップを用いてユーザに提示していた。これに対し、第2の実施形態では、撮像部13がEVS131とは別にフレーム型のイメージセンサを備え、このイメージセンサで取得された画像データを用いてウェル21内における生体粒子Pの位置情報をユーザに提示する場合を例示する。
In the above-described first embodiment and its modification, the position information of the bioparticles P in the well 21 is presented to the user using a 2D map or a 3D map constructed from the event data acquired by the EVS 131. . In contrast, in the second embodiment, the imaging unit 13 includes a frame-type image sensor in addition to the EVS 131, and position information of the bioparticles P in the well 21 is obtained using image data acquired by this image sensor. A case of presentation to the user will be exemplified.
4.1 粒子数計測部の概略構成例
図22は、本実施形態に係る粒子数計測部の概略構成例を示すブロック図である。図22に示すように、本実施形態に係る粒子数計測部205は、第1の実施形態において図5を用いて説明した粒子数計測部105と同様の構成において、カメラユニット10内の撮像部13が撮像部213に置き換えられた構成を備える。 4.1 Schematic Configuration Example of Particle Number Measuring Section FIG. 22 is a block diagram showing a schematic configuration example of the particle number measuring section according to the present embodiment. As shown in FIG. 22, the particlenumber measurement unit 205 according to the present embodiment has the same configuration as the particle number measurement unit 105 described in the first embodiment with reference to FIG. 13 is replaced with an imaging unit 213 .
図22は、本実施形態に係る粒子数計測部の概略構成例を示すブロック図である。図22に示すように、本実施形態に係る粒子数計測部205は、第1の実施形態において図5を用いて説明した粒子数計測部105と同様の構成において、カメラユニット10内の撮像部13が撮像部213に置き換えられた構成を備える。 4.1 Schematic Configuration Example of Particle Number Measuring Section FIG. 22 is a block diagram showing a schematic configuration example of the particle number measuring section according to the present embodiment. As shown in FIG. 22, the particle
撮像部213は、EVS131と、フレーム型のイメージセンサ(以下、CISともいう)232と、ハーフミラー233とを備える。
The imaging unit 213 includes an EVS 131 , a frame-type image sensor (hereinafter also referred to as CIS) 232 and a half mirror 233 .
ハーフミラー233は、例えば、対物レンズ11の光軸に対して所定角度(例えば、45度)傾いている。EVS131は、例えば、ハーフミラー233を透過した光を受光する位置に配置され、CIS232は、例えば、ハーフミラー233で反射した光を受光する位置に配置される。
The half mirror 233 is, for example, inclined at a predetermined angle (eg, 45 degrees) with respect to the optical axis of the objective lens 11. The EVS 131 is arranged, for example, at a position that receives light transmitted through the half mirror 233 , and the CIS 232 is arranged, for example, at a position that receives light reflected by the half mirror 233 .
その他の構成は、第1の実施形態又はその変形例と同様であってよい。
Other configurations may be the same as in the first embodiment or its modification.
4.2 粒子数計測動作のフロー例
次に、本実施形態に係る粒子数計測部205が実行する粒子数計測動作のフロー例について説明する。図23は、本実施形態に係る粒子数計測動作フローの一例を示すフローチャートである。図23に示す動作は、図12と同様に、制御部19により統括されてよいため、以下の説明では、制御部19の動作に着目する。 4.2 Flow Example of Particle Number Measuring Operation Next, a flow example of the particle number measuring operation executed by the particlenumber measuring unit 205 according to the present embodiment will be described. FIG. 23 is a flow chart showing an example of the particle number measurement operation flow according to this embodiment. Since the operation shown in FIG. 23 may be controlled by the control unit 19 in the same manner as in FIG. 12, attention will be focused on the operation of the control unit 19 in the following description.
次に、本実施形態に係る粒子数計測部205が実行する粒子数計測動作のフロー例について説明する。図23は、本実施形態に係る粒子数計測動作フローの一例を示すフローチャートである。図23に示す動作は、図12と同様に、制御部19により統括されてよいため、以下の説明では、制御部19の動作に着目する。 4.2 Flow Example of Particle Number Measuring Operation Next, a flow example of the particle number measuring operation executed by the particle
図23に示すように、本実施形態に係る粒子数計測動作では、図12におけるステップS101~S105と同様の動作により、観察対象のウェル21における生体粒子Pの数及びその位置が特定される。
As shown in FIG. 23, in the particle counting operation according to the present embodiment, the number and positions of bioparticles P in the well 21 to be observed are specified by operations similar to steps S101 to S105 in FIG.
次に、制御部19は、ステップS105の粒子数計測処理で特定されたウェル21内での生体粒子Pの位置に基づいて垂直走査機構14を制御することで、対物レンズ11の焦点位置を生体粒子Pが存在する深さ方向の位置に移動させる(ステップS201)。
Next, the control unit 19 controls the vertical scanning mechanism 14 based on the positions of the biological particles P within the well 21 specified in the particle number counting process in step S105, thereby adjusting the focal position of the objective lens 11 to the biological particles. It is moved to a position in the depth direction where the particle P exists (step S201).
次に、制御部19は、観察対象であるウェル21内の生体粒子Pに焦点が合っている状態でCIS232を駆動することで、ウェル21内における生体粒子Pが存在するXY平面の画像データを取得する(ステップS202)。取得された画像データは、データ処理部17へ送信される。
Next, the control unit 19 drives the CIS 232 in a state in which the bioparticles P in the well 21 to be observed are in focus, thereby obtaining image data of the XY plane in which the bioparticles P are present in the well 21. Acquire (step S202). The acquired image data is transmitted to the data processing unit 17 .
その後、制御部19は、図12におけるステップS106と同様に、ウェルプレート20における生体粒子Pの分取先とされた全てのウェル21に対して粒子数計測処理を実行済みであるか否かを判定し(ステップS106)、実行済みでない場合(ステップS106のNO)、ステップS102へ戻り、実行済みである場合(ステップS106のYES)、制御部19は、撮像用光源部16の駆動を停止する(ステップS107)。
Thereafter, similarly to step S106 in FIG. 12, the control unit 19 determines whether or not the particle number counting process has been executed for all the wells 21 from which the bioparticles P are sorted in the well plate 20. If not executed (NO in step S106), the control unit 19 returns to step S102, and if executed (YES in step S106), the control unit 19 stops driving the imaging light source unit 16. (Step S107).
つづいて、制御部19は、ステップS105で計測されたウェル21ごとの生体粒子Pの数及びその位置に基づいて、ウェル21ごとの生体粒子Pの数及び/又はその位置をユーザに提示するためのUIを生成する(ステップS208)。その際、本実施形態では、ウェル21ごとの生体粒子Pの位置を示す情報として、ステップS202で取得された画像データが使用されてよい。例えば、表示部18に表示されるUI(図17参照)の各マスにステップS202で取得された各ウェル21の画像データ(又はそのサムネイル画像)を表示することで、ウェル21中における生体粒子Pの位置を示す情報がユーザに提示されてもよい。若しくは、マウスやキーボードやタッチパネルなどの入力インタフェースを用いてユーザにより選択されたマスに対応するウェル21の画像データが、画面又はウィンドウの切替えや新規ウィンドウなどによりユーザに表示されてもよい。
Subsequently, the control unit 19 presents the number and/or positions of the bioparticles P per well 21 to the user based on the number and positions of the bioparticles P per well 21 measured in step S105. UI is generated (step S208). At that time, in the present embodiment, the image data acquired in step S202 may be used as the information indicating the position of the bioparticle P for each well 21 . For example, by displaying the image data (or thumbnail image thereof) of each well 21 acquired in step S202 in each square of the UI (see FIG. 17) displayed on the display unit 18, the bioparticles P in the well 21 may be presented to the user indicating the location of the . Alternatively, the image data of the well 21 corresponding to the square selected by the user using an input interface such as a mouse, keyboard, or touch panel may be displayed to the user by switching the screen or window, or by switching a new window.
その後、制御部19は、ステップS208で生成されたUIを表示部18に表示させ(ステップS109)、本動作を終了する。
After that, the control unit 19 causes the display unit 18 to display the UI generated in step S208 (step S109), and ends this operation.
4.3 作用・効果
以上のように、本実施形態では、ウェル21ごとの生体粒子Pの位置を示す情報として、フレーム型のイメージセンサ(CIS232)で取得された画像データがユーザに表示される。それにより、生体粒子Pのより鮮明且つ詳細な位置情報をユーザに提供することが可能となる。 4.3 Functions and Effects As described above, in the present embodiment, image data acquired by the frame-type image sensor (CIS232) is displayed to the user as information indicating the position of the bioparticle P for each well 21. . This makes it possible to provide the user with clearer and more detailed positional information of the biological particles P. FIG.
以上のように、本実施形態では、ウェル21ごとの生体粒子Pの位置を示す情報として、フレーム型のイメージセンサ(CIS232)で取得された画像データがユーザに表示される。それにより、生体粒子Pのより鮮明且つ詳細な位置情報をユーザに提供することが可能となる。 4.3 Functions and Effects As described above, in the present embodiment, image data acquired by the frame-type image sensor (CIS232) is displayed to the user as information indicating the position of the bioparticle P for each well 21. . This makes it possible to provide the user with clearer and more detailed positional information of the biological particles P. FIG.
その他の構成、動作及び効果は、上述した実施形態又はその変形例と同様であってよいため、ここでは詳細な説明を省略する。
Other configurations, operations, and effects may be the same as those of the above-described embodiment or its modification, so detailed descriptions are omitted here.
5.ハードウエア構成
上述してきた実施形態及びその変形例に係る信号処理部123、情報処理部103、データ処理部17は、例えば図24に示すような構成のコンピュータ1000によって実現され得る。図24は、信号処理部123、情報処理部103、データ処理部17の機能を実現するコンピュータ1000の一例を示すハードウエア構成図である。コンピュータ1000は、CPU1100、RAM1200、ROM(Read Only Memory)1300、HDD(Hard Disk Drive)1400、通信インタフェース1500、及び入出力インタフェース1600を有する。コンピュータ1000の各部は、バス1050によって接続される。 5. Hardware Configuration Thesignal processing section 123, the information processing section 103, and the data processing section 17 according to the above-described embodiments and modifications thereof can be implemented by a computer 1000 configured as shown in FIG. 24, for example. FIG. 24 is a hardware configuration diagram showing an example of a computer 1000 that implements the functions of the signal processing section 123, the information processing section 103, and the data processing section 17. As shown in FIG. The computer 1000 has a CPU 1100 , a RAM 1200 , a ROM (Read Only Memory) 1300 , a HDD (Hard Disk Drive) 1400 , a communication interface 1500 and an input/output interface 1600 . Each part of computer 1000 is connected by bus 1050 .
上述してきた実施形態及びその変形例に係る信号処理部123、情報処理部103、データ処理部17は、例えば図24に示すような構成のコンピュータ1000によって実現され得る。図24は、信号処理部123、情報処理部103、データ処理部17の機能を実現するコンピュータ1000の一例を示すハードウエア構成図である。コンピュータ1000は、CPU1100、RAM1200、ROM(Read Only Memory)1300、HDD(Hard Disk Drive)1400、通信インタフェース1500、及び入出力インタフェース1600を有する。コンピュータ1000の各部は、バス1050によって接続される。 5. Hardware Configuration The
CPU1100は、ROM1300又はHDD1400に格納されたプログラムに基づいて動作し、各部の制御を行う。例えば、CPU1100は、ROM1300又はHDD1400に格納されたプログラムをRAM1200に展開し、各種プログラムに対応した処理を実行する。
The CPU 1100 operates based on programs stored in the ROM 1300 or HDD 1400 and controls each section. For example, the CPU 1100 loads programs stored in the ROM 1300 or HDD 1400 into the RAM 1200 and executes processes corresponding to various programs.
ROM1300は、コンピュータ1000の起動時にCPU1100によって実行されるBIOS(Basic Input Output System)等のブートプログラムや、コンピュータ1000のハードウエアに依存するプログラム等を格納する。
The ROM 1300 stores a boot program such as BIOS (Basic Input Output System) executed by the CPU 1100 when the computer 1000 is started, and programs dependent on the hardware of the computer 1000.
HDD1400は、CPU1100によって実行されるプログラム、及び、かかるプログラムによって使用されるデータ等を非一時的に記録する、コンピュータが読み取り可能な記録媒体である。具体的には、HDD1400は、プログラムデータ1450の一例である本開示に係る各動作を実現するためのプログラムを記録する記録媒体である。
The HDD 1400 is a computer-readable recording medium that non-temporarily records programs executed by the CPU 1100 and data used by such programs. Specifically, HDD 1400 is a recording medium that records a program for realizing each operation according to the present disclosure, which is an example of program data 1450 .
通信インタフェース1500は、コンピュータ1000が外部ネットワーク1550(例えばインターネット)と接続するためのインタフェースである。例えば、CPU1100は、通信インタフェース1500を介して、他の機器からデータを受信したり、CPU1100が生成したデータを他の機器へ送信したりする。
A communication interface 1500 is an interface for connecting the computer 1000 to an external network 1550 (for example, the Internet). For example, the CPU 1100 receives data from another device via the communication interface 1500, and transmits data generated by the CPU 1100 to another device.
入出力インタフェース1600は、入出力デバイス1650とコンピュータ1000とを接続するためのインタフェースである。例えば、CPU1100は、入出力インタフェース1600を介して、キーボードやマウス等の入力デバイスからデータを受信する。また、CPU1100は、入出力インタフェース1600を介して、ディスプレイやスピーカやプリンタ等の出力デバイスにデータを送信する。また、入出力インタフェース1600は、所定の記録媒体(メディア)に記録されたプログラム等を読み取るメディアインタフェースとして機能してもよい。メディアとは、例えばDVD(Digital Versatile Disc)、PD(Phase change rewritable Disk)等の光学記録媒体、MO(Magneto-Optical disk)等の光磁気記録媒体、テープ媒体、磁気記録媒体、または半導体メモリ等である。
The input/output interface 1600 is an interface for connecting the input/output device 1650 and the computer 1000 . For example, the CPU 1100 receives data from input devices such as a keyboard and mouse via the input/output interface 1600 . Also, the CPU 1100 transmits data to an output device such as a display, a speaker, or a printer via the input/output interface 1600 . Also, the input/output interface 1600 may function as a media interface for reading a program or the like recorded on a predetermined recording medium. Media include, for example, optical recording media such as DVD (Digital Versatile Disc) and PD (Phase change rewritable disk), magneto-optical recording media such as MO (Magneto-Optical disk), tape media, magnetic recording media, semiconductor memories, etc. is.
例えば、コンピュータ1000が上述の実施形態に係る信号処理部123、情報処理部103、データ処理部17として機能する場合、コンピュータ1000のCPU1100は、RAM1200上にロードされたプログラムを実行することにより、信号処理部123、情報処理部103、データ処理部17の機能を実現する。また、HDD1400には、本開示に係るプログラム等が格納される。なお、CPU1100は、プログラムデータ1450をHDD1400から読み取って実行するが、他の例として、外部ネットワーク1550を介して、他の装置からこれらのプログラムを取得してもよい。
For example, when the computer 1000 functions as the signal processing unit 123, the information processing unit 103, and the data processing unit 17 according to the above-described embodiments, the CPU 1100 of the computer 1000 executes the program loaded on the RAM 1200 to process the signal. The functions of the processing unit 123, the information processing unit 103, and the data processing unit 17 are realized. The HDD 1400 also stores programs and the like according to the present disclosure. Although CPU 1100 reads and executes program data 1450 from HDD 1400 , as another example, these programs may be obtained from another device via external network 1550 .
以上、本開示の実施形態について説明したが、本開示の技術的範囲は、上述の実施形態そのままに限定されるものではなく、本開示の要旨を逸脱しない範囲において種々の変更が可能である。また、異なる実施形態及び変形例にわたる構成要素を適宜組み合わせてもよい。
Although the embodiments of the present disclosure have been described above, the technical scope of the present disclosure is not limited to the embodiments described above, and various modifications are possible without departing from the gist of the present disclosure. Moreover, you may combine the component over different embodiment and modifications suitably.
また、本明細書に記載された各実施形態における効果はあくまで例示であって限定されるものでは無く、他の効果があってもよい。
Also, the effects of each embodiment described in this specification are merely examples and are not limited, and other effects may be provided.
なお、本技術は以下のような構成も取ることができる。
(1)
容器内の粒子からの光の輝度変化をイベントとして検出する撮像部と、
前記撮像部の焦点位置を前記容器の深さ方向に走査する第1走査部と、
前記第1走査部の走査による前記撮像部の複数の焦点位置で検出されたイベントに基づいて、前記容器内の状態を計測する処理部と、
を備える粒子解析システム。
(2)
前記第1走査部が前記撮像部の前記焦点位置を前記容器の前記深さ方向に沿って走査する間、前記撮像部の焦点位置を異なる2以上の時点で記録する記憶部をさらに備える、
前記(1)に記載の粒子解析システム。
(3)
前記撮像部は、
前記容器と対向する対物レンズと、
それぞれ前記対物レンズを介して入射した前記容器内の前記粒子から光の輝度変化を前記イベントとして検出する複数の画素を備える第1センサ部と、
を備え、
前記第1走査部は、前記対物レンズの前記焦点位置を前記容器の前記深さ方向に走査する
前記(1)又は(2)に記載の粒子解析システム。
(4)
前記第1走査部は、前記対物レンズと前記容器との相対位置を前記深さ方向に変化させることで、前記焦点位置を前記容器の前記深さ方向に走査する
前記(3)に記載の粒子解析システム。
(5)
前記対物レンズは、1以上のレンズを備え、
前記第1走査部は、前記対物レンズの前記1以上のレンズのうちの少なくとも1つのレンズを前記深さ方向に移動させることで、前記焦点位置を前記容器の前記深さ方向に走査する
前記(3)に記載の粒子解析システム。
(6)
前記容器内の前記粒子に対して光を照射する撮像用光源部をさらに備え、
前記撮像部は、前記撮像用光源部からの前記光の照射により前記粒子から放射した蛍光の輝度変化を前記イベントとして検出する
前記(1)~(5)の何れか1つに記載の粒子解析システム。
(7)
前記容器内の前記粒子に対して光を照射する撮像用光源部をさらに備え、
前記撮像部は、前記撮像用光源部から出力して前記粒子で反射又は散乱した光の輝度変化を前記イベントとして検出する
前記(1)~(5)の何れか1つに記載の粒子解析システム。
(8)
前記撮像部は、前記撮像用光源部からの光を反射し、前記容器内の前記粒子からの光を透過する光学系をさらに備え、
前記光学系で反射された前記撮像用光源部からの光は、前記容器内の前記粒子に照射され、
前記容器内の前記粒子からの光は、前記光学系を透過して前記撮像部に入射する
前記(6)又は(7)に記載の粒子解析システム。
(9)
前記撮像用光源部は、第1の側から前記容器に光を照射し、
前記撮像部は、前記第1の側と反対側の第2の側に進行する前記粒子からの光の輝度変化を前記イベントとして検出する
前記(6)又は(7)に記載の粒子解析システム。
(10)
前記処理部は、空間方向及び/又は時間方向において1のイベントの近傍に位置するイベントの数に基づいて、前記容器内の状態を計測する
前期(1)~(9)の何れか1つに記載の粒子解析システム。
(11)
前記処理部は、前記イベントに基づき、前記容器内の前記粒子の数を前記容器内の状態として計測する
前記(1)~(10)の何れか1つに記載の粒子解析システム。
(12)
前記処理部は、前記イベントに基づき、前記容器内における前記粒子の位置を前記容器内の状態として計測する
前記(1)~(11)の何れか1つに記載の粒子解析システム。
(13)
前記処理部は、計測された前記容器内の状態をユーザに提示するユーザインタフェースを生成する
前記(1)~(12)の何れか1つに記載の粒子解析システム。
(14)
前記処理部は、前記イベントから構築された前記容器内の2次元マップ又は3次元マップを前記ユーザインタフェースとして生成する
前記(13)に記載の粒子解析システム。
(15)
前記撮像部は、前記容器内の前記粒子からの光を撮像して画像データを生成する第2センサ部をさらに備え、
前記処理部は、前記第2センサ部で取得された前記画像データに基づいて前記ユーザインタフェースを生成する
前記(13)又は(14)に記載の粒子解析システム。
(16)
前記第1走査部は、前記イベントに基づいて計測された前記容器内の状態に基づいて前記撮像部の前記焦点位置を前記容器の深さ方向に移動させ、
前記第2センサ部は、前記撮像部の前記焦点位置が前記容器内の状態に基づいて移動させられた状態で前記容器内の前記粒子からの光を撮像して前記画像データを生成する
前記(15)に記載の粒子解析システム。
(17)
行列状に配列する複数の前記容器のうちの1つを前記撮像部の画角内に順次移動させる第2走査部をさらに備え、
前記第1走査部は、前記容器ごとに、前記撮像部の焦点位置を前記容器の前記深さ方向に走査し、
前記処理部は、前記容器ごとに、前記第1走査部の走査による前記撮像部の複数の焦点位置で検出されたイベントに基づいて、前記容器内の状態を計測する
前記(1)~(15)の何れか1つに記載の粒子解析システム。
(18)
前記粒子は、細胞又は非細胞性生体粒子である
前記(1)~(17)の何れか1つに記載の粒子解析システム。
(19)
所定の流路を通過する前記粒子に対して光を照射する検出用光源部と、
前記検出用光源部からの前記光の照射により前記粒子から放射した光を検出する検出部と、
前記検出部による検出結果に基づいて前記粒子を前記容器に分取する分取部と、
をさらに備える前記(1)~(18)の何れか1つに記載の粒子解析システム。
(20)
前記容器が、平面上に自立した液滴である、
前記(1)~(18)の何れか1つに記載の粒子解析システム。
(21)
容器内の粒子からの光の輝度変化をイベントとして検出する撮像部を備える粒子解析システムの粒子解析方法であって、
前記撮像部の焦点位置を前記容器の深さ方向に走査する工程と、
前記焦点位置の走査による前記撮像部の複数の焦点位置で検出されたイベントに基づいて、前記容器内の状態を計測する工程と、
を備える粒子解析方法。
(22)
前記容器が、平面上に自立した液滴である、
前記(21)に記載の粒子解析方法。
(23)
所定の流路を通過する生体粒子に対して光を照射する検出用光源部と、
前記検出用光源部からの前記光の照射により前記生体粒子から放射した光を検出する検出部と、
前記検出部による検出結果に基づいて前記生体粒子を所定の容器に分取する分取部と、
前記容器内の前記生体粒子に対して光を照射する撮像用光源部と、
前記撮像用光源部からの光の照射に応じた前記容器内の前記生体粒子からの光の輝度変化をイベントとして検出する撮像部と、
前記撮像部の焦点位置を前記容器の深さ方向に走査する走査部と、
前記走査部の走査による前記撮像部の複数の焦点位置で検出されたイベントに基づいて、前記容器内の状態を計測する処理部と、
を備えるフローサイトメータシステム。 Note that the present technology can also take the following configuration.
(1)
an imaging unit that detects changes in brightness of light from particles in the container as events;
a first scanning unit that scans the focal position of the imaging unit in the depth direction of the container;
a processing unit that measures the state inside the container based on events detected at a plurality of focal positions of the imaging unit by scanning by the first scanning unit;
A particle analysis system with
(2)
Further comprising a storage unit that records the focal position of the imaging unit at two or more different points in time while the first scanning unit scans the focal position of the imaging unit along the depth direction of the container,
The particle analysis system according to (1) above.
(3)
The imaging unit is
an objective lens facing the container;
a first sensor unit comprising a plurality of pixels each configured to detect, as the event, a change in brightness of light from the particles in the container incident through the objective lens;
with
The particle analysis system according to (1) or (2), wherein the first scanning unit scans the focal position of the objective lens in the depth direction of the container.
(4)
The first scanning unit scans the focal position in the depth direction of the container by changing the relative position between the objective lens and the container in the depth direction. analysis system.
(5)
The objective lens comprises one or more lenses,
The first scanning unit scans the focal position in the depth direction of the container by moving at least one lens among the one or more lenses of the objective lens in the depth direction. The particle analysis system according to 3).
(6)
further comprising an imaging light source unit that irradiates light to the particles in the container;
The particle analysis according to any one of (1) to (5), wherein the imaging unit detects, as the event, a change in luminance of fluorescence emitted from the particles due to irradiation of the light from the imaging light source unit. system.
(7)
further comprising an imaging light source unit that irradiates light to the particles in the container;
The particle analysis system according to any one of (1) to (5), wherein the imaging unit detects, as the event, a change in brightness of light output from the imaging light source unit and reflected or scattered by the particles. .
(8)
The imaging unit further comprises an optical system that reflects light from the imaging light source unit and transmits light from the particles in the container,
The light from the imaging light source unit reflected by the optical system is applied to the particles in the container,
The particle analysis system according to (6) or (7), wherein the light from the particles in the container passes through the optical system and enters the imaging section.
(9)
The imaging light source unit irradiates the container with light from a first side,
The particle analysis system according to (6) or (7), wherein the imaging unit detects, as the event, a change in brightness of light from the particles traveling to a second side opposite to the first side.
(10)
The processing unit measures the state inside the container based on the number of events located in the vicinity of one event in the spatial direction and/or the temporal direction. The particle analysis system described.
(11)
The particle analysis system according to any one of (1) to (10), wherein the processing unit measures the number of particles in the container as the state inside the container based on the event.
(12)
The particle analysis system according to any one of (1) to (11), wherein the processing unit measures the position of the particle within the container as the state within the container based on the event.
(13)
The particle analysis system according to any one of (1) to (12), wherein the processing unit generates a user interface that presents the measured state inside the container to the user.
(14)
The particle analysis system according to (13), wherein the processing unit generates, as the user interface, a two-dimensional map or a three-dimensional map of the interior of the container constructed from the event.
(15)
The imaging unit further includes a second sensor unit that captures light from the particles in the container to generate image data,
The particle analysis system according to (13) or (14), wherein the processing unit generates the user interface based on the image data acquired by the second sensor unit.
(16)
The first scanning unit moves the focal position of the imaging unit in the depth direction of the container based on the state inside the container measured based on the event,
The second sensor unit generates the image data by capturing the light from the particles within the container while the focal position of the imaging unit is moved based on the state within the container. The particle analysis system according to 15).
(17)
further comprising a second scanning unit that sequentially moves one of the plurality of containers arranged in a matrix into an angle of view of the imaging unit;
The first scanning unit scans the focal position of the imaging unit in the depth direction of the container for each container,
The processing unit measures the state inside the container based on events detected at a plurality of focal positions of the imaging unit by scanning by the first scanning unit for each container. ), the particle analysis system according to any one of .
(18)
The particle analysis system according to any one of (1) to (17) above, wherein the particles are cells or non-cellular biological particles.
(19)
a light source unit for detection that irradiates light onto the particles passing through a predetermined flow path;
a detection unit that detects the light emitted from the particles by the irradiation of the light from the detection light source unit;
a fractionation unit that fractionates the particles into the container based on the detection result of the detection unit;
The particle analysis system according to any one of (1) to (18), further comprising:
(20)
The container is a droplet that stands on its own on a plane,
The particle analysis system according to any one of (1) to (18) above.
(21)
A particle analysis method for a particle analysis system comprising an imaging unit that detects changes in brightness of light from particles in a container as events,
a step of scanning the focal position of the imaging unit in the depth direction of the container;
a step of measuring the state inside the container based on events detected at a plurality of focal positions of the imaging unit by scanning the focal position;
A particle analysis method comprising:
(22)
The container is a droplet that stands on its own on a plane,
The particle analysis method according to (21) above.
(23)
a light source unit for detection that irradiates light onto biological particles passing through a predetermined flow path;
a detection unit that detects the light emitted from the biological particles by the irradiation of the light from the detection light source unit;
a collection unit that collects the bioparticles into a predetermined container based on the detection result of the detection unit;
an imaging light source unit for irradiating the biological particles in the container with light;
an imaging unit that detects, as an event, a change in brightness of light from the biological particles in the container in response to irradiation of light from the imaging light source unit;
a scanning unit that scans the focal position of the imaging unit in the depth direction of the container;
a processing unit that measures the state inside the container based on events detected at a plurality of focal positions of the imaging unit by scanning of the scanning unit;
A flow cytometer system comprising:
(1)
容器内の粒子からの光の輝度変化をイベントとして検出する撮像部と、
前記撮像部の焦点位置を前記容器の深さ方向に走査する第1走査部と、
前記第1走査部の走査による前記撮像部の複数の焦点位置で検出されたイベントに基づいて、前記容器内の状態を計測する処理部と、
を備える粒子解析システム。
(2)
前記第1走査部が前記撮像部の前記焦点位置を前記容器の前記深さ方向に沿って走査する間、前記撮像部の焦点位置を異なる2以上の時点で記録する記憶部をさらに備える、
前記(1)に記載の粒子解析システム。
(3)
前記撮像部は、
前記容器と対向する対物レンズと、
それぞれ前記対物レンズを介して入射した前記容器内の前記粒子から光の輝度変化を前記イベントとして検出する複数の画素を備える第1センサ部と、
を備え、
前記第1走査部は、前記対物レンズの前記焦点位置を前記容器の前記深さ方向に走査する
前記(1)又は(2)に記載の粒子解析システム。
(4)
前記第1走査部は、前記対物レンズと前記容器との相対位置を前記深さ方向に変化させることで、前記焦点位置を前記容器の前記深さ方向に走査する
前記(3)に記載の粒子解析システム。
(5)
前記対物レンズは、1以上のレンズを備え、
前記第1走査部は、前記対物レンズの前記1以上のレンズのうちの少なくとも1つのレンズを前記深さ方向に移動させることで、前記焦点位置を前記容器の前記深さ方向に走査する
前記(3)に記載の粒子解析システム。
(6)
前記容器内の前記粒子に対して光を照射する撮像用光源部をさらに備え、
前記撮像部は、前記撮像用光源部からの前記光の照射により前記粒子から放射した蛍光の輝度変化を前記イベントとして検出する
前記(1)~(5)の何れか1つに記載の粒子解析システム。
(7)
前記容器内の前記粒子に対して光を照射する撮像用光源部をさらに備え、
前記撮像部は、前記撮像用光源部から出力して前記粒子で反射又は散乱した光の輝度変化を前記イベントとして検出する
前記(1)~(5)の何れか1つに記載の粒子解析システム。
(8)
前記撮像部は、前記撮像用光源部からの光を反射し、前記容器内の前記粒子からの光を透過する光学系をさらに備え、
前記光学系で反射された前記撮像用光源部からの光は、前記容器内の前記粒子に照射され、
前記容器内の前記粒子からの光は、前記光学系を透過して前記撮像部に入射する
前記(6)又は(7)に記載の粒子解析システム。
(9)
前記撮像用光源部は、第1の側から前記容器に光を照射し、
前記撮像部は、前記第1の側と反対側の第2の側に進行する前記粒子からの光の輝度変化を前記イベントとして検出する
前記(6)又は(7)に記載の粒子解析システム。
(10)
前記処理部は、空間方向及び/又は時間方向において1のイベントの近傍に位置するイベントの数に基づいて、前記容器内の状態を計測する
前期(1)~(9)の何れか1つに記載の粒子解析システム。
(11)
前記処理部は、前記イベントに基づき、前記容器内の前記粒子の数を前記容器内の状態として計測する
前記(1)~(10)の何れか1つに記載の粒子解析システム。
(12)
前記処理部は、前記イベントに基づき、前記容器内における前記粒子の位置を前記容器内の状態として計測する
前記(1)~(11)の何れか1つに記載の粒子解析システム。
(13)
前記処理部は、計測された前記容器内の状態をユーザに提示するユーザインタフェースを生成する
前記(1)~(12)の何れか1つに記載の粒子解析システム。
(14)
前記処理部は、前記イベントから構築された前記容器内の2次元マップ又は3次元マップを前記ユーザインタフェースとして生成する
前記(13)に記載の粒子解析システム。
(15)
前記撮像部は、前記容器内の前記粒子からの光を撮像して画像データを生成する第2センサ部をさらに備え、
前記処理部は、前記第2センサ部で取得された前記画像データに基づいて前記ユーザインタフェースを生成する
前記(13)又は(14)に記載の粒子解析システム。
(16)
前記第1走査部は、前記イベントに基づいて計測された前記容器内の状態に基づいて前記撮像部の前記焦点位置を前記容器の深さ方向に移動させ、
前記第2センサ部は、前記撮像部の前記焦点位置が前記容器内の状態に基づいて移動させられた状態で前記容器内の前記粒子からの光を撮像して前記画像データを生成する
前記(15)に記載の粒子解析システム。
(17)
行列状に配列する複数の前記容器のうちの1つを前記撮像部の画角内に順次移動させる第2走査部をさらに備え、
前記第1走査部は、前記容器ごとに、前記撮像部の焦点位置を前記容器の前記深さ方向に走査し、
前記処理部は、前記容器ごとに、前記第1走査部の走査による前記撮像部の複数の焦点位置で検出されたイベントに基づいて、前記容器内の状態を計測する
前記(1)~(15)の何れか1つに記載の粒子解析システム。
(18)
前記粒子は、細胞又は非細胞性生体粒子である
前記(1)~(17)の何れか1つに記載の粒子解析システム。
(19)
所定の流路を通過する前記粒子に対して光を照射する検出用光源部と、
前記検出用光源部からの前記光の照射により前記粒子から放射した光を検出する検出部と、
前記検出部による検出結果に基づいて前記粒子を前記容器に分取する分取部と、
をさらに備える前記(1)~(18)の何れか1つに記載の粒子解析システム。
(20)
前記容器が、平面上に自立した液滴である、
前記(1)~(18)の何れか1つに記載の粒子解析システム。
(21)
容器内の粒子からの光の輝度変化をイベントとして検出する撮像部を備える粒子解析システムの粒子解析方法であって、
前記撮像部の焦点位置を前記容器の深さ方向に走査する工程と、
前記焦点位置の走査による前記撮像部の複数の焦点位置で検出されたイベントに基づいて、前記容器内の状態を計測する工程と、
を備える粒子解析方法。
(22)
前記容器が、平面上に自立した液滴である、
前記(21)に記載の粒子解析方法。
(23)
所定の流路を通過する生体粒子に対して光を照射する検出用光源部と、
前記検出用光源部からの前記光の照射により前記生体粒子から放射した光を検出する検出部と、
前記検出部による検出結果に基づいて前記生体粒子を所定の容器に分取する分取部と、
前記容器内の前記生体粒子に対して光を照射する撮像用光源部と、
前記撮像用光源部からの光の照射に応じた前記容器内の前記生体粒子からの光の輝度変化をイベントとして検出する撮像部と、
前記撮像部の焦点位置を前記容器の深さ方向に走査する走査部と、
前記走査部の走査による前記撮像部の複数の焦点位置で検出されたイベントに基づいて、前記容器内の状態を計測する処理部と、
を備えるフローサイトメータシステム。 Note that the present technology can also take the following configuration.
(1)
an imaging unit that detects changes in brightness of light from particles in the container as events;
a first scanning unit that scans the focal position of the imaging unit in the depth direction of the container;
a processing unit that measures the state inside the container based on events detected at a plurality of focal positions of the imaging unit by scanning by the first scanning unit;
A particle analysis system with
(2)
Further comprising a storage unit that records the focal position of the imaging unit at two or more different points in time while the first scanning unit scans the focal position of the imaging unit along the depth direction of the container,
The particle analysis system according to (1) above.
(3)
The imaging unit is
an objective lens facing the container;
a first sensor unit comprising a plurality of pixels each configured to detect, as the event, a change in brightness of light from the particles in the container incident through the objective lens;
with
The particle analysis system according to (1) or (2), wherein the first scanning unit scans the focal position of the objective lens in the depth direction of the container.
(4)
The first scanning unit scans the focal position in the depth direction of the container by changing the relative position between the objective lens and the container in the depth direction. analysis system.
(5)
The objective lens comprises one or more lenses,
The first scanning unit scans the focal position in the depth direction of the container by moving at least one lens among the one or more lenses of the objective lens in the depth direction. The particle analysis system according to 3).
(6)
further comprising an imaging light source unit that irradiates light to the particles in the container;
The particle analysis according to any one of (1) to (5), wherein the imaging unit detects, as the event, a change in luminance of fluorescence emitted from the particles due to irradiation of the light from the imaging light source unit. system.
(7)
further comprising an imaging light source unit that irradiates light to the particles in the container;
The particle analysis system according to any one of (1) to (5), wherein the imaging unit detects, as the event, a change in brightness of light output from the imaging light source unit and reflected or scattered by the particles. .
(8)
The imaging unit further comprises an optical system that reflects light from the imaging light source unit and transmits light from the particles in the container,
The light from the imaging light source unit reflected by the optical system is applied to the particles in the container,
The particle analysis system according to (6) or (7), wherein the light from the particles in the container passes through the optical system and enters the imaging section.
(9)
The imaging light source unit irradiates the container with light from a first side,
The particle analysis system according to (6) or (7), wherein the imaging unit detects, as the event, a change in brightness of light from the particles traveling to a second side opposite to the first side.
(10)
The processing unit measures the state inside the container based on the number of events located in the vicinity of one event in the spatial direction and/or the temporal direction. The particle analysis system described.
(11)
The particle analysis system according to any one of (1) to (10), wherein the processing unit measures the number of particles in the container as the state inside the container based on the event.
(12)
The particle analysis system according to any one of (1) to (11), wherein the processing unit measures the position of the particle within the container as the state within the container based on the event.
(13)
The particle analysis system according to any one of (1) to (12), wherein the processing unit generates a user interface that presents the measured state inside the container to the user.
(14)
The particle analysis system according to (13), wherein the processing unit generates, as the user interface, a two-dimensional map or a three-dimensional map of the interior of the container constructed from the event.
(15)
The imaging unit further includes a second sensor unit that captures light from the particles in the container to generate image data,
The particle analysis system according to (13) or (14), wherein the processing unit generates the user interface based on the image data acquired by the second sensor unit.
(16)
The first scanning unit moves the focal position of the imaging unit in the depth direction of the container based on the state inside the container measured based on the event,
The second sensor unit generates the image data by capturing the light from the particles within the container while the focal position of the imaging unit is moved based on the state within the container. The particle analysis system according to 15).
(17)
further comprising a second scanning unit that sequentially moves one of the plurality of containers arranged in a matrix into an angle of view of the imaging unit;
The first scanning unit scans the focal position of the imaging unit in the depth direction of the container for each container,
The processing unit measures the state inside the container based on events detected at a plurality of focal positions of the imaging unit by scanning by the first scanning unit for each container. ), the particle analysis system according to any one of .
(18)
The particle analysis system according to any one of (1) to (17) above, wherein the particles are cells or non-cellular biological particles.
(19)
a light source unit for detection that irradiates light onto the particles passing through a predetermined flow path;
a detection unit that detects the light emitted from the particles by the irradiation of the light from the detection light source unit;
a fractionation unit that fractionates the particles into the container based on the detection result of the detection unit;
The particle analysis system according to any one of (1) to (18), further comprising:
(20)
The container is a droplet that stands on its own on a plane,
The particle analysis system according to any one of (1) to (18) above.
(21)
A particle analysis method for a particle analysis system comprising an imaging unit that detects changes in brightness of light from particles in a container as events,
a step of scanning the focal position of the imaging unit in the depth direction of the container;
a step of measuring the state inside the container based on events detected at a plurality of focal positions of the imaging unit by scanning the focal position;
A particle analysis method comprising:
(22)
The container is a droplet that stands on its own on a plane,
The particle analysis method according to (21) above.
(23)
a light source unit for detection that irradiates light onto biological particles passing through a predetermined flow path;
a detection unit that detects the light emitted from the biological particles by the irradiation of the light from the detection light source unit;
a collection unit that collects the bioparticles into a predetermined container based on the detection result of the detection unit;
an imaging light source unit for irradiating the biological particles in the container with light;
an imaging unit that detects, as an event, a change in brightness of light from the biological particles in the container in response to irradiation of light from the imaging light source unit;
a scanning unit that scans the focal position of the imaging unit in the depth direction of the container;
a processing unit that measures the state inside the container based on events detected at a plurality of focal positions of the imaging unit by scanning of the scanning unit;
A flow cytometer system comprising:
10 カメラユニット
11 対物レンズ
12 ビームスプリッタ
13 撮像部
14 垂直走査機構
15、55 面内走査機構
16 撮像用光源部
17 データ処理部
18 表示部
19 制御部
20 ウェルプレート
21 ウェル
22 フレーム
30 画素
31、41 画素アレイ部
32 垂直駆動回路
33 カラム処理回路
34 水平駆動回路
35 システム制御部
38 信号処理部
39 データ格納部
40 イベント画素
42 Xアービタ
43 Yアービタ
44 イベント信号処理回路
45 システム制御回路
46 出力I/F
51 試料
52 粒子識別機構
53 インデックスソーティング機構
54 廃液
100 粒子解析システム
100A フローサイトメータ
100B 粒子数計測装置
101 光照射部
102 検出部
103 情報処理部
104 分取部
105、105A、105B、205 粒子数計測部
111 検出用光源部
112 導光光学系
121 検出光学系
122 撮像部
122a イメージセンサ
122b EVS
123 信号処理部
124 速度計測部
131 EVS
232 CIS(イメージセンサ)
233 ハーフミラー
C 流路
P 生体粒子
S 生体試料 REFERENCE SIGNSLIST 10 camera unit 11 objective lens 12 beam splitter 13 imaging unit 14 vertical scanning mechanism 15, 55 in-plane scanning mechanism 16 imaging light source unit 17 data processing unit 18 display unit 19 control unit 20 well plate 21 well 22 frame 30 pixels 31, 41 Pixel array unit 32 Vertical drive circuit 33 Column processing circuit 34 Horizontal drive circuit 35 System control unit 38 Signal processing unit 39 Data storage unit 40 Event pixel 42 X arbiter 43 Y arbiter 44 Event signal processing circuit 45 System control circuit 46 Output I/F
51Sample 52 Particle Identification Mechanism 53 Index Sorting Mechanism 54 Waste Liquid 100 Particle Analysis System 100A Flow Cytometer 100B Particle Number Measuring Device 101 Light Irradiation Section 102 Detection Section 103 Information Processing Section 104 Sorting Section 105, 105A, 105B, 205 Particle Number Measurement Unit 111 Light source unit for detection 112 Light guide optical system 121 Detection optical system 122 Imaging unit 122a Image sensor 122b EVS
123signal processing unit 124 velocity measurement unit 131 EVS
232 CIS (image sensor)
233 Half mirror C Flow path P Biological particle S Biological sample
11 対物レンズ
12 ビームスプリッタ
13 撮像部
14 垂直走査機構
15、55 面内走査機構
16 撮像用光源部
17 データ処理部
18 表示部
19 制御部
20 ウェルプレート
21 ウェル
22 フレーム
30 画素
31、41 画素アレイ部
32 垂直駆動回路
33 カラム処理回路
34 水平駆動回路
35 システム制御部
38 信号処理部
39 データ格納部
40 イベント画素
42 Xアービタ
43 Yアービタ
44 イベント信号処理回路
45 システム制御回路
46 出力I/F
51 試料
52 粒子識別機構
53 インデックスソーティング機構
54 廃液
100 粒子解析システム
100A フローサイトメータ
100B 粒子数計測装置
101 光照射部
102 検出部
103 情報処理部
104 分取部
105、105A、105B、205 粒子数計測部
111 検出用光源部
112 導光光学系
121 検出光学系
122 撮像部
122a イメージセンサ
122b EVS
123 信号処理部
124 速度計測部
131 EVS
232 CIS(イメージセンサ)
233 ハーフミラー
C 流路
P 生体粒子
S 生体試料 REFERENCE SIGNS
51
123
232 CIS (image sensor)
233 Half mirror C Flow path P Biological particle S Biological sample
Claims (20)
- 容器内の粒子からの光の輝度変化をイベントとして検出する撮像部と、
前記撮像部の焦点位置を前記容器の深さ方向に走査する第1走査部と、
前記第1走査部の走査による前記撮像部の複数の焦点位置で検出されたイベントに基づいて、前記容器内の状態を計測する処理部と、
を備える粒子解析システム。 an imaging unit that detects changes in brightness of light from particles in the container as events;
a first scanning unit that scans the focal position of the imaging unit in the depth direction of the container;
a processing unit that measures the state inside the container based on events detected at a plurality of focal positions of the imaging unit by scanning by the first scanning unit;
A particle analysis system with - 前記第1走査部が前記撮像部の前記焦点位置を前記容器の前記深さ方向に沿って走査する間、前記撮像部の焦点位置を異なる2以上の時点で記録する記憶部をさらに備える、
請求項1に記載の粒子解析システム。 Further comprising a storage unit that records the focal position of the imaging unit at two or more different points in time while the first scanning unit scans the focal position of the imaging unit along the depth direction of the container,
The particle analysis system according to claim 1. - 前記撮像部は、
前記容器と対向する対物レンズと、
それぞれ前記対物レンズを介して入射した前記容器内の前記粒子から光の輝度変化を前記イベントとして検出する複数の画素を備える第1センサ部と、
を備え、
前記第1走査部は、前記対物レンズの前記焦点位置を前記容器の前記深さ方向に走査する
請求項1に記載の粒子解析システム。 The imaging unit is
an objective lens facing the container;
a first sensor unit comprising a plurality of pixels each configured to detect, as the event, a change in brightness of light from the particles in the container incident through the objective lens;
with
The particle analysis system according to claim 1, wherein the first scanning unit scans the focal position of the objective lens in the depth direction of the container. - 前記第1走査部は、前記対物レンズと前記容器との相対位置を前記深さ方向に変化させることで、前記焦点位置を前記容器の前記深さ方向に走査する
請求項3に記載の粒子解析システム。 The particle analysis according to claim 3, wherein the first scanning unit scans the focal position in the depth direction of the container by changing the relative position between the objective lens and the container in the depth direction. system. - 前記対物レンズは、1以上のレンズを備え、
前記第1走査部は、前記対物レンズの前記1以上のレンズのうちの少なくとも1つのレンズを前記深さ方向に移動させることで、前記焦点位置を前記容器の前記深さ方向に走査する
請求項3に記載の粒子解析システム。 The objective lens comprises one or more lenses,
The first scanning unit scans the focal position in the depth direction of the container by moving at least one of the one or more lenses of the objective lens in the depth direction. 4. The particle analysis system according to 3. - 前記容器内の前記粒子に対して光を照射する撮像用光源部をさらに備え、
前記撮像部は、前記撮像用光源部からの前記光の照射により前記粒子から放射した蛍光の輝度変化を前記イベントとして検出する
請求項1に記載の粒子解析システム。 further comprising an imaging light source unit that irradiates light to the particles in the container;
The particle analysis system according to claim 1, wherein the imaging unit detects, as the event, a change in luminance of fluorescence emitted from the particles due to irradiation of the light from the imaging light source unit. - 前記撮像部は、前記撮像用光源部からの光を反射し、前記容器内の前記粒子からの光を透過する光学系をさらに備え、
前記光学系で反射された前記撮像用光源部からの光は、前記容器内の前記粒子に照射され、
前記容器内の前記粒子からの光は、前記光学系を透過して前記撮像部に入射する
請求項6に記載の粒子解析システム。 The imaging unit further comprises an optical system that reflects light from the imaging light source unit and transmits light from the particles in the container,
The light from the imaging light source unit reflected by the optical system is applied to the particles in the container,
The particle analysis system according to claim 6, wherein light from the particles in the container passes through the optical system and enters the imaging unit. - 前記撮像用光源部は、第1の側から前記容器に光を照射し、
前記撮像部は、前記第1の側と反対側の第2の側に進行する前記粒子からの光の輝度変化を前記イベントとして検出する
請求項6に記載の粒子解析システム。 The imaging light source unit irradiates the container with light from a first side,
The particle analysis system according to claim 6, wherein the imaging unit detects, as the event, a change in luminance of light from the particles traveling to a second side opposite to the first side. - 前記処理部は、空間方向及び/又は時間方向において1のイベントの近傍に位置するイベントの数に基づいて、前記容器内の状態を計測する
請求項1に記載の粒子解析システム。 The particle analysis system according to claim 1, wherein the processing unit measures the state inside the container based on the number of events located in the vicinity of one event in the spatial direction and/or the temporal direction. - 前記処理部は、前記イベントに基づき、前記容器内の前記粒子の数を前記容器内の状態として計測する
請求項1に記載の粒子解析システム。 The particle analysis system according to claim 1, wherein the processing unit measures the number of particles in the container as the state inside the container based on the event. - 前記処理部は、前記イベントに基づき、前記容器内における前記粒子の位置を前記容器内の状態として計測する
請求項1に記載の粒子解析システム。 The particle analysis system according to claim 1, wherein the processing unit measures the position of the particle within the container as the state within the container based on the event. - 前記処理部は、計測された前記容器内の状態をユーザに提示するユーザインタフェースを生成する
請求項1に記載の粒子解析システム。 The particle analysis system according to claim 1, wherein the processing unit generates a user interface that presents a user with the measured state inside the container. - 前記処理部は、前記イベントから構築された前記容器内の2次元マップ又は3次元マップを前記ユーザインタフェースとして生成する
請求項12に記載の粒子解析システム。 13. The particle analysis system according to claim 12, wherein the processing unit generates, as the user interface, a two-dimensional map or a three-dimensional map of the inside of the vessel constructed from the event. - 前記撮像部は、前記容器内の前記粒子からの光を撮像して画像データを生成する第2センサ部をさらに備え、
前記処理部は、前記第2センサ部で取得された前記画像データに基づいて前記ユーザインタフェースを生成する
請求項12に記載の粒子解析システム。 The imaging unit further includes a second sensor unit that captures light from the particles in the container to generate image data,
The particle analysis system according to claim 12, wherein the processing section generates the user interface based on the image data acquired by the second sensor section. - 前記第1走査部は、前記イベントに基づいて計測された前記容器内の状態に基づいて前記撮像部の前記焦点位置を前記容器の深さ方向に移動させ、
前記第2センサ部は、前記撮像部の前記焦点位置が前記容器内の状態に基づいて移動させられた状態で前記容器内の前記粒子からの光を撮像して前記画像データを生成する
請求項14に記載の粒子解析システム。 The first scanning unit moves the focal position of the imaging unit in the depth direction of the container based on the state inside the container measured based on the event,
The second sensor section captures the light from the particles within the container in a state in which the focal position of the imaging section is moved based on the state within the container to generate the image data. 15. The particle analysis system according to 14. - 行列状に配列する複数の前記容器のうちの1つを前記撮像部の画角内に順次移動させる第2走査部をさらに備え、
前記第1走査部は、前記容器ごとに、前記撮像部の焦点位置を前記容器の前記深さ方向に走査し、
前記処理部は、前記容器ごとに、前記第1走査部の走査による前記撮像部の複数の焦点位置で検出されたイベントに基づいて、前記容器内の状態を計測する
請求項1に記載の粒子解析システム。 further comprising a second scanning unit that sequentially moves one of the plurality of containers arranged in a matrix into an angle of view of the imaging unit;
The first scanning unit scans the focal position of the imaging unit in the depth direction of the container for each container,
The particle according to claim 1, wherein the processing unit measures the state inside the container based on events detected at a plurality of focal positions of the imaging unit by scanning by the first scanning unit for each container. analysis system. - 前記粒子は、細胞又は非細胞性生体粒子である
請求項1に記載の粒子解析システム。 The particle analysis system according to claim 1, wherein the particles are cells or non-cellular biological particles. - 所定の流路を通過する前記粒子に対して光を照射する検出用光源部と、
前記検出用光源部からの前記光の照射により前記粒子から放射した光を検出する検出部と、
前記検出部による検出結果に基づいて前記粒子を前記容器に分取する分取部と、
をさらに備える請求項1に記載の粒子解析システム。 a light source unit for detection that irradiates light onto the particles passing through a predetermined flow path;
a detection unit that detects the light emitted from the particles by the irradiation of the light from the detection light source unit;
a fractionation unit that fractionates the particles into the container based on the detection result of the detection unit;
The particle analysis system of claim 1, further comprising: - 容器内の粒子からの光の輝度変化をイベントとして検出する撮像部を備える粒子解析システムの粒子解析方法であって、
前記撮像部の焦点位置を前記容器の深さ方向に走査する工程と、
前記焦点位置の走査による前記撮像部の複数の焦点位置で検出されたイベントに基づいて、前記容器内の状態を計測する工程と、
を備える粒子解析方法。 A particle analysis method for a particle analysis system comprising an imaging unit that detects changes in brightness of light from particles in a container as events,
a step of scanning the focal position of the imaging unit in the depth direction of the container;
a step of measuring the state inside the container based on events detected at a plurality of focal positions of the imaging unit by scanning the focal position;
A particle analysis method comprising: - 所定の流路を通過する生体粒子に対して光を照射する検出用光源部と、
前記検出用光源部からの前記光の照射により前記生体粒子から放射した光を検出する検出部と、
前記検出部による検出結果に基づいて前記生体粒子を所定の容器に分取する分取部と、
前記容器内の前記生体粒子に対して光を照射する撮像用光源部と、
前記撮像用光源部からの光の照射に応じた前記容器内の前記生体粒子からの光の輝度変化をイベントとして検出する撮像部と、
前記撮像部の焦点位置を前記容器の深さ方向に走査する走査部と、
前記走査部の走査による前記撮像部の複数の焦点位置で検出されたイベントに基づいて、前記容器内の状態を計測する処理部と、
を備えるフローサイトメータシステム。 a light source unit for detection that irradiates light onto biological particles passing through a predetermined flow path;
a detection unit that detects the light emitted from the biological particles by the irradiation of the light from the detection light source unit;
a collection unit that collects the bioparticles into a predetermined container based on the detection result of the detection unit;
an imaging light source unit for irradiating the biological particles in the container with light;
an imaging unit that detects, as an event, a change in brightness of light from the biological particles in the container in response to irradiation of light from the imaging light source unit;
a scanning unit that scans the focal position of the imaging unit in the depth direction of the container;
a processing unit that measures the state inside the container based on events detected at a plurality of focal positions of the imaging unit by scanning of the scanning unit;
A flow cytometer system comprising:
Priority Applications (1)
| Application Number | Priority Date | Filing Date | Title |
|---|---|---|---|
| CN202280057897.4A CN117881955A (en) | 2021-09-03 | 2022-03-23 | Particle analysis system, particle analysis method, and flow cytometer system |
Applications Claiming Priority (2)
| Application Number | Priority Date | Filing Date | Title |
|---|---|---|---|
| JP2021144272 | 2021-09-03 | ||
| JP2021-144272 | 2021-09-03 |
Publications (1)
| Publication Number | Publication Date |
|---|---|
| WO2023032320A1 true WO2023032320A1 (en) | 2023-03-09 |
Family
ID=85411679
Family Applications (1)
| Application Number | Title | Priority Date | Filing Date |
|---|---|---|---|
| PCT/JP2022/013376 WO2023032320A1 (en) | 2021-09-03 | 2022-03-23 | Particle analysis system, particle analysis method, and flow cytometer system |
Country Status (2)
| Country | Link |
|---|---|
| CN (1) | CN117881955A (en) |
| WO (1) | WO2023032320A1 (en) |
Citations (10)
| Publication number | Priority date | Publication date | Assignee | Title |
|---|---|---|---|---|
| JP2010263872A (en) * | 2009-05-18 | 2010-11-25 | Olympus Corp | Cell image analyzer |
| JP2011226970A (en) | 2010-04-22 | 2011-11-10 | Inst For Systems Biology | Automatic analysis of images using bright field microscope |
| JP2011232259A (en) | 2010-04-28 | 2011-11-17 | Sony Corp | Fluorescence intensity correction method, method and device of fluorescence intensity calculation |
| WO2014057713A1 (en) * | 2012-10-09 | 2014-04-17 | 古河電気工業株式会社 | Screening device and screening method |
| US20160265970A1 (en) * | 2015-03-09 | 2016-09-15 | Samsung Electronics Co., Ltd. | Event-based vision sensor and difference amplifier with reduced noise and removed offset |
| JP2017091518A (en) * | 2015-11-16 | 2017-05-25 | 三星電子株式会社Samsung Electronics Co.,Ltd. | Image generating method and apparatus |
| JP2018007587A (en) * | 2016-07-11 | 2018-01-18 | オリンパス株式会社 | Observation device |
| JP2020076736A (en) | 2018-09-10 | 2020-05-21 | ソニー株式会社 | Fine particle fractionating apparatus, cell therapeutic agent manufacturing method, fine particle fractionating method, and program |
| WO2021019830A1 (en) * | 2019-07-29 | 2021-02-04 | 株式会社日立ハイテク | Particle quantifying device |
| WO2021241757A1 (en) * | 2020-05-29 | 2021-12-02 | ソニーグループ株式会社 | Information processing device, biological sample analysis method, biological sample detection device, and biological sample detection system |
-
2022
- 2022-03-23 WO PCT/JP2022/013376 patent/WO2023032320A1/en active Application Filing
- 2022-03-23 CN CN202280057897.4A patent/CN117881955A/en active Pending
Patent Citations (10)
| Publication number | Priority date | Publication date | Assignee | Title |
|---|---|---|---|---|
| JP2010263872A (en) * | 2009-05-18 | 2010-11-25 | Olympus Corp | Cell image analyzer |
| JP2011226970A (en) | 2010-04-22 | 2011-11-10 | Inst For Systems Biology | Automatic analysis of images using bright field microscope |
| JP2011232259A (en) | 2010-04-28 | 2011-11-17 | Sony Corp | Fluorescence intensity correction method, method and device of fluorescence intensity calculation |
| WO2014057713A1 (en) * | 2012-10-09 | 2014-04-17 | 古河電気工業株式会社 | Screening device and screening method |
| US20160265970A1 (en) * | 2015-03-09 | 2016-09-15 | Samsung Electronics Co., Ltd. | Event-based vision sensor and difference amplifier with reduced noise and removed offset |
| JP2017091518A (en) * | 2015-11-16 | 2017-05-25 | 三星電子株式会社Samsung Electronics Co.,Ltd. | Image generating method and apparatus |
| JP2018007587A (en) * | 2016-07-11 | 2018-01-18 | オリンパス株式会社 | Observation device |
| JP2020076736A (en) | 2018-09-10 | 2020-05-21 | ソニー株式会社 | Fine particle fractionating apparatus, cell therapeutic agent manufacturing method, fine particle fractionating method, and program |
| WO2021019830A1 (en) * | 2019-07-29 | 2021-02-04 | 株式会社日立ハイテク | Particle quantifying device |
| WO2021241757A1 (en) * | 2020-05-29 | 2021-12-02 | ソニーグループ株式会社 | Information processing device, biological sample analysis method, biological sample detection device, and biological sample detection system |
Also Published As
| Publication number | Publication date |
|---|---|
| CN117881955A (en) | 2024-04-12 |
Similar Documents
| Publication | Publication Date | Title |
|---|---|---|
| US5548395A (en) | Particle analyzer | |
| US5457526A (en) | Apparatus for analyzing particles in fluid samples | |
| US8098956B2 (en) | Digital microscope slide scanning system and methods | |
| US20110242312A1 (en) | Inspection system and inspection method | |
| EP2024893A2 (en) | A laser illumination system in fluorescent microscopy | |
| CN110082360A (en) | A kind of sequence optical element surface on-line detection device of defects and method based on array camera | |
| US20110017915A1 (en) | Drift scanner for rare cell detection | |
| US11131839B2 (en) | Sample observation device and sample observation method | |
| CN112996900A (en) | Cell sorting device and method | |
| WO2019198308A1 (en) | Sample observation device and sample observation method | |
| WO2023032320A1 (en) | Particle analysis system, particle analysis method, and flow cytometer system | |
| US20230417671A1 (en) | Biological sample analysis system, information processing device, information processing method, and biological sample analysis method | |
| JPH0579970A (en) | Particle analyzer | |
| US11943537B2 (en) | Impulse rescan system | |
| JP4163301B2 (en) | Scanning cytometer | |
| US11967090B2 (en) | Method of and microscope comprising a device for detecting movements of a sample with respect to an objective | |
| WO2023248561A1 (en) | Biological sample analysis system and biological sample analysis method | |
| US8073219B2 (en) | Nucleic acid analyzing apparatus | |
| JP2002062251A (en) | Flow type particle image analyzing method and device | |
| WO2023223851A1 (en) | Biological sample analysis system, information processing device, information processing method, and biological sample analysis method | |
| WO2023276298A1 (en) | Biological sample analysis system, information processing device, information processing method, and biological sample analysis method | |
| Shapiro | The cytometric future: it ain’t necessarily flow! | |
| JP3165272B2 (en) | Flow type particle image analysis method and flow type particle image analysis device | |
| JPH06221986A (en) | Flow-type method and apparatus for analyzing particle image | |
| WO2023007777A1 (en) | Particle sorting device and particle sorting method |
Legal Events
| Date | Code | Title | Description |
|---|---|---|---|
| 121 | Ep: the epo has been informed by wipo that ep was designated in this application |
Ref document number: 22863910 Country of ref document: EP Kind code of ref document: A1 |
|
| WWE | Wipo information: entry into national phase |
Ref document number: 2023545062 Country of ref document: JP |
|
| WWE | Wipo information: entry into national phase |
Ref document number: 2022863910 Country of ref document: EP |
|
| ENP | Entry into the national phase |
Ref document number: 2022863910 Country of ref document: EP Effective date: 20240315 |