WO2023022158A1 - 食事多様性判定装置、シート、食事多様性判定方法、および記録媒体 - Google Patents
食事多様性判定装置、シート、食事多様性判定方法、および記録媒体 Download PDFInfo
- Publication number
- WO2023022158A1 WO2023022158A1 PCT/JP2022/030989 JP2022030989W WO2023022158A1 WO 2023022158 A1 WO2023022158 A1 WO 2023022158A1 JP 2022030989 W JP2022030989 W JP 2022030989W WO 2023022158 A1 WO2023022158 A1 WO 2023022158A1
- Authority
- WO
- WIPO (PCT)
- Prior art keywords
- information
- lower limit
- score
- diversity
- unit
- Prior art date
- Legal status (The legal status is an assumption and is not a legal conclusion. Google has not performed a legal analysis and makes no representation as to the accuracy of the status listed.)
- Ceased
Links
Images








Classifications
-
- G—PHYSICS
- G06—COMPUTING OR CALCULATING; COUNTING
- G06Q—INFORMATION AND COMMUNICATION TECHNOLOGY [ICT] SPECIALLY ADAPTED FOR ADMINISTRATIVE, COMMERCIAL, FINANCIAL, MANAGERIAL OR SUPERVISORY PURPOSES; SYSTEMS OR METHODS SPECIALLY ADAPTED FOR ADMINISTRATIVE, COMMERCIAL, FINANCIAL, MANAGERIAL OR SUPERVISORY PURPOSES, NOT OTHERWISE PROVIDED FOR
- G06Q50/00—Information and communication technology [ICT] specially adapted for implementation of business processes of specific business sectors, e.g. utilities or tourism
- G06Q50/10—Services
Definitions
- the present invention relates to a diet diversity determination device or the like that judges whether or not a diverse diet is ingested.
- a meal business support system using a database that stores reference value information that is the range of appropriate amounts for each nutrition of meals, collecting meal information including nutritional intake of meals, The nutritional balance is calculated by calculating the score for each nutrient as a continuous value using a dietary information input unit that accepts input of information and a function that changes according to the range of appropriate amounts of reference value information using the amount of nutrient intake as a variable.
- a meal characterized by comprising an index calculation unit for calculating a score, and a target condition setting unit for setting a target value for the nutritional balance score using the nutritional balance score obtained by the index calculation unit and a unit price of the meal.
- the dietary diversity judging device of the first invention stores a lower limit storage unit storing lower limit information specifying an appropriate lower limit of intake for each of two or more food groups, and a food group corresponding to the lower limit information and the lower limit information.
- a presentation information output unit that outputs two or more pieces of presentation information in a manner associated with a food group identifier to be identified;
- Score acquisition to acquire a diversity score, which is a score related to dietary diversity, using an answer reception unit that receives answer information specifying whether or not the person ingested a specified amount or more, and the answer information received by the answer reception unit.
- a score output unit for outputting the diversity score acquired by the score acquisition unit.
- the score acquisition unit acquires a diversity score based on the number of food groups that have consumed an amount equal to or greater than the amount specified by the lower limit information. , is a dietary diversity determination device.
- the dietary diversity determination device of the third invention is a dietary diversity determination device in which the two or more food groups are ten food groups in contrast to the second invention.
- the lower limit storage unit stores two or more user conditions using one or more user attribute values.
- an instruction reception unit that stores lower limit information for each of two or more food groups in association, is an instruction associated with one or more user attribute values, and receives an output instruction that is an instruction to output two or more pieces of presentation information; Then, the lower limit information for each of the two or more food groups corresponding to the user conditions satisfied by the one or more user attribute values associated with the output instruction is acquired from the lower limit storage unit, and the food group identifying the food group corresponding to the lower limit information.
- a presentation information acquisition unit that acquires two or more pieces of presentation information in which the identifier and the lower limit information are associated, and the presentation information output unit outputs the two or more pieces of presentation information acquired by the presentation information acquisition unit; It is a dietary diversity determination device.
- the one or more user attribute values are a race identifier that identifies the race of the user, a residence that identifies the place of residence of the user, A meal diversity determination device that includes a location identifier, a food culture identifier that identifies a food culture, or total amount information about the total amount of a user's meal.
- the degree of dietary diversity corresponding to the appropriate user attribute value can be obtained with high accuracy and easily.
- the dietary diversity determination device of the sixth invention is a risk store that stores risk information related to the risk given to people in association with the diversity score for any one of the first to fifth inventions.
- a risk acquisition unit that acquires risk information corresponding to the diversity score output by the score output unit from the risk storage unit; and a risk output unit that outputs the risk information acquired by the risk acquisition unit. It is a sex determination device.
- two or more risk information is stored in the risk storage unit, and two or more risks are stored in association with the diversity score.
- a set of risk information about any of the risks and degree information specifying the degree of possibility of occurrence of the risk is stored, and the risk acquisition unit corresponds to the diversity score output by the score output unit.
- the risk information and degree information are acquired from the risk storage unit, and the risk output unit is a dietary diversity determination device that outputs the risk information and degree information acquired by the risk acquisition unit.
- the dietary diversity determination device of the eighth invention provides advice associated with advice conditions using a diversity score and one or more answer information for any one of the first to seventh inventions.
- Advice storage for storing information;
- Advice acquisition for acquiring from the advice storage unit advice information corresponding to advice conditions that match the diversity score output by the score output unit and one or more answer information received by the answer reception unit.
- an advice output unit for outputting the advice information acquired by the advice acquisition unit.
- the response receiving unit receives a set of two or more response information on different days from one user.
- a dietary diversity determination device further comprising a statistical processing unit that statistically processes a set of two or more response information and obtains statistical processing results, and a statistical output unit that outputs the statistical processing results obtained by the statistical processing unit.
- the sheet of the tenth invention allows input of two or more pieces of presentation information in which the food group identifier for identifying the food group and the lower limit information for the food group are associated with each other, and answer information for each of the two or more pieces of presentation information.
- a sheet with an accepting field is provided.
- a diversity score which is the degree of dietary diversity, can be obtained with high accuracy and easily.
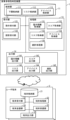
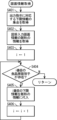
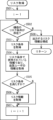
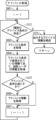
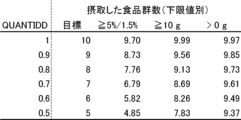
- FIG. 22 Overview of the computer system Block diagram of the same computer system Diagram showing the background of the same subject Diagram showing the correlation of QUANTIDD calculated from the same and different number of food groups Diagram showing a conversion table of QUANTIDD calculated from the same and different number of food groups Diagram showing the correlation between QUANTIDD and the number of food groups ingested due to differences in lower limit values A diagram showing a graph when the conditions for ingesting the same applicable food group are changed A diagram showing the table on which FIG. 22 is based
- Information indicating the lower limit of intake is stored for each food group of N (N is 2 or more), and the lower limit for specifying the lower limit of intake is associated with each food group identifier.
- Information is output, response information specifying whether or not an amount exceeding the lower limit of intake is received for each food group, and using the response information, a dietary diversity score is obtained and output.
- a determination system equipped with a dietary diversity determination device that does this will be described.
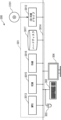
- FIG. 1 is a conceptual diagram of the determination system A according to this embodiment.
- the determination system A includes a dietary diversity determination device 1 and one or more user terminals 2 .
- the dietary diversity determination device 1 is a device that acquires and outputs diversity scores.
- the dietary diversity determination device 1 here is usually a so-called server, but it may be a stand-alone device.
- the dietary diversity determination device 1 is, for example, a cloud server, an ASP server, or the like.
- the type of the dietary diversity determination device 1 does not matter. Further, when the dietary diversity determination device 1 is a stand-alone device, the user terminal 2 is unnecessary.
- the user terminal 2 is a terminal used by the user.
- the user terminal 2 receives the answer information and outputs the diversity score obtained using the answer information.
- the user terminal 2 is, for example, a so-called personal computer, a tablet terminal, a smart phone, etc., and the type thereof does not matter.
- the dietary diversity determination device 1 and one or more user terminals 2 can communicate via a network such as the Internet.
- FIG. 2 is a block diagram of the determination system A according to this embodiment.
- a dietary diversity determination device 1 that constitutes the determination system A includes a storage unit 11 , a reception unit 12 , a processing unit 13 and an output unit 14 .
- Storage unit 11 includes lower limit storage unit 111 , risk storage unit 112 , and advice storage unit 113 .
- the reception unit 12 includes an instruction reception unit 121 and an answer reception unit 122 .
- the processing unit 13 includes a presentation information acquisition unit 131 , a score acquisition unit 132 , a risk acquisition unit 133 , an advice acquisition unit 134 and a statistical processing unit 135 .
- the output unit 14 includes a presentation information output unit 141 , a score output unit 142 , a risk output unit 143 , an advice output unit 144 and a statistics output unit 145 .
- the user terminal 2 includes a terminal storage unit 21, a terminal reception unit 22, a terminal processing unit 23, a terminal transmission unit 24, a terminal reception unit 25, and a terminal output unit 26.
- Various types of information are stored in the storage unit 11 that constitutes the dietary diversity determination device 1 .
- the various types of information are, for example, lower limit information described later, risk information described later, advice information described later, risk conditions described later, advice conditions described later, user conditions described later, and various screen information described later.
- the lower limit storage unit 111 stores two or more lower limit information.
- Each of the two or more pieces of lower limit information is information specifying appropriate lower limit intake amounts for different food groups.
- Two or more food groups include, for example, grains, potatoes, beans, nuts, vegetables (green and yellow vegetables, other vegetables), mushrooms, algae, fruits, eggs, seafood, meat, milk (dairy products ), sugar/sweeteners, confectionery, oils and fats, and seasonings.
- Two or more food groups are preferably ten.
- the ten food groups are, for example, grains, potatoes, beans, green and yellow vegetables, other vegetables (including mushrooms and algae), fruits, eggs, seafood, meats, and dairy products.
- the number of food groups is 10 is that, when obtaining a diversity score, which will be described later, it is sufficient for the user to input answer information for each food group, which is as small as 10, and 10 answers are sufficient.
- the diversity score can be obtained by simply adding information, and the significance of the diversity score is easy for users to understand.
- a set of lower limit information for each of the two or more food groups in the lower limit storage unit 111 is preferably associated with user conditions.
- a user condition is a condition using one or more user attribute values. That is, it is preferable that the lower limit information of at least one of the two or more food groups differs according to one or more user attribute values.
- One or more user attribute values are, for example, race identifier, place of residence identifier, food culture identifier, total volume information, gender information, and age information.
- the race identifier is information that identifies the race of the user, such as black, white, yellow, western, Japanese, American, and Asian.
- the total amount information is information related to the total amount of the user's usual meal, and is, for example, "eat well", “regular”, "small meal”, and the like.
- Gender information is, for example, "male” and “female”.
- the age information is, for example, age and generation (20s, 60s, over 65, etc.).
- the presentation information is information in which a food group identifier for identifying a food group and the lower limit information for the food group are associated with each other.
- the presentation information is, for example, information having food group identifiers and lower limit information.
- Screen information containing two or more pieces of lower limit information may be stored in the lower limit storage unit 111 . Further, screen information including two or more items of presentation information may be stored in the lower limit storage unit 111 .
- the screen information here is, for example, answer input screen information and input explanation screen information.
- the screen information is realized by, for example, HTML, XML, or the like, but the means for realizing it does not matter.
- the answer input screen information is screen information for configuring the answer input screen.
- the answer input screen information is information for constructing a screen for inputting the user's answer information.
- the answer input screen information is information for constructing a screen having two or more pieces of presentation information and fields corresponding to each of the two or more pieces of presentation information.
- the field here is a user interface component that accepts input of answer information.
- the fields here include, for example, a text box for entering text, a check box for entering a check, a user interface part for entering either " ⁇ " or “ ⁇ ”, a user interface part for entering " ⁇ ", " This is a user interface component for inputting "x”.
- the field may be any user interface component that allows entry of answer information specifying whether or not the user ingested the amount specified by the lower limit information or more, and the type of the field does not matter.
- the input explanation screen information does not have a field for inputting answer information, but is screen information for explanation to support inputting answer information.
- the input explanation screen information includes a set of two or more pieces of presentation information.
- the lower limit information is information that specifies the appropriate lower limit of intake for a food group.
- the lower limit information is, for example, a character string (e.g., 5% of dietary intake, 1.5% of dietary intake, 1/2 piece, 1 piece, 1 cup, 1/2 cup, 3 chunks, 2 slices). , or an image that gives an image of the lower limit of intake, or a combination of the character string and the image.
- the character string preferably contains information identifying the food item and information specifying the quantity. It is preferable that the character string be a character string of expressions such as "about to fit on one hand" or "about to be grasped by one hand", so that people can easily imagine the quantity.
- the lower limit information corresponding to the food group identifier "green and yellow vegetables” is "tomato: 5%” and "tomato: 1/2".
- the lower limit information corresponding to the food group identifier "other vegetables” is “onion: 5%” and “onion: 1/4.
- the lower limit information corresponding to the food group identifier "fruit” is “mandarin orange: 5%” and “mandarin orange: 1”.
- the lower limit information corresponding to the food group identifier "dairy products” is "yogurt: 5%", “milk: 5%”, “yogurt: 1 cup", and "milk: 1/2 cup”.
- the lower limit information corresponding to the food group identifier "potatoes” is “sweet potato: 1.5%” and “sweet potato: 3 chunks”.
- the lower limit information corresponding to the food group identifier “beans” is “natto: 1.5%”, “natto: 1 cup”, “tofu miso soup: 1.5%”, and “tofu miso soup: 1 cup”.
- the lower limit information corresponding to the food group identifier "seafood” is “sashimi: 1.5%” and “sashimi: 2 pieces”.
- the lower limit information corresponding to the food group identifier "meat” is "sliced loin: 1.5%” and “sliced loin: 1/2".
- the lower limit information corresponding to the food group identifier "eggs” is “eggs: 1.5%” and “eggs: 1/2". Note that percentages (1.5%, 5%, etc.) are percentages of the total dietary intake.
- the risk storage unit 112 stores one or more pieces of risk information.
- the risk information is information about risks given to people.
- Risk information is, for example, information that identifies the risk of disease.
- Risk information is, for example, information about the risk of cognitive decline, information about the risk of developing dementia, information about the risk of atrophy of the brain (hippocampus, etc.), information about the risk of sarcopenia or frailty, information about the risk of developing mood disorders , information on the risk of developing cardiovascular disease.
- the risk information has a risk identifier that identifies the content of the risk (eg, "cognitive function decline", “hippocampal atrophy”).
- Risk information may comprise degree information that identifies the degree of likelihood of a risk occurring.
- the risk information is usually a character string, but it may be a still image, moving image, or voice from which the content of the risk can be grasped, and the data type is not limited.
- risk information is associated with risk conditions.
- a risk condition is a condition for acquiring risk information.
- a risk condition is, for example, a condition using a diversity score.
- a risk condition is, for example, a condition that indicates a range of diversity scores.
- the risk conditions are, for example, diversity scores, conditions using one or more response information, statistical processing results of diversity scores, and statistical processing results of two or more response information. These are the conditions used.
- the advice storage unit 113 stores advice information associated with one or more advice conditions.
- Advice conditions are conditions using diversity scores.
- the advice condition is preferably a condition using a diversity score and one or more pieces of answer information.
- the advice information is advice information for the user to improve their diet.
- the advice information is, for example, a character string such as "Let's eat more than the standard amount of vegetables", "You should review the overall diet balance", etc., but still images, videos, and voices that can grasp the advice content. But it doesn't matter what data type it is.
- the reception unit 12 receives various information and instructions.
- Various types of information and instructions are, for example, output instructions, which will be described later, and reply information, which will be described later.
- reception here usually means reception from the user terminal 2, but reception of information input from an input device such as a keyboard, mouse, or touch panel, or reception of information from a recording medium such as an optical disk, a magnetic disk, or a semiconductor memory.
- the concept may include acceptance of read information.
- the instruction reception unit 121 receives various instructions.
- Various instructions are, for example, an output instruction and a statistics instruction.
- An output instruction is, for example, an instruction associated with one or more user attribute values, and an instruction to output two or more pieces of presentation information.
- the instruction to output two or more pieces of presentation information may be an instruction to output the answer input screen information or the input explanation screen information described above.
- the output instruction has, for example, a user identifier.
- a user identifier is information that identifies a user.
- the user identifier is, for example, an ID, name, email address, identifier of the user terminal 2 (eg IP address, MAC address).
- a statistical instruction is an instruction to perform statistical processing.
- a statistical indication comprises, for example, a user identifier.
- a statistical indication has period information, for example.
- the period information is information specifying the period of the reply information used when statistical processing is performed.
- a statistical indication may have a collection of response information for two or more days. A set of such response information is usually subject to statistical processing.
- the reply receiving unit 122 receives reply information.
- the reply receiving unit 122 normally receives two or more pieces of reply information.
- the reply receiving unit 122 receives, for example, reply information for each of ten food groups. It is preferable that the reply receiving unit 122 receives a set of two or more reply information on different days from one user. It is preferable that the answer accepting unit 122 accepts sets of two or more pieces of answer information from each of two or more users.
- the response information is information that specifies whether or not the food group corresponding to each of the two or more pieces of presentation information was ingested in an amount equal to or greater than the amount specified by the lower limit information corresponding to each of the two or more pieces of presentation information. Ingesting more than the amount specified by the lower limit information may be replaced with taking more than the amount specified by the lower limit information.
- the processing unit 13 performs various types of processing. Various types of processing are processing performed by the presentation information acquisition unit 131, the score acquisition unit 132, the risk acquisition unit 133, the advice acquisition unit 134, and the statistical processing unit 135, for example.
- the presentation information acquisition unit 131 acquires two or more pieces of presentation information.
- the presentation information is information in which food group identifiers and lower limit information are associated with each other.
- the mode of correspondence is that they are arranged horizontally, that they are arranged vertically, that they are adjacent to each other, and an output is made so that the user can recognize the correspondence. Good luck.
- the presentation information acquisition unit 131 acquires the lower limit information for each of the two or more food groups from the lower limit storage unit 111, and the two or more types of food group identifiers that identify the food groups corresponding to the lower limit information and the lower limit information are associated with each other. Get presentation information.
- the presentation information acquisition unit 131 acquires two or more pieces of presentation information from the lower limit storage unit 111 in response to receiving an output instruction.
- the presentation information acquisition unit 131 acquires answer input screen information or input explanation screen information from the lower limit storage unit 111 in response to receiving an output instruction.
- the presentation information acquisition unit 131 acquires lower limit information for each of two or more food groups corresponding to user conditions satisfied by one or more user attribute values associated with the output instruction from the lower limit storage unit 111, and stores information corresponding to the lower limit information. Two or more pieces of presentation information are acquired in which the food group identifier for identifying the food group to be served and the lower limit information are associated with each other.
- the presentation information acquisition unit 131 acquires, for example, two or more pieces of presentation information corresponding to user conditions satisfied by one or more user attribute values associated with the output instruction from the lower limit storage unit 111 .
- the presentation information acquisition unit 131 acquires from the lower limit storage unit 111, for example, answer input screen information or input explanation screen information corresponding to user conditions satisfied by one or more user attribute values associated with the output instruction.
- the presentation information acquisition unit 131 acquires from the lower limit storage unit 111 the lower limit information for each of the two or more food groups corresponding to the user conditions satisfied by the one or more user attribute values associated with the output instruction.
- the answer input screen information may be configured by substituting each lower limit information for the food group into the template information of the answer input screen information.
- the template information is template screen information for constructing the answer input screen information.
- the presentation information acquisition unit 131 acquires from the lower limit storage unit 111 the lower limit information for each of the two or more food groups corresponding to the user conditions satisfied by the one or more user attribute values associated with the output instruction.
- the answer input screen information may be configured by substituting each lower limit information for the food group into the model information of the input explanation screen information.
- the template information is template screen information for constructing the input explanation screen information.
- the score acquisition unit 132 uses the response information received by the response reception unit 122 to acquire a diversity score, which is a score related to dietary diversity.
- the score acquisition unit 132 uses the answer information received by the answer reception unit 122 to obtain the number of food groups ingesting the amount specified by the lower limit information or more, and obtains the diversity score based on this number.
- the score acquisition unit 132 acquires a diversity score for the number of food groups ingesting an amount equal to or greater than the amount specified by the lower limit information.
- the diversity score is any integer from 0 to 10, for example.
- the risk acquisition unit 133 acquires risk information corresponding to the diversity score output by the score output unit 142 from the risk storage unit 112 .
- the diversity score output by the score output unit 142 is the diversity score acquired by the score acquisition unit 132 .
- the risk acquisition unit 133 may acquire risk information corresponding to the diversity score passed from the score output unit 142 from the risk storage unit 112 .
- risk information and degree information corresponding to the diversity score output by the score output unit 142 are acquired from the risk storage unit 112 .
- the risk acquisition unit 133 may acquire from the risk storage unit 112 the risk information corresponding to the risk condition with which the diversity score output by the score output unit 142 matches.
- the risk acquisition unit 133 determines that one or more types of information among the acquired diversity scores, two or more pieces of answer information, statistical processing results of diversity scores, and statistical processing results of two or more pieces of answer information match.
- Risk information corresponding to risk conditions may be acquired from the risk storage unit 112 .
- the advice acquisition unit 134 acquires from the advice storage unit 113 advice information corresponding to advice conditions that match the diversity score output by the score output unit 142 .
- the advice acquisition unit 134 acquires, from the advice storage unit 113, advice information corresponding to advice conditions that match the diversity score output by the score output unit 142 and one or more pieces of answer information received by the answer reception unit 122, for example.
- the advice acquisition unit 134 acquires from the advice storage unit 113 advice information corresponding to advice conditions that match the diversity score passed from the score output unit 142 .
- the statistical processing unit 135 performs statistical processing on sets of two or more pieces of answer information on different days, and obtains statistical processing results.
- Representative values are, for example, an average value, a median value, a maximum value, and a minimum value.
- the output unit 14 outputs various information.
- Various types of information are, for example, presentation information, answer input screen information, input explanation screen information, diversity score, risk information, and advice information.
- the output is usually transmission to the user terminal 2, but display on a display, projection using a projector, printing on a printer, sound output, storage on a recording medium, other processing devices or other It is a concept that includes delivery of processing results to other programs, etc.
- the presentation information output unit 141 outputs two or more pieces of presentation information.
- the presentation information output unit 141 outputs two or more pieces of presentation information acquired by the presentation information acquisition unit 131 .
- the presentation information output unit 141 may output the answer input screen information acquired by the presentation information acquisition unit 131 .
- the presentation information output unit 141 may output the input explanation screen information acquired by the presentation information acquisition unit 131 .
- the score output unit 142 outputs the diversity score acquired by the score acquisition unit 132.
- the risk output unit 143 outputs the risk information acquired by the risk acquisition unit 133.
- the risk output unit 143 may output the risk information and degree information acquired by the risk acquisition unit 133 .
- the advice output unit 144 outputs the advice information acquired by the advice acquisition unit 134.
- the statistical output unit 145 outputs the statistical processing results obtained by the statistical processing unit 135.
- the statistical processing result is, for example, a representative value of diversity scores on two or more different days, or a statistical processing result of sets of answer information on two or more different days.
- the result of the statistical processing is, for example, food group identifiers corresponding to the answer information of "not being able to take" more than the threshold or more than the threshold on two or more different days.
- Various types of information are stored in the terminal storage unit 21 that constitutes the user terminal 2 .
- Various types of information are, for example, one or more user attribute values and answer information.
- the terminal reception unit 22 receives various instructions and information.
- Various instructions and information are, for example, output instructions, statistics instructions, and answer information.
- Various instructions and information input means can be anything, such as a numeric keypad, keyboard, mouse, or menu screen.
- the terminal processing unit 23 performs various types of processing. Various processes convert instructions and information received by the terminal reception unit 22 into instructions and information with a structure to be transmitted, for example. Various types of processing are configured to output information received by the terminal receiving unit 25, for example.
- the terminal transmission unit 24 transmits various instructions and information to the dietary diversity determination device 1.
- Various instructions and information are, for example, output instructions, statistics instructions, and answer information.
- the terminal reception unit 25 receives various information.
- Various types of information are, for example, presentation information, answer input screen information, input explanation screen information, diversity score, risk information, and advice information.
- the terminal output unit 26 outputs various information.
- Various types of information are, for example, presentation information, answer input screen, input explanation screen, diversity score, risk information, and advice information.
- the storage unit 11, the lower limit storage unit 111, the risk storage unit 112, the advice storage unit 113, and the terminal storage unit 21 are preferably non-volatile recording media, but can also be realized with volatile recording media.
- information may be stored in the storage unit 11 or the like via a recording medium, or information transmitted via a communication line or the like may be stored in the storage unit 11 or the like.
- information input via an input device may be stored in the storage unit 11 or the like.
- the reception unit 12, the instruction reception unit 121, the answer reception unit 122, and the terminal reception unit 25 are usually realized by wireless or wired communication means, but may be realized by means of receiving broadcast.
- the processing unit 13, the presentation information acquisition unit 131, the score acquisition unit 132, the risk acquisition unit 133, the advice acquisition unit 134, the statistical processing unit 135, and the terminal processing unit 23 can usually be implemented by a processor, memory, or the like.
- the processing procedure of the processing unit 13 and the like is normally realized by software, and the software is recorded in a recording medium such as a ROM. However, it may be realized by hardware (dedicated circuit).
- the processor may be MPU, CPU, GPU, or the like, and may be of any type.
- the output unit 14, the presentation information output unit 141, the score output unit 142, the risk output unit 143, the advice output unit 144, the statistics output unit 145, and the terminal transmission unit 24 are usually realized by wireless or wired communication means. , broadcast means.
- the terminal reception unit 22 can be realized by device drivers for input means such as numeric keys and keyboards, control software for menu screens, and the like.
- the terminal output unit 26 may or may not include output devices such as displays and speakers.
- the terminal output unit 26 can be realized by output device driver software, or by output device driver software and an output device.
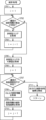
- Step S301 The instruction receiving unit 121 determines whether or not an output instruction has been received. If the output instruction is accepted, the process goes to step S302, and if not, the process goes to step S311. Note that the reception of the output instruction here is, for example, reception of the output instruction from the user terminal 2 .
- Step S302 The presentation information acquisition unit 131 acquires answer input screen information corresponding to the output instruction accepted in step S301. An example of such screen information acquisition processing will be described with reference to the flowchart of FIG.
- the answer input screen information has presentation information.
- Step S303 The presentation information output unit 141 outputs the answer input screen information acquired in step S302. It should be noted that the output of the answer input screen information here is transmission of the answer input screen information to the user terminal 2, for example.
- Step S304 The reply receiving unit 122 determines whether reply information corresponding to two or more food group identifiers has been received from the user in accordance with the output of the reply input screen information. If such answer information has been received, the process goes to step S305, and if no answer information has been received, the process returns to step S304. Receipt of response information from the user is reception of response information from the user terminal 2, for example. Also, the reply information here is received in association with, for example, a user identifier. Also, the answer information received here is usually answer information about meals for the day.
- the reply receiving unit 122 stores two or more pieces of reply information in the storage unit 11 in association with the user identifier and the food group identifier.
- Step S306 The score acquisition unit 132 acquires a diversity score using the two or more pieces of answer information accepted in step S305.
- the score acquisition unit 132 associates the acquired diversity scores with the user identifiers and stores them in the storage unit 11 .
- the score acquisition unit 132 stores the diversity score in the storage unit 11 in association with the date. Note that the score acquisition unit 132 acquires, for example, the number of “response information indicating that the intake is equal to or higher than the lower limit of intake” as the diversity score.
- Step S307 The risk acquisition unit 133 acquires risk information.
- An example of such risk information acquisition processing will be described with reference to the flowchart of FIG.
- Step S308 The advice acquisition unit 134 acquires advice information.
- An example of such advice information acquisition processing will be described with reference to the flowchart of FIG.
- Step S309 The processing unit 13 configures information to be output using one or more of the diversity score, risk information, and advice information.
- Step S310 The output unit 14 outputs the information configured in step S309. Return to step S301. Note that the output unit 14 transmits the information configured in step S309 to the user terminal 2, for example.
- Step S311 The instruction receiving unit 121 determines whether or not a statistical instruction has been received. If the statistical instruction has been accepted, the process goes to step S312, and if not, the process returns to step S301. It should be noted that the reception of the statistics instruction here is reception of the statistics instruction from the user terminal 2 .
- Step S312 The statistical processing unit 135 acquires reply information corresponding to the statistical instruction.
- This answer information is a set of answer information for two days or more.
- Such answer information is, for example, a set of answer information paired with the user identifier of the statistical instruction.
- Step S313 The statistical processing unit 135 performs statistical processing on the answer information acquired in step S312, and acquires statistical processing results. An example of such statistical processing will be described with reference to the flowchart of FIG.
- Step S314 The score acquisition unit 132 acquires risk information using the statistical processing results acquired in step S313. An example of such risk acquisition processing will be described with reference to the flowchart of FIG.
- Step S315) The advice acquisition unit 134 acquires advice information using the statistical processing results acquired in step S313. An example of such advice acquisition processing will be described with reference to the flowchart of FIG.
- Step S316 The processing unit 13 configures information to be output using one or more of the statistical processing results, risk information, and advice information.
- Step S317) The statistics output unit 145 outputs the information configured in step S316. Return to step S301. Note that the output here is transmission to the user terminal 2, for example.
- the process ends when the power is turned off or an interrupt to end the process occurs.
- Step S401 The presentation information acquisition unit 131 acquires from the lower limit storage unit 111 a set of lower limit information corresponding to the output instruction.
- Step S402 The presentation information acquisition unit 131 acquires the template information of the answer input screen information from the storage unit 11.
- Step S403 The presentation information acquisition unit 131 substitutes 1 for the counter i.
- Step S404 The presentation information acquisition unit 131 determines whether or not the i-th food group identifier exists in the lower limit storage unit 111. If the i-th food group identifier exists, go to step S405; otherwise, return to the upper process.
- Step S405 The presentation information acquisition unit 131 substitutes the lower limit information paired with the i-th food group identifier into the variable of the lower limit information paired with the i-th food group identifier of the template information.
- Step S406 The presentation information acquisition unit 131 increments the counter i by 1. Return to step S404.
- step S307 an example of the risk information acquisition process in step S307 will be described using the flowchart of FIG.
- Step S501 The risk acquisition unit 133 substitutes 1 for the counter i.
- Step S502 The risk acquisition unit 133 determines whether or not the i-th risk condition exists in the risk storage unit 112. If the i-th risk condition exists, go to step S503, otherwise go to step S508.
- Step S503 The risk acquisition unit 133 acquires the i-th risk condition from the risk storage unit 112.
- the risk acquisition unit 133 acquires information of the user, which is information used in the i-th risk condition.
- the information of the user is, for example, one or more of the user's diversity score, one or more attribute values, one or more answer information, and statistical processing results.
- Step S505 The risk acquisition unit 133 determines whether the information acquired in step S504 satisfies the i-th risk condition. If the i-th risk condition is satisfied, go to step S506, otherwise go to step S507.
- Step S506 The risk acquisition unit 133 acquires from the risk storage unit 112 risk information paired with the i-th risk condition.
- Step S507 The risk acquisition unit 133 increments the counter i by 1. Return to step S502.
- Step S508 The risk acquisition unit 133 uses the risk information acquired in step S506 to configure risk-related information to be output. Return to upper process.
- Step S601 The advice acquisition unit 134 substitutes 1 for the counter i.
- Step S602 The advice acquisition unit 134 determines whether or not the i-th advice condition exists in the advice storage unit 113. If the i-th advice condition exists, go to step S603, otherwise go to step S608.
- Step S ⁇ b>603 The advice acquisition unit 134 acquires the i-th advice condition from the advice storage unit 113 .
- the advice acquisition unit 134 acquires information about the user, which is information used in the i-th advice condition.
- the information of the user is, for example, one or more of the user's diversity score, one or more attribute values, one or more answer information, and statistical processing results.
- Step S605 The advice acquisition unit 134 determines whether the information acquired in step S604 satisfies the i-th advice condition. If the i-th advice condition is satisfied, go to step S606, otherwise go to step S607.
- Step S606 The advice acquisition unit 134 acquires from the advice storage unit 113 the risk information paired with the i-th advice condition.
- Step S607 The advice acquisition unit 134 increments the counter i by 1. Return to step S602.
- Step S608 The advice acquisition unit 134 uses the advice information acquired in step S606 to configure information related to advice to be output. Return to upper process.
- step S313 an example of the result of statistical processing in step S313 will be explained using the flowchart of FIG.
- Step S701 The score acquisition unit 132 substitutes 1 for the counter i.
- Step S702 The score acquisition unit 132 determines whether or not there is a set of i-th answer information. If the i-th set of answer information exists, go to step S703, otherwise go to step S705.
- Step S703 The score acquisition unit 132 acquires a diversity score using the i-th set of answer information.
- Step S704 The score acquisition unit 132 increments the counter i by 1. Return to step S702.
- Step S705 The statistical processing unit 135 acquires the representative value of the diversity scores acquired in step S703.
- Step S706 The statistical processing unit 135 substitutes 1 for the counter j.
- Step S707 The statistical processing unit 135 determines whether or not the j-th food product group identifier exists. If the j-th food item group identifier exists, go to step S708, otherwise go to step S711.
- Step S708 The statistical processing unit 135 acquires two or more pieces of answer information paired with the j-th food product group identifier. Note that the two or more pieces of reply information are reply information on different days.
- Step S709 The statistical processing unit 135 performs statistical processing on the two or more pieces of answer information acquired in step S708, and acquires statistical processing results.
- the statistical processing unit 135 acquires, for example, the number of ⁇ or the ratio of ⁇ .
- ⁇ is the response information indicating that the intake was equal to or higher than the lower limit of intake.
- Step S710 The statistical processing unit 135 increments the counter i by 1. Return to step S707.
- Step S711 The statistical processing unit 135 configures information to be output using the representative value obtained in step S705 and the statistical processing result obtained in step S709. Return to upper process.
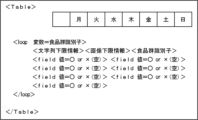
- the storage unit 11 of the dietary diversity determination device 1 now stores template information for the answer input screen information shown in FIG.
- This template information is information for constructing the answer input screen information.
- the template information ⁇ Table> ⁇ /Table>, indicates that the answer input screen information is information that constitutes an answer input screen in the form of a table. Further, the template information indicates that the first row of the table describes the days of the week from "month" to "day”.
- ⁇ loop variable food group identifier> ⁇ /loop> of the template information, the information in the loop tag is repeated by the number of food group identifiers (here, "10") to form a table record.
- the tag information within the loop tag indicates that the table record has character string lower limit information, image lower limit information, food group identifier, and seven fields.
- the character string lower limit information is lower limit information using character strings.
- the image lower limit information is lower limit information using an image.
- the lower limit information management table shown in FIG. 9 is stored in the lower limit storage unit 111 .
- the lower limit information management table is a table having lower limit information.
- the lower limit information management table stores two or more records having lower limit information for each user condition and each food group identifier. Here, since the food group identifier is "10", the lower limit information management table has 10 records.
- the user conditions in the lower limit information management table are two, "user condition 1" and "user condition 2". Also, let us say that "user condition 1" is, for example, " ⁇ race> Japanese & ⁇ whole meal size> normal”. It is also assumed that "user condition 1" is, for example, " ⁇ race> Japanese & ⁇ whole meal size> eats well".
- User condition 1 has only “character string lower limit information”
- “user condition 2” has “character string lower limit information” and “image lower limit information”.
- user condition 3 user condition 4, and lower limit information corresponding to other conditions may be managed in the lower limit information management table.
- the risk information management table shown in FIG. 10 is stored in the risk storage unit 112 .
- the risk information management table manages one or more records having "ID”, "risk information” and “risk condition”.
- ID is information for identifying a record.
- Risk information has “risk identifier” and “degree information”.
- a “risk identifier” is information that identifies a risk.
- Risk identifier is the name of the risk here.
- Level information is information indicating the degree of risk.
- level information is a value for normal risk level "1”.
- the degree information "0.68” indicates that the risk is reduced by “0.68" times.
- the “level information” may be information specifying an increase in risk.
- "Risk condition” is a condition corresponding to "risk information”.
- Random condition here, diversity score, statistical processing result of diversity score (e.g., representative value (e.g., average value, median value, minimum value, maximum value) for a predetermined period (e.g., one week), Condition using one or two or more types of answer information of one or two or more.
- risk condition is a condition using only the diversity score, but a specific one or Conditions using scores of two or more food groups may be used, or conditions using diversity scores and scores of one or more specific food groups may be used.
- the advice information management table shown in FIG. 11 is stored in the advice storage unit 113 .
- the advice information management table manages one or more records having "ID”, "advice condition” and “advice information”.
- ID is information for identifying a record.
- Advanced condition is a condition corresponding to "advice information”.
- the “advice condition” here is a condition using one or more of diversity score, statistical processing result of diversity score, and one or more answer information.
- the instruction receiving unit 121 of the dietary diversity determination device 1 receives the output instruction " ⁇ user identifier> U001 ⁇ race> Japanese ⁇ whole meal amount> eat well".
- the presentation information acquisition unit 131 determines that " ⁇ race> Japanese ⁇ whole meal size> eats well" in the output instruction matches "user condition 2" in the lower limit information management table of FIG. to decide. Then, the presentation information acquiring unit 131 acquires the character string lower limit information and the image lower limit information of the “user condition 2” included in the lower limit information management table of FIG. 9 in association with the food group identifier.
- the presentation information acquisition unit 131 acquires the template information (FIG. 8) of the answer input screen information from the storage unit 11.
- the presentation information acquisition unit 131 substitutes the acquired character string lower limit information, image lower limit information, and food group identifier for each of the 10 food group identifiers into the variables (tags) of the template information (FIG. 8). and constructs the answer input screen information for the user to enter the answer information.
- the presentation information output unit 141 transmits the acquired answer input screen information to the user terminal 2 that transmitted the output instruction.
- the user terminal 2 receives the answer input screen information and configures the answer input screen using the answer input screen information. Then, the user terminal 2 displays the answer input screen.
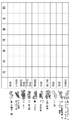
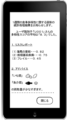
- An example of such an answer input screen is shown in FIG. In FIG. 12, the necessary lower limit of intake for each food group is specified by character strings and images. In the answer input screen, the required minimum amount of intake for each food group does not need to be placed next to the food group identifier. It would be nice if you could figure it out.
- the user uses the user terminal 2 to enter " ⁇ " in the Monday field corresponding to the food group ingested above the specified lower limit. , and Then, it is assumed that the user has instructed a "send” button (not shown) on the user terminal 2 .
- the user terminal 2 acquires response information indicating “o” or “empty” in association with each of the ten food group identifiers.
- Such a set of response information is " ⁇ grains> ⁇ ⁇ potatoes> ⁇ green and yellow vegetables> ⁇ ⁇ other vegetables> ⁇ ⁇ fruits> ⁇ ⁇ meat> ⁇ ⁇ seafood> ⁇ ⁇ eggs> ⁇ ⁇ beans> ⁇ ⁇ dairy products> ⁇ ”.
- the user terminal 2 pairs the response information set with “ ⁇ user identifier>U001” and transmits it to the dietary diversity determination device 1 .
- the answer receiving unit 122 of the dietary diversity determination device 1 sends from the user terminal 2 " ⁇ user identifier> U001 ⁇ grains> ⁇ ⁇ potatoes> ⁇ green and yellow vegetables> ⁇ ⁇ Other vegetables> ⁇ ⁇ Fruits> ⁇ ⁇ Meat> ⁇ ⁇ Seafood> ⁇ ⁇ Eggs> ⁇ ⁇ Beans> ⁇ ⁇ Dairy products> ⁇ " is received.
- the answer accepting unit 122 associates each of the 10 pieces of answer information with the user identifier and the food group identifier, and accumulates them in the storage unit 11 . It is preferable that the answer receiving unit 122 accumulates "1" corresponding to "o".
- the score acquisition unit 132 calculates the number of " ⁇ " (adds “1") to obtain a diversity score of "9". Then, it is assumed that the score acquisition unit 132 acquires the date "May 29" from a clock (not shown). The score acquisition unit 132 stores the diversity score “9” in the storage unit 11 in association with the date “May 29” and the answer information.
- the risk acquisition unit 133 acquires risk information as follows. That is, the risk acquisition unit 133 refers to the risk management table of FIG. 10, and the risk information " ⁇ risk identifier> cognitive function deterioration ⁇ degree information> 0.56 " ⁇ Risk identifier> Hippocampal atrophy ⁇ Severity information> 0.50" " ⁇ Risk identifier> Cardiovascular disease ⁇ Severity information> 0.75". Note that there is no response information corresponding to " ⁇ user identifier>U001" for seven days or more, which is the period for statistical processing here, so there is no statistical processing result.
- the advice acquisition unit 134 acquires advice information as follows.
- the advice acquisition unit 134 substitutes the variable ⁇ food group identifier with $ value of 0> with the food group identifier “potatoes” paired with the empty answer information, and reads “Please keep that up. It would be better if potatoes were ingested.
- the processing unit 13 configures information to be output using the acquired diversity score "9", risk information, and advice information. It should be noted that the configuration method of the information to be output does not matter.
- the output unit 14 then transmits the configured information to the user terminal 2 .
- the user terminal 2 receives and outputs information.
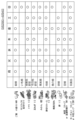
- An output example of such information is shown in FIG. In FIG. 13, diversity scores, risk information, and advice information for today's answers are output.
- the user identified by " ⁇ user identifier>U001" can determine whether or not he/she has taken the specified lower limit or more for each day of the week for each food group identifier. Assume that answer information is input, and a set of answer information (10 answer information) for each day of the seven days is associated with " ⁇ user identifier>U001" and stored in the storage unit 11. In addition, it is preferable for the user to input the answer information for each day after dinner on each day.
- the processing unit 13 of the dietary diversity determination device 1 detects that one week's worth of answer information that can be appropriately statistically processed has been accumulated, and the user identified by " ⁇ user identifier>U001" Statistical processing is performed on the answer information of
- the score acquisition unit 132 calculates the diversity score for each day of the week by the same processing as the above processing.
- the statistical processing unit 135 has obtained an average value of “7.7” of the seven obtained diversity scores.
- the statistical processing unit 135 acquires the score (the number of circles) of each food product group identifier using the seven response information paired with each food product group identifier, Identifier>U001” and stored.
- the statistical processing unit 135 reads " ⁇ user identifier> U001 ⁇ cereals> 7 ⁇ potatoes> 1 ⁇ green and yellow vegetables> 7 ⁇ other vegetables> 6 ⁇ fruits> 6 ⁇ meat> 6 ⁇ seafood> 4 ⁇ eggs Type> 5 ⁇ Beans> 5 ⁇ Dairy products> 7" are accumulated.
- the risk acquisition unit 133 acquires risk information as follows. That is, the risk acquisition unit 133 refers to the risk management table of FIG. > 7 ⁇ Potatoes> 1 ⁇ Green and yellow vegetables> 7 ⁇ Other vegetables> 6 ⁇ Fruits> 6 ⁇ Meat> 6 ⁇ Seafood> 4 ⁇ Eggs> 5 ⁇ Beans> 5 ⁇ Dairy products> 7 Detect conditions.
- the advice acquisition unit 134 substitutes the food group identifiers “potatoes” and “seafood” into the variable ⁇ $specific food group identifier>, and the advice information “the amount of intake of the advice information ““potatoes” and “seafood” is too little. ...”.
- the processing unit 13 configures information to be output using the statistical processing results, risk information, and advice information.
- the statistics output unit 145 then transmits the configured information to the user terminal 2 identified by " ⁇ user identifier>U001".
- FIG. 15 shows an output example of such statistical processing results.
- an input of answer information specifying whether or not an appropriate minimum intake amount or more is ingested is received, and diversity score is obtained using the answer information for each food group.
- the degree of dietary diversity can be obtained with high accuracy and easily.
- Diversity scores cannot be obtained, and users can easily obtain highly accurate dietary diversity scores by using the input answer information after knowing the appropriate lower limit of intake. .
- the present embodiment by adopting the lower limit information that matches the user condition based on the user attribute value, it is possible to easily acquire a highly accurate diversity score that matches the user.
- the present embodiment it is possible to notify the user of the risk corresponding to the diversity score. Moreover, according to the present embodiment, it is possible to notify the user of the risk corresponding to the diversity score and the degree of possibility of occurrence of the risk.
- the answer input screen displayed on the user terminal 2 is used by the user to enter the answer information.
- the object for which the user inputs the answer information may be a sheet made of paper.
- a sheet is a sheet having two or more pieces of presentation information in which a food group identifier for identifying a food group and lower limit information for the food group are associated with each other, and a field for receiving input of answer information for each of the two or more pieces of presentation information.
- a field here is an area on a sheet.
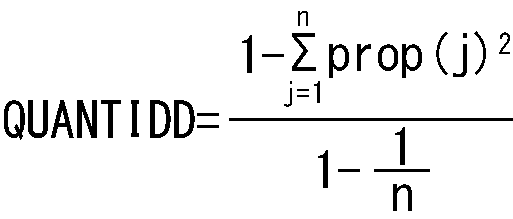
- prop(j) is the ratio of energy and various nutrients taken from food group j.
- n is the total number of food groups taken. The range of is a natural number from 1 to n.
- the food groups used to calculate "QUANTIDD” are, for example, 10 food groups “cereals, potatoes, beans, green and yellow vegetables, other vegetables (including mushrooms and algae ), fruits, eggs, seafood, meat, dairy products” or 17 food groups “cereals, potatoes, beans, seeds, green and yellow vegetables, other vegetables, mushrooms, algae, fruits, eggs, seafood meat, dairy products, sugar/sweeteners, confectionery, oils and fats, and seasonings”. Also, it is said that if the value of "QUANTIDD" is 0.9 or more, good dietary diversity is being maintained.
- the processing in this embodiment may be realized by software. Then, this software may be distributed by software download or the like. Also, this software may be recorded on a recording medium such as a CD-ROM and distributed. Note that this also applies to other embodiments in this specification.
- the software that realizes the dietary diversity determination device 1 in the present embodiment is the following program. That is, the program identifies the lower limit information and the food group corresponding to the lower limit information by a computer having access to the lower limit storage unit in which the lower limit information specifying the appropriate lower limit of intake for each of the two or more food groups is stored.
- a presentation information output unit for outputting two or more pieces of presentation information in a manner in which the food group identifiers are associated with each other; Acquire a diversity score, which is a score related to dietary diversity, using an answer reception unit that receives answer information specifying whether or not a person has ingested an amount equal to or greater than the specified amount, and the answer information received by the answer reception unit.
- FIG. 16 shows the appearance of a computer that executes the program described in this specification and realizes the dietary diversity determination device 1 and the like of the various embodiments described above.
- the embodiments described above may be implemented in computer hardware and computer programs running thereon.
- FIG. 16 is an overview diagram of this computer system 300
- FIG. 17 is a block diagram of the system 300. As shown in FIG.
- computer system 300 includes computer 301 including a CD-ROM drive, keyboard 302 , mouse 303 and monitor 304 .
- a computer 301 includes a CD-ROM drive 3012, an MPU 3013, a bus 3014 connected to the CD-ROM drive 3012, a ROM 3015 for storing programs such as a boot-up program, It includes a RAM 3016 connected and for temporarily storing application program instructions and providing temporary storage space, and a hard disk 3017 for storing application programs, system programs and data.
- computer 301 may also include a network card that provides connection to a LAN.
- a program that causes computer system 300 to execute the functions of dietary diversity determination apparatus 1 and the like of the above-described embodiment is stored in CD-ROM 3101, inserted into CD-ROM drive 3012, and transferred to hard disk 3017. Also good. Alternatively, the program may be transmitted to computer 301 via a network (not shown) and stored in hard disk 3017 . Programs are loaded into RAM 3016 during execution. The program may be loaded directly from CD-ROM 3101 or network.
- the program does not necessarily include an operating system (OS) or a third party program that causes the computer 301 to execute the functions of the dietary diversity determination device 1 of the above-described embodiment.
- a program need only contain those parts of instructions that call the appropriate functions (modules) in a controlled manner to produce the desired result. How the computer system 300 operates is well known and will not be described in detail.
- the step of transmitting information, the step of receiving information, etc. are performed by hardware. processing) are not included.
- the computer that executes the above program may be singular or plural. That is, centralized processing may be performed, or distributed processing may be performed.
- two or more communication means existing in one device may be physically realized in one medium.
- each process may be implemented by centralized processing by a single device, or may be implemented by distributed processing by a plurality of devices.
- An object of the present application is to provide a self-filled simple checklist (sheet) for dietary diversity in consideration of the lower limit of intake, and to provide a dietary diversity determination device 1 using the self-filled simple checklist.
- sheet for dietary diversity in consideration of the lower limit of intake
- a dietary diversity determination device 1 using the self-filled simple checklist.
- the subject's 10 food groups (cereals, potatoes, green and yellow vegetables, other vegetables (including seaweeds and mushrooms), fruits, meat, seafood, eggs , beans, dairy products), 12 food groups (cereals, potatoes, green and yellow vegetables, other vegetables (excluding seaweeds and mushrooms), seaweeds, mushrooms, fruits, meats, seafood, eggs, beans, dairy products), 15 food groups (cereals, potatoes, green and yellow vegetables, other vegetables (excluding seaweeds and mushrooms), seaweeds, mushrooms, fruits, meats, seafood, eggs, beans, dairy products), 15 food groups (cereals, potatoes, green and yellow vegetables, other vegetables (excluding seaweeds and mushrooms), seaweeds, mushrooms, fruits, meats, seafood, eggs, beans , dairy products, sugar/sweeteners, oils and fats, confectionery) were calculated. (4) Number of food groups considered to be ingested
- a lower limit was arbitrarily set for each food group, and the number of food groups taken per day was counted from the BDHQ data. (5) Correlation analysis between QUANTIDD and the number of food groups ingested (including the setting of the lower limit value considered to be ingested)
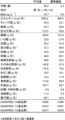
- FIG. 18 shows the subject's background.
- QUANTIDD was 0.884 ⁇ 0.086 (minimum 0.496-maximum 0.982), 0.874 ⁇ 0.087 (minimum 0.488-maximum 0.972) and 0 in 10, 12 and 15 food groups, respectively. 0.877 ⁇ 0.078 (minimum 0.519-maximum 0.967).
- Fig. 19(a) shows the correlation between the QUANTIDD calculated from the 10 food groups and the values calculated from the 12 food groups.
- Fig. 19(b) shows the correlation between the QUANTIDD calculated from the 10 food groups and the value calculated from the 15 food groups.
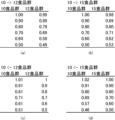
- Figure 20 shows the conversion of the QUANTIDD (range of 0.5-1) calculated from the 10 food groups using each regression formula and the values calculated from the 12 and 15 food groups.
- FIG. 20(a) is a conversion table of QUANTIDD to 10 food groups or 12 food groups.
- FIG. 20(b) is a conversion table of QUANTIDD to 10 or 15 food groups.
- FIG. 20(c) is a conversion table of QUANTIDD to 12 food groups or 10 food groups.
- FIG. 20(d) is a conversion table of QUANTIDD to 15 food groups or 10 food groups. As shown in FIG.
- the QUANTIDD calculated from the 10 food groups and the 12 and 15 food groups showed extremely high agreement in the QUANTIDD (0.5-1) within the range of realistically possible values. For this reason, it is preferable that the number of food groups used when the dietary diversity determination device 1 acquires a diversity score (here, QUANTIDD) is ten. This is because the user's burden should be small. However, as shown in FIG. 20, the number of food groups such as 12 and 15 food groups used by the dietary diversity determination device 1 may be 11 or more.
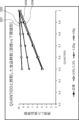
- the horizontal axis is QUANTIDD
- the vertical axis is the number of food groups ingested when it is considered that the corresponding food group is ingested if even 1 g per day is ingested.
- FIG. 22 is a graph showing different conditions for considering that the corresponding food group is taken. The horizontal axis is QUANTIDD, and the vertical axis is the food group taken.
- 2203 is a target graph (a graph showing the relationship between the number of food groups ingested and QUANTIDD).
- the horizontal axis is QUANTIDD
- the vertical axis is the number of food groups ingested when it is assumed that the corresponding food group is ingested if 10 g or more is ingested per day.
- the number of food groups ingested in the range of was 4.85 to 9.70 (see 2204 in FIGS. 21 and 22).
- the horizontal axis is QUANTIDD
- the vertical axis is the number of food groups ingested when the corresponding food group is considered to be ingested if 5% or 1.5% or more is ingested per day. is.
- the other 6 food groups (cereals, potatoes, beans, meat, seafood, and eggs) are 1.5% or more'' can be said to mean "1.5% or more of the median value of any one of the quartiles of the total intake weight of the 10 food groups".
- the lower limit when the optimum lower limit of each food group is represented by weight, the lower limit may be, for example, approximately 75 g for the above four food groups and approximately 23 g for the above six food groups. Also, the optimum lower limit for each food group may be, for example, approximately 36 g for the above four food groups and approximately 11 g for the above six food groups. D. Discussion (1) Validity of the QUANTIDD value in this experiment
- the QUANTIDD value calculated by BDHQ in this experiment is considered to be a reasonable value compared with existing reports.
- QUANTIDD was calculated using BDHQ for healthy Japanese aged 55-79 years, and the average value (minimum-maximum value) of 10, 12 and 15 food groups was 0.884 (0.496- 0.982), 0.874 (0.488-0.972) and 0.877 (0.519-0.967).
- Several cases of QUANTIDD in Japanese have been reported so far.
- FFQ food frequency survey
- QUANTIDD calculated from at least 10 food groups (cereals, potatoes, green and yellow vegetables, other vegetables, fruits, meats, seafood, eggs, beans, dairy products) converges within a certain range. It is suggested that Based on the above, when the number of food groups used for calculation is 10 or more, the effect on the QUANTIDD value is considered to be small. (3) Regarding the QUANTIDD value and the lower limit of the amount of intake considered “ingested” for each food group
- the correlation between QUANTIDD and the number of food groups ingested is good, and The aim was to find the lower limit of intake for each food group, which is the analysis result that 0.1 of QUANTIDD, which takes a value of 1, corresponds to about 1 of the number of food groups taken, which takes a value of 0 to 10-15.
- the lower limit of intake was 5% (4 food groups: green and yellow vegetables, other vegetables, fruits, dairy products), 1.5% (other 6 food groups).
- 5% of the total intake weight of the 10 food groups (4 food groups: green and yellow vegetables, other vegetables, fruits, dairy products) is about 75 g when the total intake of the representative 10 food groups is ingested.
- the lower limit for four food groups is preferably 75g ⁇ 10g, more preferably 75g.
- 1.5% of the total intake weight of the 10 food groups (the other 6 food groups) is approximately 23 g when the total intake of the representative 10 food groups is taken.
- the lower limit for 6 food groups is preferably 23g ⁇ 10g, more preferably 23g.
- the total intake of 10 representative food groups is, for example, the median of the highest quartile when the total intake of 10 food groups of all subjects is quartiled.
- the method of determining the total intake of the representative 10 food groups does not matter.
- the dietary diversity determination device 1 By having users use the dietary diversity determination device 1, it is expected that it will contribute to realization of dietary diversity in real life and health promotion.
- the dietary diversity determination device 1 has the effect of being able to obtain the degree of dietary diversity with high accuracy and easily, and is useful as a server or the like for determining dietary diversity.
Landscapes
- Business, Economics & Management (AREA)
- Tourism & Hospitality (AREA)
- Health & Medical Sciences (AREA)
- Economics (AREA)
- General Health & Medical Sciences (AREA)
- Human Resources & Organizations (AREA)
- Marketing (AREA)
- Primary Health Care (AREA)
- Strategic Management (AREA)
- Physics & Mathematics (AREA)
- General Business, Economics & Management (AREA)
- General Physics & Mathematics (AREA)
- Engineering & Computer Science (AREA)
- Theoretical Computer Science (AREA)
- Medical Treatment And Welfare Office Work (AREA)
Abstract
Description
本実施の形態において、N(Nは2以上)以上の各食品群に対して、摂取下限値を示す情報が格納されており、各食品群識別子に対応付けて、摂取下限量を特定する下限情報を出力し、かつ各食品群に対して、摂取下限量を超える量を摂取したか否かを特定する回答情報を受け付け、当該回答情報を用いて、食事の多様性スコアを取得し、出力する食事多様性判定装置を具備する判定システムについて説明する。
:1.5%」、「豆腐味噌汁:1杯」である。例えば、食品群識別子「魚介類」に対応する下限情報は、「刺身:1.5%」、「刺身:2切れ」である。例えば、食品群識別子「肉類」に対応する下限情報は、「薄切りロース:1.5%」、「薄切りロース:1/2」である。例えば、食品群識別子「卵類」に対応する下限情報は、「卵:1.5%」、「卵:1/2個」である。なお、割合(1.5%、5%等)は、食事摂取量全体の中の割合である。
(実験)
A.実験の背景・目的
B.実験方法
(1)実験の対象者
(2)解析項目
(3)食事多様性指標(QUANTIDD)の算出
(4)摂取したと見なす食品群数
(5)QUANTIDDと摂取した食品群数(摂取したと見なす下限値設定を含む)の相関解析
(6)統計解析
C.実験結果
(1)被験者背景
(2)10, 12および15食品群から算出されるQUANTIDDの関連
(3)10食品群から算出されるQUANTIDDと各下限値を用いた「摂取した」と見なす食品群数の関連
D.考察
(1)本実験におけるQUANTIDD値の妥当性
(2)算出に用いる食品群数の違いによるQUANTIDD値への影響
(3)QUANTIDD値と各食品群の「摂取した」と見なす摂取量の下限値について
(4)QUANTIDD値の推定に向けた各食品群の「摂取した」と見なす摂取量の下限値の設定
E.結論
Claims (12)
- 2以上の各食品群に対する適切な摂取下限量を特定する下限情報が格納される下限格納部と、
下限情報と当該下限情報に対応する食品群を識別する食品群識別子とが対応付く態様の2以上の提示情報を出力する提示情報出力部と、
前記2以上の各提示情報に対応する食品群を、前記2以上の各提示情報に対応する下限情報が特定する量以上を摂取したか否かを特定する回答情報を受け付ける回答受付部と、
前記回答受付部が受け付けた回答情報を用いて、食事の多様性に関するスコアである多様性スコアを取得するスコア取得部と、
前記スコア取得部が取得した前記多様性スコアを出力するスコア出力部とを具備する食事多様性判定装置。 - 前記スコア取得部は、
下限情報が特定する量以上を摂取した食品群の数に基づく多様性スコアを取得する、請求項1記載の食事多様性判定装置。 - 前記2以上の食品群は、10の食品群である、請求項2記載の食事多様性判定装置。
- 前記下限格納部には、
1以上のユーザ属性値を用いた2以上のユーザ条件に対応付けて、2以上の各食品群に対する下限情報が格納されており、
1以上のユーザ属性値が対応付く指示であり、2以上の提示情報を出力する指示である出力指示を受け付ける指示受付部と、
前記出力指示に対応付く1以上のユーザ属性値が満たすユーザ条件に対応する2以上の各食品群に対する下限情報を、前記下限格納部から取得し、当該下限情報に対応する食品群を識別する食品群識別子と当該下限情報とが対応付く態様の2以上の提示情報を取得する提示情報取得部とをさらに具備し、
前記提示情報出力部は、
前記提示情報取得部が取得した2以上の提示情報を出力する、請求項1記載の食事多様性判定装置。 - 前記1以上のユーザ属性値は、ユーザの人種を識別する人種識別子、ユーザの居住地を識別する居住地識別子、食文化を識別する食文化識別子、またはユーザの食事の全体量に関する全体量情報を含む、請求項4記載の食事多様性判定装置。
- 多様性スコアに対応付けて、人に与えるリスクに関するリスク情報が格納されるリスク格納部と、
前記スコア出力部が出力する多様性スコアに対応するリスク情報を前記リスク格納部から取得するリスク取得部と、
前記リスク取得部が取得した前記リスク情報を出力するリスク出力部とをさらに具備する請求項1記載の食事多様性判定装置。 - 前記リスク格納部には、
2以上のリスク情報が格納され、
多様性スコアに対応付けて、2以上のリスクのうちのいずれかのリスクに関するリスク情報とリスクが発生する可能性の程度を特定する程度情報との組が格納されており、
前記リスク取得部は、
前記スコア出力部が出力する多様性スコアに対応するリスク情報と程度情報とを前記リスク格納部から取得し、
前記リスク出力部は、
前記リスク取得部が取得した前記リスク情報と前記程度情報とを出力する、請求項6記載の食事多様性判定装置。 - 多様性スコアと1以上の回答情報とを用いたアドバイス条件に対応付けられたアドバイス情報が格納されるアドバイス格納部と、
前記スコア出力部が出力する多様性スコアと前記回答受付部が受け付けた1以上の回答情報に合致するアドバイス条件に対応するアドバイス情報を前記アドバイス格納部から取得するアドバイス取得部と、
前記アドバイス取得部が取得した前記アドバイス情報を出力するアドバイス出力部とをさらに具備する請求項1記載の食事多様性判定装置。 - 前記回答受付部は、
一のユーザから日が異なる2以上の回答情報の集合を受け付け、
前記2以上の回答情報の集合を統計処理し、統計処理結果を取得する統計処理部と、
前記統計処理部が取得した前記統計処理結果を出力する統計出力部とをさらに具備する請求項1記載の食事多様性判定装置。 - 食品群を識別する食品群識別子と当該食品群に対する下限情報とが対応付く態様の2以上の提示情報、および前記2以上の各提示情報に対する回答情報の入力を受け付けるフィールドを有するシート。
- 2以上の各食品群に対する適切な摂取下限量を特定する下限情報が格納される下限格納部と、提示情報出力部と、回答受付部と、スコア取得部と、スコア出力部とにより実現される食事多様性判定方法であって、
前記提示情報出力部が、下限情報と当該下限情報に対応する食品群を識別する食品群識別子とが対応付く態様の2以上の提示情報を出力する提示情報出力ステップと、
前記回答受付部が、前記2以上の各提示情報に対応する食品群を、前記2以上の各提示情報に対応する下限情報が特定する量以上を摂取したか否かを特定する回答情報を受け付ける回答受付ステップと、
前記スコア取得部が、前記回答受付ステップで受け付けられた回答情報を用いて、食事の多様性に関するスコアである多様性スコアを取得するスコア取得ステップと、
前記スコア出力部が、前記スコア取得ステップで取得された前記多様性スコアを出力するスコア出力ステップとを具備する食事多様性判定方法。 - 2以上の各食品群に対する適切な摂取下限量を特定する下限情報が格納される下限格納部にアクセス可能なコンピュータを、
下限情報と当該下限情報に対応する食品群を識別する食品群識別子とが対応付く態様の2以上の提示情報を出力する提示情報出力部と、
前記2以上の各提示情報に対応する食品群を、前記2以上の各提示情報に対応する下限情報が特定する量以上を摂取したか否かを特定する回答情報を受け付ける回答受付部と、
前記回答受付部が受け付けた回答情報を用いて、食事の多様性に関するスコアである多様性スコアを取得するスコア取得部と、
前記スコア取得部が取得した前記多様性スコアを出力するスコア出力部として機能させるためのプログラムを記録した記録媒体。
Priority Applications (2)
| Application Number | Priority Date | Filing Date | Title |
|---|---|---|---|
| CN202280055099.8A CN117795545A (zh) | 2021-08-17 | 2022-08-16 | 饮食多样性判定装置、图表、饮食多样性判定方法及存储介质 |
| JP2023542415A JPWO2023022158A1 (ja) | 2021-08-17 | 2022-08-16 |
Applications Claiming Priority (2)
| Application Number | Priority Date | Filing Date | Title |
|---|---|---|---|
| JP2021-132604 | 2021-08-17 | ||
| JP2021132604 | 2021-08-17 |
Publications (1)
| Publication Number | Publication Date |
|---|---|
| WO2023022158A1 true WO2023022158A1 (ja) | 2023-02-23 |
Family
ID=85240610
Family Applications (1)
| Application Number | Title | Priority Date | Filing Date |
|---|---|---|---|
| PCT/JP2022/030989 Ceased WO2023022158A1 (ja) | 2021-08-17 | 2022-08-16 | 食事多様性判定装置、シート、食事多様性判定方法、および記録媒体 |
Country Status (4)
| Country | Link |
|---|---|
| JP (1) | JPWO2023022158A1 (ja) |
| CN (1) | CN117795545A (ja) |
| TW (1) | TW202316362A (ja) |
| WO (1) | WO2023022158A1 (ja) |
Citations (4)
| Publication number | Priority date | Publication date | Assignee | Title |
|---|---|---|---|---|
| JPH09305570A (ja) * | 1996-05-10 | 1997-11-28 | Matsushita Electric Ind Co Ltd | 食生活支援装置及びそれを用いた冷蔵庫 |
| JP2006048177A (ja) * | 2004-07-30 | 2006-02-16 | Ajinomoto Co Inc | 食生活管理システム |
| JP2009175963A (ja) * | 2008-01-23 | 2009-08-06 | Yahoo Japan Corp | ダイエットを支援する装置、方法 |
| JP2011204194A (ja) * | 2010-03-26 | 2011-10-13 | Fancl Corp | サプリメント提供システム |
Family Cites Families (4)
| Publication number | Priority date | Publication date | Assignee | Title |
|---|---|---|---|---|
| JP2011221637A (ja) * | 2010-04-06 | 2011-11-04 | Sony Corp | 情報処理装置、情報出力方法及びプログラム |
| GB2529593A (en) * | 2013-07-01 | 2016-02-24 | Hitachi Ltd | Food operator assistance system |
| CN108717864A (zh) * | 2018-05-07 | 2018-10-30 | 河南金凤电子科技有限公司 | 一种食品营养成分监管方法、设备及系统 |
| CN111599477A (zh) * | 2020-07-10 | 2020-08-28 | 吾征智能技术(北京)有限公司 | 一种基于饮食习惯预测糖尿病的模型构建方法和系统 |
-
2022
- 2022-08-16 WO PCT/JP2022/030989 patent/WO2023022158A1/ja not_active Ceased
- 2022-08-16 CN CN202280055099.8A patent/CN117795545A/zh active Pending
- 2022-08-16 JP JP2023542415A patent/JPWO2023022158A1/ja active Pending
- 2022-08-17 TW TW111130960A patent/TW202316362A/zh unknown
Patent Citations (4)
| Publication number | Priority date | Publication date | Assignee | Title |
|---|---|---|---|---|
| JPH09305570A (ja) * | 1996-05-10 | 1997-11-28 | Matsushita Electric Ind Co Ltd | 食生活支援装置及びそれを用いた冷蔵庫 |
| JP2006048177A (ja) * | 2004-07-30 | 2006-02-16 | Ajinomoto Co Inc | 食生活管理システム |
| JP2009175963A (ja) * | 2008-01-23 | 2009-08-06 | Yahoo Japan Corp | ダイエットを支援する装置、方法 |
| JP2011204194A (ja) * | 2010-03-26 | 2011-10-13 | Fancl Corp | サプリメント提供システム |
Also Published As
| Publication number | Publication date |
|---|---|
| JPWO2023022158A1 (ja) | 2023-02-23 |
| TW202316362A (zh) | 2023-04-16 |
| CN117795545A (zh) | 2024-03-29 |
Similar Documents
| Publication | Publication Date | Title |
|---|---|---|
| Qian et al. | Association between plant-based dietary patterns and risk of type 2 diabetes: a systematic review and meta-analysis | |
| Chen et al. | Ultra-processed food consumption and risk of type 2 diabetes: three large prospective US cohort studies | |
| Wang et al. | Trends in consumption of ultraprocessed foods among US youths aged 2-19 years, 1999-2018 | |
| Tsukahara et al. | Association of eHealth literacy with lifestyle behaviors in university students: questionnaire-based cross-sectional study | |
| Nguyen et al. | Nutritional status, dietary intake, and health-related quality of life in outpatients with COPD | |
| Moeller et al. | Dietary patterns: challenges and opportunities in dietary patterns research: an Experimental Biology workshop, April 1, 2006 | |
| Picciano et al. | Dietary supplement use among infants, children, and adolescents in the United States, 1999-2002 | |
| Østbye et al. | Predictors of postpartum weight change among overweight and obese women: results from the Active Mothers Postpartum study | |
| Vollmer et al. | Investigating the relationship of body mass index, diet quality, and physical activity level between fathers and their preschool-aged children | |
| Hahn et al. | Introducing dietary self-monitoring to undergraduate women via a calorie counting app has no effect on mental health or health behaviors: results from a randomized controlled trial | |
| Collins et al. | Diet quality is associated with higher nutrient intake and self-rated health in mid-aged women | |
| Rotstein et al. | Diet quality and risk of multiple sclerosis in two cohorts of US women | |
| Hawks et al. | Narrative review of social media as a research tool for diet and weight loss | |
| Laroche et al. | Adult fat intake associated with the presence of children in households: findings from NHANES III | |
| Lazarou et al. | Dietary patterns analysis using data mining method. An application to data from the CYKIDS study | |
| Msaki et al. | Predictors of iron deficiency anaemia among children aged 6–59 months in Tanzania: evidence from the 2015–16 TDHS-MIS cross-sectional household survey | |
| E. O'Neil et al. | Association of candy consumption with body weight measures, other health risk factors for cardiovascular disease, and diet quality in US children and adolescents: NHANES 1999–2004 | |
| Talati et al. | Can front-of-pack labels influence portion size judgements for unhealthy foods? | |
| Simpson-Yap et al. | High Prudent diet factor score predicts lower relapse hazard in early multiple sclerosis | |
| George et al. | Alignment of dietary patterns with the dietary guidelines for Americans 2015–2020 and risk of all-cause and cause-specific mortality in the Women’s Health Initiative Observational Study | |
| Hang et al. | Ultra-processed food consumption and mortality among patients with stages I–III colorectal cancer: a prospective cohort study | |
| Wang et al. | The effect of dietary awareness on household food waste | |
| Hajhashemy et al. | The relation of dietary protein intake before and during the pregnancy with gestational diabetes mellitus (GDM): A GRADE-assessed systematic review and dose–response meta-analysis of epidemiologic studies | |
| US20250046423A1 (en) | Systems and methods for providing individualized nutritional recommendations for intermittent fasting | |
| Asensio-Cuesta et al. | How the Wakamola chatbot studied a university community’s lifestyle during the COVID-19 confinement |
Legal Events
| Date | Code | Title | Description |
|---|---|---|---|
| 121 | Ep: the epo has been informed by wipo that ep was designated in this application |
Ref document number: 22858476 Country of ref document: EP Kind code of ref document: A1 |
|
| WWE | Wipo information: entry into national phase |
Ref document number: 202280055099.8 Country of ref document: CN |
|
| WWE | Wipo information: entry into national phase |
Ref document number: 2023542415 Country of ref document: JP |
|
| WWE | Wipo information: entry into national phase |
Ref document number: 2401000995 Country of ref document: TH |
|
| NENP | Non-entry into the national phase |
Ref country code: DE |
|
| WWE | Wipo information: entry into national phase |
Ref document number: 11202400852U Country of ref document: SG |
|
| 122 | Ep: pct application non-entry in european phase |
Ref document number: 22858476 Country of ref document: EP Kind code of ref document: A1 |