WO2022259334A1 - Dna検出方法およびdna検出システム - Google Patents
Dna検出方法およびdna検出システム Download PDFInfo
- Publication number
- WO2022259334A1 WO2022259334A1 PCT/JP2021/021633 JP2021021633W WO2022259334A1 WO 2022259334 A1 WO2022259334 A1 WO 2022259334A1 JP 2021021633 W JP2021021633 W JP 2021021633W WO 2022259334 A1 WO2022259334 A1 WO 2022259334A1
- Authority
- WO
- WIPO (PCT)
- Prior art keywords
- dna
- micro
- microcompartments
- melting temperature
- temperature
- Prior art date
- Legal status (The legal status is an assumption and is not a legal conclusion. Google has not performed a legal analysis and makes no representation as to the accuracy of the status listed.)
- Ceased
Links
Images


Classifications
-
- C—CHEMISTRY; METALLURGY
- C12—BIOCHEMISTRY; BEER; SPIRITS; WINE; VINEGAR; MICROBIOLOGY; ENZYMOLOGY; MUTATION OR GENETIC ENGINEERING
- C12Q—MEASURING OR TESTING PROCESSES INVOLVING ENZYMES, NUCLEIC ACIDS OR MICROORGANISMS; COMPOSITIONS OR TEST PAPERS THEREFOR; PROCESSES OF PREPARING SUCH COMPOSITIONS; CONDITION-RESPONSIVE CONTROL IN MICROBIOLOGICAL OR ENZYMOLOGICAL PROCESSES
- C12Q1/00—Measuring or testing processes involving enzymes, nucleic acids or microorganisms; Compositions therefor; Processes of preparing such compositions
- C12Q1/68—Measuring or testing processes involving enzymes, nucleic acids or microorganisms; Compositions therefor; Processes of preparing such compositions involving nucleic acids
- C12Q1/6844—Nucleic acid amplification reactions
- C12Q1/6848—Nucleic acid amplification reactions characterised by the means for preventing contamination or increasing the specificity or sensitivity of an amplification reaction
-
- C—CHEMISTRY; METALLURGY
- C12—BIOCHEMISTRY; BEER; SPIRITS; WINE; VINEGAR; MICROBIOLOGY; ENZYMOLOGY; MUTATION OR GENETIC ENGINEERING
- C12Q—MEASURING OR TESTING PROCESSES INVOLVING ENZYMES, NUCLEIC ACIDS OR MICROORGANISMS; COMPOSITIONS OR TEST PAPERS THEREFOR; PROCESSES OF PREPARING SUCH COMPOSITIONS; CONDITION-RESPONSIVE CONTROL IN MICROBIOLOGICAL OR ENZYMOLOGICAL PROCESSES
- C12Q1/00—Measuring or testing processes involving enzymes, nucleic acids or microorganisms; Compositions therefor; Processes of preparing such compositions
- C12Q1/68—Measuring or testing processes involving enzymes, nucleic acids or microorganisms; Compositions therefor; Processes of preparing such compositions involving nucleic acids
- C12Q1/6844—Nucleic acid amplification reactions
- C12Q1/686—Polymerase chain reaction [PCR]
-
- G—PHYSICS
- G01—MEASURING; TESTING
- G01N—INVESTIGATING OR ANALYSING MATERIALS BY DETERMINING THEIR CHEMICAL OR PHYSICAL PROPERTIES
- G01N21/00—Investigating or analysing materials by the use of optical means, i.e. using sub-millimetre waves, infrared, visible or ultraviolet light
- G01N21/62—Systems in which the material investigated is excited whereby it emits light or causes a change in wavelength of the incident light
- G01N21/63—Systems in which the material investigated is excited whereby it emits light or causes a change in wavelength of the incident light optically excited
- G01N21/64—Fluorescence; Phosphorescence
- G01N21/6428—Measuring fluorescence of fluorescent products of reactions or of fluorochrome labelled reactive substances, e.g. measuring quenching effects, using measuring "optrodes"
-
- G—PHYSICS
- G01—MEASURING; TESTING
- G01N—INVESTIGATING OR ANALYSING MATERIALS BY DETERMINING THEIR CHEMICAL OR PHYSICAL PROPERTIES
- G01N33/00—Investigating or analysing materials by specific methods not covered by groups G01N1/00 - G01N31/00
- G01N33/48—Biological material, e.g. blood, urine; Haemocytometers
- G01N33/50—Chemical analysis of biological material, e.g. blood, urine; Testing involving biospecific ligand binding methods; Immunological testing
- G01N33/58—Chemical analysis of biological material, e.g. blood, urine; Testing involving biospecific ligand binding methods; Immunological testing involving labelled substances
- G01N33/582—Chemical analysis of biological material, e.g. blood, urine; Testing involving biospecific ligand binding methods; Immunological testing involving labelled substances with fluorescent label
-
- G—PHYSICS
- G01—MEASURING; TESTING
- G01N—INVESTIGATING OR ANALYSING MATERIALS BY DETERMINING THEIR CHEMICAL OR PHYSICAL PROPERTIES
- G01N21/00—Investigating or analysing materials by the use of optical means, i.e. using sub-millimetre waves, infrared, visible or ultraviolet light
- G01N21/62—Systems in which the material investigated is excited whereby it emits light or causes a change in wavelength of the incident light
- G01N21/63—Systems in which the material investigated is excited whereby it emits light or causes a change in wavelength of the incident light optically excited
- G01N21/64—Fluorescence; Phosphorescence
- G01N21/6428—Measuring fluorescence of fluorescent products of reactions or of fluorochrome labelled reactive substances, e.g. measuring quenching effects, using measuring "optrodes"
- G01N2021/6439—Measuring fluorescence of fluorescent products of reactions or of fluorochrome labelled reactive substances, e.g. measuring quenching effects, using measuring "optrodes" with indicators, stains, dyes, tags, labels, marks
Definitions
- the present invention relates to DNA detection methods and DNA detection systems, particularly to digital PCR.
- Non-Patent Document 1 Conventional genetic testing includes techniques such as PCR (Patent Documents 2-4) and real-time PCR (Non-Patent Document 1). In these techniques, the reproducibility of measurement decreases when the amount of the gene to be detected (herein referred to as "target gene") is very small.
- Patent Document 1 Digital PCR (Patent Document 1) was developed as a method to solve this problem.
- a very small amount of DNA can be quantified by determining whether DNA is 0 (absent) or 1 (presence) using a limitedly diluted sample and detecting it.
- a method for quantifying DNA in a sample using digital PCR is shown below.
- the target gene in each microfraction is amplified by PCR.
- the fluorescence intensity of each microcompartment is measured after the PCR is finished and the number of microcompartments with fluorescence intensity above the threshold is counted. From the obtained values, the amount of the target gene contained in the sample can be calculated.
- reaction efficiency decreased due to reasons such as the presence of reaction inhibitors in the reaction solution, the formation of secondary structures in the template DNA, and poor primer design.
- the present inventors measured the melting temperature (Tm) of the PCR amplification product by melting curve analysis to determine the PCR reaction efficiency between each microfraction.
- Tm melting temperature
- the Tm value will be an erroneous value. I had a problem with the calculation.
- digital PCR using melting curve analysis the sample is divided into micro-fractions, and after amplification of the target gene in the micro-fractions in the micro-fractions arranged on a plane, fluorescence images of the micro-fractions are captured while changing the temperature. Then, the melting temperature of the gene in the minute fraction is calculated from the change in fluorescence intensity for each minute fraction. At this time, bubbles are likely to be generated when the temperature becomes high during fluorescence image acquisition.
- the through-holes provided in the substrate are used as micro-partitions, and the PCR reaction solution added to the through-holes is blocked with oil or the like to cause a reaction, or when the droplets in the oil are placed on a plane in the flow channel
- bubbles may be generated in the oil.
- the movement of generated bubbles during fluorescence image acquisition causes fluctuations in the fluorescence intensity of each minute compartment, resulting in noise in the melting curve.
- a numerical value different from the melting temperature of the gene in the microcompartment may be calculated, and the quantification of the target gene may not be performed correctly.
- an object of the present invention is to provide a novel DNA detection method and DNA detection, in which, in digital PCR using melting curve analysis, a minute compartment located in the vicinity of generated bubbles is detected by a measurement device and target genes are accurately counted. It is to provide a system.
- the present inventors In digital PCR using melting curve analysis, the present inventors analyzed microcompartments for which a melting temperature different from the genotype contained in the added specimen was calculated. It was clarified that the reason for this was the presence of air bubbles. Therefore, the present inventors have found that erroneous determination of genotypes can be reduced by removing microsections located near bubbles from the analysis data, and have completed the present invention.
- One embodiment of the present invention includes a first step of dividing a specimen solution containing a fluorescently labeled probe or DNA intercalator and multiple types of DNA to be detected into a plurality of microfractions, and the microfractions. a second step of performing a nucleic acid amplification reaction in a microcompartment; and a third step of measuring the fluorescence intensity from the fluorescent-labeled probe or the DNA intercalator with temperature change in each of the microcompartments; a fourth step of calculating the melting temperature of the DNA to be detected from each of the measured fluorescence intensities; a fifth step of identifying the microcompartments affected by the bubbles; and a sixth step of removing data of said microcompartments affected by said bubbles from the total data obtained.
- the micro-compartments affected by the bubbles are micro-compartments in which the number of peaks of the differential curve of the melting curve created from the fluorescence intensities measured in the third step is equal to or greater than a predetermined value. may be specified. Further, in the fifth step, when two or more of the adjacent micro-compartments are identified as the micro-compartments affected by the bubble, in the sixth step, the two or more of the adjacent micro-compartments data is removed, and in the fifth step, when the single micro-compartment is identified as the micro-compartment affected by the bubble, in the sixth step, the single micro-compartment No data need be removed.
- the micro-compartments affected by the bubbles may be identified by analysis of images of the micro-compartments. Further, in the fifth step, a microcompartment is selected in which the number of peaks of the differential curve of the melting curve created from each fluorescence intensity measured in the third step is equal to or greater than a predetermined value, and the selected microcompartment The microcompartments affected by the air bubble may be identified by analyzing the image to determine whether they are affected by the air bubble.
- the fifth step among two or more adjacent micro-sections, a micro-section having a number of peaks of the differential curve equal to or greater than a predetermined value is selected, and in the fifth step, in the single micro-section, Microsections whose differential curve has a number of peaks greater than or equal to a predetermined value may not be selected.
- the DNA solution may be limitedly diluted.
- the types of the plurality of DNAs to be detected are determined based on the melting temperature in each of the microcompartments, and in the fifth step, each type of the DNA whose types have been determined is further subjected to The microcompartment may be identified based on information representing a reference melting temperature of the .
- the microcompartments may consist of wells arranged in an array or droplets dispersed in oil.
- the melting temperature may be calculated as the inflection point of the melting curve created from each fluorescence intensity measured in the third step.
- Another embodiment of the present invention provides a first device having a plurality of microcompartments for containing DNA solutions containing fluorescently labeled probes or DNA intercalators, and a second device for capturing images of the first device.
- a third device for adjusting the temperature of the microcompartments to perform a nucleic acid amplification reaction in the microcompartments; and a fluorescence intensity that varies with temperature changes in the microcompartments.
- a fourth device for controlling the imaging device that causes the imaging device to capture an image; and a fifth device for detecting the generation of bubbles from the acquired fluorescence intensity of the micro-section;
- a DNA detection system comprising:
- FIG. 2 is a schematic diagram showing a method of measuring the melting temperature of DNA using a fluorescence-labeled probe in the DNA detection method according to one embodiment of the present invention.
- FIG. 2 is a schematic diagram showing the relationship between droplets and air bubbles when depressions for capturing droplets of a PCR reaction solution are used as minute compartments in the DNA detection method according to one embodiment of the present invention.
- 1 is a schematic diagram showing the relationship between wells and bubbles when wells are used as microcompartments in the DNA detection method according to one embodiment of the present invention.
- FIG. 4 is a diagram showing data on the fluorescence intensity of a fluorescent dye contained in a well with temperature change and data on the melting temperature obtained from the fluorescence intensity change of each well with temperature change in one embodiment of the present invention.
- FIG. 2 is a diagram showing measurement results by a DNA detection method according to one embodiment of the present invention;
- FIG. 2 is a schematic diagram of a fluorescence measurement unit in one embodiment of the present invention;
- 1 is a schematic diagram of a digital PCR system in one embodiment of the present invention.
- FIG. FIG. 4 shows a database used in the DNA detection method in one embodiment of the present invention.
- Figure 8 is a flow chart illustrating one embodiment of a method for making melting temperature measurements using the apparatus of Figures 6 and 7;
- FIG. 4 is a diagram showing measurement results displayed on a monitor in one embodiment of the present invention;
- FIG. 4 is a diagram showing measurement results displayed on a monitor in one embodiment of the present invention; It is a figure which shows the measurement result obtained in the Example of
- DNA detection method divides a DNA solution containing fluorescently labeled probes or DNA intercalators and multiple types of DNA to be detected into multiple microfractions. a second step of performing a nucleic acid amplification reaction in a microcompartment containing a microfraction; a third step of measuring the fluorescence intensity, a fourth step of calculating the melting temperature of the DNA to be detected from each measured fluorescence intensity, and a fifth step of identifying the microcompartment affected by the air bubble; and a sixth step of removing data of microcompartments affected by air bubbles from the total data obtained in the plurality of microcompartments.
- This DNA detection method will be specifically described below with reference to the schematic diagrams of FIGS.
- a sample solution containing a fluorescence-labeled probe or DNA intercalator and multiple types of DNAs to be detected is divided into a plurality of minute fractions.
- a sample solution containing DNA derived from a biological sample is prepared.
- the sample solution may contain multiple types of target genes.
- This sample solution is added to the PCR reaction solution.
- a PCR reaction solution includes a DNA polymerase, primers, a DNA intercalator or fluorescently labeled probe, deoxyribonucleotides, and a buffer.
- the sample solution contains the fluorescently labeled probe or DNA intercalator.
- the fluorescence-labeled probe it is preferable to use a molecular beacon designed to have a structure capable of hybridizing to the gene of interest.
- the specimen solution is micro-fractionated into micro-compartments.
- microfractionating it is preferable to limit the sample solution and fractionate such that each microcompartment contains 0 or 1 molecule of DNA.
- the biological sample to be used is not particularly limited, but any sample containing DNA to be detected may be used, such as an individual sample (body fluids, tissues, cells, excreta, etc. of animals and plants) or a soil sample (including fungi, bacteria, etc.).
- bodily fluids include blood, saliva, and cerebrospinal fluid.
- Blood contains cell-free DNA (cfDNA) and circulating tumor DNA (ctDNA).
- tissue include a disease-affected area obtained by surgical operation or biopsy (for example, cancer tissue such as breast or liver).
- the tissue may be already fixed tissue, such as formalin-fixed paraffin-embedded tissue sections (FFPE).
- FFPE formalin-fixed paraffin-embedded tissue sections
- cells include cells collected by biopsy (affected area or its vicinity), blood-circulating tumor cells circulating in the blood, and the like.
- the pretreatment of these specimens is not particularly limited, and after collection from the living body or the environment, it may be added to a suspension and homogenized, or dissolved in a dissolution solution and used as it is. It is preferable to extract or purify the contained nucleic acid.
- a nucleic acid amplification reaction is performed in each microcompartment containing microfractions.
- the nucleic acid amplification reaction is preferably so-called PCR, especially digital PCR.
- the fluorescence intensity from the fluorescent-labeled probe or DNA intercalator is measured in each of the microcompartments as the temperature changes.
- This temperature change may be achieved by utilizing the temperature change during the nucleic acid amplification reaction, or by raising the temperature of the specimen solution independently of the nucleic acid amplification reaction (for example, after completion of the nucleic acid amplification reaction).
- the fluorescently labeled probe or DNA intercalator used in this step may be used in common with the fluorescently labeled probe or DNA intercalator for PCR. You can use things.
- FIG. 1 is a schematic diagram showing the behavior of fluorescent-labeled probes when the temperature of the reaction solution is changed.
- Molecular beacons and Taqman probes can be exemplified as fluorescence-labeled probes, and FIG. 1 will be described here using molecular beacons as an example.
- Molecular beacons are constructed as oligonucleotides and have sequences complementary to sequences between primer pairs used in nucleic acid amplification reactions to amplify a gene of interest.
- the molecular beacon has sequences complementary to each other at both ends, with a fluorescent dye 103 at one end and a quencher 104 at the other end.
- the molecular beacon 102 In the nucleic acid amplification reaction, in the initial state, the molecular beacon 102 exists alone and free as shown in FIG. 1B. At that time, the molecular beacon 102 forms a stem-loop and the fluorescent dye 103 and the quencher 104 are close to each other, so fluorescence is not emitted.
- the first denaturation step when the sample solution is heated, it assumes a structure with a high degree of freedom as shown in FIG. 1C.
- the annealing step when the temperature is lowered to about room temperature, the loop portion of the molecular beacon 102 is annealed to the DNA 101 amplified in the specimen solution as shown in FIG. 1A.
- the fluorescent dye 103 and the quencher 104 are always separated from each other, so that the fluorescent-labeled probe 102 emits strong fluorescence.
- the molecular beacon 102 is released, again as in FIG. 1B, and the fluorescence is quenched.
- the fluorescence remains quenched. Since this process is repeated in nucleic acid amplification reactions, fluorescence intensity may be measured at some stage during heating or cooling. When measuring the fluorescence intensity after completion of the nucleic acid amplification reaction, it can be measured in the same manner.
- fluorescence intensity may be measured at some stage during heating or cooling. After completion of the nucleic acid amplification reaction, the fluorescence intensity may be measured after heating or cooling just for the purpose of measuring the fluorescence intensity.
- the combination of the fluorescent dye 103 and the quencher 104 is not particularly limited as long as it is a combination commonly used in real-time PCR.
- examples of the fluorescent dye 103 include FAM, VIC, ROX, Cy3, Cy5, etc.
- examples of the quencher 104 include TAMRA, BHQ1, BHQ2, BHQ3, and the like.
- the sequence of the molecular beacon 102 is prepared specific to each of the target genes, and by binding different fluorescent dyes, one sequence can be obtained. Two types of target genes can be detected in the reaction system.
- the DNA intercalator is not particularly limited as long as it increases fluorescence intensity by binding to double-stranded DNA and can be used for detecting double-stranded DNA.
- SYBR registered trademark
- Green I SYBR Gold
- PicoGreen registered trademark
- SYTO registered trademark
- SYTO registered trademark
- SYTO Red POPO (registered trademark)-1, BOBO (registered trademark) )-1, YOYO (registered trademark)-1, TOTO (registered trademark)-1, JOJO (registered trademark)-1, POPO-3, LOLO (registered trademark)-1, BOBO-3, YOYO-3, TOTO- 3, PO-Pro (registered trademark)-1, YO-Pro (registered trademark)-1, TO-Pro (registered trademark)-1, JO-Pro (registered trademark)-1, PO-Pro-3, YO- Pro-3, TO-Pro-3, TO-Pro-5, ethidium bromine
- the melting temperature of the DNA to be detected is calculated from each measured fluorescence intensity.
- the method of calculating the melting temperature is not particularly limited, and the function of fluorescence intensity and temperature may be obtained, the derivative of the function may be obtained, and the temperature at which the maximum value is obtained may be calculated and used as the melting temperature.
- plot the function of fluorescence intensity and temperature on a graph to create a melting curve i.e., a curve representing changes in fluorescence intensity with respect to temperature changes). may be used as the melting temperature.
- An example of a melting curve is shown in FIG. 4A, and a differential curve obtained from this melting curve is shown in FIG. 4B.
- the temperature corresponding to the inflection point of the melting curve corresponds to the peak of the differential curve and is calculated as the melting temperature 401 of the DNA double strand.
- the melting temperature of the fluorescent-labeled probe for detecting the target gene can be adjusted based on known techniques when designing the fluorescent-labeled probe. For example, it can be adjusted by changing the sequence or chain length of the probe. Alternatively, it can be regulated by using artificial DNA such as Peptide Nucleic Acid (PNA) or Locked Nucleic Acid (LNA).
- PNA Peptide Nucleic Acid
- LNA Locked Nucleic Acid
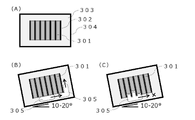
- Figures 2 and 3 show the behavior of bubbles generated near microcompartments in digital PCR using melting curve analysis.
- the cartridge 204 illustrated in FIG. 2 has depressions for capturing droplets of the PCR reaction solution as microcompartments.
- the inside of the cartridge 204 is filled with oil 203 , and the droplets 201 are captured in droplet capturing recesses 202 provided inside the cartridge 204 .
- digital PCR using melting curve analysis a fluorescent image of the droplet is acquired while changing the temperature, and the melting curve analysis is performed for each droplet.
- air bubbles 205 may be generated in the cartridge 204, and the frequency of the air bubbles is high especially when the temperature is high. Since the presence of air bubbles 205 under the droplet 201 causes noise in fluorescence intensity measurement, it is necessary to tilt the cartridge 204 as shown in FIG. However, when the droplets 201 are not evenly captured in the droplet capturing recesses 202 as shown in FIG. , the fluorescence intensity of the droplet 201 near the bubble may not be measured accurately.
- the cartridge 304 exemplified in FIG. 3 has wells for containing PCR reaction solutions as microcompartments. As shown in FIG. 3A, the inside of cartridge 304 is filled with oil 303, and PCR reaction solution 301 is added to wells of through-hole chip 302 provided inside cartridge 304. FIG. Air bubbles 305 may be generated in the cartridge 304 when wells are used, as with droplets. Bubbles 305 are likely to occur especially at high temperatures. Since air bubbles 305 under the through-hole chip 302 cause noise in fluorescence intensity measurement, it is necessary to incline the cartridge 304 to release air bubbles from under the through-hole chip 302 as shown in FIG. 3B. However, when the PCR reaction solution is not evenly added to the through-hole chip 302 as shown in FIG. Fluorescence intensity of neighboring wells may not be measured accurately.
- Fig. 4 shows an example of the melting curve of microcompartments when bubbles are not generated and when bubbles are generated.
- the change in fluorescence intensity of the minute compartment with temperature change is measured, resulting in a smooth melting curve as shown in FIG. , the peak temperature is the melting temperature (Tm) 401 .
- Tm melting temperature
- the fluorescence intensity fluctuates with the movement of the air bubbles as shown in FIG. 4C. Therefore, when a differential curve is obtained, it may have multiple peaks as shown in FIG. 4D, and the melting temperature of the target gene in the microcompartment may not be identified or may be incorrect.
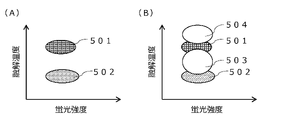
- Fig. 5 shows an example of the melting curve analysis results of microcompartments when bubbles are not generated and when bubbles are generated.
- the melting temperature 501 corresponding to the fluorescently labeled probe of the wild-type allele in the microsection containing the gene of interest with the wild-type allele is the melting temperature 501 of the mutant allele in the microsection containing the gene of interest with the mutant allele.
- a melting temperature 502 corresponding to the fluorescently labeled probe is detected.
- the microcompartment containing the target gene with the wild-type allele may erroneously exhibit melting temperatures 503 and 504 that differ from the melting temperature of the wild-type allele, as shown in FIG. 5B. .
- the microcompartment containing the gene of interest having the mutant allele erroneously exhibits a melting temperature different from that of the mutant allele, and the microcompartment containing the gene of interest having the mutant allele is treated as the wild-type allele. It may also be identified as a microcompartment that contains the gene of interest that it has.
- the minute compartment showing a melting temperature 503 different from the melting temperature of the wild-type allele can be removed from the analysis data. This reduces erroneous determination of genes in the partition and enables more accurate gene detection.
- the DNA detection system disclosed herein aims to detect a gene of interest in a DNA solution, and includes a plurality of microscopic particles for containing a DNA solution containing fluorescently labeled probes or DNA intercalators.
- a first device having a compartment, a second device for capturing an image of the first device, and a third device for adjusting the temperature of the microcompartment to perform a nucleic acid amplification reaction in the microcompartment. and a fourth device for controlling the imaging device to capture an image in order to acquire the fluorescence intensity that changes with temperature change in the microcompartment, and the acquired fluorescence intensity of the microcompartment.
- a fifth device for detecting the generation of air bubbles.
- This DNA detection system includes, in addition to each of the devices described above, a sixth device for measuring the intensity of fluorescence emitted from the DNA solution, and a melting curve representing changes in the intensity of fluorescence with temperature changes in the DNA solution.
- a computer that calculates the melting temperature of the DNA double strand based on the above, and a monitor that displays information transmitted from the computer may be provided.
- These devices may physically be in a single device, or each may exist as a single device, and some devices may be combined into a single device, while other devices may be combined to form a single device. may exist independently.
- the DNA solution may be held by any carrier, for example, as shown in FIG. , may be housed in a well of a plate, cartridge, or the like.
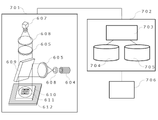
- FIGS. 6 and 7 show a DNA detection system having a fluorescence measurement section.
- FIG. 6 is a schematic diagram of a fluorescence measurement unit for measuring the intensity of fluorescence emitted from a DNA solution
- FIG. 7 is a schematic diagram of a digital PCR system.
- the fluorescence measurement unit in FIG. 6 measures the color and fluorescence intensity of the fluorochrome contained in the droplets or wells that have undergone limiting dilution.
- the digital PCR system in FIG. 7 includes a fluorescence measurement unit illustrated in FIG. 6, a computer that calculates the melting temperature of DNA double strands and analyzes measurement data, and a monitor that displays the results.
- the fluorescence measurement unit shown in FIG. 6A includes a light source 604, a fluorescence filter 605, and a detection unit such as a photomultiplier meter and a camera 607.
- the fluorescence measurement unit may be provided with a plurality of light sources and/or a plurality of detection units for each color of the fluorescent dye. Upon excitation, one detection unit may simultaneously detect a plurality of fluorescences with different wavelengths through a plurality of fluorescence filters 605 .
- a plurality of droplets 611 are arrayed in a droplet detection cartridge 610 as shown in FIG. 2 and set on a temperature control stage 612 that is a temperature control unit.
- a temperature control stage 612 changes the temperature of each compartment in order to carry out nucleic acid amplification reaction in each compartment.
- a temperature control stage 612 changes the temperature of the cartridge for droplet detection, and measures the change in fluorescence intensity of the droplet accompanying the temperature change.
- the droplet 601 containing the target gene and the droplet 602 not containing the target gene change in fluorescence intensity differently.
- each droplet 611 is irradiated with excitation light from a light source 604 through a lens 608 , a fluorescence filter 605 and a dichroic mirror 609 .
- a fluorescent substance contained in each droplet 611 is excited by the excitation light, and emitted fluorescence is detected by a CCD camera 607 through a dichroic mirror 609 , fluorescence filter 605 and lens 608 .
- the CCD camera 607 is an example of an imaging device.
- a well-type detection cartridge 613 as shown in FIG. 3 may be used.
- a reaction solution containing a specimen is added to wells provided in the well-type detection cartridge 613 .
- PCR is performed in the well and set on the temperature control stage 612 which is a temperature control unit.
- the temperature of the cartridge 613 is changed by the temperature control stage 612, and the fluorescence intensity change of the wells is measured as the temperature changes.
- the fluorescence intensity changes differently between the well 614 containing the target gene and the well 615 not containing the target gene.
- the measurement procedure is as follows. First, each well is irradiated with excitation light from a light source 604 through a lens 608 , a fluorescence filter 605 and a dichroic mirror 609 . Fluorescent substances contained in the reaction solution in the wells are excited by the excitation light, and emitted fluorescence is detected by the CCD camera 607 through the dichroic mirror 609 , fluorescence filter 605 and lens 608 .
- PCR to melting curve analysis can be performed within cartridge 613 without the step of arranging the droplets in a cartridge for droplet detection.
- a tilt adjustment section (not shown) may be provided under the temperature control stage 612 .
- the tilt adjustment unit removes air bubbles generated inside the cartridge due to heating by the temperature adjustment stage 612 . This prevents the air bubbles from making it impossible to acquire a fluorescence image when the fluorescence intensity of each well is measured while the temperature of the sample is lowered by the temperature control stage 612 .
- the fluorescence data detected by the fluorescence measurement unit 701 is sent to the computer 702.
- the analysis unit 703 calculates the melting temperature of the amplification product and stores it in the memory 705 .
- memory 705 stores the melting temperature of the DNA duplex in each microcompartment.
- the melting temperature is obtained based on changes in fluorescence intensity associated with temperature changes in images captured by an imaging device.
- the relationship between gene types and melting temperatures is prepared in the database 704 in advance.
- the database 704 stores information representing a predetermined standard melting temperature (hereinafter referred to as a standard melting temperature) for each of the wild-type and mutant types of the target gene.
- a standard melting temperature a predetermined standard melting temperature
- the genotype of the gene of interest is specified based on the melting temperature measurements in the memory 705 . The number of identified microcompartments is then determined for each genotype.
- the measurement results are displayed on the monitor 706.
- the monitor 706 is an example of an output device, and display processing on the monitor 706 may be replaced with output processing to another output device (printing device, non-volatile storage device, etc.).
- the DNA detection system disclosed herein may comprise a sample dividing device.
- a sample splitter limits the DNA solution containing the gene of interest and splits it into microfractions.
- the DNA detection system may also include an amplifier for amplifying DNA for the microcompartments.
- FIG. 8 An embodiment of a DNA detection method using the DNA detection system described above will be described below with reference to FIGS. 8 and 9.
- FIG. 8 the change in fluorescence intensity in the nucleic acid amplification reaction is used to identify the melting temperature of DNA.
- a melting curve and a differential curve are also used to identify the melting temperature.
- FIG. 8 shows an example of a database containing information representing standard melting temperatures of genes, which is prepared prior to digital PCR measurement.
- the data shown in FIG. 8 can be measured in advance through a pilot experiment or the like and stored as the database 704 .
- standard melting temperature data for the wild type of the gene and the mutant type of the gene are stored in the memory as a database.
- a reference melting temperature corresponds to each genotype. Multiple variants may be defined for one gene.
- the reference melting temperature is specified as a value representing a single temperature in this example, but may be specified as information representing a temperature range.
- data indicating the color of the fluorescent dye is also stored for each genotype of each gene.
- a DNA solution containing fluorescently-labeled probes or DNA intercalators and multiple types of DNA to be detected is divided into minute compartments within the cartridge 613 (S901).
- wells are used as microcompartments.
- the oil is preferably a substance that is insoluble or sparingly soluble in the PCR reaction solution and is chemically inactive, and is preferably a substance that is stable against temperature changes at high temperatures such as those used in PCR.
- Fluorine-based oil, silicone-based oil, hydrocarbon-based oil, etc. can be used.
- fluorine-based oils include Perfluorocarbon and Hydrofluoroether.
- a fluorine-based oil having a longer carbon chain is preferable because its volatility is lower.
- silicone oils include Polyphenylmethylsiloxane and Trimethylsiloxysilicate.
- hydrocarbon oils examples include mineral oil, liquid paraffin, and hexadecane.
- the oil may be used with a surfactant added.
- the type of surfactant is not particularly limited, but Tween 20, Tween 80, Span 80, Triton X-100, etc. are applicable.
- a nucleic acid amplification reaction is performed by temperature control of a thermal cycler (S903).
- DNA is amplified by repeating cycles including denaturation, extension and annealing steps. If a DNA intercalator is used, it intercalates into the amplified DNA, and if a molecular beacon is used, it hybridizes to the amplified DNA. This amplifies the DNA and increases the fluorescence intensity. Reaction conditions including temperature, time, number of cycles, etc. for each step can be easily set by those skilled in the art.
- the temperature is lowered to room temperature and the amplified DNA forms double strands.
- the fluorescence intensity that changes with the temperature change is measured for each well while the temperature is changed by the temperature control device (S903).
- the specific procedure is as follows.
- a cartridge 613 is placed on the temperature control stage 612 of the DNA detection system. While the temperature of the cartridge 613 is changed by the temperature control stage 612, the fluorescence measuring section 701 measures the fluorescence intensity from the fluorescence-labeled probe or DNA intercalator in each well.
- the fluorescence intensity may be directly measured by the photomultiplier meter 606, or may be acquired by acquiring a fluorescence image and analyzing the image.
- the computer 702 or other component functions as an imaging control unit and causes the imaging device to capture an image.
- the obtained fluorescence image is sent to the computer 702, and the fluorescence intensity of each minute compartment is calculated by the analysis unit 703 from the fluorescence image.
- the obtained fluorescence intensity data of each microcompartment is stored in the memory 705 .
- the analysis unit 703 creates a melting curve based on the fluorescence intensity data (S905) and calculates the number of peaks of the differential curve (S906).
- the positions of the wells having the set number or more of peaks in the differential curve of the melting curve are identified (S907). If the positions of the wells where the number of peaks of the differential curve of the melting curve is equal to or greater than the set number are close to each other, it is determined that there is a bubble at that position (S908).
- round bubbles may be detected by image recognition using the entire fluorescence image of the minute compartment as the information used for bubble detection.
- a melting temperature is calculated from the melting curve of each well and stored in the memory 705 (S909).
- the melting temperature thus calculated based on the fluorescence intensity measurement is called the "measured melting temperature” to distinguish it from the predefined reference melting temperature.
- the database 704 in the memory 705 is referred to, and the standard melting temperature is referred to based on the fluorescence color and the measured melting temperature to determine the type of DNA in the well (S910).
- Analysis results such as a graph of the relationship between fluorescence intensity and melting temperature including or excluding wells in the region determined to have bubbles are displayed (S911), and the user can decide whether to include the wells in the bubble region in the analysis results. , is selected (S912).
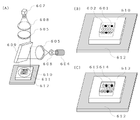
- a mark 1002 of a place where an air bubble is presumed to exist may be superimposed on an illustration or a fluorescence image of a chip 1001 in a cartridge provided with minute wells. If the positions of the minute compartments in the vicinity of the bubbles and the number of such compartments are also displayed on the monitor in this way, this information can be used for the accuracy control of the digital PCR. Further, the wild-type melting temperature range 1003, the mutant-type melting temperature range 1004, and the plot 1005 of each microcompartment calculated by the melting curve analysis are superimposed on the graph of the fluorescence intensity and the melting temperature, and it is determined that bubbles are present.
- the analysis result including wells included in the region (FIG. 10B) and the analysis result excluding wells (FIG. 10C) may be displayed. It allows the user to take advantage of both results.
- Fig. 11 is an example of the measurement results displayed on the monitor. This example shows the results of measuring wild-type and mutant types of cancer-associated genes A and B as target genes.
- the type of cancer-related gene and the type of mutation are selected as shown in FIG. 11A.
- the number of counted DNA contained in the sample solution may be displayed for each.
- the total number of genes calculated from the total number of wild-type and mutant-type genes of interest may be displayed.
- the percentage of counted DNA contained in the specimen solution may be displayed for each cancer-related gene type and mutation type. In the example of FIG. 11B, the percentage of mutant genes in the target gene is displayed.
- the results displayed on the monitor may be the number or ratio of DNA in the sample solution as shown in FIG. It may be a graph in which measured values are plotted, or may include both. It may also include a histogram plotting the number of DNAs in the sample solution against the fluorescence intensity of the fluorescently labeled probe or the measured melting temperature.
- the user may be able to arbitrarily change the range regarding the fluorescence intensity of the fluorescence-labeled probe used when counting the number of DNA. Also, the user may be able to arbitrarily change the range of the reference melting temperature used when counting the number of DNAs.
- the DNA detection system may accept operations to change these and change the relevant ranges. In this way, the user can view a graph or histogram of the measurement results, change the range of fluorescence intensity and/or reference melting temperature, and count again the number of DNAs in the sample solution within the new range. .
- the sample solution is treated as a solution in wells or droplets, so instead of the number of DNAs in the sample solution, the number of wells or the number of droplets may be used.
- an alert may be displayed on the monitor 706 as a measurement error. This alert, for example, indicates to the user that the digital PCR system needs adjustment.
- multiple target genes can be discriminated by utilizing the fact that the melting temperatures of fluorescently labeled probes and DNA differ depending on the target gene.
- the target gene may include multiple types of wild-type alleles and mutant alleles, but the multiple types of target genes are not particularly limited to these.
- the fluorescence-labeled probe corresponding to the target gene P hybridizes to the DNA amplified by PCR. and fluoresce.
- the melting temperature corresponding to the fluorescently labeled probe of the target gene P can be calculated.
- the fluorescence-labeled probe corresponding to the target gene Q hybridizes to the DNA amplified by PCR and emits fluorescence.
- the melting temperature corresponding to the fluorescently labeled probe of target gene Q can be calculated. In this way, the presence or absence of the target gene P and the presence or absence of the target gene Q can be determined based on the fluorescence intensity, the type of fluorescence (for example, color), and the melting temperature.
- the genotype of DNA in microcompartments can be determined with high accuracy by using the melting temperature of DNA. can be done.
- the array of fluorescently labeled probes is determined so that the melting temperature (Tm) of each fluorescently labeled probe for the target gene is different, and the fluorescence intensity change associated with the temperature change is measured for the DNA in the microcompartment to obtain a melting curve. Analysis and comparison of melting temperatures allows genotyping of the DNA within the microcompartments.
- target genes When detecting multiple types of target genes simultaneously, they can be distinguished based on the standard melting temperature and the measured melting temperature, but preferably based on the standard melting temperature range. For example, if the measured melting temperature for a given well is within a predetermined range (for example, within ⁇ 1° C. of the reference melting temperature) that includes the reference melting temperature recorded in the database 704 for a certain target gene, then that well will contain the target gene. is arranged. By using such a reference melting temperature range, it is possible to make a more accurate determination with appropriate consideration given to the allowable range.
- a predetermined range for example, within ⁇ 1° C. of the reference melting temperature
- the fluorescence intensity ratio or difference at different temperatures may be used as the fluorescence intensity information.
- the fluorescence intensity can be standardized by using the ratio or difference between the fluorescence intensity at a temperature lower than the reference melting temperature and the fluorescence intensity at a temperature higher than the reference melting temperature. For example, if the ratio or difference is within a predetermined range for a well, the well is determined to be positive, otherwise the well is determined to be negative.
- the effect of the fluorescence of the fluorescently labeled probe itself can be removed.
- the method for determining the range of fluorescence intensity and the range of standard melting temperature can be selected arbitrarily. For example, a pilot experiment or the like may be performed in advance and the operator may determine the results statistically, or the DNA detection system may automatically determine. Alternatively, the measurement data of each well in the cartridge may be used to statistically determine a predetermined range of fluorescence intensity thresholds and reference melting temperatures for each digital PCR measurement.
- the data for statistically distinguishing the DNA in the well may include any or all of the following items, or may include items other than these.
- An embodiment of the present disclosure is a program for causing a DNA detection system to perform a DNA detection method. Further, still another embodiment of the present invention is a recording medium storing the above program.
- the melting temperature of DNA in the well was measured using a fluorescently labeled probe, and the results of discriminating between the KRAS gene and its mutants G12A and G13D are shown.
- wild-type, G12A and G13D mutant genomic DNAs of the KRAS gene were prepared, and the forward primer (final concentration 0.25 ⁇ M) and reverse primer (final concentration 2.0 ⁇ M) required for PCR were used.
- the forward primer final concentration 0.25 ⁇ M
- reverse primer final concentration 2.0 ⁇ M
- 0 ⁇ M a fluorescently labeled probe corresponding to the wild type
- 0.5 ⁇ M final concentration a fluorescently labeled probe corresponding to the G12A mutant
- 1 ⁇ master mix containing DNA polymerase and dNTPs
- the concentration of the primer pair was added so as to be asymmetrical so that the complementary DNA strand of the fluorescence-labeled probe would be excessively amplified.
- the G13D mutant was detected using a fluorescently labeled probe containing mismatched bases corresponding to the wild type.
- the sequences of primers and probes are as follows. It should be noted that all fluorescently labeled probes have complementary sequences near both ends that are designed to form a double strand within the molecule.
- HEX as a fluorescent dye is bound to the 5' end
- BHQ-1 as a quencher is bound to the 3' end.
- Reverse primer 5'-GTATCGTCAAGGCACTCTTGCC-3' (SEQ ID NO: 2)
- Fluorescent-labeled probe corresponding to the mutant 5'-TTGGAGCTGCTGGCGT-3' (SEQ ID NO: 4)
- PCR reaction solution 15 ⁇ L was added to each well so that either one piece of KRAS wild-type or G12A, G13D mutant DNA or neither of them was contained in each well, and DNA was obtained by PCR. was amplified.
- the PCR reaction was performed at 96° C. for 10 minutes, followed by 59 cycles of (60° C., 2 minutes ⁇ 98° C., 30 seconds), and finally at 60° C. for 2 minutes.
- the chip provided with the wells was cooled from 85° C. to 50° C. on the temperature control stage, and changes in the fluorescence intensity of each well were observed to measure and analyze the melting curve.
- FIG. 12A is the differential curve of the melting curve of each well when measuring a sample in which the wild-type of the KRAS gene and the G12A and G13D mutants are mixed.
- the differential curve of the melting curve of each well has one peak, and the temperature at the position of the peak was calculated as the melting temperature.
- FIG. 12B plots the fluorescence intensity of each well at 50° C. on the horizontal axis and the melting temperature on the vertical axis based on the results of FIG. 12A. Except for the negative well 1207, the positive well is divided into three distributions due to the difference in melting temperature. Wells containing only the G13D variant, and population 1203 with a distribution around 63° C. are wells containing only the G13D variant. Based on these results, a melting temperature range 1204 for the wild type, a melting temperature range 1205 for the G12A mutant, and a melting temperature range 1206 for the G13D mutant were set.
- FIG. 12D when a specimen containing only the wild-type KRAS gene was measured, a population 1208 with a melting temperature outside the wild-type melting temperature range was observed as shown in FIG. 12D.
- the melting curve for population 1208 with melting temperatures outside this wild-type melting temperature range has multiple peaks as shown in FIG. It was found to be localized. When the fluorescence image was confirmed, this location coincided with the location where air bubbles were present. Therefore, by excluding the data of the neighboring wells where the bubbles existed, 16 wells misdetected as the G12A mutant and 1 well misdetected as the G13D mutant could be determined.
- bubbles are detected from the number of peaks in the melting curve for genotype discrimination in digital PCR, and wells in the vicinity of bubbles are removed, thereby erroneously calculating different melting temperatures. Prevents erroneous judgments and improves measurement accuracy.
- Fluorescence measurement unit 702 Central 703... Analysis unit 704... Database 705...Memory 706...Monitor 1001...Chip in cartridge 1002...Position where air bubbles are assumed to exist 1003...Melting temperature range of wild-type allele 1004...Melting temperature range of mutant allele 1005...Each calculated by melting curve analysis Microcompartment plots 1201 ... Wells containing wild type 1202 ... Wells containing G12A variant 1203 ... Wells containing G13D variant 1204 ... Melting temperature range of wild type allele 1205 ... Melting temperature range of G12A variant 1206 ... G13D variant 1207 Negative well 1208 Population with a melting temperature outside the wild-type melting temperature range 1209 Well with multiple peaks in the differential curve of the melting curve
Landscapes
- Chemical & Material Sciences (AREA)
- Health & Medical Sciences (AREA)
- Life Sciences & Earth Sciences (AREA)
- Engineering & Computer Science (AREA)
- Immunology (AREA)
- Organic Chemistry (AREA)
- Physics & Mathematics (AREA)
- Chemical Kinetics & Catalysis (AREA)
- General Health & Medical Sciences (AREA)
- Biochemistry (AREA)
- Molecular Biology (AREA)
- Analytical Chemistry (AREA)
- Proteomics, Peptides & Aminoacids (AREA)
- Zoology (AREA)
- Wood Science & Technology (AREA)
- Biotechnology (AREA)
- Microbiology (AREA)
- Urology & Nephrology (AREA)
- Hematology (AREA)
- General Physics & Mathematics (AREA)
- Pathology (AREA)
- Biomedical Technology (AREA)
- Biophysics (AREA)
- Bioinformatics & Cheminformatics (AREA)
- General Engineering & Computer Science (AREA)
- Genetics & Genomics (AREA)
- Medicinal Chemistry (AREA)
- Nuclear Medicine, Radiotherapy & Molecular Imaging (AREA)
- Optics & Photonics (AREA)
- Cell Biology (AREA)
- Food Science & Technology (AREA)
- Measuring Or Testing Involving Enzymes Or Micro-Organisms (AREA)
- Investigating, Analyzing Materials By Fluorescence Or Luminescence (AREA)
- Apparatus Associated With Microorganisms And Enzymes (AREA)
- Investigating Or Analysing Biological Materials (AREA)
Priority Applications (6)
| Application Number | Priority Date | Filing Date | Title |
|---|---|---|---|
| EP21944442.9A EP4353810A4 (en) | 2021-06-07 | 2021-06-07 | DNA DETECTION METHOD AND DNA DETECTION SYSTEM |
| JP2023527177A JP7596531B2 (ja) | 2021-06-07 | 2021-06-07 | Dna検出方法およびdna検出システム |
| US18/567,061 US20240344120A1 (en) | 2021-06-07 | 2021-06-07 | Dna detection method and dna detection system |
| PCT/JP2021/021633 WO2022259334A1 (ja) | 2021-06-07 | 2021-06-07 | Dna検出方法およびdna検出システム |
| CN202180099075.8A CN117642516A (zh) | 2021-06-07 | 2021-06-07 | Dna检测方法和dna检测系统 |
| JP2024206318A JP7810779B2 (ja) | 2021-06-07 | 2024-11-27 | Dna検出方法およびdna検出システム |
Applications Claiming Priority (1)
| Application Number | Priority Date | Filing Date | Title |
|---|---|---|---|
| PCT/JP2021/021633 WO2022259334A1 (ja) | 2021-06-07 | 2021-06-07 | Dna検出方法およびdna検出システム |
Publications (1)
| Publication Number | Publication Date |
|---|---|
| WO2022259334A1 true WO2022259334A1 (ja) | 2022-12-15 |
Family
ID=84425015
Family Applications (1)
| Application Number | Title | Priority Date | Filing Date |
|---|---|---|---|
| PCT/JP2021/021633 Ceased WO2022259334A1 (ja) | 2021-06-07 | 2021-06-07 | Dna検出方法およびdna検出システム |
Country Status (5)
| Country | Link |
|---|---|
| US (1) | US20240344120A1 (https=) |
| EP (1) | EP4353810A4 (https=) |
| JP (2) | JP7596531B2 (https=) |
| CN (1) | CN117642516A (https=) |
| WO (1) | WO2022259334A1 (https=) |
Cited By (1)
| Publication number | Priority date | Publication date | Assignee | Title |
|---|---|---|---|---|
| EP4516925A1 (en) * | 2023-08-31 | 2025-03-05 | Hitachi, Ltd. | Dna detection method and dna detection kit under special consideration of fluorescence intensity measurement and melting curve analysis |
Families Citing this family (1)
| Publication number | Priority date | Publication date | Assignee | Title |
|---|---|---|---|---|
| CN119913030B (zh) * | 2025-02-10 | 2025-08-15 | 北京旭日鸿升生物技术有限公司 | 一种数字pcr分析装置及其分析方法 |
Citations (7)
| Publication number | Priority date | Publication date | Assignee | Title |
|---|---|---|---|---|
| US4683202A (en) | 1985-03-28 | 1987-07-28 | Cetus Corporation | Process for amplifying nucleic acid sequences |
| US4683195A (en) | 1986-01-30 | 1987-07-28 | Cetus Corporation | Process for amplifying, detecting, and/or-cloning nucleic acid sequences |
| US4800159A (en) | 1986-02-07 | 1989-01-24 | Cetus Corporation | Process for amplifying, detecting, and/or cloning nucleic acid sequences |
| JP2013521764A (ja) | 2010-02-12 | 2013-06-13 | レインダンス テクノロジーズ, インコーポレイテッド | デジタル検体分析 |
| JP2018108063A (ja) | 2017-01-05 | 2018-07-12 | 株式会社日立製作所 | ドロップレットデジタルpcrの測定方法および測定装置 |
| JP2020150824A (ja) * | 2019-03-19 | 2020-09-24 | 株式会社日立製作所 | デジタルpcr計測装置 |
| WO2020261858A1 (ja) * | 2019-06-26 | 2020-12-30 | 株式会社日立製作所 | デジタルpcrの測定方法および測定装置 |
Family Cites Families (2)
| Publication number | Priority date | Publication date | Assignee | Title |
|---|---|---|---|---|
| US11915795B2 (en) * | 2016-12-23 | 2024-02-27 | The Regents Of The University Of California | Method and device for digital high resolution melt |
| JP2020103095A (ja) * | 2018-12-26 | 2020-07-09 | キヤノン株式会社 | 融解温度分析装置 |
-
2021
- 2021-06-07 WO PCT/JP2021/021633 patent/WO2022259334A1/ja not_active Ceased
- 2021-06-07 EP EP21944442.9A patent/EP4353810A4/en active Pending
- 2021-06-07 CN CN202180099075.8A patent/CN117642516A/zh active Pending
- 2021-06-07 JP JP2023527177A patent/JP7596531B2/ja active Active
- 2021-06-07 US US18/567,061 patent/US20240344120A1/en active Pending
-
2024
- 2024-11-27 JP JP2024206318A patent/JP7810779B2/ja active Active
Patent Citations (9)
| Publication number | Priority date | Publication date | Assignee | Title |
|---|---|---|---|---|
| US4683202A (en) | 1985-03-28 | 1987-07-28 | Cetus Corporation | Process for amplifying nucleic acid sequences |
| US4683202B1 (https=) | 1985-03-28 | 1990-11-27 | Cetus Corp | |
| US4683195A (en) | 1986-01-30 | 1987-07-28 | Cetus Corporation | Process for amplifying, detecting, and/or-cloning nucleic acid sequences |
| US4683195B1 (https=) | 1986-01-30 | 1990-11-27 | Cetus Corp | |
| US4800159A (en) | 1986-02-07 | 1989-01-24 | Cetus Corporation | Process for amplifying, detecting, and/or cloning nucleic acid sequences |
| JP2013521764A (ja) | 2010-02-12 | 2013-06-13 | レインダンス テクノロジーズ, インコーポレイテッド | デジタル検体分析 |
| JP2018108063A (ja) | 2017-01-05 | 2018-07-12 | 株式会社日立製作所 | ドロップレットデジタルpcrの測定方法および測定装置 |
| JP2020150824A (ja) * | 2019-03-19 | 2020-09-24 | 株式会社日立製作所 | デジタルpcr計測装置 |
| WO2020261858A1 (ja) * | 2019-06-26 | 2020-12-30 | 株式会社日立製作所 | デジタルpcrの測定方法および測定装置 |
Non-Patent Citations (2)
| Title |
|---|
| GENOME RES., vol. 10, 1996, pages 986 - 994 |
| See also references of EP4353810A4 |
Cited By (1)
| Publication number | Priority date | Publication date | Assignee | Title |
|---|---|---|---|---|
| EP4516925A1 (en) * | 2023-08-31 | 2025-03-05 | Hitachi, Ltd. | Dna detection method and dna detection kit under special consideration of fluorescence intensity measurement and melting curve analysis |
Also Published As
| Publication number | Publication date |
|---|---|
| JP7596531B2 (ja) | 2024-12-09 |
| JPWO2022259334A1 (https=) | 2022-12-15 |
| CN117642516A (zh) | 2024-03-01 |
| JP7810779B2 (ja) | 2026-02-03 |
| EP4353810A4 (en) | 2025-04-23 |
| JP2025028990A (ja) | 2025-03-05 |
| US20240344120A1 (en) | 2024-10-17 |
| EP4353810A1 (en) | 2024-04-17 |
Similar Documents
| Publication | Publication Date | Title |
|---|---|---|
| JP7545511B2 (ja) | デジタルpcrの測定方法および測定装置 | |
| JP7810779B2 (ja) | Dna検出方法およびdna検出システム | |
| JP7066540B2 (ja) | デジタルpcrの測定方法および測定装置 | |
| US20240102088A1 (en) | Pcr measuring method and measurement device | |
| KR20200115552A (ko) | 별개의 용융 분석을 위한 방법 및 조성물 | |
| JP2018046819A (ja) | デジタルポリメラーゼ連鎖反応における反応体積偏差によって引き起こされる定量化誤差を減少させるための方法 | |
| US20180230515A1 (en) | Method for reducing quantification errors caused by an optical artifact in digital polymerase chain reaction | |
| JP6812431B2 (ja) | Dna検出方法およびそのための装置 | |
| JP7432622B2 (ja) | Dna検出方法およびdna検出システム | |
| JP7016382B2 (ja) | ドロップレットデジタルpcrの測定方法および測定装置 | |
| CN120457214A (zh) | 互补单链荧光报告子复合物在pcr方法中的用途 | |
| US20180087096A1 (en) | Gene mutation detection method and fluorescence-labeled oligonucleotide used in same | |
| US20250075266A1 (en) | Dna detection method and dna detection kit | |
| EP4722384A1 (en) | Dpcr with extended dynamic range | |
| CN119173642A (zh) | 引物、dna检测方法和dna检测试剂盒 | |
| HK40029658A (en) | Methods and compositions for discrete melt analysis | |
| Guo | Molecular Diagnostic Techniques |
Legal Events
| Date | Code | Title | Description |
|---|---|---|---|
| 121 | Ep: the epo has been informed by wipo that ep was designated in this application |
Ref document number: 21944442 Country of ref document: EP Kind code of ref document: A1 |
|
| WWE | Wipo information: entry into national phase |
Ref document number: 2023527177 Country of ref document: JP |
|
| WWE | Wipo information: entry into national phase |
Ref document number: 202180099075.8 Country of ref document: CN |
|
| WWE | Wipo information: entry into national phase |
Ref document number: 2021944442 Country of ref document: EP |
|
| NENP | Non-entry into the national phase |
Ref country code: DE |
|
| ENP | Entry into the national phase |
Ref document number: 2021944442 Country of ref document: EP Effective date: 20240108 |