WO2022259334A1 - Dna detection method and dna detection system - Google Patents
Dna detection method and dna detection system Download PDFInfo
- Publication number
- WO2022259334A1 WO2022259334A1 PCT/JP2021/021633 JP2021021633W WO2022259334A1 WO 2022259334 A1 WO2022259334 A1 WO 2022259334A1 JP 2021021633 W JP2021021633 W JP 2021021633W WO 2022259334 A1 WO2022259334 A1 WO 2022259334A1
- Authority
- WO
- WIPO (PCT)
- Prior art keywords
- dna
- micro
- microcompartments
- melting temperature
- temperature
- Prior art date
Links
- 238000001514 detection method Methods 0.000 title claims abstract description 59
- 238000002844 melting Methods 0.000 claims abstract description 141
- 230000008018 melting Effects 0.000 claims abstract description 141
- 108020004414 DNA Proteins 0.000 claims abstract description 127
- 239000000523 sample Substances 0.000 claims abstract description 66
- 238000006243 chemical reaction Methods 0.000 claims abstract description 57
- 230000003321 amplification Effects 0.000 claims abstract description 26
- 238000003199 nucleic acid amplification method Methods 0.000 claims abstract description 26
- 108020004707 nucleic acids Proteins 0.000 claims abstract description 26
- 102000039446 nucleic acids Human genes 0.000 claims abstract description 26
- 150000007523 nucleic acids Chemical class 0.000 claims abstract description 26
- 239000012625 DNA intercalator Substances 0.000 claims abstract description 24
- 238000004458 analytical method Methods 0.000 claims description 16
- 238000000034 method Methods 0.000 claims description 16
- 238000003384 imaging method Methods 0.000 claims description 10
- 230000008859 change Effects 0.000 abstract description 26
- 239000012488 sample solution Substances 0.000 abstract description 14
- 230000006903 response to temperature Effects 0.000 abstract 1
- 108090000623 proteins and genes Proteins 0.000 description 75
- 239000000243 solution Substances 0.000 description 43
- 238000005259 measurement Methods 0.000 description 37
- 238000007847 digital PCR Methods 0.000 description 25
- 108700028369 Alleles Proteins 0.000 description 22
- 239000003921 oil Substances 0.000 description 18
- 238000011880 melting curve analysis Methods 0.000 description 15
- 238000010586 diagram Methods 0.000 description 13
- 238000002073 fluorescence micrograph Methods 0.000 description 11
- 239000007850 fluorescent dye Substances 0.000 description 11
- 102200006532 rs112445441 Human genes 0.000 description 11
- 102200006537 rs121913529 Human genes 0.000 description 9
- 210000001519 tissue Anatomy 0.000 description 6
- 206010028980 Neoplasm Diseases 0.000 description 5
- 230000005284 excitation Effects 0.000 description 5
- 101150105104 Kras gene Proteins 0.000 description 4
- 201000011510 cancer Diseases 0.000 description 4
- 238000009826 distribution Methods 0.000 description 4
- 230000006870 function Effects 0.000 description 4
- 238000010438 heat treatment Methods 0.000 description 4
- 238000005192 partition Methods 0.000 description 4
- 239000000126 substance Substances 0.000 description 4
- 102000053602 DNA Human genes 0.000 description 3
- 102000016928 DNA-directed DNA polymerase Human genes 0.000 description 3
- 108010014303 DNA-directed DNA polymerase Proteins 0.000 description 3
- YCKRFDGAMUMZLT-UHFFFAOYSA-N Fluorine atom Chemical compound [F] YCKRFDGAMUMZLT-UHFFFAOYSA-N 0.000 description 3
- 239000008280 blood Substances 0.000 description 3
- 210000004369 blood Anatomy 0.000 description 3
- 210000004027 cell Anatomy 0.000 description 3
- 230000000295 complement effect Effects 0.000 description 3
- 238000001816 cooling Methods 0.000 description 3
- 238000004925 denaturation Methods 0.000 description 3
- 230000036425 denaturation Effects 0.000 description 3
- 239000011737 fluorine Substances 0.000 description 3
- 229910052731 fluorine Inorganic materials 0.000 description 3
- -1 BHQ1 Chemical compound 0.000 description 2
- 239000004215 Carbon black (E152) Substances 0.000 description 2
- 108091093037 Peptide nucleic acid Proteins 0.000 description 2
- 238000000137 annealing Methods 0.000 description 2
- 230000006399 behavior Effects 0.000 description 2
- 230000008901 benefit Effects 0.000 description 2
- 239000012472 biological sample Substances 0.000 description 2
- 238000001574 biopsy Methods 0.000 description 2
- 210000001124 body fluid Anatomy 0.000 description 2
- 238000009529 body temperature measurement Methods 0.000 description 2
- 230000001276 controlling effect Effects 0.000 description 2
- 238000010790 dilution Methods 0.000 description 2
- 239000012895 dilution Substances 0.000 description 2
- 230000000694 effects Effects 0.000 description 2
- 238000002474 experimental method Methods 0.000 description 2
- DCAYPVUWAIABOU-UHFFFAOYSA-N hexadecane Chemical compound CCCCCCCCCCCCCCCC DCAYPVUWAIABOU-UHFFFAOYSA-N 0.000 description 2
- 229930195733 hydrocarbon Natural products 0.000 description 2
- 150000002430 hydrocarbons Chemical class 0.000 description 2
- 230000035772 mutation Effects 0.000 description 2
- 238000012545 processing Methods 0.000 description 2
- 238000003753 real-time PCR Methods 0.000 description 2
- 239000004094 surface-active agent Substances 0.000 description 2
- UDGUGZTYGWUUSG-UHFFFAOYSA-N 4-[4-[[2,5-dimethoxy-4-[(4-nitrophenyl)diazenyl]phenyl]diazenyl]-n-methylanilino]butanoic acid Chemical compound COC=1C=C(N=NC=2C=CC(=CC=2)N(C)CCCC(O)=O)C(OC)=CC=1N=NC1=CC=C([N+]([O-])=O)C=C1 UDGUGZTYGWUUSG-UHFFFAOYSA-N 0.000 description 1
- FWMNVWWHGCHHJJ-SKKKGAJSSA-N 4-amino-1-[(2r)-6-amino-2-[[(2r)-2-[[(2r)-2-[[(2r)-2-amino-3-phenylpropanoyl]amino]-3-phenylpropanoyl]amino]-4-methylpentanoyl]amino]hexanoyl]piperidine-4-carboxylic acid Chemical compound C([C@H](C(=O)N[C@H](CC(C)C)C(=O)N[C@H](CCCCN)C(=O)N1CCC(N)(CC1)C(O)=O)NC(=O)[C@H](N)CC=1C=CC=CC=1)C1=CC=CC=C1 FWMNVWWHGCHHJJ-SKKKGAJSSA-N 0.000 description 1
- 241000894006 Bacteria Species 0.000 description 1
- UIZZRDIAIPYKJZ-UHFFFAOYSA-J BoBo-3 Chemical compound [I-].[I-].[I-].[I-].S1C2=CC=CC=C2[N+](C)=C1C=CC=C1C=CN(CCC[N+](C)(C)CCC[N+](C)(C)CCCN2C=CC(=CC=CC3=[N+](C4=CC=CC=C4S3)C)C=C2)C=C1 UIZZRDIAIPYKJZ-UHFFFAOYSA-J 0.000 description 1
- OKTJSMMVPCPJKN-UHFFFAOYSA-N Carbon Chemical group [C] OKTJSMMVPCPJKN-UHFFFAOYSA-N 0.000 description 1
- 208000005443 Circulating Neoplastic Cells Diseases 0.000 description 1
- 108020004635 Complementary DNA Proteins 0.000 description 1
- 241000233866 Fungi Species 0.000 description 1
- 102100030708 GTPase KRas Human genes 0.000 description 1
- 101000584612 Homo sapiens GTPase KRas Proteins 0.000 description 1
- 241001465754 Metazoa Species 0.000 description 1
- 108091034117 Oligonucleotide Proteins 0.000 description 1
- 238000012408 PCR amplification Methods 0.000 description 1
- ZYFVNVRFVHJEIU-UHFFFAOYSA-N PicoGreen Chemical compound CN(C)CCCN(CCCN(C)C)C1=CC(=CC2=[N+](C3=CC=CC=C3S2)C)C2=CC=CC=C2N1C1=CC=CC=C1 ZYFVNVRFVHJEIU-UHFFFAOYSA-N 0.000 description 1
- CZQJZBNARVNSLQ-UHFFFAOYSA-L Po-Pro-3 Chemical compound [I-].[I-].O1C2=CC=CC=C2[N+](C)=C1C=CC=C1C=CN(CCC[N+](C)(C)C)C=C1 CZQJZBNARVNSLQ-UHFFFAOYSA-L 0.000 description 1
- GYPIAQJSRPTNTI-UHFFFAOYSA-J PoPo-3 Chemical compound [I-].[I-].[I-].[I-].O1C2=CC=CC=C2[N+](C)=C1C=CC=C1C=CN(CCC[N+](C)(C)CCC[N+](C)(C)CCCN2C=CC(=CC=CC3=[N+](C4=CC=CC=C4O3)C)C=C2)C=C1 GYPIAQJSRPTNTI-UHFFFAOYSA-J 0.000 description 1
- 229920001213 Polysorbate 20 Polymers 0.000 description 1
- NWGKJDSIEKMTRX-AAZCQSIUSA-N Sorbitan monooleate Chemical compound CCCCCCCC\C=C/CCCCCCCC(=O)OC[C@@H](O)[C@H]1OC[C@H](O)[C@H]1O NWGKJDSIEKMTRX-AAZCQSIUSA-N 0.000 description 1
- QHNORJFCVHUPNH-UHFFFAOYSA-L To-Pro-3 Chemical compound [I-].[I-].S1C2=CC=CC=C2[N+](C)=C1C=CC=C1C2=CC=CC=C2N(CCC[N+](C)(C)C)C=C1 QHNORJFCVHUPNH-UHFFFAOYSA-L 0.000 description 1
- MZZINWWGSYUHGU-UHFFFAOYSA-J ToTo-1 Chemical compound [I-].[I-].[I-].[I-].C12=CC=CC=C2C(C=C2N(C3=CC=CC=C3S2)C)=CC=[N+]1CCC[N+](C)(C)CCC[N+](C)(C)CCC[N+](C1=CC=CC=C11)=CC=C1C=C1N(C)C2=CC=CC=C2S1 MZZINWWGSYUHGU-UHFFFAOYSA-J 0.000 description 1
- 239000013504 Triton X-100 Substances 0.000 description 1
- 229920004890 Triton X-100 Polymers 0.000 description 1
- ZVUUXEGAYWQURQ-UHFFFAOYSA-L Yo-Pro-3 Chemical compound [I-].[I-].O1C2=CC=CC=C2[N+](C)=C1C=CC=C1C2=CC=CC=C2N(CCC[N+](C)(C)C)C=C1 ZVUUXEGAYWQURQ-UHFFFAOYSA-L 0.000 description 1
- GRRMZXFOOGQMFA-UHFFFAOYSA-J YoYo-1 Chemical compound [I-].[I-].[I-].[I-].C12=CC=CC=C2C(C=C2N(C3=CC=CC=C3O2)C)=CC=[N+]1CCC[N+](C)(C)CCC[N+](C)(C)CCC[N+](C1=CC=CC=C11)=CC=C1C=C1N(C)C2=CC=CC=C2O1 GRRMZXFOOGQMFA-UHFFFAOYSA-J 0.000 description 1
- JSBNEYNPYQFYNM-UHFFFAOYSA-J YoYo-3 Chemical compound [I-].[I-].[I-].[I-].C12=CC=CC=C2C(C=CC=C2N(C3=CC=CC=C3O2)C)=CC=[N+]1CCC(=[N+](C)C)CCCC(=[N+](C)C)CC[N+](C1=CC=CC=C11)=CC=C1C=CC=C1N(C)C2=CC=CC=C2O1 JSBNEYNPYQFYNM-UHFFFAOYSA-J 0.000 description 1
- JLCPHMBAVCMARE-UHFFFAOYSA-N [3-[[3-[[3-[[3-[[3-[[3-[[3-[[3-[[3-[[3-[[3-[[5-(2-amino-6-oxo-1H-purin-9-yl)-3-[[3-[[3-[[3-[[3-[[3-[[5-(2-amino-6-oxo-1H-purin-9-yl)-3-[[5-(2-amino-6-oxo-1H-purin-9-yl)-3-hydroxyoxolan-2-yl]methoxy-hydroxyphosphoryl]oxyoxolan-2-yl]methoxy-hydroxyphosphoryl]oxy-5-(5-methyl-2,4-dioxopyrimidin-1-yl)oxolan-2-yl]methoxy-hydroxyphosphoryl]oxy-5-(6-aminopurin-9-yl)oxolan-2-yl]methoxy-hydroxyphosphoryl]oxy-5-(6-aminopurin-9-yl)oxolan-2-yl]methoxy-hydroxyphosphoryl]oxy-5-(6-aminopurin-9-yl)oxolan-2-yl]methoxy-hydroxyphosphoryl]oxy-5-(6-aminopurin-9-yl)oxolan-2-yl]methoxy-hydroxyphosphoryl]oxyoxolan-2-yl]methoxy-hydroxyphosphoryl]oxy-5-(5-methyl-2,4-dioxopyrimidin-1-yl)oxolan-2-yl]methoxy-hydroxyphosphoryl]oxy-5-(4-amino-2-oxopyrimidin-1-yl)oxolan-2-yl]methoxy-hydroxyphosphoryl]oxy-5-(5-methyl-2,4-dioxopyrimidin-1-yl)oxolan-2-yl]methoxy-hydroxyphosphoryl]oxy-5-(5-methyl-2,4-dioxopyrimidin-1-yl)oxolan-2-yl]methoxy-hydroxyphosphoryl]oxy-5-(6-aminopurin-9-yl)oxolan-2-yl]methoxy-hydroxyphosphoryl]oxy-5-(6-aminopurin-9-yl)oxolan-2-yl]methoxy-hydroxyphosphoryl]oxy-5-(4-amino-2-oxopyrimidin-1-yl)oxolan-2-yl]methoxy-hydroxyphosphoryl]oxy-5-(4-amino-2-oxopyrimidin-1-yl)oxolan-2-yl]methoxy-hydroxyphosphoryl]oxy-5-(4-amino-2-oxopyrimidin-1-yl)oxolan-2-yl]methoxy-hydroxyphosphoryl]oxy-5-(6-aminopurin-9-yl)oxolan-2-yl]methoxy-hydroxyphosphoryl]oxy-5-(4-amino-2-oxopyrimidin-1-yl)oxolan-2-yl]methyl [5-(6-aminopurin-9-yl)-2-(hydroxymethyl)oxolan-3-yl] hydrogen phosphate Polymers Cc1cn(C2CC(OP(O)(=O)OCC3OC(CC3OP(O)(=O)OCC3OC(CC3O)n3cnc4c3nc(N)[nH]c4=O)n3cnc4c3nc(N)[nH]c4=O)C(COP(O)(=O)OC3CC(OC3COP(O)(=O)OC3CC(OC3COP(O)(=O)OC3CC(OC3COP(O)(=O)OC3CC(OC3COP(O)(=O)OC3CC(OC3COP(O)(=O)OC3CC(OC3COP(O)(=O)OC3CC(OC3COP(O)(=O)OC3CC(OC3COP(O)(=O)OC3CC(OC3COP(O)(=O)OC3CC(OC3COP(O)(=O)OC3CC(OC3COP(O)(=O)OC3CC(OC3COP(O)(=O)OC3CC(OC3COP(O)(=O)OC3CC(OC3COP(O)(=O)OC3CC(OC3COP(O)(=O)OC3CC(OC3COP(O)(=O)OC3CC(OC3CO)n3cnc4c(N)ncnc34)n3ccc(N)nc3=O)n3cnc4c(N)ncnc34)n3ccc(N)nc3=O)n3ccc(N)nc3=O)n3ccc(N)nc3=O)n3cnc4c(N)ncnc34)n3cnc4c(N)ncnc34)n3cc(C)c(=O)[nH]c3=O)n3cc(C)c(=O)[nH]c3=O)n3ccc(N)nc3=O)n3cc(C)c(=O)[nH]c3=O)n3cnc4c3nc(N)[nH]c4=O)n3cnc4c(N)ncnc34)n3cnc4c(N)ncnc34)n3cnc4c(N)ncnc34)n3cnc4c(N)ncnc34)O2)c(=O)[nH]c1=O JLCPHMBAVCMARE-UHFFFAOYSA-N 0.000 description 1
- 230000004075 alteration Effects 0.000 description 1
- 230000015572 biosynthetic process Effects 0.000 description 1
- 239000010839 body fluid Substances 0.000 description 1
- 210000000481 breast Anatomy 0.000 description 1
- 238000010804 cDNA synthesis Methods 0.000 description 1
- 238000011088 calibration curve Methods 0.000 description 1
- 210000001175 cerebrospinal fluid Anatomy 0.000 description 1
- 239000002299 complementary DNA Substances 0.000 description 1
- 230000007423 decrease Effects 0.000 description 1
- 230000003247 decreasing effect Effects 0.000 description 1
- 239000005547 deoxyribonucleotide Substances 0.000 description 1
- 125000002637 deoxyribonucleotide group Chemical group 0.000 description 1
- 238000013461 design Methods 0.000 description 1
- 230000006866 deterioration Effects 0.000 description 1
- 239000012470 diluted sample Substances 0.000 description 1
- 201000010099 disease Diseases 0.000 description 1
- 208000037265 diseases, disorders, signs and symptoms Diseases 0.000 description 1
- BFMYDTVEBKDAKJ-UHFFFAOYSA-L disodium;(2',7'-dibromo-3',6'-dioxido-3-oxospiro[2-benzofuran-1,9'-xanthene]-4'-yl)mercury;hydrate Chemical compound O.[Na+].[Na+].O1C(=O)C2=CC=CC=C2C21C1=CC(Br)=C([O-])C([Hg])=C1OC1=C2C=C(Br)C([O-])=C1 BFMYDTVEBKDAKJ-UHFFFAOYSA-L 0.000 description 1
- 238000004090 dissolution Methods 0.000 description 1
- ZMMJGEGLRURXTF-UHFFFAOYSA-N ethidium bromide Chemical compound [Br-].C12=CC(N)=CC=C2C2=CC=C(N)C=C2[N+](CC)=C1C1=CC=CC=C1 ZMMJGEGLRURXTF-UHFFFAOYSA-N 0.000 description 1
- 229960005542 ethidium bromide Drugs 0.000 description 1
- 210000003608 fece Anatomy 0.000 description 1
- 238000001506 fluorescence spectroscopy Methods 0.000 description 1
- 230000002068 genetic effect Effects 0.000 description 1
- 238000003205 genotyping method Methods 0.000 description 1
- PCHJSUWPFVWCPO-UHFFFAOYSA-N gold Chemical compound [Au] PCHJSUWPFVWCPO-UHFFFAOYSA-N 0.000 description 1
- 239000010931 gold Substances 0.000 description 1
- 229910052737 gold Inorganic materials 0.000 description 1
- 229940057995 liquid paraffin Drugs 0.000 description 1
- 210000004185 liver Anatomy 0.000 description 1
- 239000002480 mineral oil Substances 0.000 description 1
- 235000010446 mineral oil Nutrition 0.000 description 1
- 239000000203 mixture Substances 0.000 description 1
- 238000012986 modification Methods 0.000 description 1
- 230000004048 modification Effects 0.000 description 1
- 239000002245 particle Substances 0.000 description 1
- 239000000256 polyoxyethylene sorbitan monolaurate Substances 0.000 description 1
- 235000010486 polyoxyethylene sorbitan monolaurate Nutrition 0.000 description 1
- 235000010482 polyoxyethylene sorbitan monooleate Nutrition 0.000 description 1
- 229920001296 polysiloxane Polymers 0.000 description 1
- 229920000053 polysorbate 80 Polymers 0.000 description 1
- 230000008569 process Effects 0.000 description 1
- 238000011002 quantification Methods 0.000 description 1
- 239000002683 reaction inhibitor Substances 0.000 description 1
- 230000001105 regulatory effect Effects 0.000 description 1
- 210000003296 saliva Anatomy 0.000 description 1
- 229920002545 silicone oil Polymers 0.000 description 1
- 239000002689 soil Substances 0.000 description 1
- 239000000758 substrate Substances 0.000 description 1
- 239000000725 suspension Substances 0.000 description 1
- 238000012360 testing method Methods 0.000 description 1
- TXEYQDLBPFQVAA-UHFFFAOYSA-N tetrafluoromethane Chemical compound FC(F)(F)F TXEYQDLBPFQVAA-UHFFFAOYSA-N 0.000 description 1
- ABZLKHKQJHEPAX-UHFFFAOYSA-N tetramethylrhodamine Chemical compound C=12C=CC(N(C)C)=CC2=[O+]C2=CC(N(C)C)=CC=C2C=1C1=CC=CC=C1C([O-])=O ABZLKHKQJHEPAX-UHFFFAOYSA-N 0.000 description 1
- UUJLHYCIMQOUKC-UHFFFAOYSA-N trimethyl-[oxo(trimethylsilylperoxy)silyl]peroxysilane Chemical compound C[Si](C)(C)OO[Si](=O)OO[Si](C)(C)C UUJLHYCIMQOUKC-UHFFFAOYSA-N 0.000 description 1
Images


Classifications
-
- C—CHEMISTRY; METALLURGY
- C12—BIOCHEMISTRY; BEER; SPIRITS; WINE; VINEGAR; MICROBIOLOGY; ENZYMOLOGY; MUTATION OR GENETIC ENGINEERING
- C12M—APPARATUS FOR ENZYMOLOGY OR MICROBIOLOGY; APPARATUS FOR CULTURING MICROORGANISMS FOR PRODUCING BIOMASS, FOR GROWING CELLS OR FOR OBTAINING FERMENTATION OR METABOLIC PRODUCTS, i.e. BIOREACTORS OR FERMENTERS
- C12M1/00—Apparatus for enzymology or microbiology
-
- C—CHEMISTRY; METALLURGY
- C12—BIOCHEMISTRY; BEER; SPIRITS; WINE; VINEGAR; MICROBIOLOGY; ENZYMOLOGY; MUTATION OR GENETIC ENGINEERING
- C12Q—MEASURING OR TESTING PROCESSES INVOLVING ENZYMES, NUCLEIC ACIDS OR MICROORGANISMS; COMPOSITIONS OR TEST PAPERS THEREFOR; PROCESSES OF PREPARING SUCH COMPOSITIONS; CONDITION-RESPONSIVE CONTROL IN MICROBIOLOGICAL OR ENZYMOLOGICAL PROCESSES
- C12Q1/00—Measuring or testing processes involving enzymes, nucleic acids or microorganisms; Compositions therefor; Processes of preparing such compositions
- C12Q1/68—Measuring or testing processes involving enzymes, nucleic acids or microorganisms; Compositions therefor; Processes of preparing such compositions involving nucleic acids
- C12Q1/6844—Nucleic acid amplification reactions
- C12Q1/6848—Nucleic acid amplification reactions characterised by the means for preventing contamination or increasing the specificity or sensitivity of an amplification reaction
-
- C—CHEMISTRY; METALLURGY
- C12—BIOCHEMISTRY; BEER; SPIRITS; WINE; VINEGAR; MICROBIOLOGY; ENZYMOLOGY; MUTATION OR GENETIC ENGINEERING
- C12Q—MEASURING OR TESTING PROCESSES INVOLVING ENZYMES, NUCLEIC ACIDS OR MICROORGANISMS; COMPOSITIONS OR TEST PAPERS THEREFOR; PROCESSES OF PREPARING SUCH COMPOSITIONS; CONDITION-RESPONSIVE CONTROL IN MICROBIOLOGICAL OR ENZYMOLOGICAL PROCESSES
- C12Q1/00—Measuring or testing processes involving enzymes, nucleic acids or microorganisms; Compositions therefor; Processes of preparing such compositions
- C12Q1/68—Measuring or testing processes involving enzymes, nucleic acids or microorganisms; Compositions therefor; Processes of preparing such compositions involving nucleic acids
- C12Q1/6844—Nucleic acid amplification reactions
- C12Q1/686—Polymerase chain reaction [PCR]
Definitions
- the present invention relates to DNA detection methods and DNA detection systems, particularly to digital PCR.
- Non-Patent Document 1 Conventional genetic testing includes techniques such as PCR (Patent Documents 2-4) and real-time PCR (Non-Patent Document 1). In these techniques, the reproducibility of measurement decreases when the amount of the gene to be detected (herein referred to as "target gene") is very small.
- Patent Document 1 Digital PCR (Patent Document 1) was developed as a method to solve this problem.
- a very small amount of DNA can be quantified by determining whether DNA is 0 (absent) or 1 (presence) using a limitedly diluted sample and detecting it.
- a method for quantifying DNA in a sample using digital PCR is shown below.
- the target gene in each microfraction is amplified by PCR.
- the fluorescence intensity of each microcompartment is measured after the PCR is finished and the number of microcompartments with fluorescence intensity above the threshold is counted. From the obtained values, the amount of the target gene contained in the sample can be calculated.
- reaction efficiency decreased due to reasons such as the presence of reaction inhibitors in the reaction solution, the formation of secondary structures in the template DNA, and poor primer design.
- the present inventors measured the melting temperature (Tm) of the PCR amplification product by melting curve analysis to determine the PCR reaction efficiency between each microfraction.
- Tm melting temperature
- the Tm value will be an erroneous value. I had a problem with the calculation.
- digital PCR using melting curve analysis the sample is divided into micro-fractions, and after amplification of the target gene in the micro-fractions in the micro-fractions arranged on a plane, fluorescence images of the micro-fractions are captured while changing the temperature. Then, the melting temperature of the gene in the minute fraction is calculated from the change in fluorescence intensity for each minute fraction. At this time, bubbles are likely to be generated when the temperature becomes high during fluorescence image acquisition.
- the through-holes provided in the substrate are used as micro-partitions, and the PCR reaction solution added to the through-holes is blocked with oil or the like to cause a reaction, or when the droplets in the oil are placed on a plane in the flow channel
- bubbles may be generated in the oil.
- the movement of generated bubbles during fluorescence image acquisition causes fluctuations in the fluorescence intensity of each minute compartment, resulting in noise in the melting curve.
- a numerical value different from the melting temperature of the gene in the microcompartment may be calculated, and the quantification of the target gene may not be performed correctly.
- an object of the present invention is to provide a novel DNA detection method and DNA detection, in which, in digital PCR using melting curve analysis, a minute compartment located in the vicinity of generated bubbles is detected by a measurement device and target genes are accurately counted. It is to provide a system.
- the present inventors In digital PCR using melting curve analysis, the present inventors analyzed microcompartments for which a melting temperature different from the genotype contained in the added specimen was calculated. It was clarified that the reason for this was the presence of air bubbles. Therefore, the present inventors have found that erroneous determination of genotypes can be reduced by removing microsections located near bubbles from the analysis data, and have completed the present invention.
- One embodiment of the present invention includes a first step of dividing a specimen solution containing a fluorescently labeled probe or DNA intercalator and multiple types of DNA to be detected into a plurality of microfractions, and the microfractions. a second step of performing a nucleic acid amplification reaction in a microcompartment; and a third step of measuring the fluorescence intensity from the fluorescent-labeled probe or the DNA intercalator with temperature change in each of the microcompartments; a fourth step of calculating the melting temperature of the DNA to be detected from each of the measured fluorescence intensities; a fifth step of identifying the microcompartments affected by the bubbles; and a sixth step of removing data of said microcompartments affected by said bubbles from the total data obtained.
- the micro-compartments affected by the bubbles are micro-compartments in which the number of peaks of the differential curve of the melting curve created from the fluorescence intensities measured in the third step is equal to or greater than a predetermined value. may be specified. Further, in the fifth step, when two or more of the adjacent micro-compartments are identified as the micro-compartments affected by the bubble, in the sixth step, the two or more of the adjacent micro-compartments data is removed, and in the fifth step, when the single micro-compartment is identified as the micro-compartment affected by the bubble, in the sixth step, the single micro-compartment No data need be removed.
- the micro-compartments affected by the bubbles may be identified by analysis of images of the micro-compartments. Further, in the fifth step, a microcompartment is selected in which the number of peaks of the differential curve of the melting curve created from each fluorescence intensity measured in the third step is equal to or greater than a predetermined value, and the selected microcompartment The microcompartments affected by the air bubble may be identified by analyzing the image to determine whether they are affected by the air bubble.
- the fifth step among two or more adjacent micro-sections, a micro-section having a number of peaks of the differential curve equal to or greater than a predetermined value is selected, and in the fifth step, in the single micro-section, Microsections whose differential curve has a number of peaks greater than or equal to a predetermined value may not be selected.
- the DNA solution may be limitedly diluted.
- the types of the plurality of DNAs to be detected are determined based on the melting temperature in each of the microcompartments, and in the fifth step, each type of the DNA whose types have been determined is further subjected to The microcompartment may be identified based on information representing a reference melting temperature of the .
- the microcompartments may consist of wells arranged in an array or droplets dispersed in oil.
- the melting temperature may be calculated as the inflection point of the melting curve created from each fluorescence intensity measured in the third step.
- Another embodiment of the present invention provides a first device having a plurality of microcompartments for containing DNA solutions containing fluorescently labeled probes or DNA intercalators, and a second device for capturing images of the first device.
- a third device for adjusting the temperature of the microcompartments to perform a nucleic acid amplification reaction in the microcompartments; and a fluorescence intensity that varies with temperature changes in the microcompartments.
- a fourth device for controlling the imaging device that causes the imaging device to capture an image; and a fifth device for detecting the generation of bubbles from the acquired fluorescence intensity of the micro-section;
- a DNA detection system comprising:
- FIG. 2 is a schematic diagram showing a method of measuring the melting temperature of DNA using a fluorescence-labeled probe in the DNA detection method according to one embodiment of the present invention.
- FIG. 2 is a schematic diagram showing the relationship between droplets and air bubbles when depressions for capturing droplets of a PCR reaction solution are used as minute compartments in the DNA detection method according to one embodiment of the present invention.
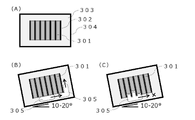
- 1 is a schematic diagram showing the relationship between wells and bubbles when wells are used as microcompartments in the DNA detection method according to one embodiment of the present invention.
- FIG. 4 is a diagram showing data on the fluorescence intensity of a fluorescent dye contained in a well with temperature change and data on the melting temperature obtained from the fluorescence intensity change of each well with temperature change in one embodiment of the present invention.
- FIG. 2 is a diagram showing measurement results by a DNA detection method according to one embodiment of the present invention;
- FIG. 2 is a schematic diagram of a fluorescence measurement unit in one embodiment of the present invention;
- 1 is a schematic diagram of a digital PCR system in one embodiment of the present invention.
- FIG. FIG. 4 shows a database used in the DNA detection method in one embodiment of the present invention.
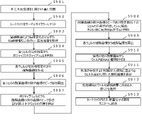
- Figure 8 is a flow chart illustrating one embodiment of a method for making melting temperature measurements using the apparatus of Figures 6 and 7;
- FIG. 4 is a diagram showing measurement results displayed on a monitor in one embodiment of the present invention;
- FIG. 4 is a diagram showing measurement results displayed on a monitor in one embodiment of the present invention; It is a figure which shows the measurement result obtained in the Example of
- DNA detection method divides a DNA solution containing fluorescently labeled probes or DNA intercalators and multiple types of DNA to be detected into multiple microfractions. a second step of performing a nucleic acid amplification reaction in a microcompartment containing a microfraction; a third step of measuring the fluorescence intensity, a fourth step of calculating the melting temperature of the DNA to be detected from each measured fluorescence intensity, and a fifth step of identifying the microcompartment affected by the air bubble; and a sixth step of removing data of microcompartments affected by air bubbles from the total data obtained in the plurality of microcompartments.
- This DNA detection method will be specifically described below with reference to the schematic diagrams of FIGS.
- a sample solution containing a fluorescence-labeled probe or DNA intercalator and multiple types of DNAs to be detected is divided into a plurality of minute fractions.
- a sample solution containing DNA derived from a biological sample is prepared.
- the sample solution may contain multiple types of target genes.
- This sample solution is added to the PCR reaction solution.
- a PCR reaction solution includes a DNA polymerase, primers, a DNA intercalator or fluorescently labeled probe, deoxyribonucleotides, and a buffer.
- the sample solution contains the fluorescently labeled probe or DNA intercalator.
- the fluorescence-labeled probe it is preferable to use a molecular beacon designed to have a structure capable of hybridizing to the gene of interest.
- the specimen solution is micro-fractionated into micro-compartments.
- microfractionating it is preferable to limit the sample solution and fractionate such that each microcompartment contains 0 or 1 molecule of DNA.
- the biological sample to be used is not particularly limited, but any sample containing DNA to be detected may be used, such as an individual sample (body fluids, tissues, cells, excreta, etc. of animals and plants) or a soil sample (including fungi, bacteria, etc.).
- bodily fluids include blood, saliva, and cerebrospinal fluid.
- Blood contains cell-free DNA (cfDNA) and circulating tumor DNA (ctDNA).
- tissue include a disease-affected area obtained by surgical operation or biopsy (for example, cancer tissue such as breast or liver).
- the tissue may be already fixed tissue, such as formalin-fixed paraffin-embedded tissue sections (FFPE).
- FFPE formalin-fixed paraffin-embedded tissue sections
- cells include cells collected by biopsy (affected area or its vicinity), blood-circulating tumor cells circulating in the blood, and the like.
- the pretreatment of these specimens is not particularly limited, and after collection from the living body or the environment, it may be added to a suspension and homogenized, or dissolved in a dissolution solution and used as it is. It is preferable to extract or purify the contained nucleic acid.
- a nucleic acid amplification reaction is performed in each microcompartment containing microfractions.
- the nucleic acid amplification reaction is preferably so-called PCR, especially digital PCR.
- the fluorescence intensity from the fluorescent-labeled probe or DNA intercalator is measured in each of the microcompartments as the temperature changes.
- This temperature change may be achieved by utilizing the temperature change during the nucleic acid amplification reaction, or by raising the temperature of the specimen solution independently of the nucleic acid amplification reaction (for example, after completion of the nucleic acid amplification reaction).
- the fluorescently labeled probe or DNA intercalator used in this step may be used in common with the fluorescently labeled probe or DNA intercalator for PCR. You can use things.
- FIG. 1 is a schematic diagram showing the behavior of fluorescent-labeled probes when the temperature of the reaction solution is changed.
- Molecular beacons and Taqman probes can be exemplified as fluorescence-labeled probes, and FIG. 1 will be described here using molecular beacons as an example.
- Molecular beacons are constructed as oligonucleotides and have sequences complementary to sequences between primer pairs used in nucleic acid amplification reactions to amplify a gene of interest.
- the molecular beacon has sequences complementary to each other at both ends, with a fluorescent dye 103 at one end and a quencher 104 at the other end.
- the molecular beacon 102 In the nucleic acid amplification reaction, in the initial state, the molecular beacon 102 exists alone and free as shown in FIG. 1B. At that time, the molecular beacon 102 forms a stem-loop and the fluorescent dye 103 and the quencher 104 are close to each other, so fluorescence is not emitted.
- the first denaturation step when the sample solution is heated, it assumes a structure with a high degree of freedom as shown in FIG. 1C.
- the annealing step when the temperature is lowered to about room temperature, the loop portion of the molecular beacon 102 is annealed to the DNA 101 amplified in the specimen solution as shown in FIG. 1A.
- the fluorescent dye 103 and the quencher 104 are always separated from each other, so that the fluorescent-labeled probe 102 emits strong fluorescence.
- the molecular beacon 102 is released, again as in FIG. 1B, and the fluorescence is quenched.
- the fluorescence remains quenched. Since this process is repeated in nucleic acid amplification reactions, fluorescence intensity may be measured at some stage during heating or cooling. When measuring the fluorescence intensity after completion of the nucleic acid amplification reaction, it can be measured in the same manner.
- fluorescence intensity may be measured at some stage during heating or cooling. After completion of the nucleic acid amplification reaction, the fluorescence intensity may be measured after heating or cooling just for the purpose of measuring the fluorescence intensity.
- the combination of the fluorescent dye 103 and the quencher 104 is not particularly limited as long as it is a combination commonly used in real-time PCR.
- examples of the fluorescent dye 103 include FAM, VIC, ROX, Cy3, Cy5, etc.
- examples of the quencher 104 include TAMRA, BHQ1, BHQ2, BHQ3, and the like.
- the sequence of the molecular beacon 102 is prepared specific to each of the target genes, and by binding different fluorescent dyes, one sequence can be obtained. Two types of target genes can be detected in the reaction system.
- the DNA intercalator is not particularly limited as long as it increases fluorescence intensity by binding to double-stranded DNA and can be used for detecting double-stranded DNA.
- SYBR registered trademark
- Green I SYBR Gold
- PicoGreen registered trademark
- SYTO registered trademark
- SYTO registered trademark
- SYTO Red POPO (registered trademark)-1, BOBO (registered trademark) )-1, YOYO (registered trademark)-1, TOTO (registered trademark)-1, JOJO (registered trademark)-1, POPO-3, LOLO (registered trademark)-1, BOBO-3, YOYO-3, TOTO- 3, PO-Pro (registered trademark)-1, YO-Pro (registered trademark)-1, TO-Pro (registered trademark)-1, JO-Pro (registered trademark)-1, PO-Pro-3, YO- Pro-3, TO-Pro-3, TO-Pro-5, ethidium bromine
- the melting temperature of the DNA to be detected is calculated from each measured fluorescence intensity.
- the method of calculating the melting temperature is not particularly limited, and the function of fluorescence intensity and temperature may be obtained, the derivative of the function may be obtained, and the temperature at which the maximum value is obtained may be calculated and used as the melting temperature.
- plot the function of fluorescence intensity and temperature on a graph to create a melting curve i.e., a curve representing changes in fluorescence intensity with respect to temperature changes). may be used as the melting temperature.
- An example of a melting curve is shown in FIG. 4A, and a differential curve obtained from this melting curve is shown in FIG. 4B.
- the temperature corresponding to the inflection point of the melting curve corresponds to the peak of the differential curve and is calculated as the melting temperature 401 of the DNA double strand.
- the melting temperature of the fluorescent-labeled probe for detecting the target gene can be adjusted based on known techniques when designing the fluorescent-labeled probe. For example, it can be adjusted by changing the sequence or chain length of the probe. Alternatively, it can be regulated by using artificial DNA such as Peptide Nucleic Acid (PNA) or Locked Nucleic Acid (LNA).
- PNA Peptide Nucleic Acid
- LNA Locked Nucleic Acid
- Figures 2 and 3 show the behavior of bubbles generated near microcompartments in digital PCR using melting curve analysis.
- the cartridge 204 illustrated in FIG. 2 has depressions for capturing droplets of the PCR reaction solution as microcompartments.
- the inside of the cartridge 204 is filled with oil 203 , and the droplets 201 are captured in droplet capturing recesses 202 provided inside the cartridge 204 .
- digital PCR using melting curve analysis a fluorescent image of the droplet is acquired while changing the temperature, and the melting curve analysis is performed for each droplet.
- air bubbles 205 may be generated in the cartridge 204, and the frequency of the air bubbles is high especially when the temperature is high. Since the presence of air bubbles 205 under the droplet 201 causes noise in fluorescence intensity measurement, it is necessary to tilt the cartridge 204 as shown in FIG. However, when the droplets 201 are not evenly captured in the droplet capturing recesses 202 as shown in FIG. , the fluorescence intensity of the droplet 201 near the bubble may not be measured accurately.
- the cartridge 304 exemplified in FIG. 3 has wells for containing PCR reaction solutions as microcompartments. As shown in FIG. 3A, the inside of cartridge 304 is filled with oil 303, and PCR reaction solution 301 is added to wells of through-hole chip 302 provided inside cartridge 304. FIG. Air bubbles 305 may be generated in the cartridge 304 when wells are used, as with droplets. Bubbles 305 are likely to occur especially at high temperatures. Since air bubbles 305 under the through-hole chip 302 cause noise in fluorescence intensity measurement, it is necessary to incline the cartridge 304 to release air bubbles from under the through-hole chip 302 as shown in FIG. 3B. However, when the PCR reaction solution is not evenly added to the through-hole chip 302 as shown in FIG. Fluorescence intensity of neighboring wells may not be measured accurately.
- Fig. 4 shows an example of the melting curve of microcompartments when bubbles are not generated and when bubbles are generated.
- the change in fluorescence intensity of the minute compartment with temperature change is measured, resulting in a smooth melting curve as shown in FIG. , the peak temperature is the melting temperature (Tm) 401 .
- Tm melting temperature
- the fluorescence intensity fluctuates with the movement of the air bubbles as shown in FIG. 4C. Therefore, when a differential curve is obtained, it may have multiple peaks as shown in FIG. 4D, and the melting temperature of the target gene in the microcompartment may not be identified or may be incorrect.
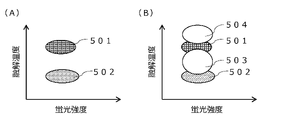
- Fig. 5 shows an example of the melting curve analysis results of microcompartments when bubbles are not generated and when bubbles are generated.
- the melting temperature 501 corresponding to the fluorescently labeled probe of the wild-type allele in the microsection containing the gene of interest with the wild-type allele is the melting temperature 501 of the mutant allele in the microsection containing the gene of interest with the mutant allele.
- a melting temperature 502 corresponding to the fluorescently labeled probe is detected.
- the microcompartment containing the target gene with the wild-type allele may erroneously exhibit melting temperatures 503 and 504 that differ from the melting temperature of the wild-type allele, as shown in FIG. 5B. .
- the microcompartment containing the gene of interest having the mutant allele erroneously exhibits a melting temperature different from that of the mutant allele, and the microcompartment containing the gene of interest having the mutant allele is treated as the wild-type allele. It may also be identified as a microcompartment that contains the gene of interest that it has.
- the minute compartment showing a melting temperature 503 different from the melting temperature of the wild-type allele can be removed from the analysis data. This reduces erroneous determination of genes in the partition and enables more accurate gene detection.
- the DNA detection system disclosed herein aims to detect a gene of interest in a DNA solution, and includes a plurality of microscopic particles for containing a DNA solution containing fluorescently labeled probes or DNA intercalators.
- a first device having a compartment, a second device for capturing an image of the first device, and a third device for adjusting the temperature of the microcompartment to perform a nucleic acid amplification reaction in the microcompartment. and a fourth device for controlling the imaging device to capture an image in order to acquire the fluorescence intensity that changes with temperature change in the microcompartment, and the acquired fluorescence intensity of the microcompartment.
- a fifth device for detecting the generation of air bubbles.
- This DNA detection system includes, in addition to each of the devices described above, a sixth device for measuring the intensity of fluorescence emitted from the DNA solution, and a melting curve representing changes in the intensity of fluorescence with temperature changes in the DNA solution.
- a computer that calculates the melting temperature of the DNA double strand based on the above, and a monitor that displays information transmitted from the computer may be provided.
- These devices may physically be in a single device, or each may exist as a single device, and some devices may be combined into a single device, while other devices may be combined to form a single device. may exist independently.
- the DNA solution may be held by any carrier, for example, as shown in FIG. , may be housed in a well of a plate, cartridge, or the like.
- FIGS. 6 and 7 show a DNA detection system having a fluorescence measurement section.
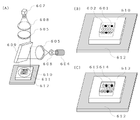
- FIG. 6 is a schematic diagram of a fluorescence measurement unit for measuring the intensity of fluorescence emitted from a DNA solution
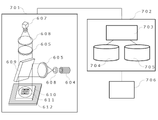
- FIG. 7 is a schematic diagram of a digital PCR system.
- the fluorescence measurement unit in FIG. 6 measures the color and fluorescence intensity of the fluorochrome contained in the droplets or wells that have undergone limiting dilution.
- the digital PCR system in FIG. 7 includes a fluorescence measurement unit illustrated in FIG. 6, a computer that calculates the melting temperature of DNA double strands and analyzes measurement data, and a monitor that displays the results.
- the fluorescence measurement unit shown in FIG. 6A includes a light source 604, a fluorescence filter 605, and a detection unit such as a photomultiplier meter and a camera 607.
- the fluorescence measurement unit may be provided with a plurality of light sources and/or a plurality of detection units for each color of the fluorescent dye. Upon excitation, one detection unit may simultaneously detect a plurality of fluorescences with different wavelengths through a plurality of fluorescence filters 605 .
- a plurality of droplets 611 are arrayed in a droplet detection cartridge 610 as shown in FIG. 2 and set on a temperature control stage 612 that is a temperature control unit.
- a temperature control stage 612 changes the temperature of each compartment in order to carry out nucleic acid amplification reaction in each compartment.
- a temperature control stage 612 changes the temperature of the cartridge for droplet detection, and measures the change in fluorescence intensity of the droplet accompanying the temperature change.
- the droplet 601 containing the target gene and the droplet 602 not containing the target gene change in fluorescence intensity differently.
- each droplet 611 is irradiated with excitation light from a light source 604 through a lens 608 , a fluorescence filter 605 and a dichroic mirror 609 .
- a fluorescent substance contained in each droplet 611 is excited by the excitation light, and emitted fluorescence is detected by a CCD camera 607 through a dichroic mirror 609 , fluorescence filter 605 and lens 608 .
- the CCD camera 607 is an example of an imaging device.
- a well-type detection cartridge 613 as shown in FIG. 3 may be used.
- a reaction solution containing a specimen is added to wells provided in the well-type detection cartridge 613 .
- PCR is performed in the well and set on the temperature control stage 612 which is a temperature control unit.
- the temperature of the cartridge 613 is changed by the temperature control stage 612, and the fluorescence intensity change of the wells is measured as the temperature changes.
- the fluorescence intensity changes differently between the well 614 containing the target gene and the well 615 not containing the target gene.
- the measurement procedure is as follows. First, each well is irradiated with excitation light from a light source 604 through a lens 608 , a fluorescence filter 605 and a dichroic mirror 609 . Fluorescent substances contained in the reaction solution in the wells are excited by the excitation light, and emitted fluorescence is detected by the CCD camera 607 through the dichroic mirror 609 , fluorescence filter 605 and lens 608 .
- PCR to melting curve analysis can be performed within cartridge 613 without the step of arranging the droplets in a cartridge for droplet detection.
- a tilt adjustment section (not shown) may be provided under the temperature control stage 612 .
- the tilt adjustment unit removes air bubbles generated inside the cartridge due to heating by the temperature adjustment stage 612 . This prevents the air bubbles from making it impossible to acquire a fluorescence image when the fluorescence intensity of each well is measured while the temperature of the sample is lowered by the temperature control stage 612 .
- the fluorescence data detected by the fluorescence measurement unit 701 is sent to the computer 702.
- the analysis unit 703 calculates the melting temperature of the amplification product and stores it in the memory 705 .
- memory 705 stores the melting temperature of the DNA duplex in each microcompartment.
- the melting temperature is obtained based on changes in fluorescence intensity associated with temperature changes in images captured by an imaging device.
- the relationship between gene types and melting temperatures is prepared in the database 704 in advance.
- the database 704 stores information representing a predetermined standard melting temperature (hereinafter referred to as a standard melting temperature) for each of the wild-type and mutant types of the target gene.
- a standard melting temperature a predetermined standard melting temperature
- the genotype of the gene of interest is specified based on the melting temperature measurements in the memory 705 . The number of identified microcompartments is then determined for each genotype.
- the measurement results are displayed on the monitor 706.
- the monitor 706 is an example of an output device, and display processing on the monitor 706 may be replaced with output processing to another output device (printing device, non-volatile storage device, etc.).
- the DNA detection system disclosed herein may comprise a sample dividing device.
- a sample splitter limits the DNA solution containing the gene of interest and splits it into microfractions.
- the DNA detection system may also include an amplifier for amplifying DNA for the microcompartments.
- FIG. 8 An embodiment of a DNA detection method using the DNA detection system described above will be described below with reference to FIGS. 8 and 9.
- FIG. 8 the change in fluorescence intensity in the nucleic acid amplification reaction is used to identify the melting temperature of DNA.
- a melting curve and a differential curve are also used to identify the melting temperature.
- FIG. 8 shows an example of a database containing information representing standard melting temperatures of genes, which is prepared prior to digital PCR measurement.
- the data shown in FIG. 8 can be measured in advance through a pilot experiment or the like and stored as the database 704 .
- standard melting temperature data for the wild type of the gene and the mutant type of the gene are stored in the memory as a database.
- a reference melting temperature corresponds to each genotype. Multiple variants may be defined for one gene.
- the reference melting temperature is specified as a value representing a single temperature in this example, but may be specified as information representing a temperature range.
- data indicating the color of the fluorescent dye is also stored for each genotype of each gene.
- a DNA solution containing fluorescently-labeled probes or DNA intercalators and multiple types of DNA to be detected is divided into minute compartments within the cartridge 613 (S901).
- wells are used as microcompartments.
- the oil is preferably a substance that is insoluble or sparingly soluble in the PCR reaction solution and is chemically inactive, and is preferably a substance that is stable against temperature changes at high temperatures such as those used in PCR.
- Fluorine-based oil, silicone-based oil, hydrocarbon-based oil, etc. can be used.
- fluorine-based oils include Perfluorocarbon and Hydrofluoroether.
- a fluorine-based oil having a longer carbon chain is preferable because its volatility is lower.
- silicone oils include Polyphenylmethylsiloxane and Trimethylsiloxysilicate.
- hydrocarbon oils examples include mineral oil, liquid paraffin, and hexadecane.
- the oil may be used with a surfactant added.
- the type of surfactant is not particularly limited, but Tween 20, Tween 80, Span 80, Triton X-100, etc. are applicable.
- a nucleic acid amplification reaction is performed by temperature control of a thermal cycler (S903).
- DNA is amplified by repeating cycles including denaturation, extension and annealing steps. If a DNA intercalator is used, it intercalates into the amplified DNA, and if a molecular beacon is used, it hybridizes to the amplified DNA. This amplifies the DNA and increases the fluorescence intensity. Reaction conditions including temperature, time, number of cycles, etc. for each step can be easily set by those skilled in the art.
- the temperature is lowered to room temperature and the amplified DNA forms double strands.
- the fluorescence intensity that changes with the temperature change is measured for each well while the temperature is changed by the temperature control device (S903).
- the specific procedure is as follows.
- a cartridge 613 is placed on the temperature control stage 612 of the DNA detection system. While the temperature of the cartridge 613 is changed by the temperature control stage 612, the fluorescence measuring section 701 measures the fluorescence intensity from the fluorescence-labeled probe or DNA intercalator in each well.
- the fluorescence intensity may be directly measured by the photomultiplier meter 606, or may be acquired by acquiring a fluorescence image and analyzing the image.
- the computer 702 or other component functions as an imaging control unit and causes the imaging device to capture an image.
- the obtained fluorescence image is sent to the computer 702, and the fluorescence intensity of each minute compartment is calculated by the analysis unit 703 from the fluorescence image.
- the obtained fluorescence intensity data of each microcompartment is stored in the memory 705 .
- the analysis unit 703 creates a melting curve based on the fluorescence intensity data (S905) and calculates the number of peaks of the differential curve (S906).
- the positions of the wells having the set number or more of peaks in the differential curve of the melting curve are identified (S907). If the positions of the wells where the number of peaks of the differential curve of the melting curve is equal to or greater than the set number are close to each other, it is determined that there is a bubble at that position (S908).
- round bubbles may be detected by image recognition using the entire fluorescence image of the minute compartment as the information used for bubble detection.
- a melting temperature is calculated from the melting curve of each well and stored in the memory 705 (S909).
- the melting temperature thus calculated based on the fluorescence intensity measurement is called the "measured melting temperature” to distinguish it from the predefined reference melting temperature.
- the database 704 in the memory 705 is referred to, and the standard melting temperature is referred to based on the fluorescence color and the measured melting temperature to determine the type of DNA in the well (S910).
- Analysis results such as a graph of the relationship between fluorescence intensity and melting temperature including or excluding wells in the region determined to have bubbles are displayed (S911), and the user can decide whether to include the wells in the bubble region in the analysis results. , is selected (S912).
- a mark 1002 of a place where an air bubble is presumed to exist may be superimposed on an illustration or a fluorescence image of a chip 1001 in a cartridge provided with minute wells. If the positions of the minute compartments in the vicinity of the bubbles and the number of such compartments are also displayed on the monitor in this way, this information can be used for the accuracy control of the digital PCR. Further, the wild-type melting temperature range 1003, the mutant-type melting temperature range 1004, and the plot 1005 of each microcompartment calculated by the melting curve analysis are superimposed on the graph of the fluorescence intensity and the melting temperature, and it is determined that bubbles are present.
- the analysis result including wells included in the region (FIG. 10B) and the analysis result excluding wells (FIG. 10C) may be displayed. It allows the user to take advantage of both results.
- Fig. 11 is an example of the measurement results displayed on the monitor. This example shows the results of measuring wild-type and mutant types of cancer-associated genes A and B as target genes.
- the type of cancer-related gene and the type of mutation are selected as shown in FIG. 11A.
- the number of counted DNA contained in the sample solution may be displayed for each.
- the total number of genes calculated from the total number of wild-type and mutant-type genes of interest may be displayed.
- the percentage of counted DNA contained in the specimen solution may be displayed for each cancer-related gene type and mutation type. In the example of FIG. 11B, the percentage of mutant genes in the target gene is displayed.
- the results displayed on the monitor may be the number or ratio of DNA in the sample solution as shown in FIG. It may be a graph in which measured values are plotted, or may include both. It may also include a histogram plotting the number of DNAs in the sample solution against the fluorescence intensity of the fluorescently labeled probe or the measured melting temperature.
- the user may be able to arbitrarily change the range regarding the fluorescence intensity of the fluorescence-labeled probe used when counting the number of DNA. Also, the user may be able to arbitrarily change the range of the reference melting temperature used when counting the number of DNAs.
- the DNA detection system may accept operations to change these and change the relevant ranges. In this way, the user can view a graph or histogram of the measurement results, change the range of fluorescence intensity and/or reference melting temperature, and count again the number of DNAs in the sample solution within the new range. .
- the sample solution is treated as a solution in wells or droplets, so instead of the number of DNAs in the sample solution, the number of wells or the number of droplets may be used.
- an alert may be displayed on the monitor 706 as a measurement error. This alert, for example, indicates to the user that the digital PCR system needs adjustment.
- multiple target genes can be discriminated by utilizing the fact that the melting temperatures of fluorescently labeled probes and DNA differ depending on the target gene.
- the target gene may include multiple types of wild-type alleles and mutant alleles, but the multiple types of target genes are not particularly limited to these.
- the fluorescence-labeled probe corresponding to the target gene P hybridizes to the DNA amplified by PCR. and fluoresce.
- the melting temperature corresponding to the fluorescently labeled probe of the target gene P can be calculated.
- the fluorescence-labeled probe corresponding to the target gene Q hybridizes to the DNA amplified by PCR and emits fluorescence.
- the melting temperature corresponding to the fluorescently labeled probe of target gene Q can be calculated. In this way, the presence or absence of the target gene P and the presence or absence of the target gene Q can be determined based on the fluorescence intensity, the type of fluorescence (for example, color), and the melting temperature.
- the genotype of DNA in microcompartments can be determined with high accuracy by using the melting temperature of DNA. can be done.
- the array of fluorescently labeled probes is determined so that the melting temperature (Tm) of each fluorescently labeled probe for the target gene is different, and the fluorescence intensity change associated with the temperature change is measured for the DNA in the microcompartment to obtain a melting curve. Analysis and comparison of melting temperatures allows genotyping of the DNA within the microcompartments.
- target genes When detecting multiple types of target genes simultaneously, they can be distinguished based on the standard melting temperature and the measured melting temperature, but preferably based on the standard melting temperature range. For example, if the measured melting temperature for a given well is within a predetermined range (for example, within ⁇ 1° C. of the reference melting temperature) that includes the reference melting temperature recorded in the database 704 for a certain target gene, then that well will contain the target gene. is arranged. By using such a reference melting temperature range, it is possible to make a more accurate determination with appropriate consideration given to the allowable range.
- a predetermined range for example, within ⁇ 1° C. of the reference melting temperature
- the fluorescence intensity ratio or difference at different temperatures may be used as the fluorescence intensity information.
- the fluorescence intensity can be standardized by using the ratio or difference between the fluorescence intensity at a temperature lower than the reference melting temperature and the fluorescence intensity at a temperature higher than the reference melting temperature. For example, if the ratio or difference is within a predetermined range for a well, the well is determined to be positive, otherwise the well is determined to be negative.
- the effect of the fluorescence of the fluorescently labeled probe itself can be removed.
- the method for determining the range of fluorescence intensity and the range of standard melting temperature can be selected arbitrarily. For example, a pilot experiment or the like may be performed in advance and the operator may determine the results statistically, or the DNA detection system may automatically determine. Alternatively, the measurement data of each well in the cartridge may be used to statistically determine a predetermined range of fluorescence intensity thresholds and reference melting temperatures for each digital PCR measurement.
- the data for statistically distinguishing the DNA in the well may include any or all of the following items, or may include items other than these.
- An embodiment of the present disclosure is a program for causing a DNA detection system to perform a DNA detection method. Further, still another embodiment of the present invention is a recording medium storing the above program.
- the melting temperature of DNA in the well was measured using a fluorescently labeled probe, and the results of discriminating between the KRAS gene and its mutants G12A and G13D are shown.
- wild-type, G12A and G13D mutant genomic DNAs of the KRAS gene were prepared, and the forward primer (final concentration 0.25 ⁇ M) and reverse primer (final concentration 2.0 ⁇ M) required for PCR were used.
- the forward primer final concentration 0.25 ⁇ M
- reverse primer final concentration 2.0 ⁇ M
- 0 ⁇ M a fluorescently labeled probe corresponding to the wild type
- 0.5 ⁇ M final concentration a fluorescently labeled probe corresponding to the G12A mutant
- 1 ⁇ master mix containing DNA polymerase and dNTPs
- the concentration of the primer pair was added so as to be asymmetrical so that the complementary DNA strand of the fluorescence-labeled probe would be excessively amplified.
- the G13D mutant was detected using a fluorescently labeled probe containing mismatched bases corresponding to the wild type.
- the sequences of primers and probes are as follows. It should be noted that all fluorescently labeled probes have complementary sequences near both ends that are designed to form a double strand within the molecule.
- HEX as a fluorescent dye is bound to the 5' end
- BHQ-1 as a quencher is bound to the 3' end.
- Reverse primer 5'-GTATCGTCAAGGCACTCTTGCC-3' (SEQ ID NO: 2)
- Fluorescent-labeled probe corresponding to the mutant 5'-TTGGAGCTGCTGGCGT-3' (SEQ ID NO: 4)
- PCR reaction solution 15 ⁇ L was added to each well so that either one piece of KRAS wild-type or G12A, G13D mutant DNA or neither of them was contained in each well, and DNA was obtained by PCR. was amplified.
- the PCR reaction was performed at 96° C. for 10 minutes, followed by 59 cycles of (60° C., 2 minutes ⁇ 98° C., 30 seconds), and finally at 60° C. for 2 minutes.
- the chip provided with the wells was cooled from 85° C. to 50° C. on the temperature control stage, and changes in the fluorescence intensity of each well were observed to measure and analyze the melting curve.
- FIG. 12A is the differential curve of the melting curve of each well when measuring a sample in which the wild-type of the KRAS gene and the G12A and G13D mutants are mixed.
- the differential curve of the melting curve of each well has one peak, and the temperature at the position of the peak was calculated as the melting temperature.
- FIG. 12B plots the fluorescence intensity of each well at 50° C. on the horizontal axis and the melting temperature on the vertical axis based on the results of FIG. 12A. Except for the negative well 1207, the positive well is divided into three distributions due to the difference in melting temperature. Wells containing only the G13D variant, and population 1203 with a distribution around 63° C. are wells containing only the G13D variant. Based on these results, a melting temperature range 1204 for the wild type, a melting temperature range 1205 for the G12A mutant, and a melting temperature range 1206 for the G13D mutant were set.
- FIG. 12D when a specimen containing only the wild-type KRAS gene was measured, a population 1208 with a melting temperature outside the wild-type melting temperature range was observed as shown in FIG. 12D.
- the melting curve for population 1208 with melting temperatures outside this wild-type melting temperature range has multiple peaks as shown in FIG. It was found to be localized. When the fluorescence image was confirmed, this location coincided with the location where air bubbles were present. Therefore, by excluding the data of the neighboring wells where the bubbles existed, 16 wells misdetected as the G12A mutant and 1 well misdetected as the G13D mutant could be determined.
- bubbles are detected from the number of peaks in the melting curve for genotype discrimination in digital PCR, and wells in the vicinity of bubbles are removed, thereby erroneously calculating different melting temperatures. Prevents erroneous judgments and improves measurement accuracy.
- Fluorescence measurement unit 702 Central 703... Analysis unit 704... Database 705...Memory 706...Monitor 1001...Chip in cartridge 1002...Position where air bubbles are assumed to exist 1003...Melting temperature range of wild-type allele 1004...Melting temperature range of mutant allele 1005...Each calculated by melting curve analysis Microcompartment plots 1201 ... Wells containing wild type 1202 ... Wells containing G12A variant 1203 ... Wells containing G13D variant 1204 ... Melting temperature range of wild type allele 1205 ... Melting temperature range of G12A variant 1206 ... G13D variant 1207 Negative well 1208 Population with a melting temperature outside the wild-type melting temperature range 1209 Well with multiple peaks in the differential curve of the melting curve
Abstract
Description
本明細書に開示される一実施形態は、蛍光標識プローブまたはDNAインターカレーターと複数種類の検出対象のDNAとを含有するDNA溶液を複数の微小画分に分割する第1の工程と、微小画分を含む微小区画の中で核酸増幅反応を行う第2の工程と、微小区画の各において、核酸増幅反応における温度変化に伴って、蛍光標識プローブまたはDNAインターカレーターからの蛍光強度を測定する第3の工程と、測定した各蛍光強度から、検出対象のDNAの融解温度を算出する第4の工程と、気泡の影響を受けた微小区画を特定する第5の工程と、複数の微小区画で得られた総データから、気泡の影響を受けた微小区画のデータを除去する第6の工程と、を含むDNA検出方法である。以下、このDNA検出方法を、図1~7の模式図を参考にして、具体的に説明する。 (1) DNA detection method One embodiment disclosed in the present specification divides a DNA solution containing fluorescently labeled probes or DNA intercalators and multiple types of DNA to be detected into multiple microfractions. a second step of performing a nucleic acid amplification reaction in a microcompartment containing a microfraction; a third step of measuring the fluorescence intensity, a fourth step of calculating the melting temperature of the DNA to be detected from each measured fluorescence intensity, and a fifth step of identifying the microcompartment affected by the air bubble; and a sixth step of removing data of microcompartments affected by air bubbles from the total data obtained in the plurality of microcompartments. This DNA detection method will be specifically described below with reference to the schematic diagrams of FIGS.
本工程においては、蛍光標識プローブまたはDNAインターカレーターと複数種類の検出対象のDNAとを含有する検体溶液を複数の微小画分に分割する。 (First step)
In this step, a sample solution containing a fluorescence-labeled probe or DNA intercalator and multiple types of DNAs to be detected is divided into a plurality of minute fractions.
本工程においては、微小画分を含む各微小区画の中で核酸増幅反応を行う。核酸増幅反応は、いわゆるPCR、特にデジタルPCRであることが好ましい。 (Second step)
In this step, a nucleic acid amplification reaction is performed in each microcompartment containing microfractions. The nucleic acid amplification reaction is preferably so-called PCR, especially digital PCR.
本工程においては、微小区画の各において、温度変化に伴って、蛍光標識プローブまたはDNAインターカレーターからの蛍光強度を測定する。この温度変化は、核酸増幅反応中での温度変化を利用してもよく、核酸増幅反応とは独立に(例えば、核酸増幅反応完了後に)、検体溶液を昇温させることによって行ってもよい。また、この工程で使用する蛍光標識プローブまたはDNAインターカレーターは、PCRのための蛍光標識プローブまたはDNAインターカレーターと共用してもよいが、PCRのための蛍光標識プローブまたはDNAインターカレーターとは別のものを用いてもよい。 (Third step)
In this step, the fluorescence intensity from the fluorescent-labeled probe or DNA intercalator is measured in each of the microcompartments as the temperature changes. This temperature change may be achieved by utilizing the temperature change during the nucleic acid amplification reaction, or by raising the temperature of the specimen solution independently of the nucleic acid amplification reaction (for example, after completion of the nucleic acid amplification reaction). In addition, the fluorescently labeled probe or DNA intercalator used in this step may be used in common with the fluorescently labeled probe or DNA intercalator for PCR. You can use things.
本工程においては、測定した各蛍光強度から、検出対象のDNAの融解温度を算出する。融解温度の算出方法は特に限定されず、蛍光強度と温度の関数を得て、その関数の導関数を求め、極大値を取る温度を計算によって求めて、融解温度としてもよい。あるいは、蛍光強度と温度の関数をグラフにプロットして融解曲線(すなわち温度変化に対する蛍光強度変化を表す曲線)を作成し、さらに蛍光強度を温度で微分した結果の微分曲線を作成し、そのピークに対応する温度を融解温度としてもよい。融解曲線の一例を図4Aに示し、この融解曲線から得られる微分曲線を図4Bに示す。融解曲線の変曲点に対応する温度が、微分曲線のピークに対応し、DNA二重鎖の融解温度401として算出されている。なお、対象遺伝子を検出するための蛍光標識プローブの融解温度は、蛍光標識プローブの設計時に公知技術に基づいて調節可能である。たとえば、プローブの配列や鎖長を変えることで調節することができる。または、Peptide Nucleic Acid(PNA)やLocked Nucleic Acid(LNA)のような人工DNAを利用することで調節することもできる。 (Fourth step)
In this step, the melting temperature of the DNA to be detected is calculated from each measured fluorescence intensity. The method of calculating the melting temperature is not particularly limited, and the function of fluorescence intensity and temperature may be obtained, the derivative of the function may be obtained, and the temperature at which the maximum value is obtained may be calculated and used as the melting temperature. Alternatively, plot the function of fluorescence intensity and temperature on a graph to create a melting curve (i.e., a curve representing changes in fluorescence intensity with respect to temperature changes). may be used as the melting temperature. An example of a melting curve is shown in FIG. 4A, and a differential curve obtained from this melting curve is shown in FIG. 4B. The temperature corresponding to the inflection point of the melting curve corresponds to the peak of the differential curve and is calculated as the
本工程においては、第4の工程で算出した融解温度から気泡の影響を受けた微小区画を特定する。 (Fifth step)
In this step, the microsection affected by the bubble is specified from the melting temperature calculated in the fourth step.
本工程においては、複数の微小区画で得られた総データから、気泡の影響を受けた微小区画のデータを除去する。 (Sixth step)
In this step, the data of microcompartments affected by air bubbles are removed from the total data obtained from a plurality of microcompartments.
本明細書に開示のDNA検出システムは、DNA溶液中の対象遺伝子を検出することを目的とし、蛍光標識プローブまたはDNAインターカレーターを含有するDNA溶液を入れるための複数の微小区画を有する第1の装置と、第1の装置の画像を撮像するための第2の装置と、微小区画において核酸増幅反応を行うために、微小区画の温度を調整するための第3の装置と、微小区画において、温度変化に伴って変化する蛍光強度を取得するために、撮像装置に画像を撮像させる、撮像装置を制御するための第4の装置と、取得された微小区画の蛍光強度から、気泡の発生を検知するための第5の装置と、を備える。このDNA検出システムは、上述したDNA検出方法を実行する。 (2) DNA detection system The DNA detection system disclosed herein aims to detect a gene of interest in a DNA solution, and includes a plurality of microscopic particles for containing a DNA solution containing fluorescently labeled probes or DNA intercalators. A first device having a compartment, a second device for capturing an image of the first device, and a third device for adjusting the temperature of the microcompartment to perform a nucleic acid amplification reaction in the microcompartment. and a fourth device for controlling the imaging device to capture an image in order to acquire the fluorescence intensity that changes with temperature change in the microcompartment, and the acquired fluorescence intensity of the microcompartment. , and a fifth device for detecting the generation of air bubbles. This DNA detection system implements the DNA detection method described above.
上述したようなDNA検出システムを用いた、DNAを検出する方法の一実施形態を、図8及び図9を用いて以下に述べる。本実施形態では、核酸増幅反応における蛍光強度の変化を、DNAの融解温度の特定に利用する。また、融解温度の特定に、融解曲線および微分曲線を用いる。 (3) DNA Detection Method Using DNA Detection System An embodiment of a DNA detection method using the DNA detection system described above will be described below with reference to FIGS. 8 and 9. FIG. In this embodiment, the change in fluorescence intensity in the nucleic acid amplification reaction is used to identify the melting temperature of DNA. A melting curve and a differential curve are also used to identify the melting temperature.
融解曲線分析を用いたデジタルPCRでは、蛍光標識プローブとDNAとの融解温度が対象遺伝子によって異なることを利用し、複数の対象遺伝子の判別を行うことができる。例えば、対象遺伝子として、野生型アレルと変異型アレルの複数種類が含まれている場合が例示できるが、複数種類の対象遺伝子は、特にこれらに限定されない。 (4) Method for detecting multiple target genes In digital PCR using melting curve analysis, multiple target genes can be discriminated by utilizing the fact that the melting temperatures of fluorescently labeled probes and DNA differ depending on the target gene. . For example, the target gene may include multiple types of wild-type alleles and mutant alleles, but the multiple types of target genes are not particularly limited to these.
本開示の実施形態は、DNA検出システムにDNA検出方法を行わせるためのプログラムである。また、本発明のさらに別の実施形態は、上記プログラムを格納する記録媒体である。 (5) Program An embodiment of the present disclosure is a program for causing a DNA detection system to perform a DNA detection method. Further, still another embodiment of the present invention is a recording medium storing the above program.
102…蛍光標識プローブ
103…蛍光色素
104…クエンチャー
201…ドロップレット
202…ドロップレット補足用のくぼみ
203…オイル
204…カートリッジ
205…気泡
301…PCR反応液
302…貫通穴チップ
303…オイル
304…カートリッジ
305…気泡
401…融解温度
501…野生型アレルの融解温度
502…変異型アレルの融解温度
503,504…誤って算出された融解温度
601,602,611…ドロップレット
603…マイクロ流路
604…光源
605…蛍光フィルター
607…撮像装置
608…レンズ
609…ダイクロイックミラー
610…ドロップレット検出用カートリッジ
612…温調ステージ
613…カートリッジ
614,615…ウェル
701…蛍光測定部
702…コンピューター
703…解析部
704…データベース
705…メモリー
706…モニター
1001…カートリッジ内のチップ
1002…気泡が存在すると推定された場所
1003…野生型アレルの融解温度範囲
1004…変異型アレルの融解温度範囲
1005…融解曲線分析により算出された各微小区画のプロット
1201…野生型を含むウェル
1202…G12A変異型を含むウェル
1203…G13D変異型を含むウェル
1204…野生型アレルの融解温度範囲
1205…G12A変異型の融解温度範囲
1206…G13D変異型の融解温度範囲
1207…ネガティブウェル
1208…野生型の融解温度範囲から外れた融解温度をもつ集団
1209…融解曲線の微分曲線が多数ピークをもつウェル 101 DNA
DESCRIPTION OF
Claims (11)
- 蛍光標識プローブまたはDNAインターカレーターと複数種類の検出対象のDNAとを含有する検体溶液を複数の微小画分に分割する第1の工程と、
前記微小画分を含む微小区画の中で核酸増幅反応を行う第2の工程と、
前記微小区画の各において、温度変化に伴って、前記蛍光標識プローブまたは前記DNAインターカレーターからの蛍光強度を測定する第3の工程と、
前記測定した各蛍光強度から、前記検出対象のDNAの融解温度を算出する第4の工程と、
気泡の影響を受けた前記微小区画を特定する第5の工程と、
前記複数の微小区画で得られた総データから、前記気泡の影響を受けた前記微小区画のデータを除去する第6の工程と、
を含む、DNA検出方法。 a first step of dividing a specimen solution containing a fluorescently labeled probe or DNA intercalator and multiple types of DNA to be detected into a plurality of minute fractions;
a second step of conducting a nucleic acid amplification reaction in a microcompartment comprising said microfraction;
a third step of measuring the fluorescence intensity from the fluorescent-labeled probe or the DNA intercalator as the temperature changes in each of the microcompartments;
a fourth step of calculating the melting temperature of the DNA to be detected from the measured fluorescence intensities;
a fifth step of identifying the microcompartments affected by air bubbles;
a sixth step of removing data for said microcompartments affected by said bubbles from the total data obtained for said plurality of microcompartments;
A DNA detection method comprising: - 第5の工程において、前記気泡の影響を受けた前記微小区画として、第3の工程において測定された各蛍光強度から作成された融解曲線の微分曲線のピーク数が所定値以上である微小区画が特定される、請求項1に記載のDNA検出方法。 In the fifth step, the micro-compartments affected by the bubbles are micro-compartments in which the number of peaks of the differential curve of the melting curve created from the fluorescence intensities measured in the third step is equal to or greater than a predetermined value. 2. The DNA detection method of claim 1, wherein:
- 第5の工程において、隣接する2以上の前記微小区画が、前記気泡の影響を受けた前記微小区画として特定された場合に、第6の工程において、当該隣接する2以上の前記微小区画のデータが除去され、かつ
第5の工程において、単独の前記微小区画が、前記気泡の影響を受けた前記微小区画として特定された場合に、第6の工程において、当該単独の前記微小区画のデータが除去されない、請求項1または2に記載のDNA検出方法。 In the fifth step, when the two or more adjacent micro-compartments are identified as the micro-compartments affected by the bubble, in the sixth step, the data of the two or more adjacent micro-compartments is removed, and in the fifth step, if a single micro-compartment is identified as the micro-compartment affected by the bubble, then in the sixth step, data for the single micro-compartment is 3. The DNA detection method according to claim 1 or 2, which is not removed. - 第5の工程において、前記気泡の影響を受けた前記微小区画が、前記微小区画の画像の解析によって特定される、請求項1に記載のDNA検出方法。 The DNA detection method according to claim 1, wherein in a fifth step, the microcompartments affected by the air bubbles are identified by analysis of images of the microcompartments.
- 第5の工程において、第3の工程において測定された各蛍光強度から作成された融解曲線の微分曲線のピーク数が所定値以上である微小区画が選択され、前記選択された微小区画の画像の解析によって前記気泡の影響を受けているかどうかが確認されることによって、前記気泡の影響を受けた前記微小区画が特定される、請求項1に記載のDNA検出方法。 In the fifth step, a microsection is selected in which the number of peaks of the differential curve of the melting curve created from the fluorescence intensities measured in the third step is equal to or greater than a predetermined value, and an image of the selected microsection is obtained. 2. The DNA detection method of claim 1, wherein the analysis identifies the microcompartment affected by the air bubble by confirming whether it is affected by the air bubble.
- 第5の工程において、隣接する2以上の前記微小区画において、前記微分曲線のピーク数が所定値以上である微小区画が選択され、かつ
第5の工程において、単独の前記微小区画において、前記微分曲線のピーク数が所定値以上である微小区画は選択されない、請求項5に記載のDNA検出方法。 In the fifth step, among two or more adjacent microsections, a microsection having a peak number of the differential curve equal to or greater than a predetermined value is selected; and in the fifth step, in the single microsection, the differential 6. A DNA detection method according to claim 5, wherein microcompartments whose curve has a number of peaks greater than or equal to a predetermined value are not selected. - 第1の工程において、前記DNA溶液は限界希釈されている、請求項1~6のいずれか1項に記載のDNA検出方法。 The DNA detection method according to any one of claims 1 to 6, wherein in the first step, the DNA solution is limitedly diluted.
- 第4の工程において、前記各微小区画において、前記融解温度に基づき前記複数の検出対象のDNAの種類が判別され、
第5の工程において、種類が判別された前記DNAの各種類について、さらに所定の基準融解温度を表す情報に基づいて前記微小区画が特定される、請求項1~7のいずれか1項に記載のDNA検出方法。 In a fourth step, in each microcompartment, the types of the plurality of DNAs to be detected are determined based on the melting temperature;
8. The microcompartment according to any one of claims 1 to 7, wherein, in the fifth step, for each type of the DNA whose type has been determined, the microcompartment is further specified based on information representing a predetermined reference melting temperature. DNA detection method. - 前記微小区画は、アレイ状に配列されたウェル、またはオイル中に分散するドロップレットによって構成される、請求項1~8のいずれか1項に記載のDNA検出方法。 The DNA detection method according to any one of claims 1 to 8, wherein the microcompartments are composed of wells arranged in an array or droplets dispersed in oil.
- 第4の工程において、前記融解温度は、第3の工程において測定された各蛍光強度から作成された融解曲線の変曲点として算出される、請求項1~9のいずれか1項に記載のDNA検出方法。 10. The method according to any one of claims 1 to 9, wherein in the fourth step, the melting temperature is calculated as an inflection point of a melting curve created from each fluorescence intensity measured in the third step. DNA detection method.
- 蛍光標識プローブまたはDNAインターカレーターを含有するDNA溶液を入れるための複数の微小区画を有する第1の装置と、
第1の装置の画像を撮像するための第2の装置と、
前記微小区画において核酸増幅反応を行うために、前記微小区画の温度を調整するための第3の装置と、
前記微小区画において、温度変化に伴って変化する蛍光強度を取得するために、前記撮像装置に画像を撮像させる、撮像装置を制御するための第4の装置と、
取得された前記微小区画の前記蛍光強度から、気泡の発生を検知するための第5の装置と、
を備えたDNA検出システム。 a first device having a plurality of microcompartments for containing DNA solutions containing fluorescently labeled probes or DNA intercalators;
a second device for capturing an image of the first device;
a third device for adjusting the temperature of the microcompartment to conduct a nucleic acid amplification reaction in the microcompartment;
a fourth device for controlling an imaging device, causing the imaging device to capture an image to obtain a fluorescence intensity that varies with temperature in the microcompartment;
a fifth device for detecting bubble generation from the acquired fluorescence intensity of the microcompartments;
A DNA detection system comprising:
Priority Applications (4)
| Application Number | Priority Date | Filing Date | Title |
|---|---|---|---|
| EP21944442.9A EP4353810A1 (en) | 2021-06-07 | 2021-06-07 | Dna detection method and dna detection system |
| JP2023527177A JPWO2022259334A1 (en) | 2021-06-07 | 2021-06-07 | |
| CN202180099075.8A CN117642516A (en) | 2021-06-07 | 2021-06-07 | DNA detection method and DNA detection system |
| PCT/JP2021/021633 WO2022259334A1 (en) | 2021-06-07 | 2021-06-07 | Dna detection method and dna detection system |
Applications Claiming Priority (1)
| Application Number | Priority Date | Filing Date | Title |
|---|---|---|---|
| PCT/JP2021/021633 WO2022259334A1 (en) | 2021-06-07 | 2021-06-07 | Dna detection method and dna detection system |
Publications (1)
| Publication Number | Publication Date |
|---|---|
| WO2022259334A1 true WO2022259334A1 (en) | 2022-12-15 |
Family
ID=84425015
Family Applications (1)
| Application Number | Title | Priority Date | Filing Date |
|---|---|---|---|
| PCT/JP2021/021633 WO2022259334A1 (en) | 2021-06-07 | 2021-06-07 | Dna detection method and dna detection system |
Country Status (4)
| Country | Link |
|---|---|
| EP (1) | EP4353810A1 (en) |
| JP (1) | JPWO2022259334A1 (en) |
| CN (1) | CN117642516A (en) |
| WO (1) | WO2022259334A1 (en) |
Citations (6)
| Publication number | Priority date | Publication date | Assignee | Title |
|---|---|---|---|---|
| US4683195A (en) | 1986-01-30 | 1987-07-28 | Cetus Corporation | Process for amplifying, detecting, and/or-cloning nucleic acid sequences |
| US4800159A (en) | 1986-02-07 | 1989-01-24 | Cetus Corporation | Process for amplifying, detecting, and/or cloning nucleic acid sequences |
| JP2013521764A (en) | 2010-02-12 | 2013-06-13 | レインダンス テクノロジーズ, インコーポレイテッド | Digital specimen analysis |
| JP2018108063A (en) | 2017-01-05 | 2018-07-12 | 株式会社日立製作所 | Droplet digital pcr measuring method and measuring device |
| JP2020150824A (en) * | 2019-03-19 | 2020-09-24 | 株式会社日立製作所 | Digital pcr measurement device |
| WO2020261858A1 (en) * | 2019-06-26 | 2020-12-30 | 株式会社日立製作所 | Measurement method and measurement device for digital pcr |
-
2021
- 2021-06-07 JP JP2023527177A patent/JPWO2022259334A1/ja active Pending
- 2021-06-07 EP EP21944442.9A patent/EP4353810A1/en active Pending
- 2021-06-07 WO PCT/JP2021/021633 patent/WO2022259334A1/en active Application Filing
- 2021-06-07 CN CN202180099075.8A patent/CN117642516A/en active Pending
Patent Citations (7)
| Publication number | Priority date | Publication date | Assignee | Title |
|---|---|---|---|---|
| US4683195A (en) | 1986-01-30 | 1987-07-28 | Cetus Corporation | Process for amplifying, detecting, and/or-cloning nucleic acid sequences |
| US4683195B1 (en) | 1986-01-30 | 1990-11-27 | Cetus Corp | |
| US4800159A (en) | 1986-02-07 | 1989-01-24 | Cetus Corporation | Process for amplifying, detecting, and/or cloning nucleic acid sequences |
| JP2013521764A (en) | 2010-02-12 | 2013-06-13 | レインダンス テクノロジーズ, インコーポレイテッド | Digital specimen analysis |
| JP2018108063A (en) | 2017-01-05 | 2018-07-12 | 株式会社日立製作所 | Droplet digital pcr measuring method and measuring device |
| JP2020150824A (en) * | 2019-03-19 | 2020-09-24 | 株式会社日立製作所 | Digital pcr measurement device |
| WO2020261858A1 (en) * | 2019-06-26 | 2020-12-30 | 株式会社日立製作所 | Measurement method and measurement device for digital pcr |
Non-Patent Citations (1)
| Title |
|---|
| GENOME RES., vol. 10, 1996, pages 986 - 994 |
Also Published As
| Publication number | Publication date |
|---|---|
| JPWO2022259334A1 (en) | 2022-12-15 |
| CN117642516A (en) | 2024-03-01 |
| EP4353810A1 (en) | 2024-04-17 |
Similar Documents
| Publication | Publication Date | Title |
|---|---|---|
| US20220364164A1 (en) | Digital pcr measurement method and measurement device | |
| US10767218B2 (en) | Method for reducing quantification errors caused by reaction volume deviations in digital polymerase chain reaction | |
| WO2019239805A1 (en) | Digital pcr measurement method and measurement device | |
| JP6754301B2 (en) | Droplet digital PCR measurement method and measuring device | |
| KR20200115552A (en) | Methods and compositions for separate melt analysis | |
| CN113891943A (en) | Comparative analysis of microsatellites by Capillary Electrophoresis (CE) DNA mapping | |
| US20180230515A1 (en) | Method for reducing quantification errors caused by an optical artifact in digital polymerase chain reaction | |
| WO2022259334A1 (en) | Dna detection method and dna detection system | |
| JP6812431B2 (en) | DNA detection method and equipment for that | |
| WO2019128081A1 (en) | Method for detecting and analyzing dna | |
| JP7432622B2 (en) | DNA detection method and DNA detection system | |
| JP7016382B2 (en) | Droplet digital PCR measurement method and measuring device | |
| JP2016189704A (en) | Method for detecting gene mutation, and fluorescent-labeled oligonucleotide used for the same | |
| WO2023248310A1 (en) | Primer, dna detection method, and dna detection kit | |
| WO2023067077A1 (en) | High stokes shift fluorescence dyes for multiplex detection | |
| KR20200037020A (en) | Multiplex identification method of pcr product using fluorescence-based multiple melting analysis | |
| Guo | Molecular Diagnostic Techniques | |
| JP2016171763A (en) | Guarantee method for gene analysis system |
Legal Events
| Date | Code | Title | Description |
|---|---|---|---|
| 121 | Ep: the epo has been informed by wipo that ep was designated in this application |
Ref document number: 21944442 Country of ref document: EP Kind code of ref document: A1 |
|
| WWE | Wipo information: entry into national phase |
Ref document number: 2023527177 Country of ref document: JP |
|
| WWE | Wipo information: entry into national phase |
Ref document number: 2021944442 Country of ref document: EP |
|
| NENP | Non-entry into the national phase |
Ref country code: DE |
|
| ENP | Entry into the national phase |
Ref document number: 2021944442 Country of ref document: EP Effective date: 20240108 |