WO2022091175A1 - 医療装置、及び、画像生成方法 - Google Patents
医療装置、及び、画像生成方法 Download PDFInfo
- Publication number
- WO2022091175A1 WO2022091175A1 PCT/JP2020/040073 JP2020040073W WO2022091175A1 WO 2022091175 A1 WO2022091175 A1 WO 2022091175A1 JP 2020040073 W JP2020040073 W JP 2020040073W WO 2022091175 A1 WO2022091175 A1 WO 2022091175A1
- Authority
- WO
- WIPO (PCT)
- Prior art keywords
- image
- organ
- current
- generation unit
- medical device
- Prior art date
- Legal status (The legal status is an assumption and is not a legal conclusion. Google has not performed a legal analysis and makes no representation as to the accuracy of the status listed.)
- Ceased
Links
Images







Classifications
-
- A—HUMAN NECESSITIES
- A61—MEDICAL OR VETERINARY SCIENCE; HYGIENE
- A61B—DIAGNOSIS; SURGERY; IDENTIFICATION
- A61B5/00—Measuring for diagnostic purposes; Identification of persons
- A61B5/0033—Features or image-related aspects of imaging apparatus, e.g. for MRI, optical tomography or impedance tomography apparatus; Arrangements of imaging apparatus in a room
- A61B5/0035—Features or image-related aspects of imaging apparatus, e.g. for MRI, optical tomography or impedance tomography apparatus; Arrangements of imaging apparatus in a room adapted for acquisition of images from more than one imaging mode, e.g. combining MRI and optical tomography
-
- A—HUMAN NECESSITIES
- A61—MEDICAL OR VETERINARY SCIENCE; HYGIENE
- A61B—DIAGNOSIS; SURGERY; IDENTIFICATION
- A61B5/00—Measuring for diagnostic purposes; Identification of persons
- A61B5/0033—Features or image-related aspects of imaging apparatus, e.g. for MRI, optical tomography or impedance tomography apparatus; Arrangements of imaging apparatus in a room
- A61B5/004—Features or image-related aspects of imaging apparatus, e.g. for MRI, optical tomography or impedance tomography apparatus; Arrangements of imaging apparatus in a room adapted for image acquisition of a particular organ or body part
-
- A—HUMAN NECESSITIES
- A61—MEDICAL OR VETERINARY SCIENCE; HYGIENE
- A61B—DIAGNOSIS; SURGERY; IDENTIFICATION
- A61B5/00—Measuring for diagnostic purposes; Identification of persons
- A61B5/0033—Features or image-related aspects of imaging apparatus, e.g. for MRI, optical tomography or impedance tomography apparatus; Arrangements of imaging apparatus in a room
- A61B5/004—Features or image-related aspects of imaging apparatus, e.g. for MRI, optical tomography or impedance tomography apparatus; Arrangements of imaging apparatus in a room adapted for image acquisition of a particular organ or body part
- A61B5/0044—Features or image-related aspects of imaging apparatus, e.g. for MRI, optical tomography or impedance tomography apparatus; Arrangements of imaging apparatus in a room adapted for image acquisition of a particular organ or body part for the heart
-
- A—HUMAN NECESSITIES
- A61—MEDICAL OR VETERINARY SCIENCE; HYGIENE
- A61B—DIAGNOSIS; SURGERY; IDENTIFICATION
- A61B5/00—Measuring for diagnostic purposes; Identification of persons
- A61B5/05—Detecting, measuring or recording for diagnosis by means of electric currents or magnetic fields; Measuring using microwaves or radio waves
- A61B5/053—Measuring electrical impedance or conductance of a portion of the body
- A61B5/0536—Impedance imaging, e.g. by tomography
-
- A—HUMAN NECESSITIES
- A61—MEDICAL OR VETERINARY SCIENCE; HYGIENE
- A61B—DIAGNOSIS; SURGERY; IDENTIFICATION
- A61B5/00—Measuring for diagnostic purposes; Identification of persons
- A61B5/05—Detecting, measuring or recording for diagnosis by means of electric currents or magnetic fields; Measuring using microwaves or radio waves
- A61B5/055—Detecting, measuring or recording for diagnosis by means of electric currents or magnetic fields; Measuring using microwaves or radio waves involving electronic [EMR] or nuclear [NMR] magnetic resonance, e.g. magnetic resonance imaging
-
- A—HUMAN NECESSITIES
- A61—MEDICAL OR VETERINARY SCIENCE; HYGIENE
- A61B—DIAGNOSIS; SURGERY; IDENTIFICATION
- A61B5/00—Measuring for diagnostic purposes; Identification of persons
- A61B5/24—Detecting, measuring or recording bioelectric or biomagnetic signals of the body or parts thereof
- A61B5/242—Detecting biomagnetic fields, e.g. magnetic fields produced by bioelectric currents
-
- A—HUMAN NECESSITIES
- A61—MEDICAL OR VETERINARY SCIENCE; HYGIENE
- A61B—DIAGNOSIS; SURGERY; IDENTIFICATION
- A61B5/00—Measuring for diagnostic purposes; Identification of persons
- A61B5/24—Detecting, measuring or recording bioelectric or biomagnetic signals of the body or parts thereof
- A61B5/316—Modalities, i.e. specific diagnostic methods
- A61B5/318—Heart-related electrical modalities, e.g. electrocardiography [ECG]
- A61B5/367—Electrophysiological study [EPS], e.g. electrical activation mapping or electro-anatomical mapping
-
- A—HUMAN NECESSITIES
- A61—MEDICAL OR VETERINARY SCIENCE; HYGIENE
- A61B—DIAGNOSIS; SURGERY; IDENTIFICATION
- A61B5/00—Measuring for diagnostic purposes; Identification of persons
- A61B5/74—Details of notification to user or communication with user or patient; User input means
- A61B5/742—Details of notification to user or communication with user or patient; User input means using visual displays
- A61B5/7425—Displaying combinations of multiple images regardless of image source, e.g. displaying a reference anatomical image with a live image
-
- A—HUMAN NECESSITIES
- A61—MEDICAL OR VETERINARY SCIENCE; HYGIENE
- A61B—DIAGNOSIS; SURGERY; IDENTIFICATION
- A61B2562/00—Details of sensors; Constructional details of sensor housings or probes; Accessories for sensors
- A61B2562/02—Details of sensors specially adapted for in-vivo measurements
- A61B2562/0223—Magnetic field sensors
-
- A—HUMAN NECESSITIES
- A61—MEDICAL OR VETERINARY SCIENCE; HYGIENE
- A61B—DIAGNOSIS; SURGERY; IDENTIFICATION
- A61B2562/00—Details of sensors; Constructional details of sensor housings or probes; Accessories for sensors
- A61B2562/04—Arrangements of multiple sensors of the same type
- A61B2562/046—Arrangements of multiple sensors of the same type in a matrix array
-
- A—HUMAN NECESSITIES
- A61—MEDICAL OR VETERINARY SCIENCE; HYGIENE
- A61B—DIAGNOSIS; SURGERY; IDENTIFICATION
- A61B5/00—Measuring for diagnostic purposes; Identification of persons
- A61B5/74—Details of notification to user or communication with user or patient; User input means
- A61B5/742—Details of notification to user or communication with user or patient; User input means using visual displays
- A61B5/743—Displaying an image simultaneously with additional graphical information, e.g. symbols, charts, function plots
Definitions
- the present invention relates to a medical device and an image generation method.
- Patent Document 1 and Patent Document 2 The technique of visually expressing the state of organs in the living body is known.
- the current vector flowing through the heart is estimated from the measurement result of the heart, and the heart model is displayed with an arrow indicating the current vector and a color display (color map display).
- the technology is disclosed.
- the present invention has been made to solve the above-mentioned problems, and an object of the present invention is to improve a technique for displaying the state of an organ including a lesion.
- the present invention has been made to solve at least a part of the above-mentioned problems, and can be realized as the following forms.
- a medical device includes an image information acquisition unit that acquires image information including an MRI image or a CT image of an organ in a living body, and a biomagnetic current information acquisition unit that acquires biomagnetic current information obtained from a biomagnetic current generated by the organ.
- a model image generation unit that generates an organ model image representing the organ in three dimensions or two dimensions using the image information, and a change over time of a current flowing through each position of the organ, that is, the biomagnetic field.
- the medical device superimposes a composite image in which an organ model image showing an organ in three or two dimensions and a cardiac current image showing a change over time in the current flowing at each position of the organ are superimposed. Generate. Therefore, the surgeon can intuitively recognize the change in the current flowing through each position of the organ by using the synthetic image.
- the cardiac current image of the composite image is an image showing the change with time of the current flowing through each position of the organ by the change of the color attribute. Therefore, as compared with the conventional arrow display representing the current vector, there is no possibility that the arrow representing the current vector obstructs the operator's field of view and hinders the operator when confirming the state of the organ. As a result, the time required for finding a lesion (arrhythmia, etc.) can be shortened, and the efficiency and safety of the procedure can be improved.
- the cardiac current image generation unit expresses the change in the color attribute by changing any one of hue, saturation, lightness, and a combination thereof. You may. According to this configuration, the cardiac current image generator generates a cardiac current image that expresses changes in color attributes by changing any of hue, saturation, lightness, and a combination thereof. .. Therefore, the surgeon can more intuitively recognize the change in the current flowing through each position of the organ.
- the cardiac current image generation unit has a hue and saturation of each position of the organ at a predetermined time corresponding to a portion in which a relatively high current is flowing. , And at least one of the lightnesses may be higher than the other parts at the same time to generate the cardiac current image.
- the cardiac current image generator has at least one of the hue, saturation, and lightness of the part corresponding to the part where the relatively high current is flowing higher than the other parts. Generate a cardiac current image. Therefore, the surgeon can more intuitively recognize the change in the current flowing through each position of the organ.
- the cardiac current image generation unit changes the color attribute in the first pattern when the current value increases with time at a certain position of the organ.
- the core current image in which the color attribute is changed by a second pattern different from the first pattern may be generated.
- the cardiac current image generator changes the color attribute in the first pattern when the current value rises with time at a certain position of the organ, and changes the color attribute with time when the current value falls with time.
- a cardiac current image in which the color attribute is changed by the second pattern is generated. Therefore, the surgeon can intuitively recognize whether the current value at a certain position of the organ tends to increase or decrease depending on the pattern of change in the color attribute.
- the biomagnetic field information includes information on the magnetic field intensity distribution of the biomagnetic field generated by the organ, and further, using the biomagnetic field information, each of the organs.
- a magnetic field intensity distribution image generation unit that generates a magnetic field intensity distribution image representing the strength of the biomagnetic field at a position is provided, and the synthetic image generation unit further includes the magnetic field strength in addition to the organ model image and the cardiac current image.
- a composite image in which a distribution image is superimposed may be generated. According to this configuration, the composite image generation unit generates a composite image in which the magnetic field intensity distribution image is superimposed in addition to the organ model image and the cardiac current image. Therefore, the surgeon can recognize the strength of the biological magnetic field at each position of the organ by using the magnetic field strength distribution image of the composite image, and can further improve the efficiency and safety of the procedure.
- an image generation method uses a step of acquiring image information including an MRI image or a CT image of an organ in a living body, a step of acquiring biomagnetic field information obtained from a biomagnetic field generated by the organ, and the image information.
- the present invention includes a step of generating a cardiac current image in which the change is represented by a change in color attribute, and a step of generating a composite image in which the organ model image and the cardiac current image are superimposed.
- the present invention can be realized in various aspects, for example, a medical device (image generation device) for generating an image for display, an image generation method, a medical system including the medical device, these devices and a system. It can be realized in the form of a manufacturing method of the above, a computer program that realizes the functions of these devices and systems, and the like.
- FIG. 1 is an explanatory diagram illustrating the configuration of the medical device 1.
- the medical device 1 is a device used for treatment or diagnosis of a living body (here, the human body) 90, and a heart current image showing a change over time of a current flowing through each position of an organ of the human body 90 by a change in color attribute is obtained. Can be generated and displayed.
- the medical device 1 includes a magnetic sensor array 10, a CT device 40, a computer 50, a monitor 60, and an operation unit 70.
- the medical device 1 used for arrhythmia treatment will be exemplified.
- the magnetic sensor array 10 is a device that detects information on a biomagnetic field generated by a human body 90 to be treated or diagnosed (hereinafter, also referred to as “biomagnetic field information”).
- the biomagnetic field information includes the strength of the biomagnetic field and the direction of the biomagnetic field.
- a plurality of magnetic sensors 11 are arranged in the magnetic sensor array 10. The plurality of magnetic sensors 11 are arranged vertically and horizontally in a matrix.
- the magnetic sensor 11 is a detection element that detects biomagnetic field information, and is, for example, a GSR (GHz-Spin-Rotation Sensor) sensor, a magnetoresistive effect element (MR), a magnetic impedance element (MI), and a superconducting quantum interference element (SUQUID) can be used.
- GSR GHz-Spin-Rotation Sensor
- MR magnetoresistive effect element
- MI magnetic impedance element
- SUQUID superconducting quantum interference element
- the magnetic sensor array 10 is arranged near the center of the bed 95 for lying down the human body 90.
- the magnetic sensor array 10 may be configured to be worn on the human body 90 during treatment or diagnosis.
- the magnetic sensor array 10 may be configured to be attached to the human body 90 at the time of treatment.
- the magnetic sensor array 10 may be configured in a band shape and may be wound around a human body 90, or may be configured in a clothing shape or a hat shape.
- the magnetic sensor 11 may be arranged along the shape of the human body 90.
- the magnetic sensor array 10 may be configured in the shape of two or more plates, and may be three-dimensionally arranged on one or both sides of the front and back surfaces of the human body and one or both sides of both sides.
- the CT (Computed Tomography) device 40 is provided with a tube that emits X-rays and an arc-shaped detector that detects X-rays inside the gantry (frame), and is a tube around the human body 90 lying on the bed 95. Generates a CT image showing the shape of the heart 91 by rotating 360 °, and outputs image information including the CT image to the computer 50.
- the medical device 1 may be provided with an MRI (Magnetic Resonance Imaging) device instead of the CT device as a device for generating an image showing the shape of an organ inside the human body 90. That is, the medical device 1 may acquire image information including an MRI image instead of image information including a CT image.
- the computer 50 is a device that controls the entire medical device 1, and is electrically connected to each of the magnetic sensor array 10, the CT device 40, the monitor 60, and the operation unit 70.
- the computer 50 includes a CPU, a ROM, and a RAM (not shown), and the computer program stored in the ROM is expanded into the RAM and realized by the CPU to generate a composite image together with the main control unit 51.
- the function with the unit 52 is realized.
- the main control unit 51 sends and receives information to and from the magnetic sensor array 10, the CT device 40, the monitor 60, and the operation unit 70, and controls the entire medical device 1.
- the main control unit 51 includes an image information acquisition unit 511 and a biomagnetic field information acquisition unit 512.
- the image information acquisition unit 511 controls the CT device 40 to acquire information including a CT image of the human body 90 (hereinafter, also referred to as “image information”).
- the biomagnetic field information acquisition unit 512 controls the magnetic sensor array 10 to acquire information (biomagnetic field information) regarding the biomagnetic field generated by the human body 90. That is, the main control unit 51 functions as a so-called console of the CT device 40 and the magnetic sensor array 10. Details of the image information acquisition unit 511 and the biomagnetic field information acquisition unit 512 will be described later.
- the composite image generation unit 52 generates an organ model image, a cardiac current image, and a composite image obtained by synthesizing these, and displays the generated composite image on the monitor 60.
- the composite image generation unit 52 includes a model image generation unit 521, a magnetic field intensity distribution image generation unit 522, and a cardiac current image generation unit 523. Details of each of these functional units will be described later.
- the monitor 60 is a display unit provided with a display screen 61, and is composed of a liquid crystal display or the like.
- the medical device 1 may include a display unit other than the monitor 60.
- the medical device 1 may include smart glasses provided with a display screen, or may include a projector that projects an image.
- the operation unit 70 is composed of any means such as a keyboard, operation buttons, a touch panel, a foot switch, and a voice recognition device. The operation unit 70 is operated when the operator switches the display content of the display screen 61.
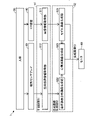
- FIG. 2 is a functional block diagram of the main control unit 51 and the composite image generation unit 52.
- FIG. 3 is an explanatory diagram of a three-dimensional organ model OM and an organ model image SI.
- FIG. 3A shows an example of a three-dimensional organ model OM
- FIG. 3B shows an example of an organ model image SI.
- the image information acquisition unit 511 of the main control unit 51 controls the CT device 40 to acquire image information including the CT image from the CT device 40 and stores it in the storage unit of the computer 50.
- the image information acquisition unit 511 takes a cross-sectional image of the entire heart 91 over time, and acquires image information including the cross-section of the entire heart 91 for each hour.
- the image information acquisition unit 511 may acquire the image information from the storage medium in which the image information acquired in advance is stored.
- the model image generation unit 521 of the main control unit 51 generates the three-dimensional organ model OM shown in FIG. 3A from the image information acquired by the image information acquisition unit 511.
- the biomagnetic field information acquisition unit 512 generates a three-dimensional organ model OM from image information including a CT image.
- the three-dimensional organ model OM is stereoscopic image data showing the external shape and the internal shape of the heart 91.
- the model image generation unit 521 integrates the cross-sectional images (consecutive plurality of CT images) of the entire heart 91 at a certain time acquired by the image information acquisition unit 511, and integrates the three-dimensional image of the heart 91 at that time. Generate an organ model OM. After that, the model image generation unit 521 integrates the three-dimensional organ model OM of the heart 91 at different times to generate a dynamic three-dimensional organ model OM that changes with the passage of time.
- the model image generation unit 521 of the synthetic image generation unit 52 captures this dynamic three-dimensional organ model OM with a virtual surface VP set at an arbitrary position, thereby expressing the heart 91 in three dimensions.
- the position and orientation of the virtual surface VP are set to any position and orientation of the operator by the operation of the operation unit 70.
- an organ model image SI showing a cross section of the three-dimensional organ model OM is generated as shown in FIG. 3 (B).
- an organ model image SI representing the appearance (outer surface) of the three-dimensional organ model OM as seen from the virtual surface VP is generated.
- the model image generation unit 521 may generate an organ model image SI in which the heart 91 is represented in two dimensions.
- the two-dimensional organ model image SI is an image showing only the surface of the portion of the three-dimensional organ model OM that intersects the virtual surface VP.
- the three-dimensional organ model image SI is an image showing not only the portion intersecting the virtual surface VP but also the portion in the depth direction of the three-dimensional organ model OM seen from the virtual surface VP.
- the dimension (two-dimensional / three-dimensional / both) of the image generated by the model image generation unit 521 can be arbitrarily set by the operator by the operation of the operation unit 70.
- the three-dimensional organ model OM contains information related to the coordinate position of the part corresponding to the specific part of the heart 91.
- the "information related to the coordinate position of the specific site of the heart 91" is, for example, information such as the position of the sinus node, the position of the atrioventricular node, the orientation of the bundle of His, and the position of the Purkinje fiber.
- Information related to the coordinate position of a specific part of the heart 91 is, for example, a contour image showing a general positional relationship of these specific parts (sinoatrial node, atrioventricular node, bundle of His, Purkinje fiber, etc.) and a model image generator. It can be obtained by fitting with the three-dimensional organ model OM generated by 521.
- FIG. 4 is a diagram schematically showing a method of acquiring biomagnetic field information by the magnetic sensor array 10.
- the biomagnetic field information acquisition unit 512 (FIG. 2) of the main control unit 51 controls the magnetic sensor array 10 to acquire biomagnetic field information and stores it in the storage unit of the computer 50.
- the biomagnetic field information includes the strength and direction of the biomagnetic field MFh generated by the organ inside the human body 90.
- an electric signal CD is generated from the sinus node in order to contract the atrium and the ventricle.
- the magnetic sensor array 10 detects the strength and direction of the biomagnetic field MFh generated by the electric signal CD, and the biomagnetic field information acquisition unit 512 acquires the strength and direction of the biomagnetic field MFh as biomagnetic field information.
- the strength and direction of the biomagnetic field MFh in the biomagnetic field information are affected by the lesion.
- the strength and orientation of the biomagnetic field MFh of an organ with a lesion is different from the strength and orientation of the biomagnetic field MFh of a healthy organ without a lesion. Therefore, the position of the lesion part of the organ can be specified by using the biomagnetic field information (compared with the biomagnetic field MFh of a healthy organ). Therefore, it can be said that the biomagnetic field information acquired by the biomagnetic field information acquisition unit 512 includes information regarding the lesion portion of the organ.
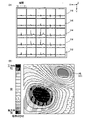
- FIG. 5 is a diagram schematically showing a method of generating a magnetic field intensity distribution image MI.
- FIG. 5A is a diagram showing an example of the strength (detection value Vd) of the biomagnetic field MFh detected by each magnetic sensor 11 of the magnetic sensor array 10.
- FIG. 5B is a diagram showing an example of the magnetic field intensity distribution image MI.
- magnetic sensors 11 are arranged in a matrix on a two-dimensional plane (XY plane). Therefore, as shown in FIG. 5A, the magnetic sensor array 10 can detect the strength (detection value Vd) of the biomagnetic field MFh at each position on the two-dimensional plane.
- FIG. 5A is a diagram schematically showing a method of generating a magnetic field intensity distribution image MI.
- FIG. 5A is a diagram showing an example of the strength (detection value Vd) of the biomagnetic field MFh detected by each magnetic sensor 11 of the magnetic sensor array 10.
- FIG. 5B is a diagram showing an example
- each magnetic sensor 11 includes a plurality of (for example, two) elements arranged in the normal direction of the two-dimensional plane, and is relatively close to the heart 91 in the normal direction (Z direction).
- the magnetic sensor array 10 can detect the strength and orientation of the biomagnetic field MFh on any virtual plane VP (XY plane) that intersects the heart 91.
- the magnetic sensor array 10 outputs biomagnetic field information including the strength of these biomagnetic field MFh detected by each magnetic sensor 11 to the biomagnetic field information acquisition unit 512.
- FIG. 6 is an explanatory diagram illustrating magnetic field intensity distribution images MI1 to MI3 on different virtual surfaces VP1 to VP3 of the heart 91.
- the magnetic field intensity distribution image generation unit 522 of the composite image generation unit 52 generates the magnetic field intensity distribution image MI shown in FIG. 5B from the biomagnetic field information acquired by the biomagnetic field information acquisition unit 512.
- FIG. 5B as an example of the magnetic field intensity distribution image MI, a magnetic field intensity distribution image MI in which the strength of the biological magnetic field MFh at each position on the two-dimensional plane (XY plane) is represented by contour lines is illustrated.
- the strength of the biomagnetic field MFh may be expressed by a method other than contour lines such as a color gradation.
- the magnetic field intensity distribution image generation unit 522 can generate a magnetic field intensity distribution image MI on an arbitrary virtual surface VP that intersects the heart 91 by using the biomagnetic field information at a certain time t1.
- the magnetic field intensity distribution images MI1, MI2, MI3 corresponding to the three virtual surfaces VP1, VP2, and VP3 at time t1 are illustrated.
- FIG. 7 is a diagram schematically showing a method of generating a three-dimensional magnetic field intensity distribution model DM.
- FIG. 7A is a diagram showing an example of magnetic field intensity distribution images MI1 to MI5 obtained from five different virtual surfaces.
- FIG. 7B is a diagram showing an example of the three-dimensional magnetic field intensity distribution model DM obtained from the magnetic field intensity distribution images MI1 to MI5.
- FIG. 7C is a diagram showing an example of a dynamic three-dimensional magnetic field intensity distribution model DM that changes with the passage of time.
- the magnetic field intensity distribution image generation unit 522 further generates magnetic field intensity distribution images MI1 to MI5 (consecutive plurality of magnetic field intensity distribution images MI) at a certain time t1 generated as described above.
- the magnetic field intensity distribution image generation unit 522 integrates the three-dimensional magnetic field intensity distribution model DM of the heart 91 at different times t1 to tun (n is a natural number) to time. Generates a dynamic three-dimensional magnetic field intensity distribution model DM that changes with the passage of time.
- the magnetic field intensity distribution image generation unit 522 may generate a two-dimensional magnetic field intensity distribution image MI.
- the two-dimensional magnetic field intensity distribution image MI is an image showing only the magnetic field intensity distribution of the portion intersecting the virtual surface VP in the three-dimensional magnetic field intensity distribution model DM.
- the three-dimensional magnetic field intensity distribution image MI shows the magnetic field intensity distribution of the entire three-dimensional magnetic field intensity distribution model DM seen from the virtual surface VP, or the part of the three-dimensional magnetic field intensity distribution model DM included in an arbitrary spatial region. It is an image to represent. Therefore, the depth direction of the magnetic field intensity distribution is also represented in the three-dimensional magnetic field intensity distribution image MI.
- the dimension (two-dimensional / three-dimensional / both) of the image generated by the magnetic field intensity distribution image generation unit 522 can be arbitrarily set by the operator by the operation of the operation unit 70.
- the three-dimensional magnetic field intensity distribution model DM includes information on the direction and strength of the biological magnetic field MFh, as well as information related to the coordinate position of the portion corresponding to the specific part of the heart 91.
- Information related to the coordinate position of a specific part of the heart 91 includes information such as the position of the sinus node, the position of the atrioventricular node, the orientation of the bundle of His, and the position of the Purkinje fiber, as in the three-dimensional organ model OM. can.
- Information related to the coordinate position of a specific part of the heart 91 can be specified, for example, from the change in the magnetic field caused by the electric signal CD.
- the sinoatrial node is the origin of the electrical signal CD and the atrioventricular node is the relay point of the electrical signal CD, it should be specified from the position where the electrical signal CD is generated and the direction in which the electrical signal flows. Can be done.
- FIG. 8 is a diagram schematically showing a method of acquiring a change with time of the current EV flowing through the heart 91.
- FIG. 8A shows an example of an electric signal CD flowing through the heart 91 at a certain time t1 to t10 and a current EV (t1-t10) at that time.
- FIG. 8B shows an example of the electric signal CD flowing through the heart 91 at the next time t11 to t20 and the current EV (t11-t20) at that time.
- FIG. 8C shows an example of the electric signal CD flowing through the heart 91 at the next time t21 to t30 and the current EV (t21-t30) at that time.
- the cardiac current image generation unit 523 of the composite image generation unit 52 is a three-dimensional magnetic field intensity distribution model DM (dynamic three-dimensional change with the passage of time) generated by the method of FIG. 7 from the magnetic field intensity distribution image generation unit 522.
- DM magnetic field intensity distribution model
- a local current is generally generated from the sinus node SN to the atrioventricular node AN as shown in the left figure of FIG. 8 (A) with the movement (beating) of the heart 91 over time.
- Electric signal CD is generated
- current is transmitted from the atrioventricular node AN to the His bundle HB as shown in the left figure of FIG. 8 (B) (electric signal CD is generated), and as shown in the left figure of FIG.
- the cardiac current image generation unit 523 uses a three-dimensional magnetic field intensity distribution model DM (a dynamic three-dimensional magnetic field intensity distribution model DM that changes with the passage of time) and follows a well-known physical law such as Maxwell's equations.
- the time-dependent change of the electric signal CD at each position of the heart 91 in other words, the time-dependent change EV (t1-t30) of the current EV flowing through each position of the heart 91 can be obtained (FIGS. 8A to 8 (A) to (FIG. 8) to (A). C) Right figure).
- the times t1 to t30 are listed for convenience, but in the following description, the times t1 to tun (n is a natural number) will be illustrated.
- the cardiac current image generation unit 523 indirectly obtains the temporal change EV (t1-tn) of the current EV flowing through each position of the heart 91 from the biomagnetic field information (via the three-dimensional magnetic field intensity distribution model DM). Can be obtained.
- the heart current image generation unit 523 may acquire the time-dependent change EV (t1-tn) of the current EV flowing through each position of the heart 91 by another method.
- the cardiac current image generation unit 523 may acquire the temporal change EV (t1-tn) of the current EV flowing through each position of the heart 91 directly from the detected value of the magnetic sensor array 10.
- FIG. 9 is a diagram schematically showing a method of generating a cardiac current image VI (t1-tn).
- the heart current image generation unit 523 generates a heart current image VI (t1-tn) in which the change EV (t1-tn) of the current EV flowing at each position of the heart 91 with time is represented by the change of the color attribute. ..
- the cardiac current image generation unit 523 is a three-dimensional organ model OM (three-dimensional image data showing the external shape and internal shape of the heart 91) generated by the method of FIG. 3 from the model image generation unit 521. To get.
- the three-dimensional organ model OM acquired by the cardiac current image generation unit 523 means a dynamic three-dimensional organ model OM that changes with the passage of time, and thereafter, for convenience, "three-dimensional organ model OM (t1-). Also called “tun)".
- the cardiac current image generation unit 523 divides the three-dimensional organ model OM (t1-tn) into voxel BOs representing predetermined unit volume elements.
- the cardiac current image generation unit 523 includes a three-dimensional organ model OM (t1-tn) and a time-dependent change EV (t1-tn) of the current EV flowing through each position of the heart 91 obtained by the method of FIG. Align.
- the alignment is performed, for example, by aligning the current EV (t21-t30) flowing to the Purkinje fiber PF and the contour shape of the three-dimensional organ model OM (t1-tn) shown in the left figure of FIG. 8 (C). realizable.
- the cardiac current image generation unit 523 changes the current EV flowing through each voxel BO with time EV (t1-tn), in other words, the current EV flowing with each position of the heart 91 with time. t1-tn) can be obtained.
- the lower part of FIG. 9 shows the change EV (t1-tn) of the current EV flowing through the voxels BO11, BO13, BO15, and BO17 at different positions with time. As shown by the broken line in the lower part of FIG. 9, the current EV has a different time-dependent change EV (t1-tn) depending on the position of the voxel BO.
- the cardiac current image generation unit 523 sets the hue and saturation to arbitrary values for each voxel BO, and sets the brightness to a value according to the time-dependent change EV (t1-tn) of the current EV flowing through the voxel BO.
- the cardiac current image VI (t1-tn) is generated.
- the heart current image generation unit 523 generates a heart current image VI (t1-tn) in which the brightness of the voxel BO is increased in proportion to the value of the current EV flowing through the voxel BO.
- the voxel BO (in other words, the portion having a relatively high brightness) having a relatively high brightness follows the change EV (t1-tn) of the current EV with time.
- the cardiac current image generation unit 523 of the present embodiment relates to the boxel BO corresponding to the portion of each position of the heart 91 at a predetermined time (for example, time t10) in which a relatively high current EV is flowing. It produces a cardiac current image VI (t1-tn) with a higher brightness than the rest of the same time (eg, time t10).
- FIG. 10 is a diagram showing an example of the composite image CI.
- the composite image generation unit 52 captures the three-dimensional organ model OM (t1-tn) on the virtual surface VP, and the cardiac current image VI on the same virtual surface VP with respect to the organ model image SI (t1-tn) generated.
- a composite image CI on which (t1-tn) is superimposed is generated.
- the composite image generation unit 52 displays the generated composite image CI and the first window FW1 on the display screen 61 of the monitor 60. In the first window FW1, an image showing the positional relationship between the heart 91 and the virtual surface VP is displayed.
- the operator can change the position of the virtual surface VP in the composite image CI by operating the virtual surface VP displayed on the first window FW1 and changing the positional relationship with the image representing the heart 91. ..
- the synthetic image CI has an organ model image SI (t1-tn) showing the appearance (outer surface) of the heart 91 and a time-dependent change EV (t1-tn) of the current EV flowing on the same outer surface of the heart 91. It is an image superimposed on the represented cardiac current image VI (t1-tn).
- the cardiac current image VI (t1-tn) is displayed in white.
- the portion BP having a relatively high brightness moves with time according to the change with time EV (t1-tn) of the current EV flowing at each position of the heart 91. go.
- the portion BP (t21) having a relatively high brightness at a certain time t21 and the portion BP (t22) having a relatively high brightness at the next time t22 are at different positions.
- the part LE for example, the arrhythmia part of the heart 91
- the brightness changes differently from other normal parts (in the illustrated example, the brightness changes in a spiral shape). do). Therefore, the operator can intuitively recognize the location of the lesion LE having an abnormal change in the current EV.
- the cardiac current image generation unit 523 and the synthetic image generation unit 52 also use the two-dimensional organ model OM in the two-dimensional processing using the two-dimensional organ model OM and the two-dimensional magnetic field intensity distribution model DM. After dividing into pixels representing unit area elements, the same processing as described with reference to FIGS. 8 to 10 can be performed.
- FIG. 11 is a diagram showing another example of the composite image CI.
- the composite image CI represents the organ model image SI (t1-tn) showing the cross section of the heart 91 in the virtual surface VP and the temporal change EV (t1-tn) of the current EV flowing through the same cross section of the heart 91. It is an image superimposed on the cardiac current image VI (t1-tn).
- the portion BP of the heart current image VI (t1-tn) having a relatively high brightness is the change over time of the current EV flowing through each position of the heart 91.
- the portion BP (t13) having a relatively high brightness at a certain time t13 and the portion BP (t14) having a relatively high brightness at the next time t14 are at different positions.
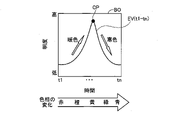
- FIG. 12 is a diagram showing another example of change in color attribute.
- FIG. 12A shows an example of changing the saturation
- FIG. 12B shows an example of changing the hue.
- the cardiac current image generation unit 523 when the cardiac current image generation unit 523 generates the cardiac current image VI (t1-tn), the hue and lightness of each voxel BO are set to arbitrary values and the saturation. May be a value according to the time-dependent change EV (t1-tn) of the current EV flowing through the voxel BO. Even in this way, the same effect as in the examples of FIGS. 9 to 11 in which the brightness is changed can be obtained. As shown in FIG.
- the cardiac current image generation unit 523 when the cardiac current image generation unit 523 generates the cardiac current image VI (t1-tn), the lightness and saturation are set to arbitrary values for each voxel BO, and the hue May be an RGB value according to the time-dependent change EV (t1-tn) of the current EV flowing through the voxel BO. Even in this way, the same effect as in the examples of FIGS. 9 to 11 in which the brightness is changed can be obtained.
- the heart current image generation unit 523 may generate a heart current image VI (t1-tn) in which any of hue, saturation, lightness, and a combination thereof is changed.
- FIG. 13 is a diagram showing another example of change in color attribute.
- FIG. 13 shows an example of changing the pattern of color attributes.
- the cardiac current image generation unit 523 when the cardiac current image generation unit 523 generates the cardiac current image VI (t1-tn), the current EV of a certain voxel BO increases with time (FIG. 13: from time t1). , Until the current EV reaches the peak CP) changes the color attribute in the first pattern.
- the first pattern changes the hue from red to yellow and the lightness to a high degree between warm colors as the current EV increases.
- the cardiac current image generation unit 523 when the cardiac current image generation unit 523 generates the cardiac current image VI (t1-tn), when the current EV decreases with time for the same voxel BO (FIG. 13: the current EV reaches the apex CP). After that, until the time tun), the color attribute is changed by a second pattern different from the first pattern. In the example of FIG. 13, the second pattern changes the color attribute from yellow to blue and lowers the brightness between cold colors as the current EV decreases.
- the cardiac current image generation unit 523 performs the same processing on each voxel BO of the three-dimensional organ model OM (t1-tn) to generate the cardiac current image VI (t1-tn).
- the cardiac current image generation unit 523 changes the color attribute in the first pattern when the current value EV increases with time at a certain position of the organ (voxel BO with the heart 91).
- a cardiac current image VI (t1-tn) in which the color attribute is changed in the second pattern is generated. Therefore, the surgeon can intuitively recognize whether the current value EV at a certain position of the organ (voxel BO with the heart 91) tends to increase or decrease depending on the pattern of change in the color attribute.
- a composite image CI is generated by superimposing the cardiac current image VI (t1-tn) representing the change over time EV (t1-tn) of the EV. Therefore, the surgeon can intuitively recognize the change in the current EV flowing through each position of the heart 91 by using the composite image CI.
- the cardiac current image VI (t1-tn) of the composite image CI is an image showing the time-dependent change EV (t1-tn) of the current EV flowing at each position of the heart 91 by the change of the color attribute.
- the cardiac current image generation unit 523 changes one of the hue, the saturation, the lightness, and the combination thereof for the change of the color attribute.
- the cardiac current image VI (t1-tn) represented by the above is generated. Therefore, the surgeon can more intuitively recognize the change in the current EV flowing through each position of the heart 91 (organ).
- the cardiac current image generation unit 523 sets at least one of the hue, saturation, and lightness of the portion (voxel BO) corresponding to the portion where the relatively high current EV is flowing to the other portion (voxel). Generates a cardiac current image VI (t1-tn) higher than BO). Therefore, the surgeon can more intuitively recognize the change in the current EV flowing through each position of the heart 91.
- FIG. 14 is a functional block diagram of the main control unit 51 and the composite image generation unit 52A of the second embodiment.
- the medical device 1A of the second embodiment includes a synthetic image generation unit 52A instead of the synthetic image generation unit 52 described in the first embodiment.
- the composite image generation unit 52A further includes the magnetic field intensity distribution image MI on the same virtual surface VP.
- a composite image CIA superimposed with (t1-tn) is generated.
- the magnetic field intensity distribution image MI (t1-tn) can be generated by capturing the three-dimensional magnetic field intensity distribution model DM generated by the method described with reference to FIG. 7 with a virtual surface VP.
- the composite image generation unit 52A displays the generated composite image CIA, the first window FW1, and the second window FW2 on the display screen 61 of the monitor 60.
- FIG. 15 is a diagram showing an example of the synthetic image CIA of the second embodiment.
- the first window FW1 is as described in the first embodiment.
- an image showing whether or not the cardiac current image VI is displayed (ON / OFF) and whether or not the magnetic field intensity distribution image MI is displayed (ON / OFF) is displayed.
- the presence / absence of display of the cardiac current image VI is set to OFF (not displayed), and the presence / absence of display of the magnetic field intensity distribution image MI is set to ON (display). .. Therefore, a composite image CIA in which the magnetic field intensity distribution image MI (t1-tn) is superimposed on the organ model image SI (t1-tn) is displayed on the upper part.
- FIG. 16 is a diagram showing another example of the composite image CIA of the second embodiment.
- the presence / absence of display of the cardiac current image VI is set to ON (display)
- the presence / absence of display of the magnetic field intensity distribution image MI is set to ON (display). .. Therefore, in the upper part, the composite image CIA in which both the cardiac current image VI (t1-tn) and the magnetic field intensity distribution image MI (t1-tn) are superimposed on the organ model image SI (t1-tn). Is displayed.
- the medical device 1A can be changed in various ways, and the synthetic image generation unit 52A includes a separate image different from the organ model image SI (t1-tn) and the cardiac current image VI (t1-tn).
- a composite image CIA may be generated and displayed.
- the magnetic field intensity distribution image MI (t1-tn) is superimposed on the composite image CIA, but other images may be superimposed.
- various images such as an image showing the position of the lesion and an image showing the position of a medical device (catheter or the like) inserted into the heart 91 can be adopted.
- the composite image generation unit 52A may display the second window FW2 for designating the type of the image to be displayed as the composite image CIA in addition to the first window FW1 for designating the virtual surface VP. .. If the second window FW2 is used, the usability of the medical device 1A by the operator can be further improved.
- the synthetic image generation unit 52A further includes the magnetic field intensity distribution image MI in addition to the organ model image SI (t1-tn) and the cardiac current image VI (t1-tn).
- a composite image CIA superimposed with (t1-tn) is generated. Therefore, the surgeon can recognize the strength of the biomagnetic field MFh at each position of the heart 91 (organ) by using the magnetic field intensity distribution image MI (t1-tn) of the synthetic image CIA, and the efficiency of the procedure. And safety can be further improved.
- ⁇ Modified example of this embodiment> a part of the configuration realized by the hardware may be replaced with software, and conversely, a part of the configuration realized by the software may be replaced with the hardware. good. Further, the present invention is not limited to the above embodiment, and can be carried out in various embodiments without departing from the gist thereof, and for example, the following modifications are also possible.
- the configurations of the medical devices 1 and 1A are exemplified.
- the configuration of the medical device 1 can be changed in various ways.
- the medical device 1 may include other devices such as an MRI device, an electrocardiograph, an X-ray image pickup device, and an ultrasonic probe.
- the medical device 1 compares the measured value by the electrocardiograph with the time-dependent change EV (t1-tn) of the current EV obtained by the electrocardiographic image generation unit 523. By doing so, the current value obtained by the cardiac current image generation unit 523 may be confirmed, remeasured, corrected, or the like.
- the cardiac current image generation unit 523 may obtain the temporal change EV (t1-tn) of the current EV flowing through each position of the heart 91 by the following method a1 or method a2, which is different from the above-mentioned method. ..
- the position of the medical device (catheter or the like) in the heart 91 can be specified, for example, as follows. -Provide a magnetic field generator consisting of an electromagnet in a medical device.
- the main control unit 51 of the medical device 1 acquires the second magnetic field information output from the magnetic sensor array 10 in a state where the magnetic field generation unit (electromagnet) is energized.
- the second magnetic field information is magnetic field information (hereinafter, also referred to as "biological / device mixed magnetic field”) in which the biomagnetic field MFh and the device magnetic field generated by the magnetic field generating portion of the medical device are combined.
- the second magnetic field information includes the position information of the medical device. Therefore, the main control unit 51 can specify the position of the magnetic field generation unit of the medical device by comparing the biomagnetic field information described in the first embodiment with the second magnetic field information. -Provide a magnetic field generator consisting of permanent magnets in the medical device.
- the main control unit 51 of the medical device 1 can specify the position of the magnetic field generating unit of the medical device from the X-ray image obtained by the X-ray imaging device.
- the magnetic field generating portion (magnetic field source) provided in the medical device is a permanent magnet
- the magnetic force is caused by a factor (mainly time) other than the relative distance between the magnetic field generating portion on the X-ray image and the magnetic sensor array 10.
- the measured intensity value does not change, so that the magnetic field generating portion can be identified as a magnetic field source that moves in conjunction with the operation of the medical device (in other words, the movement of the medical device) rather than the beat of the heart 91.
- the change EV (t1-tn) of the current EV flowing at each position of the heart 91 over time can be obtained. good.
- the potential change measurement is performed at a specific point inside the heart 91 only for an arbitrary time T, and then the measurement point is moved to acquire the time change data of the potential in the required heart region.
- the time T can be a value corresponding to the beat cycle of the heart 91 acquired in advance, and is preferably m (m is a natural number) times the beat cycle of the heart 91.
- the cardiac current image generation unit 523 reads the potential change thus obtained as a time-dependent change EV (t1-tn) of the current EV. In principle, only unit conversion can be used for replacement.
- the cardiac current image generation unit 523 may perform signal correction such as noise reduction as well as reading.
- the medical device inserted into the heart 91 is a catheter having a basket structure, it is possible to read the potential and the current while performing the measurement in real time.
- a magnetic sensor is provided in the medical device, and the change EV (t1-tn) of the current EV flowing at each position of the heart 91 with time is obtained by magnetic measurement using the medical device inserted inside the heart 91. May be good.
- magnetic change measurement is performed at a specific point inside the heart 91 for an arbitrary time T, and then the measurement point is moved to acquire magnetic time change data in a required heart region.
- the time T is the same as that of method a1.
- the cardiac current image generation unit 523 converts the magnetic change thus obtained into a time-dependent change EV (t1-tn) of the current EV according to a well-known physical law such as Maxwell's equations.
- the medical device inserted into the heart 91 is a catheter having a basket structure, it is possible to convert between magnetism and electric current while performing measurement in real time.
- the cardiac current image generation unit 523 uses the impedance data of the myocardium of the heart 91 together with Maxwell's equations to change with time EV (t1-tn). ) May be obtained.
- various images such as an MRI image, an image displaying measurement data by an electrocardiograph, an image displaying a pulse or the like, and an image explaining a procedure of a procedure may be displayed on the display screen 61.
- the composite image CI may be further superposed with an image showing the position of the medical device and an image showing the position of the lesion.
- an image representing a specific site of the heart 91 sinoatrial node, atrioventricular node, bundle of His, Purkinje fiber, etc.
Landscapes
- Health & Medical Sciences (AREA)
- Life Sciences & Earth Sciences (AREA)
- Nuclear Medicine, Radiotherapy & Molecular Imaging (AREA)
- Physics & Mathematics (AREA)
- Medical Informatics (AREA)
- Animal Behavior & Ethology (AREA)
- Pathology (AREA)
- Engineering & Computer Science (AREA)
- Biomedical Technology (AREA)
- Heart & Thoracic Surgery (AREA)
- Veterinary Medicine (AREA)
- Molecular Biology (AREA)
- Surgery (AREA)
- Biophysics (AREA)
- General Health & Medical Sciences (AREA)
- Public Health (AREA)
- Radiology & Medical Imaging (AREA)
- Cardiology (AREA)
- Physiology (AREA)
- High Energy & Nuclear Physics (AREA)
- Measurement And Recording Of Electrical Phenomena And Electrical Characteristics Of The Living Body (AREA)
- Magnetic Resonance Imaging Apparatus (AREA)
- Apparatus For Radiation Diagnosis (AREA)
Priority Applications (5)
| Application Number | Priority Date | Filing Date | Title |
|---|---|---|---|
| JP2022558608A JP7772711B2 (ja) | 2020-10-26 | 2020-10-26 | 医療装置、及び、画像生成方法 |
| EP20959693.1A EP4233705A4 (en) | 2020-10-26 | 2020-10-26 | MEDICAL DEVICE AND IMAGE GENERATION METHOD |
| PCT/JP2020/040073 WO2022091175A1 (ja) | 2020-10-26 | 2020-10-26 | 医療装置、及び、画像生成方法 |
| CN202080106531.2A CN116348041A (zh) | 2020-10-26 | 2020-10-26 | 医疗装置以及图像生成方法 |
| US18/136,889 US12564345B2 (en) | 2020-10-26 | 2023-04-20 | Medical apparatus, and image generation method for visualizing temporal trends of biomagnetic data on an organ model |
Applications Claiming Priority (1)
| Application Number | Priority Date | Filing Date | Title |
|---|---|---|---|
| PCT/JP2020/040073 WO2022091175A1 (ja) | 2020-10-26 | 2020-10-26 | 医療装置、及び、画像生成方法 |
Related Child Applications (1)
| Application Number | Title | Priority Date | Filing Date |
|---|---|---|---|
| US18/136,889 Continuation US12564345B2 (en) | 2020-10-26 | 2023-04-20 | Medical apparatus, and image generation method for visualizing temporal trends of biomagnetic data on an organ model |
Publications (1)
| Publication Number | Publication Date |
|---|---|
| WO2022091175A1 true WO2022091175A1 (ja) | 2022-05-05 |
Family
ID=81383733
Family Applications (1)
| Application Number | Title | Priority Date | Filing Date |
|---|---|---|---|
| PCT/JP2020/040073 Ceased WO2022091175A1 (ja) | 2020-10-26 | 2020-10-26 | 医療装置、及び、画像生成方法 |
Country Status (5)
| Country | Link |
|---|---|
| US (1) | US12564345B2 (https=) |
| EP (1) | EP4233705A4 (https=) |
| JP (1) | JP7772711B2 (https=) |
| CN (1) | CN116348041A (https=) |
| WO (1) | WO2022091175A1 (https=) |
Citations (4)
| Publication number | Priority date | Publication date | Assignee | Title |
|---|---|---|---|---|
| JP2001170018A (ja) * | 1999-10-06 | 2001-06-26 | Hitachi Ltd | 生体磁場計測装置 |
| WO2002005714A1 (en) * | 2000-07-18 | 2002-01-24 | Japan Science And Technology Corporation | Liable cardiac muscle diagnosing apparatus and liable cardiac muscle analyzing method by magnetic field measurements |
| JP4027867B2 (ja) | 2003-09-10 | 2007-12-26 | 株式会社日立ハイテクノロジーズ | 生体磁場計測装置 |
| JP4597329B2 (ja) | 1999-07-22 | 2010-12-15 | バイオセンス・ウエブスター・インコーポレーテツド | マッピングによる状態表示方法 |
Family Cites Families (8)
| Publication number | Priority date | Publication date | Assignee | Title |
|---|---|---|---|---|
| EP0470270A1 (de) * | 1990-07-30 | 1992-02-12 | Siemens Aktiengesellschaft | Verfahren zur Auswahl, Darstellung und graphischen Umsetzung von räumlich lokalisierbaren biomagnetischen oder bioelektrischen Signalen auf einem Graphikbildschirm |
| US6226542B1 (en) | 1998-07-24 | 2001-05-01 | Biosense, Inc. | Three-dimensional reconstruction of intrabody organs |
| WO2006109692A1 (ja) | 2005-04-07 | 2006-10-19 | Nemoto Kyorindo Co., Ltd. | 画像表示装置 |
| US9204927B2 (en) * | 2009-05-13 | 2015-12-08 | St. Jude Medical, Atrial Fibrillation Division, Inc. | System and method for presenting information representative of lesion formation in tissue during an ablation procedure |
| CN103239253B (zh) * | 2012-02-14 | 2015-07-15 | 株式会社东芝 | 医用图像诊断装置 |
| CN104739411B (zh) * | 2015-04-01 | 2017-04-05 | 南京医科大学 | 一种使用磁传感器对磁性目标进行检测定位的方法 |
| US9433363B1 (en) * | 2015-06-18 | 2016-09-06 | Genetesis Llc | Method and system for high throughput evaluation of functional cardiac electrophysiology |
| WO2021181648A1 (ja) * | 2020-03-13 | 2021-09-16 | 朝日インテック株式会社 | 医療装置、および、画像生成方法 |
-
2020
- 2020-10-26 WO PCT/JP2020/040073 patent/WO2022091175A1/ja not_active Ceased
- 2020-10-26 EP EP20959693.1A patent/EP4233705A4/en not_active Withdrawn
- 2020-10-26 CN CN202080106531.2A patent/CN116348041A/zh not_active Withdrawn
- 2020-10-26 JP JP2022558608A patent/JP7772711B2/ja active Active
-
2023
- 2023-04-20 US US18/136,889 patent/US12564345B2/en active Active
Patent Citations (4)
| Publication number | Priority date | Publication date | Assignee | Title |
|---|---|---|---|---|
| JP4597329B2 (ja) | 1999-07-22 | 2010-12-15 | バイオセンス・ウエブスター・インコーポレーテツド | マッピングによる状態表示方法 |
| JP2001170018A (ja) * | 1999-10-06 | 2001-06-26 | Hitachi Ltd | 生体磁場計測装置 |
| WO2002005714A1 (en) * | 2000-07-18 | 2002-01-24 | Japan Science And Technology Corporation | Liable cardiac muscle diagnosing apparatus and liable cardiac muscle analyzing method by magnetic field measurements |
| JP4027867B2 (ja) | 2003-09-10 | 2007-12-26 | 株式会社日立ハイテクノロジーズ | 生体磁場計測装置 |
Non-Patent Citations (1)
| Title |
|---|
| See also references of EP4233705A4 |
Also Published As
| Publication number | Publication date |
|---|---|
| JPWO2022091175A1 (https=) | 2022-05-05 |
| US12564345B2 (en) | 2026-03-03 |
| EP4233705A1 (en) | 2023-08-30 |
| JP7772711B2 (ja) | 2025-11-18 |
| US20230255535A1 (en) | 2023-08-17 |
| EP4233705A4 (en) | 2024-07-24 |
| CN116348041A (zh) | 2023-06-27 |
Similar Documents
| Publication | Publication Date | Title |
|---|---|---|
| CN109199598A (zh) | 用于实时三维(3d)心脏成像中玻璃态视图的系统和方法 | |
| JP6775939B2 (ja) | 身体器官の差動マッピング | |
| US9078567B2 (en) | Method and device for visually supporting an electrophysiology catheter application in the heart | |
| JP6182194B2 (ja) | 心内エコー・カテーテル画像における心臓内の機器および構造の自動識別 | |
| CN101467894B (zh) | 解剖结构的闪光图 | |
| US7751874B2 (en) | Display for ECG diagnostics | |
| US8005283B2 (en) | Method and device for the combined representation of 2D fluoroscopic images and a static 3D image data set | |
| JP2001218765A (ja) | 対象物のビジュアル化方法及びシステム | |
| US7363070B2 (en) | Biomagnetic measurement apparatus | |
| US20150228254A1 (en) | Systems and Methods for Generating, Storing, and Displaying Anatomical Maps | |
| US20070167706A1 (en) | Method and apparatus for visually supporting an electrophysiological catheter application in the heart by means of bidirectional information transfer | |
| CN106232001A (zh) | 用于显示心脏机械激活图案的系统和方法 | |
| JP3712348B2 (ja) | 心房粗動および心房細動の心臓磁界診断装置およびその作動方法 | |
| CN105342701A (zh) | 一种基于影像信息融合的病灶虚拟穿刺系统 | |
| US20230005215A1 (en) | Medical apparatus and image generation method | |
| JP2010075549A (ja) | 画像処理装置 | |
| JP2013144068A (ja) | 治療支援装置及び制御プログラム | |
| JP7772711B2 (ja) | 医療装置、及び、画像生成方法 | |
| US20210267678A1 (en) | Treatment system and image generation method | |
| US12573040B2 (en) | Image processing apparatus and image processing method | |
| Hussain et al. | MRI Guidance of Cardiac Applications | |
| MXPA06002404A (en) | Method and device for visually supporting an electrophysiology catheter application in the heart |
Legal Events
| Date | Code | Title | Description |
|---|---|---|---|
| 121 | Ep: the epo has been informed by wipo that ep was designated in this application |
Ref document number: 20959693 Country of ref document: EP Kind code of ref document: A1 |
|
| ENP | Entry into the national phase |
Ref document number: 2022558608 Country of ref document: JP Kind code of ref document: A |
|
| NENP | Non-entry into the national phase |
Ref country code: DE |
|
| ENP | Entry into the national phase |
Ref document number: 2020959693 Country of ref document: EP Effective date: 20230526 |