WO2022085426A1 - 管理装置、管理方法及びコンピュータプログラム - Google Patents
管理装置、管理方法及びコンピュータプログラム Download PDFInfo
- Publication number
- WO2022085426A1 WO2022085426A1 PCT/JP2021/036743 JP2021036743W WO2022085426A1 WO 2022085426 A1 WO2022085426 A1 WO 2022085426A1 JP 2021036743 W JP2021036743 W JP 2021036743W WO 2022085426 A1 WO2022085426 A1 WO 2022085426A1
- Authority
- WO
- WIPO (PCT)
- Prior art keywords
- history
- displayed
- data
- screen area
- management
- Prior art date
- Legal status (The legal status is an assumption and is not a legal conclusion. Google has not performed a legal analysis and makes no representation as to the accuracy of the status listed.)
- Ceased
Links
Images






Classifications
-
- G—PHYSICS
- G05—CONTROLLING; REGULATING
- G05B—CONTROL OR REGULATING SYSTEMS IN GENERAL; FUNCTIONAL ELEMENTS OF SUCH SYSTEMS; MONITORING OR TESTING ARRANGEMENTS FOR SUCH SYSTEMS OR ELEMENTS
- G05B23/00—Testing or monitoring of control systems or parts thereof
- G05B23/02—Electric testing or monitoring
Definitions
- Patent Document 1 discloses a failure monitoring device that monitors the failure status of the monitored device. On the display screen of the failure monitoring device of Patent Document 1, the occurrence / recovery of the failure is displayed in chronological order.
- the disclosed management device is a management device for equipment having a plurality of parts, and is output from historical data regarding either a failure or maintenance event in the equipment and a plurality of sensors provided in the equipment. It is configured to execute a generation process of generating management screen information for displaying the management screen of the equipment on the display device from the storage device in which the sensor data is stored, the history data, and the sensor data.
- the management screen includes a processing device, a layout screen area showing the arrangement of a plurality of parts of the equipment, and a plurality of status display units generated from the sensor data and displayed in the layout screen area.
- a plurality of history display units generated from the history data and displayed in the layout screen area, and the plurality of status display units correspond to the plurality of sensors provided in the equipment. It is displayed at a position in the layout screen area, and the plurality of history display units are displayed at a position in the layout screen area corresponding to the part where the event has occurred among the plurality of parts.
- the disclosure management method is a management screen generated from historical data relating to one of failures and maintenance events in equipment having a plurality of parts, and sensor data output from a plurality of sensors provided in the equipment.
- the management screen is provided with a layout screen area showing the arrangement of a plurality of parts of the equipment, and a plurality of states generated from the sensor data and displayed in the layout screen area.
- a display unit and a plurality of history display units generated from the history data and displayed in the layout screen area are provided, and the plurality of status display units correspond to the plurality of sensors provided in the equipment.
- the plurality of history display units are displayed at positions in the layout screen area, and the plurality of history display units are displayed at positions in the layout screen area corresponding to the parts where the event has occurred among the plurality of parts.
- the disclosed computer program is a computer program for causing a computer to execute a generation process for generating management screen information for displaying a management screen of equipment on a display device, and the generation process is a failure in the equipment and a generation process.
- the management screen information is generated from the historical data related to one of the maintenance events and the sensor data output from a plurality of sensors provided in the equipment, and the management screen is provided by the equipment.
- a layout screen area showing the arrangement of a plurality of parts having a plurality of states, a plurality of state display units generated from the sensor data and displayed in the layout screen area, and a plurality of state display units generated from the history data and displayed in the layout screen area.
- a plurality of history display units are provided, and the plurality of status display units are displayed at positions in the layout screen area corresponding to the plurality of sensors provided in the equipment, and the plurality of history displays are displayed.
- the unit is displayed at a position in the layout screen area corresponding to the portion where the event has occurred among the plurality of portions.
- FIG. 1 is an overall configuration diagram of a system having a management device.
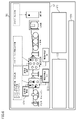
- FIG. 2 is a schematic configuration diagram of the first equipment.
- FIG. 3 is a block diagram of the management device.
- FIG. 4 is a diagram showing a management screen.
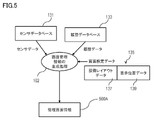
- FIG. 5 is an explanatory diagram of the generation process 102.
- FIG. 6 is a diagram showing a management screen.
- FIG. 7 shows a detailed history display unit of the management screen.
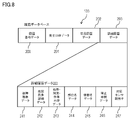
- FIG. 8 is a data structure diagram of the history database.
- FIG. 9 is a diagram showing a display example of the second screen area.
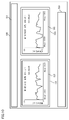
- FIG. 10 is a diagram showing a display example of the first screen area and the second screen area.
- FIG. 11 is a flowchart of the failure / maintenance time calculation process.
- FIG. 12 is a diagram showing a display example of the first screen area and the second screen area.
- Patent Document 1 if the occurrence / recovery of a failure is displayed in chronological order, it is possible to grasp the past failure situation but not obtain the information necessary for making an appropriate maintenance plan in the future. ..
- the management device is a management device for equipment having a plurality of parts, and has historical data regarding one of failures and maintenance events in the equipment and a plurality of management devices provided in the equipment.
- a generation process for generating management screen information for displaying the management screen of the equipment on the display device is executed from the storage device that stores the sensor data output from the sensor and the history data and the sensor data. It comprises a processing device configured to do so.
- the management screen is generated from a layout screen area showing the arrangement of a plurality of parts of the equipment, a plurality of state display units generated from the sensor data and displayed in the layout screen area, and history data.
- a plurality of history display units displayed in the layout screen area, and the plurality of status display units are located at positions in the layout screen area corresponding to the plurality of sensors provided in the equipment.
- the plurality of history display units are displayed, and the plurality of history display units are displayed at positions in the layout screen area corresponding to the portion where the event has occurred among the plurality of portions. In this case, it is possible to display the information necessary for the user to make an appropriate maintenance plan.
- each of the plurality of status display units is configured to be selectable by the user's first selection operation. It is preferable that the management screen further includes an area for displaying a more detailed state than the state display unit selected by the first selection operation. In this case, the user can refer to a more detailed state than the state display unit. (3) It is preferable that the management screen further includes a detailed history display unit generated from the history data.
- the detailed history display unit is configured to show a more detailed history than the history indicated by the plurality of history display units. In this case, the user can refer to a more detailed history than the history display unit.
- the management screen further includes a marker generated from the history data and displayed in the layout screen area. The marker is preferably displayed at a position in the layout screen area corresponding to the portion where the event has occurred among the plurality of portions. In this case, the user can easily grasp the part where the event has occurred.
- the processing device is configured to further execute a calculation process for obtaining the expected time when the event occurs based on the sensor data and the historical data. In this case, the expected time when the event will occur is obtained.
- the event included in the history display unit is configured to be selectable by the user's second selection operation.
- the management screen is preferably configured to display sensor data at the time when the event selected by the second selection operation occurs. In this case, the user can refer to the sensor data at the time when the selected event occurs.
- the sensor data can include past sensor data and current sensor data. It is preferable that the management screen is configured so that the past sensor data and the current sensor data can be displayed at the same time. In this case, the user can simultaneously refer to the past sensor data and the present sensor data and compare them.
- the management screen is preferably configured to accept input of new history data for any of the plurality of parts.
- the generation process is configured to update the history display unit of the portion corresponding to the new history data among the plurality of history display units according to the new history data.
- the history display unit is updated by inputting new history data.
- the management method according to the embodiment is based on historical data relating to one of failures and maintenance events in equipment having a plurality of parts, and sensor data output from a plurality of sensors provided in the equipment. It is provided to display the generated management screen on the display device.
- the management screen is generated from a layout screen area showing the arrangement of a plurality of parts of the equipment, a plurality of state display units generated from the sensor data and displayed in the layout screen area, and history data. , A plurality of history display units displayed in the layout screen area.
- the plurality of status display units are displayed at positions in the layout screen area corresponding to the plurality of sensors provided in the equipment, and the plurality of history display units are the events of the plurality of parts. Is displayed at a position in the layout screen area corresponding to the portion where the above occurs. In this case, it is possible to display the information necessary for the user to make an appropriate maintenance plan. That is, since the status display unit and the history display unit are displayed in the layout screen area, it becomes easier for the user to understand the relationship between the contents shown in the status display unit and the history display unit, and it becomes easier to make a maintenance plan.
- the computer program according to the embodiment is a computer program for causing a computer to execute a generation process for generating management screen information for displaying a management screen of equipment on a display device, and the generation process is It is provided to generate the management screen information from the historical data regarding one of the failures and maintenance events in the equipment and the sensor data output from a plurality of sensors provided in the equipment.
- the management screen is generated from a layout screen area showing the arrangement of a plurality of parts of the equipment, a plurality of state display units generated from the sensor data and displayed in the layout screen area, and history data. , A plurality of history display units displayed in the layout screen area.
- the plurality of status display units are displayed at positions in the layout screen area corresponding to the plurality of sensors provided in the equipment, and the plurality of history display units are the events of the plurality of parts. Is displayed at a position in the layout screen area corresponding to the portion where the above occurs. In this case, it is possible to display the information necessary for the user to make an appropriate maintenance plan. That is, since the status display unit and the history display unit are displayed in the layout screen area, it becomes easier for the user to understand the relationship between the contents shown in the status display unit and the history display unit, and it becomes easier to make a maintenance plan.
- FIG. 1 shows a system including the management device 10 according to the embodiment.
- the system includes one or more facilities 51, 51A, 51B to be monitored, and a management device 10.
- the equipments 51, 51A and 51B are, for example, manufacturing equipment installed in a factory.
- the management device 10 is connected to the equipment 51, 51A, 51B via the network 70.
- the management device 10 may be configured to remotely monitor the equipment 51, 51A, 51B, or may be configured to monitor in the vicinity of the equipment 51A, 51B.
- the network 70 is, for example, a wired network or a wireless network.
- the management device 10 may include a display.
- the system may include a user terminal 30 having a display.
- the plurality of equipments 51, 51A, 51B shown in FIG. 1 have a first equipment 51, a second equipment 51A, and a third equipment 51B.
- the number of equipments 51, 51A, 51B to be managed by the management device 10 is not particularly limited. Further, the types of equipment 51, 51A, 51B are not particularly limited.
- the equipment 51, 51A, 51B may be inspection equipment, sales equipment, management equipment, or the like, in addition to the manufacturing equipment.
- the management of the first facility 51 by the management device 10 will be described as an example, but the management device 10 can perform the same management for the other facilities 51A and 51B.
- the first equipment 51 will be described as an example of equipment for manufacturing a stranded cable.
- FIG. 2 shows a stranded cable manufacturing facility as the first facility 51.
- the first equipment 51 has a plurality of parts 61, 62, 63, 64, 65, 66, 67.
- Each of the plurality of parts 61, 62, 63, 64, 65, 66, 67 is a component of the first equipment 51.
- a failure may occur at each of the plurality of parts 61, 62, 63, 64, 65, 66, 67.
- the management device 10 can manage the first equipment 51 in units of a plurality of parts 61, 62, 63, 64, 65, 66, 67.
- the first equipment 51 includes an electric wire transmitter 61 as a first part 61, a capstan 62 as a second part 62, a first twisted wire machine 63 as a third part 63, and a second twist as a fourth part 64. It includes a wire machine 64, a take-up machine 65 as a fifth part 65, a winder 66 as a sixth part 66, and a control panel 67 as a seventh part 67.
- the electric wire transmitted from the transmitter 61 is supplied to the first stranded wire machine 63 via the capstan 62, and is twisted in the first stranded wire machine 63 and the second stranded wire machine 64.
- the first twisting machine 63 includes 12 bobbins
- the second twisting machine 64 includes 18 bobbins.
- the stranded wire sent out from the second stranded wire machine 64 passes through the take-up machine 65 and is wound by the take-up machine 66.
- the control panel 67 is connected to other parts 61, 62, 63, 64, 65, 66 included in the first equipment 51, and controls these other parts 61, 62, 63, 64, 65, 66.
- Each of the plurality of parts 61, 62, 63, 64, 65, 66, 67 included in the first equipment 51 is provided with one or a plurality of devices.
- failure may occur in each of one or more devices.
- the first twisting machine 63 which is the third portion 63, includes a plurality of bobbins as a plurality of devices.
- Another device included in the first stranded wire machine 63 is, for example, a power feeding device, a drive motor, and a rotating portion rotated by the drive motor.
- the second twisting machine 64 also includes a plurality of devices like the first twisting machine 63.
- control panel 67 which is the seventh portion 67, includes a sequencer as a device.
- Other parts 61, 62, 65, 66 also include one or more devices.
- the management device 10 can manage failures even in units of one or a plurality of devices.
- the first equipment 51 includes one or a plurality of sensors 73A, 73B, 74A, 74B for monitoring the state of the first equipment 51.
- the first equipment 51 shown in FIG. 2 includes a plurality of sensors 73A, 73B, 74A, 74B in order to monitor the state of each of the plurality of parts 63, 64.
- the number of sensors provided in each of the parts 63 and 64 may be one or a plurality.
- only the third part 63 and the fourth part 64 are provided with the sensors 73A, 73B, 74A, 74B, but the other parts 61, 62, 65, 66,
- the 67 may also include a sensor.
- the sensors 73A, 73B, 74A, 74B detect the state of the first equipment 51.
- the state of the first equipment 51 is, for example, a malfunction or abnormality of the first equipment 51.
- the sensors 73A, 73B, 74A, 74B are, for example, any of a vibration sensor, a position sensor, a sound sensor, a temperature sensor, and a current sensor.
- the vibration sensor detects, for example, abnormal vibration of a part or a device.
- the position sensor detects, for example, an abnormality in the position of a part or a device.
- the sound sensor detects, for example, abnormal noise of a part or a device.
- the temperature sensor detects, for example, an abnormal temperature of a site or device.
- the current sensor detects, for example, an abnormal current flowing through a site or device.
- the anomalous current is, for example, an overcurrent or a leakage current.
- the first twisting machine 63 includes a vibration sensor 73A and a position sensor 73B.
- the vibration sensor 73A measures the vibration generated in the first twisting machine 63.
- the position sensor 73B measures the position of the first twisting machine 63.
- the second twisting machine 64 includes a vibration sensor 74A and a position sensor 74B.
- the vibration sensor 74A measures the vibration generated in the second stranded wire machine 64.
- the position sensor 74B measures the position of the second stranded wire machine 64.
- Each sensor 73A, 73B, 74A, 74B outputs the measured value as sensor data.
- the first equipment 51 includes a transmitter 90 for transmitting sensor data output from the sensors 73A, 73B, 74A, 74B to the management device 10.
- the transmitter 90 is connected to each sensor 73A, 73B, 74A, 74B so that sensor data can be acquired.
- the transmitter 90 transmits the acquired sensor data to the management device 10 via the network 70.
- the sensor data output from each sensor 73A, 73B, 74A, 74B is time-series data whose measured value changes with time. These sensor data are stored in the database 13 described later.
- the management device 10 shown in FIG. 3 manages the first equipment 51 based on the sensor data.
- the management device 10 according to the embodiment is composed of a computer including a processor 11 and a storage device 12 connected to the processing device 11.
- the processing device 11 is, for example, a CPU.
- the storage device 12 has, for example, a primary storage device and a secondary storage device.
- the primary storage device is, for example, a RAM.
- the secondary storage device is, for example, a hard disk drive (HDD) or a solid state drive (SSD).
- the communication interface 15 is used, for example, for communication with the transmitter 90 and communication with the user terminal 30 described later.
- the computer constituting the management device 10 executes the management process 100.
- the storage device 12 stores a computer program 14 for operating the computer as the management device 10.
- the computer program 14 includes a program code for causing the processing device 11 to execute the management process 100.
- the processing device 11 reads the computer program 14 from the storage device 12 and executes it.
- the management process 100 will be described later.
- the storage device 12 includes a database 13.
- the database 13 includes a sensor database 131, a history database 133, and screen setting data 135.
- the sensor database 131 stores the sensor data output from each sensor 73A, 73B, 74A, 74B for each sensor 73A, 73B, 74A, 74B.
- the history database 133 stores historical data regarding at least one event of failure and maintenance of the first equipment 51.
- the history database 133 will be described later.
- the screen setting data 135 is used to generate the management screen information 500A described later.
- the management process 100 shown in FIG. 3 includes a sensor data acquisition process 101.
- the management device 10 is configured to acquire sensor data from the sensors 73A, 73B, 74A, 74B.
- the management device 10 acquires sensor data from the network 70 by means of the communication interface 15.
- the management device 10 may be configured to acquire the sensor data stored in the external database.
- the sensor data acquisition process 101 is configured to constantly acquire the sensor data.
- the sensor data acquisition process 101 is configured to store the acquired sensor data in the sensor database 131.
- the sensor data stored in the sensor database 131 is time-series data for a predetermined period from the past to the present. That is, the sensor data includes past sensor data and current sensor data.
- the management process 100 shown in FIG. 3 includes a generation process 102 of the management screen information 500A.
- the management screen information 500A is display data for configuring the management screen 500 (see FIG. 4) displayed on the display (not shown).
- the management screen 500 is referred to by a user such as a manager of the first equipment 51 or a person in charge of maintenance, and is used for grasping the state of the first equipment 51 or formulating a maintenance plan.
- the management screen information 500A is transmitted from the management device 10 to the user terminal 30 used by the manager or the maintenance person.
- the user terminal 30 that has received the management screen information 500A displays the management screen 500 configured based on the management screen information 500A on the display included in the user terminal 30.
- the user terminal 30 is connected to the management device 10 via the network 70.
- the management screen 500 may be displayed on the display included in the management device 10.
- the management process 100 shown in FIG. 3 includes a history update process 104.
- the history update process 104 is configured to receive new history data input by a user operation and store the new history data in the history database 133.
- the management process 100 shown in FIG. 3 includes a failure / maintenance time calculation process 105.
- the failure / maintenance time calculation process 105 is configured to calculate the expected time when either the failure or maintenance event occurs.
- the history update process 104 and the failure / maintenance time calculation process 105 will be described later.
- FIG. 4 shows an example of the management screen 500 displayed on the display of the user terminal 30.
- the management screen 500 shown in FIG. 4 is displayed according to the management screen information 500A generated by the above-mentioned generation process 102.
- the generation process 102 is configured to generate the management screen information 500A from the sensor data read from the sensor database 131 and the history data read from the history database 133.
- the generation process 102 further uses the screen setting data 135 to generate the management screen information 500A.
- the screen setting data 135 includes equipment layout data 137 and display position data 139.
- the equipment layout data 137 is layout image data showing the arrangement of each of the plurality of parts 61, 62, 63, 64, 65, 66, 67 possessed by the first equipment 51.
- the display position data 139 includes a status display unit 523A, 523B, 524A, 524B, a history display unit 513,514,517 (simple history display unit), and markers 91, 92, 93, 94, 95. Is data indicating the position where should be displayed.
- the management screen 500 shown in FIG. 4 includes a layout screen area 501, a first screen area 530, a second screen area 540, and a detailed history display unit 550 of the first equipment 51.
- the first screen area 530 and the second screen area 540 are displayed below the layout screen area 501.
- the detailed history display unit 550 is displayed below the first screen area 530 and the second screen area 540.
- layout screen area 501 layout images showing the arrangement of each of the plurality of parts 61, 62, 63, 64, 65, 66, 67 possessed by the first equipment 51 are displayed.
- the layout image is generated based on the equipment layout data 137.
- the user can use each part 61, 62, 63, 64, 65, 66, 67 possessed by the first equipment 51 on the management screen 500 as an image, the user can use each part 61, 62, 63, 64, The arrangement of 65, 66, and 67 can be intuitively understood.
- the arrangement of each part 61, 62, 63, 64, 65, 66, 67 of the first equipment 51 displayed in the layout screen area 501 may be schematically represented, or the actual first equipment. It may be expressed strictly according to 51.
- a plurality of status display units 523A, 523B, 524A, 524B are displayed in the layout screen area 501.
- Each of the plurality of status display units 523A, 523B, 524A, and 524B indicates the status of the first equipment 51 according to the sensor data.
- the plurality of status display units 523A, 523B, 524A, 524B correspond to a plurality of sensors 73A, 73B, 74A, 74B provided in the first equipment 51. That is, the four status display units 523A, 523B, 524A, 524B are displayed in the layout screen area 501 corresponding to the provision of the four sensors 73A, 73B, 74A, 74B in the first equipment 51.
- the plurality of status display units 523A, 523B, 524A, 524B include a first status display unit 523A, a second status display unit 523B, a third status display unit 524A, and a fourth status display unit 524B.
- the generation process 102 is configured to determine the display contents of each of the plurality of status display units 523A, 523B, 524A, and 524B based on the sensor data.
- the display content indicates, for example, whether the sensor data is a normal value or an abnormal time. Whether it is a normal value or an abnormal value is determined, for example, by comparing the sensor data with the threshold value.
- the first state display unit 523A shown in FIG. 4 corresponds to the vibration sensor 73A provided in the first stranded wire machine 63, and shows the vibration state of the first stranded wire machine 63 indicated by the sensor data of the vibration sensor 73A.
- the first state display unit 523A displays "vibration value maintenance”. “Maintenance of vibration value” indicates that the vibration state of the first twisting machine 63 indicated by the sensor data of the vibration sensor 73A is normal.
- the first state display unit 523A is displayed in a color (for example, green) indicating that it is normal.
- the first state display unit 523A corresponding to the vibration sensor 73A provided in the first twisting machine 63 is a position in the layout screen area 501 corresponding to the position where the vibration sensor 73A is actually provided in the first equipment 51. Is displayed in. That is, the first state display unit 523A corresponds to the vibration sensor 73A provided in the first stranded wire machine 63 in the vicinity of the image of the first stranded wire machine 63 displayed in the layout screen area 501. Is displayed.
- the generation process 102 determines the position where the first state display unit 523A should be displayed based on the display position data 139. In FIG. 4, the first state display unit 523A and the image of the first stranded wire machine 63 are connected so that the relationship between the first state display unit 523A and the image of the first stranded wire machine 63 becomes clearer. The dotted line is displayed.
- the second state display unit 523B shown in FIG. 4 corresponds to the position sensor 73B provided in the first stranded wire machine 63, and shows the horizontal position state of the first stranded wire machine 63 indicated by the sensor data of the position sensor 73B. ..
- "horizontal position confirmation OK” is displayed on the second state display unit 523B.
- "Horizontal position confirmation OK” indicates that the lateral position of the first twisting machine 63 indicated by the sensor data of the position sensor 73B is normal.
- the second state display unit 523B is displayed in a color (for example, green) indicating that it is normal.
- the second state display unit 523B corresponding to the position sensor 73B provided in the first twisting machine 63 is a position in the layout screen area 501 corresponding to the position where the position sensor 73B is actually provided in the first equipment 51. Is displayed in. That is, the second state display unit 523B is located near the image of the first stranded wire machine 63 displayed in the layout screen area 501, corresponding to the position sensor 73B provided in the first stranded wire machine 63. Is displayed.
- the generation process 102 determines the position where the second state display unit 523B should be displayed based on the display position data 139. In FIG. 4, the second state display unit 523B and the image of the first stranded wire machine 63 are connected so that the relationship between the second state display unit 523B and the image of the first stranded wire machine 63 becomes clearer. The dotted line is displayed.
- the third state display unit 524A shown in FIG. 4 corresponds to the vibration sensor 74A provided in the second stranded wire machine 64, and shows the vibration state of the second stranded wire machine 64 indicated by the sensor data of the vibration sensor 74A.
- the third state display unit 524A displays "vibration value maintenance”. “Maintenance of vibration value” indicates that the vibration state of the second stranded wire machine 64 indicated by the sensor data of the vibration sensor 74A is normal.
- the third state display unit 524A is displayed in a color (for example, green) indicating that it is normal.
- the third state display unit 524A corresponding to the vibration sensor 74A provided in the second twisting machine 64 is a position in the layout screen area 501 corresponding to the position where the vibration sensor 74A is actually provided in the first equipment 51. Is displayed in. That is, the third state display unit 524A corresponds to the vibration sensor 74A provided in the second stranded wire machine 64 in the vicinity of the image of the second stranded wire machine 64 displayed in the layout screen area 501. Is displayed. The generation process 102 determines the position where the third state display unit 524A should be displayed based on the display position data 139. In FIG. 4, the third state display unit 524A and the image of the second stranded wire machine 64 are connected so that the relationship between the third state display unit 524A and the image of the second stranded wire machine 64 becomes clearer. The dotted line is displayed.
- the fourth state display unit 524B shown in FIG. 4 corresponds to the position sensor 74B provided in the second stranded wire machine 64, and shows the horizontal position state of the second stranded wire machine 64 indicated by the sensor data of the position sensor 74B. ..
- the fourth state display unit 524B displays "horizontal position confirmation OK".
- "Horizontal position confirmation OK” indicates that the lateral position of the second stranded wire machine 64 indicated by the sensor data of the position sensor 74B is normal.
- the fourth state display unit 524B is displayed in a color (for example, green) indicating that it is normal.
- the fourth state display unit 524B corresponding to the position sensor 74B provided in the second twisting machine 64 is a position in the layout screen area 501 corresponding to the position where the position sensor 74B is actually provided in the first equipment 51. Is displayed in. That is, the fourth state display unit 524B is located near the image of the second stranded wire machine 64 displayed in the layout screen area 501, corresponding to the position sensor 74B provided in the second stranded wire machine 64. Is displayed.
- the generation process 102 determines the position where the fourth state display unit 524B should be displayed based on the display position data 139. In FIG. 4, the fourth state display unit 524B and the image of the second stranded wire machine 64 are connected so that the relationship between the fourth state display unit 524B and the image of the second stranded wire machine 64 becomes clearer. The dotted line is displayed.
- the plurality of status display units 523A, 523B, 524A, 524B are displayed at positions in the layout screen area 501 corresponding to the plurality of sensors 73A, 73B, 74A, 74B. Therefore, the user who has referred to the management screen 500 can intuitively understand which part 63, 64 in the first equipment 51 is the state indicated by the state display units 523A, 523B, 524A, 524B. can.
- the first state display unit 523A is displayed as "vibration value increase”. , Indicates that the vibration state of the first stranded wire machine 63 is abnormal.
- the second state display unit 523B displays "horizontal position confirmation NG" and indicates that the horizontal position of the first twisting machine 63 is abnormal.
- the first state display unit 523A and the second state display unit 523B are displayed in a color (for example, red) indicating that they are abnormal.
- the first twisting machine 63 and the second twisting machine 64 are provided. Only the status display units 523A, 523B, 524A, and 524B corresponding to 64 are displayed. However, when the sensor is provided in another part 61, 62, 65, 66, 67, the state display unit corresponding to the other part 61, 62, 65, 66, 67 is in the layout screen area 501. It may be displayed in.
- a plurality of history display units 513, 514, 517 are displayed in the layout screen area 501.
- the history display unit 513, 514, 517 displayed in the layout screen area 501 is also referred to as a simple history display unit.
- the history display units 513, 514, 517 are generated from the history data.
- the plurality of history display units 513, 514, 517 show the history of failure or maintenance of the first equipment 51 according to the history data.
- the history display units 513, 514, 517 are displayed separately for each of the parts 63, 64, 67.
- the plurality of history display units 513, 514, 517 correspond to the parts 63, 64, 67 in which an event such as failure or maintenance has occurred among the plurality of parts 61, 62, 63, 64, 65, 66, 67. ..
- the three history display units 513, 514, 517 are displayed in the layout screen area 501. Will be done.
- Each of the plurality of history display units 513, 514, 517 displays one or a plurality of events that have occurred in the past at the corresponding sites.
- the plurality of history display units 513, 514, 517 correspond to the first history display unit 513 corresponding to the first stranded wire machine 63, the second history display unit 514 corresponding to the second stranded wire machine 64, and the control panel 67.
- the third history display unit 517 is included.
- the generation process 102 is configured to generate the display contents of each of the plurality of history display units 513, 514, 517 from the history data included in the history database 133.
- the simple history data 202 described later is used to generate the display contents of each of the plurality of history display units 513, 514, 517.
- the first history display unit 513 shown in FIG. 4 displays a plurality of events 91N, 93N, 95N that have occurred in the past in the first stranded wire machine 63.
- the first history display unit 513 corresponding to the first twisting machine 63 is the first twisting machine in which the event 91N, 93N, 95N occurs among the plurality of parts 61, 62, 63, 64, 65, 66, 67. It is displayed at a position in the layout screen area 501 corresponding to 63. That is, the first history display unit 513 is displayed in the vicinity of the image of the first twisting machine 63 displayed in the layout screen area 501.
- the generation process 102 determines the position where the first history display unit 513 should be displayed based on the display position data 139.
- the first history display unit 513 and the image of the first stranded wire machine 63 are connected so that the relationship between the first history display unit 513 and the image of the first stranded wire machine 63 becomes clearer.
- the dotted line is displayed.
- the second history display unit 514 shown in FIG. 4 displays an event 94N that has occurred in the past in the second stranded wire machine 64.
- the second history display unit 514 corresponding to the second stranded wire machine 64 corresponds to the second stranded wire machine 64 in which the event 94N occurred among the plurality of parts 61, 62, 63, 64, 65, 66, 67. , Is displayed at a position within the layout screen area 501. That is, the second history display unit 514 is displayed in the vicinity of the image of the second stranded wire machine 64 displayed in the layout screen area 501.
- the generation process 102 determines the position where the second history display unit 514 should be displayed based on the display position data 139.
- the second history display unit 514 and the image of the second stranded wire machine 64 are connected so that the relationship between the second history display unit 514 and the image of the second stranded wire machine 64 becomes clearer.
- the dotted line is displayed.
- the third history display unit 517 shown in FIG. 4 displays the event 92N that has occurred in the past on the control panel 67.
- the third history display unit 517 corresponding to the control panel 67 is in the layout screen area 501 corresponding to the control panel 67 in which the event 92N has occurred among the plurality of parts 61, 62, 63, 64, 65, 66, 67. It is displayed at the position of. That is, the third history display unit 517 is displayed in the vicinity of the image of the control panel 67 displayed in the layout screen area 501.
- the generation process 102 determines the position where the third history display unit 517 should be displayed based on the display position data 139. In FIG. 4, a dotted line connecting the third history display unit 517 and the image of the control panel 67 is displayed so that the relationship between the third history display unit 517 and the image of the control panel 67 becomes clearer. ing.
- the plurality of history display units 513, 514, 517 are displayed at positions in the layout screen area 501 corresponding to the sites where the displayed events 91N, 92N, 93N, 94N, 95N have occurred. Therefore, the user who has referred to the management screen 500 can intuitively understand which part 63, 64, 67 in the first equipment 51 the history shown by the history display units 513, 514, 517 is. can.
- the plurality of history display units 513, 514, 517 and the plurality of status display units 523A, 523B, 524A, 524B correspond to the arrangement of the parts in the first equipment 51. Therefore, the user who has referred to the management screen 500 shows the current state of each part 63, 64 in the first equipment 51 indicated by the status display units 523A, 523B, 524A, 524B, and the history display units 513, 514, 517. It becomes easy to grasp the relationship with the history of each part. As a result, it becomes easy for a user such as a maintenance person to make a maintenance plan for the first equipment 51. For example, the user can easily determine the timing and part of the maintenance action to be performed next by considering the past failure occurrence status or maintenance implementation status of each part and the current state of each part. can.
- markers 91, 92, 93, 94, 95 indicating where the events 91N, 92N, 93N, 94N, 95N such as failure or maintenance occurred. Is displayed. Markers 91, 92, 93, 94, 95 are generated from historical data.
- markers 91, 92, 93, 94, 95 are displayed in FIG.
- Markers 91, 92, 93, 94, 95 are the sites 63, 64, 67 in which the event 91N, 92N, 93N, 94N, 95N occurred among the plurality of sites 61, 62, 63, 64, 65, 66, 67. It is displayed at the position in the layout screen area 501 corresponding to.
- the markers 91, 92, 93, 94, 95 are displayed at positions 63, 64, 67 at each site substantially corresponding to the position of the device in which the event occurred.
- one marker 94 is displayed in the image of the second twisting machine 64 shown in FIG. Will be done.
- the generation process 102 determines the position where the marker 94 should be displayed based on the display position data 139.
- one marker 92 is displayed in the image of the control panel 67 shown in FIG.
- the generation process 102 determines the position where the marker 92 should be displayed based on the display position data 139.
- the markers 91, 92, 93, 94, 95 Since the position where the event occurred is displayed by the markers 91, 92, 93, 94, 95, it becomes easy for the user to grasp the position where the event occurs. Further, the markers 91, 92, 93, 94, 95 directly indicate the position where the event occurs, so that the history display units 513, 514, 517 are displayed slightly away from the respective parts 63, 64, 67. However, the user can intuitively understand where the event is occurring.
- the first screen area 530 and the second screen area 540 shown in FIG. 4 are areas for displaying various data in a switchable manner.
- the failure number transition data 531 in the first equipment 51 is displayed.
- the failure number transition data 531 may be generated from the history database 133, or may be generated from another database related to failures.
- the time-series sensor data 541 of the vibration sensor 73A included in the first twisting machine 63 is displayed.
- Each of the plurality of status display units 523A, 523B, 524A, and 524B displayed in the layout screen area 501 can be selected by the user's selection operation (first selection operation).
- the first selection operation is, for example, a user operating a mouse included in the user terminal 30 to click and select one of a plurality of status display units 523A, 523B, 524A, 524B.
- the second screen area 540 is the first twisting machine 63, which is more detailed than the first state display unit 523A.
- Data 541 indicating the state of is displayed.
- the data 541 displayed here is, for example, the time-series sensor data 541 of the vibration sensor 73A for a predetermined period (24 hours in FIG. 4) from the past to the present (16:00 on May 27 in FIG. 4). Is.
- the second screen area 540 functions as a detailed state display area for displaying a more detailed state than the state display units 523A, 523B, 524A, and 524B.
- the first screen area 530 can also function as a detailed state display area for displaying a more detailed state than the state display units 523A, 523B, 524A, and 524B.
- the plurality of status display units 523A, 523B, 524A, 524B displayed in the layout screen area 501 are useful for the user to grasp the status of each part in the first equipment 51 as a whole.
- the second screen area 540 which is a detailed state display area, is useful for the user to grasp a more detailed state of each part.
- the management screen 500 shown in FIG. 4 includes a detailed history display unit 550 as described above. However, in FIG. 4, the inside of the detailed history display unit 550 is omitted for convenience. An example of the content displayed on the detailed history display unit 550 is shown in FIG. In FIG. 7, the layout screen area 501, the first screen area 530, and the second screen area 540 are omitted.
- the detailed history display unit 550 is an area for displaying the history data included in the history database 133 in a predetermined order.
- the predetermined order is the order of occurrence date and time of an event such as failure or maintenance.
- the history is not displayed separately for each part, but is displayed in the predetermined order described above.
- the detailed history display unit 550 is configured to be scrollable, for example, and can display all the history data included in the history database 133.
- the detailed history display unit 550 is configured to show a more detailed history than the history display unit 513, 514, 517. The user can grasp the contents of the detailed history by referring to the detailed history display unit 550.
- FIG. 8 shows the data structure of the history data stored in the history database 133.
- the history data includes history number data 200, occurrence date / time data 201, simple history data 202, and detailed history data 203.
- the history number data 200 is identifier data for uniquely identifying each of the plurality of history data.
- the occurrence date / time data 201 indicates the occurrence date / time of an event such as failure or maintenance.
- the simple history data 202 includes a brief explanation of the event that has occurred, and displays the display contents (excluding the date and time of occurrence) in the history display unit 513, 514, 517 (simple history display unit) displayed in the layout screen area 501. show.
- the display contents of the history display units 513, 514, 517 are generated based on the occurrence date / time data 201 and the simple history data 202.
- the processing apparatus 11 grasps which part or device the event indicated by each history data occurred, for example, by the part name data 244 (described later) and the device name data 245 (described later) included in the detailed history data 203. can do.
- the detailed history data 203 includes failure phenomenon data 241, failure phenomenon detailed data 242, treatment / countermeasure / work content data 243, part name data 244, device name data 245, stop time data 246, and corresponding sensor identifier 247.
- the failure phenomenon data 241 is text data that briefly indicates the content of the failure.
- the failure phenomenon detailed data 242 is text data indicating the detailed contents of the failure.
- the treatment / countermeasure / work content data 243 is text data indicating any of the treatment, countermeasure, and work content.
- the part name data 244 is data indicating a part where an event such as a failure has occurred.
- the device name data 245 is data indicating the device in the site where an event such as a failure has occurred.
- the stop time data 246 is data indicating the time when the first equipment 51 is stopped due to an event such as a failure.
- Corresponding sensor identifier 247 indicates a sensor associated with an event such as a failure. For example, when a failure that occurs in the first stranded wire machine 63 appears as an abnormal vibration in the first stranded wire machine 63, the vibration sensor 73A is associated with the failure, and the identifier is stored in the corresponding sensor identifier 247. Will be done.
- the detailed history display unit 550 shown in FIG. 7 has display items substantially in line with the data structure of the history data described above. Specifically, the detailed history display unit 550 displays the history number 1200, the date and time of occurrence 1201, the failure phenomenon 1241, the failure phenomenon details 1242, the treatment / countermeasure / work content 1243, the part name 1244, the device name 1245, and the display items. It has a stop time of 1246.
- the history number 1200 corresponds to the history number data 200.
- the occurrence date and time 1201 corresponds to the occurrence date and time data 201.
- the failure phenomenon 1241 corresponds to the failure phenomenon data 241.
- the failure phenomenon detail 1242 corresponds to the failure phenomenon detail data 242.
- the treatment / countermeasure / work content 1243 corresponds to the treatment / countermeasure / work content data 243.
- the part name 1244 corresponds to the part name data 244.
- the device name 1245 corresponds to the device name data 245.
- the stop time 1246 corresponds to the stop time data 246.
- the detailed history display unit 550 can not only display a list of history data stored in the history database 133, but also accept input of history data for a newly generated event.
- the history update process 104 (see FIG. 3) is configured to receive new history data input by the user operation and store the new history data in the history database 133.
- the generation process 102 updates the management screen information 500A so that the new history data is reflected.
- the new event is displayed on the history display units 513, 514, 517 corresponding to the portion where the new event has occurred, and a marker indicating the new event is displayed at the location where the new event has occurred.
- the management device 10 may accept input of new history data on a screen different from the detailed history display unit 550.
- Events 91N, 92N, 93N, 94N, 95N included in the plurality of history display units 513, 514, 517 displayed in the layout screen area 501 can be selected by the user's selection operation (second selection operation).
- the second selection operation is, for example, a user operating a mouse included in the user terminal 30 to click and select one of a plurality of events 91N, 92N, 93N, 94N, 95N.
- the detailed history display unit 550 displays the detailed history of the event 94N.
- the data (history data whose history number is "aaa-0004" in FIG. 7) is displayed.
- the detailed history display unit 550 can display a large amount of history data, the size of the detailed history display unit 550 is limited, so that the history data desired by the user is not always displayed.
- the detailed history data desired by the user is displayed.
- any one of the events 91N, 92N, 93N, 94N, 95N included in the plurality of history display units 513, 514, 517 displayed in the layout screen area 501 is selected by the second selection operation, it is selected.
- the sensor data of the sensor corresponding to the event is displayed in the second screen area 540, which is the detailed status display unit.
- the sensor data of the sensor corresponding to the selected event may be displayed in the first screen area 530, which is the detailed status display unit.
- the selected event 93N is set in the second screen area 540.
- the time series sensor data 542 of the corresponding vibration sensor 73A is displayed.
- the time-series sensor data 542 displayed in the second screen area 540 includes the sensor data as of March 28, which is the date and time when the event 93N occurred.
- the user who referred to the time-series sensor data 542 can grasp the vibration state when the event 93N occurs.
- the processing device 11 grasps the sensor corresponding to the selected event 93N by referring to the corresponding sensor identifier 247 included in the history data of the selected event 93N.
- the detailed history display unit 550 displays the detailed history of the event 94N.
- the data (history data whose history number is "aaa-0004" in FIG. 7) is displayed.
- the detailed history display unit 550 can display a large amount of history data, the size of the detailed history display unit 550 is limited, so that the history data desired by the user is not always displayed.
- the detailed history data desired by the user is displayed.
- FIG. 10 shows another example of the display of the first screen area 530 and the second screen area 540.
- the time-series sensor data 533 of the vibration sensor 73A corresponding to the event 93N is displayed.
- the time-series sensor data 533 displayed in the first screen area 530 includes the sensor data as of March 28, which is the date and time when the event 93N occurred.
- the time-series sensor data 533 is displayed, for example, by selecting the event 93N in the first history display unit 513 by the second selection operation.
- the time-series sensor data 533 (past sensor data) at the time in the past when the event 93N occurred is displayed.
- the time-series sensor data 543 (current sensor data) including the current time point ( May 27) of the vibration sensor 73A corresponding to the event 93N (see FIG. 4) is displayed in the second screen area 540.
- FIG. 11 shows the procedure of the failure / maintenance time calculation process 105 shown in FIG.
- the failure / maintenance time calculation process 105 is automatically executed when the user selects execution or at a predetermined timing.
- the processing device 11 reads the sensor data from the database 13 (step S311).
- the sensor data to be read is, for example, sensor data for a predetermined period from a certain point in the past to the present.
- the processing device 11 obtains the expected time of occurrence of an event at the site or the device from the read sensor data (step S312).
- the expected time is determined using, for example, a trained model trained to obtain the expected time by machine learning.
- the trained model for obtaining the expected time is composed of machine learning using past sensor data and historical data.
- the trained model is configured to output the expected failure time when sensor data is input.
- the processing device 11 outputs the obtained expected time (step S313).
- the obtained expected time is given to the generation process 102, for example, and is used for the generation of the management screen information 500A.
- FIG. 12 shows an example of the predicted time display unit 534 for displaying the predicted time obtained by the failure / maintenance time calculation process 105.
- the expected time display unit 534 shown in FIG. 12 shows the expected failure time (around September 21, 2020) and the failed device (drive motor) in the first stranded wire machine 63.
- the user can easily make a maintenance plan.
- -Work content data 244 part name data, 245 device name data, 246 downtime data, 247 compatible sensor identifier
- 500 management screen 500A management screen information, 501 layout screen area, 513 first history display unit, 514 second history Display unit, 517, 3rd history display unit, 523A, 1st status display unit, 523B, 2nd status display unit, 524A, 3rd status display unit, 524B, 4th status display unit, 530, 1st screen area, 513, failure count transition data, 533 time series sensor data, 534 expected time display unit, 540 second screen area, 541 time series sensor data, 542 time series sensor data, 543 time series sensor data, 550 detailed history display unit, 1200 history number, 1201 occurrence date and time, 1241 failure phenomenon, 1242 failure phenomenon details, 1243 processing / countermeasure / work content, 1244 part name, 1245 device name, 1246 downtime.
Landscapes
- Physics & Mathematics (AREA)
- General Physics & Mathematics (AREA)
- Engineering & Computer Science (AREA)
- Automation & Control Theory (AREA)
- Testing And Monitoring For Control Systems (AREA)
Priority Applications (1)
| Application Number | Priority Date | Filing Date | Title |
|---|---|---|---|
| JP2022529657A JP7298781B2 (ja) | 2020-10-21 | 2021-10-05 | 管理装置、管理方法及びコンピュータプログラム |
Applications Claiming Priority (2)
| Application Number | Priority Date | Filing Date | Title |
|---|---|---|---|
| JP2020-176746 | 2020-10-21 | ||
| JP2020176746 | 2020-10-21 |
Publications (1)
| Publication Number | Publication Date |
|---|---|
| WO2022085426A1 true WO2022085426A1 (ja) | 2022-04-28 |
Family
ID=81289641
Family Applications (1)
| Application Number | Title | Priority Date | Filing Date |
|---|---|---|---|
| PCT/JP2021/036743 Ceased WO2022085426A1 (ja) | 2020-10-21 | 2021-10-05 | 管理装置、管理方法及びコンピュータプログラム |
Country Status (2)
| Country | Link |
|---|---|
| JP (1) | JP7298781B2 (https=) |
| WO (1) | WO2022085426A1 (https=) |
Cited By (1)
| Publication number | Priority date | Publication date | Assignee | Title |
|---|---|---|---|---|
| CN115914722A (zh) * | 2022-11-29 | 2023-04-04 | 四川虹魔方网络科技有限公司 | 智能电视历史记录精细化运营系统 |
Citations (6)
| Publication number | Priority date | Publication date | Assignee | Title |
|---|---|---|---|---|
| JPH0612113A (ja) * | 1992-06-26 | 1994-01-21 | Okuma Mach Works Ltd | 点検情報表示機能を有する数値制御装置 |
| JP2009157517A (ja) * | 2007-12-25 | 2009-07-16 | Shibuya Kogyo Co Ltd | 生産管理システム |
| JP2010224893A (ja) * | 2009-03-24 | 2010-10-07 | Yamatake Corp | 監視装置、及び監視方法 |
| JP2011090559A (ja) * | 2009-10-23 | 2011-05-06 | Digital Electronics Corp | エディタ装置、表示入力装置、異常表示方法、画面作成方法、及びプログラム |
| JP2018173333A (ja) * | 2017-03-31 | 2018-11-08 | 住友重機械工業株式会社 | 故障診断システム |
| WO2019220913A1 (ja) * | 2018-05-15 | 2019-11-21 | 住友電気工業株式会社 | 管理装置、管理方法および管理プログラム |
Family Cites Families (5)
| Publication number | Priority date | Publication date | Assignee | Title |
|---|---|---|---|---|
| JP3124644B2 (ja) * | 1992-12-18 | 2001-01-15 | 株式会社日立製作所 | プロセスデータの表示方法及び装置 |
| JP3848920B2 (ja) | 2000-10-20 | 2006-11-22 | ダイセル化学工業株式会社 | プラント制御監視装置 |
| JP2005157608A (ja) | 2003-11-25 | 2005-06-16 | Mitsubishi Electric Corp | プラント設備の予防保全支援装置 |
| JP2016148963A (ja) | 2015-02-12 | 2016-08-18 | 株式会社日立製作所 | 故障予兆診断システム及び故障予兆診断方法 |
| JP2020149289A (ja) | 2019-03-13 | 2020-09-17 | オムロン株式会社 | 表示システム、表示方法、及び表示プログラム |
-
2021
- 2021-10-05 JP JP2022529657A patent/JP7298781B2/ja active Active
- 2021-10-05 WO PCT/JP2021/036743 patent/WO2022085426A1/ja not_active Ceased
Patent Citations (6)
| Publication number | Priority date | Publication date | Assignee | Title |
|---|---|---|---|---|
| JPH0612113A (ja) * | 1992-06-26 | 1994-01-21 | Okuma Mach Works Ltd | 点検情報表示機能を有する数値制御装置 |
| JP2009157517A (ja) * | 2007-12-25 | 2009-07-16 | Shibuya Kogyo Co Ltd | 生産管理システム |
| JP2010224893A (ja) * | 2009-03-24 | 2010-10-07 | Yamatake Corp | 監視装置、及び監視方法 |
| JP2011090559A (ja) * | 2009-10-23 | 2011-05-06 | Digital Electronics Corp | エディタ装置、表示入力装置、異常表示方法、画面作成方法、及びプログラム |
| JP2018173333A (ja) * | 2017-03-31 | 2018-11-08 | 住友重機械工業株式会社 | 故障診断システム |
| WO2019220913A1 (ja) * | 2018-05-15 | 2019-11-21 | 住友電気工業株式会社 | 管理装置、管理方法および管理プログラム |
Cited By (1)
| Publication number | Priority date | Publication date | Assignee | Title |
|---|---|---|---|---|
| CN115914722A (zh) * | 2022-11-29 | 2023-04-04 | 四川虹魔方网络科技有限公司 | 智能电视历史记录精细化运营系统 |
Also Published As
| Publication number | Publication date |
|---|---|
| JPWO2022085426A1 (https=) | 2022-04-28 |
| JP7298781B2 (ja) | 2023-06-27 |
Similar Documents
| Publication | Publication Date | Title |
|---|---|---|
| US9557735B2 (en) | Methods and apparatus to manage process control status rollups | |
| JP4125137B2 (ja) | プロセス制御システムにおけるFieldbusデバイス用機能強化型アラート | |
| JP5324753B2 (ja) | 機械のメンテナンスのためのアフターサービスプラットフォーム | |
| US9678160B2 (en) | Industrial automatic-diagnostic device | |
| EP3170778A1 (en) | Textile-machine management system | |
| JP2006517321A (ja) | プロセスプラントに遠隔診断及び保守サービスを提供するサービス・ファシリティ | |
| KR102145984B1 (ko) | 자동화설비의 고장분석장치 및 방법 | |
| JP2013067884A (ja) | 繊維機械システム及び繊維機械 | |
| JP2017062729A (ja) | プラント運転システム及びプラント運転方法 | |
| JP2014026415A (ja) | 発注支援装置、発注支援方法および生産管理システム | |
| WO2018235399A1 (ja) | プラント支援評価システム及びプラント支援評価方法 | |
| JP7298781B2 (ja) | 管理装置、管理方法及びコンピュータプログラム | |
| EP2697698A1 (en) | Monitoring process control system | |
| JP2006277185A (ja) | 故障予測診断支援システム | |
| KR102409862B1 (ko) | 실시간 로봇 모니터링 서비스 제공 방법, 서버 및 프로그램 | |
| CN116504039B (zh) | 一种室内设备的异常识别方法、装置及电子设备 | |
| JP2018180995A (ja) | 安全計装制御装置及びその方法並びに安全計装システム | |
| CN116472372A (zh) | 用于操作纺织机的操作设备和用于操作纺织机的方法 | |
| KR102409863B1 (ko) | 로봇 예방 및 예측 조치 서비스 제공 방법, 서버 및 프로그램 | |
| TWI904582B (zh) | 資訊處理裝置、資訊處理方法、電腦程式產品以及生產系統 | |
| JP2002073158A (ja) | リモート監視・診断システム | |
| US9471052B2 (en) | Alarm visualization | |
| KR101239804B1 (ko) | 제어봉제어계통 고장진단 장치 및 그 방법 | |
| US20220121163A1 (en) | Method for visualizing the automation of a technical system | |
| JPH11345003A (ja) | プラント制御システム |
Legal Events
| Date | Code | Title | Description |
|---|---|---|---|
| ENP | Entry into the national phase |
Ref document number: 2022529657 Country of ref document: JP Kind code of ref document: A |
|
| 121 | Ep: the epo has been informed by wipo that ep was designated in this application |
Ref document number: 21882567 Country of ref document: EP Kind code of ref document: A1 |
|
| NENP | Non-entry into the national phase |
Ref country code: DE |
|
| 122 | Ep: pct application non-entry in european phase |
Ref document number: 21882567 Country of ref document: EP Kind code of ref document: A1 |