WO2022075404A1 - デザイン評価装置、デザイン評価システム、デザイン評価方法、およびデザイン評価プログラム - Google Patents
デザイン評価装置、デザイン評価システム、デザイン評価方法、およびデザイン評価プログラム Download PDFInfo
- Publication number
- WO2022075404A1 WO2022075404A1 PCT/JP2021/037130 JP2021037130W WO2022075404A1 WO 2022075404 A1 WO2022075404 A1 WO 2022075404A1 JP 2021037130 W JP2021037130 W JP 2021037130W WO 2022075404 A1 WO2022075404 A1 WO 2022075404A1
- Authority
- WO
- WIPO (PCT)
- Prior art keywords
- design
- user
- evaluation
- sight
- line
- Prior art date
- Legal status (The legal status is an assumption and is not a legal conclusion. Google has not performed a legal analysis and makes no representation as to the accuracy of the status listed.)
- Ceased
Links
Images









Classifications
-
- A—HUMAN NECESSITIES
- A61—MEDICAL OR VETERINARY SCIENCE; HYGIENE
- A61B—DIAGNOSIS; SURGERY; IDENTIFICATION
- A61B3/00—Apparatus for testing the eyes; Instruments for examining the eyes
- A61B3/10—Objective types, i.e. instruments for examining the eyes independent of the patients' perceptions or reactions
- A61B3/113—Objective types, i.e. instruments for examining the eyes independent of the patients' perceptions or reactions for determining or recording eye movement
-
- A—HUMAN NECESSITIES
- A61—MEDICAL OR VETERINARY SCIENCE; HYGIENE
- A61B—DIAGNOSIS; SURGERY; IDENTIFICATION
- A61B5/00—Measuring for diagnostic purposes; Identification of persons
- A61B5/16—Devices for psychotechnics; Testing reaction times ; Devices for evaluating the psychological state
-
- G—PHYSICS
- G06—COMPUTING OR CALCULATING; COUNTING
- G06T—IMAGE DATA PROCESSING OR GENERATION, IN GENERAL
- G06T7/00—Image analysis
Definitions
- the present invention relates to a design evaluation device, a design evaluation system, a design evaluation method, and a design evaluation program.
- Patent Document 1 an image of an object to be evaluated and an item for evaluating the sensitivity of the image are presented to the subject, and the subject is made to evaluate the image, and the subject evaluates the image. While doing so, a technique for measuring the gaze transition of a subject is disclosed. The purpose of this technique is to calculate a unified sensibility evaluation for the image by adding the subject's line-of-sight information to the variation in the sensibility evaluation between the subjects.
- a technique for calculating the correlation between the subject's line-of-sight position in the image of the evaluation target and the salience of the evaluation target is known.
- a line-of-sight tracking device 3 for measuring a subject's line of sight, a physiological index measuring device 4 for measuring a subject's physiological index, and a subject's psychological state are estimated from the subject's physiological index.
- a line-of-sight analysis system 1 including at least a line-of-sight analysis device 2 developed so as to be able to analyze the line-of-sight of the subject in association with the psychological state of the subject is disclosed.
- the region where the concentration of the subject's line-of-sight position is equal to or higher than the concentration threshold and the saliency is equal to or higher than the saliency threshold is a region where the line of sight is directed frequently and the saliency is also high. , A region of interest that may affect the subject's impression.
- Patent Document 1 aims to reduce the variation in evaluation among individuals with respect to the image of the evaluation target. Therefore, when a seller or the like formulates a sales strategy in consideration of the subjectivity of an individual consumer, there is a problem that it is difficult to understand what kind of individual sensibility works on the image of the evaluation target.
- an object of the present invention is to provide a design evaluation device, a design evaluation system, a design evaluation method, and a design evaluation program capable of visualizing a user's sensitivity to an image of an evaluation object.
- An image acquisition unit that acquires an image of the evaluation object, a display control unit that displays the image of the evaluation object on a display device, and an expression providing unit that provides a user with an expression related to the design of the evaluation object.
- the expression is the user's regarding the design.
- a design evaluation device having a sensitivity analysis unit that calculates the degree of influence, which is the degree of influence on sensitivity.
- the sensibility information acquisition unit further has a sensibility information acquisition unit that receives the reaction of the user to the expression and acquires an index indicating the relationship between the expression and the user's sensibility regarding the design based on the reaction.
- the design evaluation device wherein the analysis unit calculates the degree of influence based on the acquired information on the line of sight and the index.
- the expression providing unit provides a plurality of expressions related to the design of the evaluation object to the user, and the sensitivity analysis unit calculates the influence degree among the plurality of expressions (2).
- the Kansei information acquisition unit acquires the user's evaluation of the design, and obtains the user's evaluation.
- the Kansei information acquisition unit acquires the response time required for the user to complete the evaluation of the design regarding the expression, and calculates the index based on the response time (2).
- the design evaluation device according to any one of (8).
- the line-of-sight information acquisition unit provides information on the user's line of sight from the time the expression is provided to the user by the expression providing unit until the user's reaction to the expression is received by the sensitivity information acquisition unit.
- the design evaluation device according to any one of (2) to (11) above, which is continuously acquired.
- the display device the line-of-sight measuring device that measures the user's line of sight to the image of the evaluation object displayed on the display device and outputs information about the line of sight, and the above-mentioned (1) to (14).
- a design evaluation system comprising the design evaluation device according to any one of them.
- the step (d) of acquiring information on the user's line of sight with respect to the image of the evaluation object displayed on the display device, and the acquired information on the line of sight the expression relates to the design.
- a design evaluation method comprising the step (e) of calculating the degree of influence, which is the degree of influence on the user's sensibilities.
- step (e) Prior to the step (e), a step of accepting the user's reaction to the expression and acquiring an index showing the relationship between the expression and the user's sensibility regarding the design based on the reaction (17).
- step (c) a plurality of expressions relating to the design of the evaluation object are provided to the user, and in the step (e), the degree of influence is calculated among the plurality of expressions. 16) or the design evaluation method according to (17).
- a design evaluation program for causing a computer to execute the process included in the design evaluation method according to any one of (16) to (19) above.
- an expression relating to a design proposal of an evaluation object is provided, and the degree of influence, which is the degree to which the expression affects the user's sensibility regarding the design proposal, is calculated. Therefore, it is possible to visualize the user's sensibility for the design proposal of the evaluation object. As a result, it becomes easy to see what kind of individual sensibility works for the design proposal of the evaluation object.
- FIG. 1 It is a schematic diagram which looked at the design evaluation system which concerns on 1st Embodiment from above. It is a block diagram exemplifying the schematic hardware configuration of the design evaluation system shown in FIG. 1. It is a functional block diagram which illustrates the main function of the design evaluation apparatus shown in FIG. It is a figure which illustrates the Kansei question item. It is a flowchart which illustrates the design evaluation method of the design evaluation apparatus which concerns on 1st Embodiment. It is a schematic diagram which illustrates the design proposal (design proposal 1) of the evaluation object. It is a schematic diagram showing the distribution of the line-of-sight position when the design proposal 1 image and "innovative" are displayed as the sensitivity question item on a heat map.
- FIG. 1 It is a schematic diagram which illustrates the case where the image of two design proposals (design proposals 1 and 2) and one sensitivity question item (“innovative”) are displayed. It is a schematic diagram showing the distribution of the user's line-of-sight position when the images of the two design proposals and "innovative” are displayed in the monitor test on a heat map. It is a schematic diagram showing the distribution of the user's line-of-sight position when the images of the two design proposals and "it looks delicious” are displayed in the monitor test on a heat map. It is a schematic diagram showing the distribution of the user's line-of-sight position when the images of the two design proposals and "like” are displayed in the monitor test on a heat map.
- FIG. 1 is a schematic view of the design evaluation system 100 according to the first embodiment as viewed from above
- FIG. 2 is a block diagram illustrating a schematic hardware configuration of the design evaluation system 100 shown in FIG. .
- FIG. 3 is a functional block diagram illustrating the main functions of the design evaluation device 300 shown in FIG.
- the design evaluation system 100 of the present embodiment displays the images 31 and 32 of the evaluation object and the words 40 related to the design of the evaluation object to the user 10, and these words affect the user's sensitivity regarding the design. Calculate the degree. From this, it is possible to estimate how much the displayed word 40 affects the user's sensibility.
- the evaluation object may be, for example, a product designed by a designer, a product package, an advertisement, or the like.
- the design evaluation system 100 includes a line-of-sight measuring device 200, a design evaluation device 300, a display device 400, an input device 500, an audio output device 600, and a communication device 700. These configurations are communicably connected to each other.
- the line-of-sight measuring device 200 continuously measures the line-of-sight 20 of the user 10 and transmits information about the line-of-sight to the design evaluation device 300.
- the design evaluation device 300 displays the images 31 and 32 of the evaluation target on the display of the display device 400 and presents them to the user 10.
- the information regarding the line of sight is, for example, the place where the user 10 is looking in the images 31 and 32 of the evaluation object (hereinafter referred to as “line-of-sight position”) 50, the line-of-sight direction of the left and right eyes of the user 10, or the left and right of the user 10. It can be the position of the pupil of the eye or the like.
- the line-of-sight measuring device 200 can be attached to the head of the user 10, for example.
- a known eye tracking technique can be adopted for the line-of-sight measurement by the line-of-sight measuring device 200.
- the eye tracking technique may be a non-contact type technique such as a corneal reflex method or a scleral reflex method.
- a contact-type technique such as a search coil method or an eye potential method, or a line-of-sight measurement method other than these may be used.
- the line-of-sight measuring device 200 When measuring the line of sight using the corneal reflex method, the line-of-sight measuring device 200 irradiates each of the left and right eyes of the user 10 with weak near-infrared light, and images the left and right eyes of the user 10 with a camera, for example. .. Then, the line-of-sight measuring device 200 calculates the center position of the reflected light of the near-infrared light on the corneal surface and the center position of the pupil of the eye for each of the left and right eyes of the user 10 from the image of the camera, and based on these. The line of sight 20 of the user 10 is detected. As a result, the line of sight 20 of the user 10 is accurately measured while the user 10 is gazing at the image of the evaluation object.
- the line-of-sight measuring device 200 determines the line-of-sight position of the user 10 in the images 31 and 32 of the evaluation object based on the information regarding the line-of-sight direction of the user 10 in the three-dimensional space, the center positions of the pupils of the left and right eyes of the user 10, and the like. calculate. As information on the line of sight, the line-of-sight directions of the left and right eyes of the user 10, the center positions of the pupils of the left and right eyes of the user 10, and the like are transmitted from the line-of-sight measuring device 200 to the design evaluation device 300, and the design evaluation device 300 displays. The line-of-sight position 50 may be calculated based on the information regarding the line-of-sight.
- the design evaluation device 300 controls the design evaluation system 100 in an integrated manner.
- the design evaluation device 300 may be a personal computer, a smartphone, a PDA (Personal Digital Assistant) in which a design evaluation program described later is installed, a main body (control device) of a tablet terminal, or the like.
- the design evaluation device 300 includes a CPU (Central Processing Unit) 310, a RAM (Random Access Memory) 320, a ROM (Read Only Memory) 330, an auxiliary storage unit 340, and the like.
- a CPU Central Processing Unit
- RAM Random Access Memory
- ROM Read Only Memory
- the CPU 310 executes an OS (Operating System) and a design evaluation program deployed in the RAM 320, and controls the operation of the line-of-sight measuring device 200, the display device 400, the input device 500, the voice output device 600, and the communication device 700.
- the design evaluation program is stored in the ROM 330 or the auxiliary storage unit 340 in advance.
- the RAM 320 stores data or the like temporarily generated by the processing of the CPU 310.
- the ROM 330 stores a program executed by the CPU 310, data used for executing the program, parameters, and the like.
- the auxiliary storage unit 340 has, for example, an HDD (Hard Disk Drive), an SSD (Solid State Drive), or the like, and can store a plurality of images of an evaluation target.
- the evaluation target is imaged by a camera, a scanner, or the like, and for example, JPEG (Joint Photographic Experts Group) format, TIFF (tag image file format) format, PNG (Portable Network image storage), etc. Has been done.
- the auxiliary storage unit 340 stores a plurality of words presented to the user 10. Details of these terms will be described later.
- the auxiliary storage unit 340 also stores the attributes of the user 10 when performing a monitor test described later.
- the display device 400 includes a display and is used to present to the user 10 an image of the evaluation object and words related to the design proposal of the evaluation object. Further, after the user 10 has evaluated the design proposal of the evaluation target object, the evaluation result regarding the design proposal, the result of visualizing the sensibility of the user 10 (the degree of influence described later), and the like are displayed on the display.
- the input device 500 is provided with, for example, a keyboard, a mouse, etc., and is used for the user 10 to perform various instructions (inputs) such as character input by the keyboard, mouse, etc., and various settings. In this embodiment, it is used for inputting a user's attribute in a monitor test, inputting an evaluation by the user 10 regarding a design proposal of an evaluation object, and the like. Further, the input device 500 has a timekeeping ability, and after the image of the evaluation object and the words related to the design proposal of the evaluation object are displayed on the display of the display device 400, the user 10 uses the evaluation object. Measure the time taken to complete the input of evaluation for the design proposal (hereinafter referred to as "response time").
- the voice output device 600 has a speaker, and can provide the user 10 with words linked to the sensibility of the user 10 with respect to the design proposal of the evaluation target object.
- the communication device 700 has, for example, a communication circuit such as a network interface card (NIC: Network Interface Card), and transmits data to and from an external device through a communication network (not shown).
- NIC Network Interface Card
- the image acquisition unit 311 acquires at least one image of the evaluation target stored in the auxiliary storage unit 340, for example. Further, the image acquisition unit 311 can also acquire an image of the evaluation target object from an external server via the communication device 700.
- the line-of-sight information acquisition unit 312 acquires information on the line-of-sight of the user 10 with respect to the image of the evaluation object displayed on the display device 400.
- the line-of-sight information acquisition unit 312 acquires, for example, the line-of-sight position of the user 10 in the image of the evaluation target as information on the line-of-sight from the line-of-sight measuring device 200.
- the expression providing unit 313 presents the user 10 with words regarding the design proposal of the evaluation target object.
- the words can be appropriately selected according to the type, field, content, etc. of the design proposal of the evaluation target in consideration of the emotional matters that the designer or product maker of the evaluation target wants to appeal to the consumer. Therefore, this word can be a word corresponding to the user 10's sensibility regarding the design of the evaluation object. For example, when the evaluation target is a food package, words such as "delicious”, which is a word related to taste, and "like”, which is a word related to the taste of the user 10, can be selected.
- the language may be configured to be preset by the performer of the monitor test or the like when the monitor test is performed by the subject.
- the expression providing unit 313 can present a plurality of words regarding the design proposal of the evaluation object to the user 10. These words are set as "Kansei question items" in the monitor test.
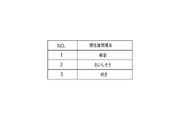
- FIG. 4 exemplifies the three words “innovative”, “delicious”, and “like” regarding the design proposal of a food package.
- the word presented to the user 10 may be a word, a clause, or a sentence including a question, an adjective, a feature of the evaluation object, and the like.
- the speakers of the voice output device 600 may provide the words and sounds to the user 10 by voice.
- the user 10 may be provided with at least one of tactile, olfactory, and taste information in place of or in addition to visual or auditory information such as words.
- tactile, olfactory, and taste information in place of or in addition to visual or auditory information such as words.
- expressions can be Kansei question items.
- the display control unit 314 controls the display of the image of the evaluation target on the display of the display device 400. Further, when the expression provided by the expression providing unit 313 is a word and the word is displayed on the display, the display control unit 314 also controls the display of the word.
- the display control unit 314 displays, for example, an image and words of the evaluation object on the display at the same time.
- the expression is a word will be mainly described, but the case where the expression is something other than a word, for example, a smell or a taste, is the same as the case of a word.
- the sensitivity information acquisition unit 315 receives the reaction of the user 10 to the words, and based on the reaction, calculates an index showing the relationship between the words and the sensitivity of the user 10 regarding the design proposal.
- the index is calculated based on, for example, the evaluation of the user 10 regarding the design proposal of the evaluation target object.
- the evaluation is performed by, for example, the user 10 inputting a score out of 10 points for the design proposal of the evaluation target object. The details of the index calculation method will be described later.
- the line-of-sight information acquisition unit 312 is continuously line-of-sight from the time when a word is provided by the expression providing unit 313 and the word is displayed on the display of the display device 400 until the response of the user 10 to this word is completed. Get information about. That is, the presentation of words by the expression providing unit 313, the reception of the reaction of the user 10 by the sensitivity information acquisition unit 315, and the measurement of the line of sight 20 by the line of sight measuring device 200 are executed in parallel.
- the sensitivity analysis unit 316 calculates the degree to which words affect the sensitivity of the user 10 regarding the design proposal of the evaluation target (hereinafter referred to as "impact degree") based on the information on the line of sight and the above index. The details of the degree of influence will be described later.
- the sensitivity output unit 317 displays the evaluation result of the design proposal of the evaluation target object by the user 10 and the degree of influence on the display.
- FIG. 5 is a flowchart illustrating a design evaluation method of the design evaluation device 300 according to the first embodiment
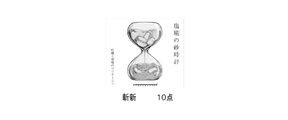
- FIG. 6 is a schematic diagram illustrating a design proposal (design proposal 1) of the evaluation target object.
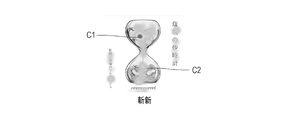
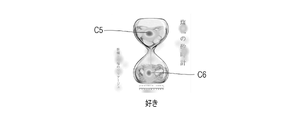
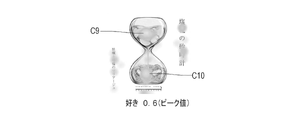
- FIGS. 7A to 7C display a heat map showing the distribution of the line-of-sight position when the design proposal 1 image and "innovative", “delicious”, and “like” are displayed as sensitivity question items, respectively. It is a schematic diagram.
- a heat map is a method of visualizing the intensity of a distribution at a glance by changing the display color according to the intensity of the distribution. Further, FIGS.
- FIGS. 9A to 9C are schematic views illustrating the user's evaluation when the sensitivity question items related to the design proposal 1 are "innovative”, “delicious”, and “like”, respectively.
- FIGS. 9A to 9C are relative line-of-sight heat maps showing the degree to which "innovative”, “delicious”, and “like” affect the user's sensibility regarding the design proposal 1, respectively.
- FIG. 10 is a schematic diagram illustrating the comparison results of the relative line-of-sight heat map, the non-paired line-of-sight heat map, and the salience for each Kansei question item of the design proposal 1.
- an image of the evaluation target is acquired (step S101).
- the image acquisition unit 311 acquires, for example, an image of a package of a certain food among a plurality of images stored in the auxiliary storage unit 340 as an image of the evaluation target (see FIG. 6).
- the design and the image of this evaluation object will be referred to as "design proposal 1" and "design proposal 1 image”, respectively.
- the design proposal 1 is, for example, a novel design proposal that combines an “hourglass” and a “food ingredient”.
- the display control unit 314 controls the design proposal 1 image so as to be displayed on the display of the display device 400.
- a plurality of sensibility question items regarding the design proposal of the evaluation target are provided to the user (step S103).
- the expression providing unit 313 selects, for example, three words “innovative”, “delicious”, and “like” as sensitivity question items.
- the display control unit 314 When displaying the Kansei question items on the display, the display control unit 314 also displays a message requesting the user 10 to evaluate the design proposal 1 for each of the displayed Kansei question items. do.
- the display control unit 314 controls, for example, to display these three Kansei question items one by one in order at predetermined time intervals.
- the predetermined time interval is a time during which the user 10 can sufficiently evaluate the design proposal 1 for each word.
- the information regarding the user's line of sight with respect to the image of the evaluation object displayed on the display device 400 is acquired (step S104).
- the line-of-sight measuring device 200 measures the line of sight of the user 10 with respect to the design proposal 1 image displayed on the display device 400, and transmits information about the line of sight to the line-of-sight information acquisition unit 312.
- the line-of-sight measuring device 200 continuously measures the line-of-sight of the user 10, and the display control unit 314 displays the locus of the line-of-sight position of the user 10 on the display in chronological order. Changes over time can be easily grasped.
- the distribution of the line-of-sight position when "innovative”, “delicious”, and “like” are displayed is exemplified by the heat map.
- the part with a strong distribution is painted with a warm color (dark part in the figure), and the part with a weak distribution is painted with a cool color.
- concentration zones C5 and C6 there are concentration zones C5 and C6 having a strong distribution of line-of-sight positions in the upper part and the lower part of the "hourglass". It is highly probable that these strong concentration zones C1, C4, C5, and C6 are places where the user 10 is interested.
- the user 10 evaluates the design proposal 1 according to his / her own sensibility, and inputs a score for each sensibility question item using the keyboard and mouse of the input device 500.
- the Kansei information acquisition unit 315 determines whether or not the input of the evaluation regarding the design proposal 1 is completed for each Kansei question item (step S105). As a result of the determination, if the input is not completed (step S105: NO), the process returns to the process of S104.
- step S106 the evaluation of the user 10 regarding the design proposal 1 is acquired (step S106). More specifically, the Kansei information acquisition unit 315 accepts the evaluation of the user 10 for each Kansei question item, and based on the evaluation, an index showing the relationship between each Kansei question item and the user 10's sensitivity regarding the design proposal 1. Is calculated.
- the Kansei information acquisition unit 315 calculates an index for each Kansei question item so as to be proportional to the evaluation of the user 10 for each Kansei question item.
- the user 10's evaluation of the design proposal 1 is 10 points, 4 points, and 6 points, respectively, for "innovative", “delicious”, and “like”. If there is, set the index ratio of each Kansei question item to 10: 4: 6. That is, when 1 is taken with respect to the index of "innovation", “delicious” and “like” mean that the magnitudes are relatively 0.4 and 0.6, respectively.
- the Kansei analysis unit 316 calculates the degree of influence based on the information on the line of sight and the index.
- the information regarding the line of sight is, for example, the line-of-sight position, and by continuously acquiring the information on the line-of-sight position, the distribution of the line-of-sight positions as shown in FIGS. 7A to 7C described above can be obtained.
- the distribution of the line-of-sight positions obtained by separately measuring the line-of-sight of the user 10 is displayed on the heat map for each Kansei question item. Therefore, for Design Proposal 1, in the heat map for each sensitivity question item, the criteria for assigning colors are the same, and the difference in color of each part is relative, so it is possible to compare the difference in color of each part. can.
- the degree of interest and viewpoint of the user 10 who sees the design proposal 1 may change between different sensibility question items. Therefore, it is considered that the influence of each Kansei question item on the distribution of the line-of-sight position is different among the different Kansei question items, so that the criteria should be the same when allocating the color of the heat map among the different Kansei question items. It may not be valid. That is, the scale of the distribution of the line-of-sight position can change depending on how much the sensitivity question item is related to the sensitivity of the user 10. Therefore, by simply comparing the heat maps shown in FIGS.
- the Kansei analysis unit 316 calculates, for example, the distribution of the line-of-sight position for each Kansei question item for the design 1 image by weighting (adding a weight) with the index value as the degree of influence.
- the degree of influence can relatively represent the distribution of the line-of-sight position among the Kansei question items.
- the index is calculated based on the score for each Kansei question item for the design proposal 1. When the user 10 gives a high score to the design proposal 1, it is considered that the sensitivity of the user 10 and the sensitivity question item are closely related.
- the Kansei analysis unit 316 adjusts the scale of the line-of-sight position distribution by weighting the line-of-sight position distribution with the index value for each Kansei question item, and then adjusts the scale of the line-of-sight position distribution according to the strength of the line-of-sight position distribution. Assign colors to generate a heatmap.
- the line-of-sight distribution weights are set to 0.4 and 0.6, respectively, to generate a relative heatmap. That is, the distribution of the line-of-sight positions of "delicious” and “like” is reduced to 0.4 times and 0.6 times the strength as a whole as compared with the case of no weighting.
- the sensitivity output unit 317 displays the evaluation result of the design proposal of the evaluation target object by the user 10 and the degree of influence on the display as a heat map.
- a heat map generated by adjusting the scale of the distribution of the line-of-sight position among a plurality of Kansei question items for example, FIGS. 9A to 9C, hereinafter, “relative line-of-sight heat map””.
- a heat map showing the distribution of the line-of-sight position of the user 10 as it is for each Kansei question item for example, FIGS.
- non-relative line-of-sight heat map Display at least one of the saliency maps for the image of the object side by side at the same time.
- the salience map can be found in publicly known documents (for example, C. Koch, L. Itti and E. Niebur, “A model saliency-based visual attention for rapid scene analysis”, IEEE Transaction on Pattern Analysis and Machine Intelligence, Vol. It can be generated using the technique described in 20 (1998)).
- the design evaluation device 300 of the present embodiment can easily compare the heat maps among a plurality of Kansei question items for one specific design proposal, and the Kansei question item that the user 10 is most impressed with is. You can identify what it was. In addition, in the design proposal that gives a strong impression to the user 10, it is possible to easily visually grasp which part was the element that gave a strong impression. Furthermore, by relativizing and comparing the heat maps among the sensibility items for a plurality of sensibility question items, it is possible to grasp the characteristics of the design proposal.
- the Kansei information acquisition unit 315 calculates the index for each Kansei question item so as to be proportional to the evaluation of the user 10 for each Kansei question item has been described, but is limited to such a case. Not done.
- the Kansei information acquisition unit 315 can also calculate an index for each Kansei question item so as to be proportional to the reciprocal of the response time, for example. This is because the shorter the response time, the stronger the impression of the user 10's sensibility is by the sensibility question item, that is, it is considered that there is a strong connection between the sensibility question item and the sensibility of the user 10. For example, for “innovative,” “delicious,” and “like,” if the response times were 2.5 seconds, 7.1 seconds, and 4.7 seconds, respectively, the reciprocal of the response time would be 0.4. , About 0.14, and about 0.24. That is, when 1 is taken with respect to the index of "innovation", it means that the indexes of "delicious” and “like” are relatively large in size of 0.35 and 0.53, respectively. ..
- the reaction of each sensitivity question item of the design proposal is acquired and analyzed from the information such as the facial expression and posture of the user 10 when the design proposal is viewed. You may. In this configuration, the movement of the line-of-sight position of the user 10 and the time transition of the sensibility are linked, so what was the sensibility when looking at the design proposal, and how they changed with the time transition. It is possible to evaluate whether or not it was.
- a monitor test is performed on one user 10 to generate a heat map
- a similar test is also performed on a plurality of users, and information on the line of sight of each user is described. And it can also be configured to generate an average heatmap for all users based on the indicators.
- the Kansei analysis unit 316 calculates the degree of influence by weighting the information on the line of sight with the value of the index and taking the average for each Kansei question item for all users, and generates a heat map of the degree of influence. do. Therefore, for example, as in the case of the above-mentioned user 10, if many of the other users are strongly impressed by the "innovative" sensitivity question item, the heat map of all users will be "similar to the heat map of user 10". It is thought that a concentrated zone with a strong distribution will appear in "Innovative". As a result, the variation in information and indicators related to the line of sight due to the personal taste of the user and the like can be leveled, and an average heat map for all users can be generated.
- the design evaluation device of the present embodiment described above has the following effects.
- two design proposals and a sensitivity question item (for example, "innovative") related to these are presented to the user 10 at the same time, and one design proposal considered to be in harmony with the sensitivity question item is presented to two designs. It is assumed that a monitor test is performed in which the user 10 is selected from the proposals.
- FIG. 11 is a schematic diagram illustrating the design proposal 2
- FIG. 12 is a schematic diagram illustrating the case where the images of the two design proposals (design proposals 1 and 2) and one sensitivity question item (“innovative”) are displayed. It is a figure.
- FIGS. 13A to 13C heat the images of the two design proposals and the distribution of the user's line-of-sight position when “innovative”, “delicious”, and “like” are displayed, respectively, in the monitor test.
- 14A to 14C are relative gaze heat maps showing the degree to which "innovative", “delicious”, and “like” affect the user's sensibilities regarding the two design proposals, respectively.
- the design plan 2 is a design plan in which a concrete cooking example of "ingredients" is displayed by an illustration.
- the image acquisition unit 311 acquires the design proposal 2 image 62 in addition to the design proposal 1 image 61.
- the display control unit 314 displays, for example, these images side by side at predetermined intervals on the display of the display device 400.
- the expression providing unit 313 presents to the user three sensibility question items of "innovative”, “delicious”, and “like” regarding the design proposal 1 and the design proposal 2. Similar to the first embodiment, these Kansei question items are sequentially displayed on the display of the display device 400 at predetermined time intervals. In the example shown in FIG. 12, the sensitivity question item “innovative” 63 is displayed at a position between the design proposal 1 image 61 and the design proposal 2 image 62. This is to prevent a psychological bias from one of the design proposals by displaying the Kansei question item at the display position between the design proposal 1 image 61 and the design proposal 2 image 62. However, the display position is not limited to this position.
- the input device 500 measures the response time from the display of the Kansei question item to the selection of the design proposal 1 or the design proposal 2 by the user 10 using the keyboard or the mouse.
- the user 10 selects the design proposal 1 or the design proposal 2 to determine the superiority or inferiority of these design proposals.
- the line-of-sight information acquisition unit 312 acquires information on the user's line of sight with respect to the design plan 1 image 61 and the design plan 2 image 62 displayed on the display device 400, and moves the line-of-sight of the user 10 within the response time of the user 10. Measure the history.
- the movement history is displayed on the display of the display device 400 as a locus of the line of sight.
- the heat map of the design proposal 1 image 61 has a weak concentration zone C11 at the upper part of the "hourglass” and a strong concentration zone at the lower part. There is C12.
- the heat map of the design plan 2 image 62 a relatively strong concentration band C13 is written in the upper part of the illustration of the cooking example, and a weak concentration band is written in the lower part. There is C14.
- the heat map of the design proposal 1 image 61 has concentrated zones C15 and C16 with weak lines of sight at the upper and lower parts of the "hourglass". be.
- the heat map of the design proposal 2 image 62 there is a concentration zone C17 that is relatively strong in the illustration of the cooking example.
- the heat map of the design proposal 1 image 61 has concentrated zones C18 and C19 with strong lines of sight at the upper and lower parts of the "hourglass". ..
- the heat map of the design proposal 2 image 62 there is a weak concentration zone C20 in the portion where the characters on the lower side of the illustration of the cooking example are written.
- the heat map shown in FIGS. 13A to 13C is a non-relative line-of-sight heat map that displays the distribution of the line-of-sight position of the user 10 for each Kansei question item, the heat map distribution among the Kansei question items is left as it is. It is not possible to compare strengths. Therefore, in the present embodiment, the degree of influence between the three Kansei question items is displayed on the heat map for the design proposal 1 image 61 and the design proposal 2 image 62. More specifically, it is as follows.
- the Kansei information acquisition unit 315 receives the response time of the user 10 for each Kansei question item, and shows the relationship between each Kansei question item and the user 10's sensibilities regarding the design proposal 1 and the design proposal 2 based on the response time. Get the index.
- the reciprocal of the response time would be 0.4. , About 0.14, and about 0.24. That is, when 1 is taken based on the index of "innovation", it means that the indexes of "delicious” and “like” are relatively large in size of 0.35 and 0.53, respectively. ..
- the Kansei analysis unit 316 calculates the degree of influence among a plurality of Kansei question items based on the acquired information and indicators related to the line of sight. More specifically, the Kansei analysis unit 316 adjusts the scale of the line-of-sight position distribution by weighting the line-of-sight position distribution with the index value for each Kansei question item, and then the line-of-sight position distribution. Colors are assigned according to the strength of, and a heat map of the degree of influence is generated.
- the Kansei analysis unit 316 distributes the line-of-sight positions of "delicious” and “like” based on the distribution of the line-of-sight positions of "innovative" having the largest index value. Weights are set to 0.35 and 0.53, respectively, to generate heatmaps. That is, the distribution of the line-of-sight positions of "delicious” and “like” is reduced to 0.35 times and 0.53 times the strength as a whole as compared with the case where no weight is applied.
- the Kansei analysis unit 316 calculates the degree of influence for each Kansei question item by weighting the information on the line of sight with the value of the index and taking the average for all users. Therefore, for example, if many of the other users are paying more attention to the design plan 1 than the design plan 2, as in the user 10 described above, the heat map of all users is also stronger in the design plan 1 than the design plan 2. It is thought that a concentration zone will appear. As a result, the variation in information and indicators related to the line of sight due to the personal taste of the user is leveled, and an average heat map for all users is generated.
- the Kansei analysis unit 316 analyzes a specific attribute or persona purchasing layer that encourages purchasing motivation by a specific Kansei question item for design proposal 2, for example, according to the consumer's attribute or persona. do.
- the user attributes include, for example, the user's gender, age, married / unmarried, location area, etc.
- a persona is, for example, a fictitious consumer image of purchasing goods and services related to occupations, job titles, annual income, hobbies, values, lifestyles, and the like.
- User attributes and personas are stored, for example, in auxiliary storage 340.
- the sensitivity analysis unit 316 specifies the design proposal 1 and the design proposal 2.
- Kansei The degree of influence is calculated for the question item "innovative", and a heat map of the degree of influence is generated.
- Design Proposal 1 is attracting more attention from the purchasing group of "single women" and is more suitable for sale to consumers. Can be judged.
- one design proposal and a related sensitivity question item are presented to the user 10 at the same time, and a monitor test is performed in which the user 10 evaluates the design proposal.
- This monitor test is performed on a plurality of users including the user 10.
- the user 10 evaluates the design proposal by giving a score (for example, 1 to 10 points) to the design proposal after the design proposal and the sensitivity question item are displayed on the display of the display device 400.
- the line-of-sight measuring device 200 measures the line of sight until the user 10 inputs the evaluation of the design proposal.
- the line-of-sight information acquisition unit 312 acquires, for example, information on the user's line-of-sight with respect to the design proposal 1 image displayed on the display device 400, and measures the movement history of the line-of-sight of the user 10. The movement history is displayed on the display of the display device 400 as a heat map of the line of sight.
- the Kansei information acquisition unit 315 accepts the evaluation of the user 10 of the design proposal for the Kansei question item, and calculates an index showing the relationship between the Kansei question item and the Kansei of the user 10 regarding the design proposal 1 based on the evaluation.
- the sensitivity analysis unit 316 calculates the heat map based on the information and the index related to the line of sight. More specifically, the Kansei analysis unit 316 calculates the degree of influence by weighting the information on the line of sight with the value of the index and taking the average for all users.
- the sensitivity output unit 317 displays the design proposal by dividing the degree of influence according to the score input by the user 10 or the size of the index calculated based on the score. For example, the sensitivity output unit 317 displays a heat map of the degree of influence by dividing the score of the design proposal 1 by the user 10 into a high score and a low score.
- the design proposal 1 is looking at a wide area in the image centering on.
- the degree of influence is calculated by weighting the information on the line of sight with the index calculated based on the user's evaluation, but the present embodiment is not limited to such a case.
- the degree of influence may be calculated by taking the average of all users without weighting the information about the line of sight by the index (that is, assuming that the index is 1.0 regardless of the user's evaluation). That is, in this case, the Kansei information acquisition unit 315 calculates the degree of influence based only on the information regarding the line of sight.
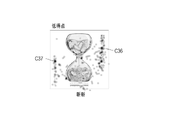
- the impact heatmap calculated by averaging all users has strong concentration zones C30, C31 at the top and bottom of the "hourglass" on the right and left sides of the image.
- concentration bands C32 and C33 in the part where the character string is written.
- the difference between the distribution of the line-of-sight position of the user who gave a high score to the design proposal 1 and the distribution of the line-of-sight position of the user who gave a low score cannot be understood.
- the Kansei output unit 317 can also display a heat map for each high and low score without weighting the information on the line of sight by the index.
- a heat map in which the user 10 has a high score (7 points or more) there is a relatively strong concentration zone C34 at the upper part of the "hourglass" and a concentration zone with a strong line of sight at the lower part. There is C35.
- the strong concentration zone C36 in the portion where the character strings on the right and left sides of the image are written, respectively.
- C37 is C37.
- the distribution of the line-of-sight positions of the users with a high evaluation for the design proposal 1 is scaled to be relatively larger than the distribution of the line-of-sight positions of the users with a low evaluation.
- the degree of influence is calculated and a relative gaze heat map is generated.
- the distribution of the average line-of-sight positions of all users is represented by a non-relative line-of-sight heat map regardless of the evaluation of each user for the design proposal 1. Further, FIG.
- FIG. 17A shows the average of the distribution of the line-of-sight positions of the users who have a high evaluation for the design plan 1 as a non-relative line-of-sight heat map
- FIG. 17B shows the distribution of the line-of-sight positions of the users who have a low evaluation for the design plan 1.
- the average is represented by a non-relative gaze heat map.
- the heat map display patterns of FIGS. 15A to 17B are used properly according to the purpose of verifying the distribution of the line-of-sight position of the user.
- the heat map for one Kansei question item is displayed for one design proposal has been described, but the heat map can be displayed for a plurality of Kansei question items.
- Relative gaze heatmaps and non-relative gaze heatmaps can also be generated for multiple Kansei question items.
- the input user attribute data, the acquired design proposal image, the measurement result of the distribution of the user's line-of-sight position for each sensitivity question item, the index, etc. are accumulated, and these data are used for statistical processing and By performing machine learning, etc., it is possible to make relative comparisons between more design proposals. For example, by extracting the characteristic image feature amount included in the design proposal and calculating the correlation between the extracted image feature amount and the user's Kansei question item by statistical processing, the design proposal and the Kansei question item can be obtained. Can be estimated from one to the other.
- the quality of the analysis of the explanatory variables is judged by using the feature amount of the image of the design proposal as the explanatory variable and the characteristic of the specific sensibility item that encourages the purchasing group of a specific person to purchase as the objective variable, and multiple candidates are selected. It may have a function to automatically propose a suitable design proposal from the design proposals.
- the following usage examples can be considered for this function. For example, assume a "housewife” as the purchasing group of a specific persona. When working on the purchasing motivation of "housewives” by "delicious” and “like”, rank the accumulated design proposals and present the high-ranked design proposals to the designer. This can provide designers with hints when creating new designs. It can also be configured to present improvements to existing design proposals. For example, in order to make the "housewife” group think that it looks more delicious, it has a function to change the form of the design proposal, such as switching the design proposal from "illustration-like design” to "photographic image”. It can also be configured to.
- the design evaluation program may be provided by a computer-readable recording medium such as a USB memory, a flexible disk, or a CD-ROM, or may be provided online via a network such as the Internet.
- the program recorded on the computer-readable recording medium is usually transferred to a memory, a storage, or the like and stored.
- this design evaluation program may be provided as a single application software, or may be incorporated into the software of each device as a function of the server.
- a part or all of the processing executed by the program can be replaced with hardware such as a circuit and executed.
- 100 design evaluation device 200 line-of-sight measuring device, 300 control unit, 310 CPU, 311 Image acquisition department, 312 Line-of-sight information acquisition department, 313 Expression Providing Department, 314 display control unit, 315 Kansei Information Acquisition Department, 316 Kansei Analysis Department, 317 Kansei output unit, 320 RAM, 330 ROM, 340 auxiliary storage, 400 display device, 500 input device, 600 audio output device, 700 communication equipment.
Landscapes
- Health & Medical Sciences (AREA)
- Engineering & Computer Science (AREA)
- Life Sciences & Earth Sciences (AREA)
- Physics & Mathematics (AREA)
- Veterinary Medicine (AREA)
- Public Health (AREA)
- General Health & Medical Sciences (AREA)
- Animal Behavior & Ethology (AREA)
- Surgery (AREA)
- Molecular Biology (AREA)
- Medical Informatics (AREA)
- Biophysics (AREA)
- Heart & Thoracic Surgery (AREA)
- Biomedical Technology (AREA)
- Hospice & Palliative Care (AREA)
- Theoretical Computer Science (AREA)
- Educational Technology (AREA)
- Social Psychology (AREA)
- Psychology (AREA)
- Psychiatry (AREA)
- Human Computer Interaction (AREA)
- Pathology (AREA)
- Developmental Disabilities (AREA)
- Ophthalmology & Optometry (AREA)
- Computer Vision & Pattern Recognition (AREA)
- General Physics & Mathematics (AREA)
- Child & Adolescent Psychology (AREA)
- Management, Administration, Business Operations System, And Electronic Commerce (AREA)
Priority Applications (1)
| Application Number | Priority Date | Filing Date | Title |
|---|---|---|---|
| JP2022555558A JPWO2022075404A1 (https=) | 2020-10-07 | 2021-10-07 |
Applications Claiming Priority (2)
| Application Number | Priority Date | Filing Date | Title |
|---|---|---|---|
| JP2020-169585 | 2020-10-07 | ||
| JP2020169585 | 2020-10-07 |
Publications (1)
| Publication Number | Publication Date |
|---|---|
| WO2022075404A1 true WO2022075404A1 (ja) | 2022-04-14 |
Family
ID=81126525
Family Applications (1)
| Application Number | Title | Priority Date | Filing Date |
|---|---|---|---|
| PCT/JP2021/037130 Ceased WO2022075404A1 (ja) | 2020-10-07 | 2021-10-07 | デザイン評価装置、デザイン評価システム、デザイン評価方法、およびデザイン評価プログラム |
Country Status (2)
| Country | Link |
|---|---|
| JP (1) | JPWO2022075404A1 (https=) |
| WO (1) | WO2022075404A1 (https=) |
Cited By (1)
| Publication number | Priority date | Publication date | Assignee | Title |
|---|---|---|---|---|
| JP7388649B1 (ja) | 2023-05-12 | 2023-11-29 | 株式会社リプラス | 服装提案装置、服装提案方法、服装提案プログラム |
Citations (4)
| Publication number | Priority date | Publication date | Assignee | Title |
|---|---|---|---|---|
| JPH11232434A (ja) * | 1998-02-17 | 1999-08-27 | Fuji Xerox Co Ltd | 画像イメージ評価装置 |
| US20080309874A1 (en) * | 2007-06-14 | 2008-12-18 | Psychology Software Tools Inc. | System and Apparatus for object based attention tracking in a virtual environment |
| JP2015125541A (ja) * | 2013-12-26 | 2015-07-06 | スリーエム イノベイティブ プロパティズ カンパニー | 視線予測システム、視線予測方法、および視線予測プログラム |
| JP2018136604A (ja) * | 2017-02-20 | 2018-08-30 | 株式会社マクロミル | 評価システム |
-
2021
- 2021-10-07 WO PCT/JP2021/037130 patent/WO2022075404A1/ja not_active Ceased
- 2021-10-07 JP JP2022555558A patent/JPWO2022075404A1/ja active Pending
Patent Citations (4)
| Publication number | Priority date | Publication date | Assignee | Title |
|---|---|---|---|---|
| JPH11232434A (ja) * | 1998-02-17 | 1999-08-27 | Fuji Xerox Co Ltd | 画像イメージ評価装置 |
| US20080309874A1 (en) * | 2007-06-14 | 2008-12-18 | Psychology Software Tools Inc. | System and Apparatus for object based attention tracking in a virtual environment |
| JP2015125541A (ja) * | 2013-12-26 | 2015-07-06 | スリーエム イノベイティブ プロパティズ カンパニー | 視線予測システム、視線予測方法、および視線予測プログラム |
| JP2018136604A (ja) * | 2017-02-20 | 2018-08-30 | 株式会社マクロミル | 評価システム |
Cited By (2)
| Publication number | Priority date | Publication date | Assignee | Title |
|---|---|---|---|---|
| JP7388649B1 (ja) | 2023-05-12 | 2023-11-29 | 株式会社リプラス | 服装提案装置、服装提案方法、服装提案プログラム |
| JP2024163791A (ja) * | 2023-05-12 | 2024-11-22 | 株式会社リプラス | 服装提案装置、服装提案方法、服装提案プログラム |
Also Published As
| Publication number | Publication date |
|---|---|
| JPWO2022075404A1 (https=) | 2022-04-14 |
Similar Documents
| Publication | Publication Date | Title |
|---|---|---|
| Lim et al. | Compulsive buying of branded apparel, its antecedents, and the mediating role of brand attachment | |
| Loh et al. | Consumers’ attitudes, perceived risks and perceived benefits towards repurchase intention of food truck products | |
| Japutra et al. | Self-congruence, brand attachment and compulsive buying | |
| Oh et al. | The effect of brand authenticity on consumer–brand relationships | |
| Wook Chae et al. | Exploring the effect of the human brand on consumers' decision quality in online shopping: An eye‐tracking approach | |
| Moreno et al. | Spectator emotions: Effects on quality, satisfaction, value, and future intentions | |
| US20080059281A1 (en) | Systems and methods for product attribute analysis and product recommendation | |
| Baruk et al. | The effect of age, gender and level of education on the consumer’s expectations towards dairy product packaging | |
| JP7423994B2 (ja) | レコメンド装置及びレコメンド方法 | |
| Mikalef et al. | All eyes on me: Predicting consumer intentions on social commerce platforms using eye-tracking data and ensemble learning | |
| US20140095256A1 (en) | Market evaluation investigation device and investigation method | |
| Chynał et al. | Shopping behaviour analysis using eyetracking and EEG | |
| Hernández et al. | Can virtually trying on apparel help in selecting the correct size? | |
| Ziemba et al. | Integrated approach to e-commerce websites evaluation with the use of surveys and eye tracking based experiments | |
| Lokman | KE as affective design methodology | |
| Chakraborty et al. | An explanatory study on Indian young consumers’ luxury consumption: The underlying relationship of interpersonal influence, brand image, brand consciousness and demographic components with luxury brand purchase decision | |
| Roth et al. | The influence of customer satisfaction on customer price behavior: literature review and identification of research gaps | |
| Fitrajaya et al. | The impact of product quality, brand image and service quality toward customer loyalty | |
| Ahn | Individual characteristics linking cognitive, affective and conative mechanisms among vegetarian restaurant customers | |
| Seekis et al. | Retail therapy? The role of positive body image in women’s clothing experiences and preferences for in-store shopping environments | |
| WO2022075404A1 (ja) | デザイン評価装置、デザイン評価システム、デザイン評価方法、およびデザイン評価プログラム | |
| WO2022097457A1 (ja) | デザイン評価装置、デザイン評価システム、デザイン評価方法、デザイン評価プログラム、および学習装置 | |
| JP6068587B1 (ja) | ブランド価値解析装置、ブランド価値解析方法、及びプログラム | |
| KR101106454B1 (ko) | 인터넷을 통한 상품 패키지 요소에 의한 상품 인지도 및/또는 선택도 조사에 대한 상품 이미지 측정 시스템 및 그 설문조사방법과 그 방법에 대한 컴퓨터프로그램을 저장한 기록매체 | |
| JP2002109175A (ja) | ブランド力診断方法及びそのシステム |
Legal Events
| Date | Code | Title | Description |
|---|---|---|---|
| 121 | Ep: the epo has been informed by wipo that ep was designated in this application |
Ref document number: 21877703 Country of ref document: EP Kind code of ref document: A1 |
|
| ENP | Entry into the national phase |
Ref document number: 2022555558 Country of ref document: JP Kind code of ref document: A |
|
| NENP | Non-entry into the national phase |
Ref country code: DE |
|
| 122 | Ep: pct application non-entry in european phase |
Ref document number: 21877703 Country of ref document: EP Kind code of ref document: A1 |