WO2022070774A1 - 画像解析方法、画像解析装置、プログラム、及び記録媒体 - Google Patents
画像解析方法、画像解析装置、プログラム、及び記録媒体 Download PDFInfo
- Publication number
- WO2022070774A1 WO2022070774A1 PCT/JP2021/032477 JP2021032477W WO2022070774A1 WO 2022070774 A1 WO2022070774 A1 WO 2022070774A1 JP 2021032477 W JP2021032477 W JP 2021032477W WO 2022070774 A1 WO2022070774 A1 WO 2022070774A1
- Authority
- WO
- WIPO (PCT)
- Prior art keywords
- sensitivity
- image
- image data
- ratio
- photographing
- Prior art date
- Legal status (The legal status is an assumption and is not a legal conclusion. Google has not performed a legal analysis and makes no representation as to the accuracy of the status listed.)
- Ceased
Links
Images















Classifications
-
- G—PHYSICS
- G06—COMPUTING OR CALCULATING; COUNTING
- G06V—IMAGE OR VIDEO RECOGNITION OR UNDERSTANDING
- G06V10/00—Arrangements for image or video recognition or understanding
- G06V10/10—Image acquisition
- G06V10/12—Details of acquisition arrangements; Constructional details thereof
- G06V10/14—Optical characteristics of the device performing the acquisition or on the illumination arrangements
- G06V10/143—Sensing or illuminating at different wavelengths
-
- G—PHYSICS
- G01—MEASURING; TESTING
- G01L—MEASURING FORCE, STRESS, TORQUE, WORK, MECHANICAL POWER, MECHANICAL EFFICIENCY, OR FLUID PRESSURE
- G01L1/00—Measuring force or stress, in general
- G01L1/24—Measuring force or stress, in general by measuring variations of optical properties of material when it is stressed, e.g. by photoelastic stress analysis using infrared, visible light, ultraviolet
-
- G—PHYSICS
- G06—COMPUTING OR CALCULATING; COUNTING
- G06V—IMAGE OR VIDEO RECOGNITION OR UNDERSTANDING
- G06V10/00—Arrangements for image or video recognition or understanding
- G06V10/40—Extraction of image or video features
- G06V10/56—Extraction of image or video features relating to colour
-
- G—PHYSICS
- G06—COMPUTING OR CALCULATING; COUNTING
- G06V—IMAGE OR VIDEO RECOGNITION OR UNDERSTANDING
- G06V10/00—Arrangements for image or video recognition or understanding
- G06V10/40—Extraction of image or video features
- G06V10/58—Extraction of image or video features relating to hyperspectral data
Definitions
- the present invention relates to an image analysis method, an image analysis device, a program, and a recording medium, and in particular, the amount of external energy applied to the object based on the image data of the object to which external energy is applied to develop color. It relates to an image analysis method, an image analysis device, a program and a recording medium for estimation.
- a pressure measuring film (corresponding to an object) is read by a scanner to obtain a brightness value, and a conversion table showing the relationship between the concentration value and the pressure value is used to obtain the brightness value. Convert to pressure value.
- the calibration calibration sheet is read and the calibration coefficient is set. Then, the brightness value obtained by reading the pressure measurement film is calibrated by the calibration coefficient, and the brightness value after calibration is converted into the pressure value.
- the color of the shot image when shooting an object, the color of the shot image, specifically the brightness of each part of the image, may change depending on the shooting environment, for example, the spectral distribution and illuminance distribution of lighting. Further, when the object is photographed by using a general camera or an information processing terminal having an imaging function for the reason of easily photographing the object, the object is easily affected by the above-mentioned lighting. In this case, when multiple parts of the object that are colored with the same color are photographed, the color of each part in the photographed image may differ due to the influence of lighting. The signal value may change.
- Patent Document 2 it is pointed out that the amount of light of the light source when scanning a document with a scanner changes depending on the wavelength, and as a solution to the problem, each color component is used when the reflected light from the document is separated into a plurality of color components. It is described that the transmittance of the light source is changed by a predetermined rate. If the technique described in Patent Document 2 is applied to the reading method described in Patent Document 1, the non-uniformity of the spectral distribution of the light source can be offset. However, even in that case, the influence of the unevenness of the illuminance on the surface of the object can occur.
- the present invention has been made in view of the above circumstances, and an object of the present invention is to solve the following object.
- the present invention provides an image analysis method, an image analysis device, a program, and a recording medium capable of solving the above-mentioned problems of the prior art and more easily eliminating the influence of the illuminance distribution when photographing an object.
- the purpose is.
- the image analysis method of the present invention is obtained by photographing an object that develops color according to the amount of external energy by applying external energy with the first sensitivity.
- the first image data shows a first acquisition step of acquiring image data, a second acquisition step of acquiring a second image data obtained by photographing an object with a second sensitivity different from the first sensitivity, and a first image data.
- Assigned to the object based on the calculation process of calculating the ratio of the image signal value to the image signal value indicated by the second image data, the correspondence between the amount of external energy and the ratio, and the calculation result of the ratio in the calculation process. It is characterized by having an estimation process for estimating the amount of external energy generated. According to the image analysis method of the present invention, the influence of the illuminance distribution when photographing an object can be more easily eliminated as compared with the case where the conventional shading correction is performed.
- the image analysis method of the present invention may further include a correction step of performing correction for canceling the influence of the spectral distribution of the illumination when photographing the object with respect to the above ratio.
- the correction step the first reference data obtained by photographing the reference object with the first sensitivity is acquired, the second reference data obtained by photographing the reference object with the second sensitivity is acquired, and the second reference data is acquired.
- the correction value is calculated based on the image signal value indicated by 1 reference data and the image signal value indicated by the second reference data, and the calculation result of the ratio in the calculation process is corrected by the correction value.
- the amount of external energy applied to the object may be estimated based on the corrected ratio.
- the reference material is a member having a known spectral reflectance of the surface color. Further, it is more preferable that the reference material has a single surface color and a uniform member.
- each image data and each reference data can be efficiently acquired.
- At least one of the wavelength band defining the first sensitivity and the wavelength band defining the second sensitivity may have a half width of 10 nm or less.
- the full width at half maximum of each of the first sensitivity and the second sensitivity affects the correspondence between the above ratio and the amount of external energy, specifically, the height of the correlation. Based on this, by setting the half width to 10 nm or less, the amount of external energy can be estimated accurately from the above ratio.
- the first acquisition step an object is photographed in a state where a first filter having a spectral sensitivity set to the first sensitivity is attached to an imaging device having a color sensor.
- the first image data is acquired
- the second acquisition step the second image data is acquired by photographing the object with the second filter having the spectral sensitivity set to the second sensitivity attached to the photographing apparatus. It is good to do it.
- the first image data and the second image data can be appropriately acquired.
- the first image data is acquired by photographing the object in a state where the first filter is arranged between the color sensor and the lens in the photographing apparatus.
- the second acquisition step it is preferable to acquire the second image data by photographing the object in a state where the second filter is arranged between the color sensor and the lens in the photographing apparatus.
- each of the first sensitivity and the second sensitivity is set so that the amount of external energy monotonically increases or decreases with respect to the above ratio. In this case, the validity of the result (estimation result) of estimating the amount of external energy based on the above ratio is improved.
- the above ratio is calculated for each of the plurality of pixels constituting the captured image of the object, and in the estimation step, the amount of external energy applied to the object. Should be estimated for each pixel. This makes it possible to grasp the distribution of the amount of external energy applied to the object on the surface of the object.
- the image analysis device of the present invention is an image analysis device provided with a processor, and the processor is an object that develops color according to the amount of external energy when external energy is applied.
- the first image data obtained by photographing the object with the first sensitivity is acquired, and the second image data obtained by photographing the object with the second sensitivity different from the first sensitivity is acquired, and the second image data is acquired.
- the ratio of the image signal value shown by the 1 image data to the image signal value shown by the 2nd image data is calculated, and is given to the object based on the correspondence between the amount of external energy and the ratio and the calculation result of the ratio. It is characterized by estimating the amount of external energy.
- the influence of the illuminance distribution when photographing an object can be more easily eliminated as compared with the case where the conventional shading correction is performed.
- the program of the present invention is a program that causes a computer to execute each step in the image analysis method described above.
- the image analysis method of the present invention can be realized by a computer. That is, by executing the above program, it is possible to more easily eliminate the influence of the illuminance distribution when photographing the object, as compared with the case where the conventional shading correction is performed.
- the influence of the illuminance distribution when photographing an object can be more easily eliminated. Further, according to the present invention, it is possible to more easily eliminate the influence of the spectral distribution of the illumination when photographing the object. As a result, it is possible to efficiently carry out a process of estimating the amount of external energy applied to the object based on the captured image of the object.
- the present embodiment A specific embodiment of the present invention (hereinafter referred to as the present embodiment) will be described with reference to the attached drawings.
- the embodiments described below are merely examples for facilitating the understanding of the present invention, and do not limit the present invention. That is, the present invention may be modified or improved from the embodiments described below as long as it does not deviate from the gist thereof. Further, the present invention includes an equivalent thereof.
- the numerical range represented by using “-” means a range including the numerical values before and after “-” as the lower limit value and the upper limit value.
- color represents “hue”, “saturation” and “brightness”, and is a concept including shading (density) and hue.
- the object S is used to measure the amount of external energy applied in the measurement environment, and is arranged in the measurement environment to be provided with external energy in the environment. By doing so, the color develops according to the amount of external energy.
- the sheet body shown in FIG. 1 is used as the object S.
- the sheet body as the object S is preferably a material that is sufficiently thin for good placement in the measurement environment, and is preferably composed of, for example, paper, a film, a sheet, or the like.
- the object S shown in FIG. 1 has a rectangular shape in a plan view, but the outer shape of the object S is not particularly limited and may be any shape.
- a color-developing agent and a color-developing agent microencapsulated in a support are coated on the object S, and the object S is coated with the color-developing agent and the color-developing agent.
- the microcapsules are destroyed and the color former is adsorbed on the developer.
- the object S develops a color.
- the color (strictly speaking, the density, hereinafter referred to as the color density) of the colored object S changes by changing the number of microcapsules to be destroyed according to the amount of external energy applied.
- the “external energy” is the force, heat, magnetism, energy waves such as ultraviolet rays and infrared rays, etc. applied to the object S in the measurement environment in which the object S is placed, and strictly speaking, these are applied. This is the energy that causes the color of the object S (that is, the destruction of the above-mentioned microcapsules).
- the "amount of external energy” is the instantaneous magnitude of the external energy applied to the object S (specifically, the force acting on the object S, heat, magnetism, energy wave, etc.).
- the present invention is not limited to this, and when external energy is continuously applied to the object S, the cumulative amount applied in a predetermined time (that is, the amount of force, heat, magnetism, and energy wave acting on the object S). (Cumulative value) may be used as the amount of external energy.
- the amount of external energy applied under the measurement environment is measured based on the color of the colored object S, specifically the color density.
- the object S is photographed by a photographing device, and the amount of external energy is estimated from the image signal value indicating the color (specifically, the color development density) of the photographed image.
- each part of the object S develops a color at a density corresponding to the amount of the external energy, so that the color development density on the surface of the object S Distribution occurs.
- the colors of each part of the object S have the same hue, and the color development density changes according to the amount of external energy. Using this phenomenon, it is possible to specify a two-dimensional distribution of the amount of external energy applied to the object S from the distribution of the color development density on the surface of the object S.
- the object S in other words, the type of external energy measured (estimated) using the object S is not particularly limited.
- the object S may be a pressure-sensitive sheet that develops color when pressure is applied, a heat-sensitive sheet that develops color when heat is applied, a photosensitive sheet that develops color when light is applied, or the like.
- the object S is a pressure-sensitive sheet and the magnitude or cumulative amount of pressure applied to the object S is estimated.
- the image analysis apparatus (hereinafter, image analysis apparatus 10) of the present embodiment will be described with reference to FIGS. 2 to 4.
- the image analysis device 10 photographs an object S (specifically, a colored object S) in a state of being irradiated with light from the illumination L, analyzes the captured image, and then analyzes the captured image.
- the value of the pressure applied to the object S (pressure value) is estimated.
- the pressure value corresponds to the amount of external energy, and is the magnitude of the instantaneous pressure or the cumulative amount of the magnitude of the pressure when continuously applied in a predetermined time.
- the image analysis device 10 is a computer including a processor 11 as shown in FIG.
- the image analysis device 10 is configured by an information processing device having a built-in photographing device 12, specifically, a smartphone, a tablet terminal, a digital camera, a digital video camera, a scanner, or the like.
- the photographing apparatus 12 may be provided as a separate device. That is, although the computer including the processor 11 and the photographing device 12 are separated from each other, one image analysis device 10 may be configured in cooperation with each other in a communicable state.
- the processor 11 is a programmable logic device (Programmable Logic Device: PLD), which is a processor whose circuit configuration can be changed after manufacturing, such as a general-purpose processor CPU (Central Processing Unit) and FPGA (Field Programmable Gate Array), and an ASIC. It is composed of a dedicated electric circuit or the like, which is a processor having a circuit configuration specially designed for performing a specific process such as (Application Specific Integrated Circuit).
- PLD programmable logic device
- PLD programmable Logic Device
- CPU Central Processing Unit
- FPGA Field Programmable Gate Array
- the processor 11 executes a series of processes for image analysis by executing a program for image analysis.
- a program for image analysis a plurality of processing units shown in FIG. 4, specifically, an image data acquisition unit 21, a reference data acquisition unit 22, a removal processing unit 23, and a calculation unit. 24, a correction unit 25, a storage unit 26, and an estimation unit 27 are realized.
- the plurality of processing units shown in FIG. 4 may be configured by one of the above-mentioned plurality of types of processors, or a combination of two or more processors of the same type or different types, for example, a combination of a plurality of FPGAs. Alternatively, it may be configured by a combination of FPGA and CPU. Further, the plurality of processing units shown in FIG. 4 may be configured by one of the above-mentioned plurality of types of processors, or two or more processing units may be collectively configured by one processor.
- one processor is configured by a combination of one or more CPUs and software, and this processor functions as a plurality of processing units shown in FIG. Can be considered.
- SoC System on Chip
- the hardware configuration of the various processors described above may be an electric circuit (Circuitry) in which circuit elements such as semiconductor elements are combined.
- the program for image analysis executed by the processor 11 corresponds to the program of the present invention, and is a program for causing the processor 11 to execute each step (specifically, steps S001 to S006 shown in FIG. 23) in the image analysis flow described later.
- the program for image analysis is recorded on a recording medium.
- the recording medium may be a memory 13 and a storage 14 provided in the image analysis device 10, or may be a computer-readable medium such as a CD-ROM (Compact Disc Read only memory).
- a storage device provided in an external device for example, a server computer or the like
- an image analysis program may be recorded in the storage device of the external device.
- the photographing device 12 is a camera, or an RGB (Red Green Blue) camera that captures a color image in the present embodiment.
- the photographing apparatus 12 has a lens 111, a color sensor 112, and two filters (specifically, a first filter 113 and a second filter 114).
- the lens 111 is a photographing lens, and is housed in, for example, one or more in a housing (not shown) provided in the photographing apparatus 12.
- the color sensor 112 is an image sensor with three colors of RGB, and during shooting, it passes through a lens, receives light, and outputs a video signal.
- the output video signal is digitized by a signal processing circuit (not shown) provided in the photographing apparatus 12 and compressed in a predetermined format. As a result, captured image data (hereinafter referred to as image data) is generated.
- the image data indicates the image signal value of each RGB color for each pixel.
- the image signal value is a gradation value of each pixel in a captured image defined within a predetermined numerical range (for example, 0 to 255 in the case of 8-bit data).
- the image signal value indicated by the image data is not limited to the gradation value of each RGB color, and may be the gradation value of a monochrome image (specifically, a gray scale image).
- the first filter 113 and the second filter 114 are bandpass filters having different spectral sensitivities from each other, and are mounted on the photographing apparatus 12 in a switchable state.
- the first filter 113 and the second filter 114 are composed of an interference type filter and are arranged in the optical path to the color sensor 112 (image sensor).
- the color sensor 112 receives the light that has passed through the lens 111 and the above-mentioned interference type filter and outputs a video signal, in other words, the photographing apparatus 12 is selected from the first filter 113 and the second filter 114.
- the object S is photographed with the spectral sensitivity of the filter.
- the spectral sensitivity of the first filter 113 will be referred to as “first sensitivity”
- the spectral sensitivity of the second filter 114 will be referred to as “second sensitivity”. That is, the first filter 113 is a filter whose spectral sensitivity is set to the first sensitivity, and the second filter 114 is a filter whose spectral sensitivity is set to the second sensitivity.
- the first sensitivity and the second sensitivity each have a half-value width, and the half-value width of each spectral sensitivity is not particularly limited.
- the half width of at least one of the first sensitivity and the second sensitivity is 10 nm or less.
- the half width of both the first sensitivity and the second sensitivity is preferably 10 nm or less.
- the full width at half maximum means the full width at half maximum.
- the arrangement positions of the first filter 113 and the second filter 114 are not particularly limited, but for the purpose of limiting the angle of incidence of light on the filter, each of them is located between the color sensor 112 and the lens 111 in the photographing apparatus 12.
- a filter should be placed.
- each filter is arranged at a position where the light becomes parallel light in the optical path in the photographing device 12, for example, in a housing in which a plurality of lenses 111 are housed, specifically, between the lenses 111.
- each of the 1st filter 113 and the 2nd filter 114 is arranged.
- an adapter type lens unit is attached to the main body of the photographing device 12, and the first filter 113 and the second filter 114 are arranged in the lens unit. It is good.
- the image analysis device 10 further includes an input device 15 and a communication interface 16, and accepts a user's input operation by the input device 15 or communicates with another device via the communication interface 16. And get various information.
- the information acquired by the image analysis apparatus 10 includes information necessary for image analysis, specifically, information necessary for pressure measurement (pressure value estimation) using the object S.
- the image analysis device 10 further includes an output device 17 such as a display, and can output the result of the image analysis, for example, the estimation result of the pressure value, to the output device 17 and notify the user.
- an output device 17 such as a display
- the image analysis device 10 includes an image data acquisition unit 21, a reference data acquisition unit 22, a removal processing unit 23, a calculation unit 24, a correction unit 25, a storage unit 26, and an estimation unit. 27 (see FIG. 4).
- the image data acquisition unit 21 acquires image data obtained by photographing the object S by the photographing device 12.
- the photographing apparatus 12 switches between the first filter 113 and the second filter 114 to photograph the object S at each of the first sensitivity and the second sensitivity. That is, the image data acquisition unit 21 uses the image data of the object S as the image data when the image is taken with the first sensitivity (hereinafter referred to as the first image data) and the image data when the image data is taken with the second sensitivity. (Hereinafter referred to as the second image data) is acquired.
- the reference data acquisition unit 22 acquires image data (hereinafter referred to as reference data) obtained by photographing the reference object U by the photographing apparatus 12.
- the reference material U is a member having a known spectral reflectance of the surface color, and more specifically, a member having a single surface color and a uniform surface color.
- a white pattern (chart) or the like can be mentioned as a specific example of the reference material U, but it can be used as the reference material U as long as it satisfies the above conditions.
- the object S and the reference object U are integrated, and more specifically, as shown in FIG. 1, the corner portion of the sheet body in which the white pattern, which is the reference object U, forms the object S. It is formed (for example, a corner portion). Therefore, in the present embodiment, the object S and the reference object U can be photographed at one time, and the image data of the object S and the image data of the reference object U (that is, the reference data) can be acquired at the same time. ..
- the present invention is not limited to this, and the object S and the reference object U may be provided separately.
- the reference data shows an image signal value when the reference object U is photographed, specifically, an RGB image signal value.
- an RGB image signal value As described above, since the spectral reflectance of the surface color of the reference object U is known, the reference data is available. The image signal values shown are known.
- the photographing device 12 photographs the reference object U with each of the first sensitivity and the second sensitivity. That is, the reference data acquisition unit 22 has, as the reference data, the reference data when the image is taken with the first sensitivity (hereinafter referred to as the first reference data) and the reference data when the image is taken with the second sensitivity (hereinafter referred to as the first reference data). 2) And is acquired. Both the image signal value indicated by the first reference data and the image signal value indicated by the second reference data are known.
- the removal processing unit 23 performs removal processing for each of the image signal values indicated by the first image data and the second image data.
- the removal process is a process for eliminating the influence of interference (specifically, crosstalk) between each of the first filter 113 and the second filter 114 and the color sensor 112, and is a so-called color mixing removal correction.
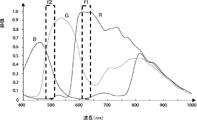
- FIGS. 5 and 6 show the spectral sensitivity of each RGB color of the color sensor 112 (indicated by a solid line with symbols R, G, and B in the figure) and the first sensitivity (symbol f1 in the figure). (Indicated by a broken line) and the second sensitivity (indicated by a broken line with the symbol f2 in the figure) are shown.
- the wavelength bands of the first sensitivity and the second sensitivity are different between FIGS. 5 and 6.
- the first sensitivity and the second sensitivity are used for the purpose of suppressing the influence of crosstalk when estimating the pressure value based on the image data of the object S.
- the spectral sensitivity corresponding to the first sensitivity is a spectral sensitivity having a larger overlapping range with the first sensitivity and a smaller overlapping range with the second sensitivity among the spectral sensitivities of the three RGB colors.
- the spectral sensitivity corresponding to the second sensitivity is a spectral sensitivity having a larger overlapping range with the second sensitivity and a smaller overlapping range with the first sensitivity.
- the spectral sensitivity of the R sensor corresponds to the first sensitivity
- the spectral sensitivity of the B sensor corresponds to the second sensitivity
- the spectral sensitivity of the G sensor corresponds to the first sensitivity
- the spectral sensitivity of the B sensor corresponds to the second sensitivity.
- the first image data mainly indicates an image signal value corresponding to a video signal output from a sensor having a spectral sensitivity corresponding to the first sensitivity among the color sensors 112. Further, the second image data mainly indicates an image signal value corresponding to a video signal output from a sensor having a spectral sensitivity corresponding to the second sensitivity among the color sensors 112.
- the first image data mainly shows the image signal value corresponding to the output signal of the R sensor
- the second image data mainly shows the image signal value corresponding to the output signal of the B sensor. ..
- the wavelength band of the first sensitivity may overlap with the spectral sensitivity corresponding to the second sensitivity.
- the range of overlap with the spectral sensitivity of the R sensor is the largest, but it also slightly overlaps with the spectral sensitivity of the B sensor.
- the wavelength band of the second sensitivity may overlap with the spectral sensitivity corresponding to the first sensitivity.
- the overlapping range of the second sensitivity with the spectral sensitivity of the B sensor is large. It is the largest, but it also slightly overlaps with the spectral sensitivity of the R sensor.
- the image signal value indicated by each of the first image data and the second image data that is, the image corresponding to the video signal output from the sensor having the spectral sensitivity corresponding to each of the first sensitivity and the second sensitivity.
- Crosstalk can occur in the signal values. Therefore, in the present embodiment, the above-mentioned removal processing is performed for each of the image signal values indicated by the first image data and the second image data.
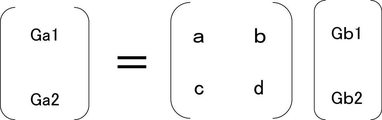
- the specific content of the removal process that is, the procedure for removing the influence of crosstalk is not particularly limited, but for example, the removal process may be performed using the relational expression shown in FIG. 7.
- Ga1 and Ga2 on the left side in the relational expression of FIG. 7 indicate image signal values indicated by each of the first image data and the second image data before the removal process, that is, the influence of crosstalk exists.
- Gb1 and Gb2 on the right side indicate image signal values after the removal process, that is, without the influence of crosstalk.
- each component a, b, c, d in the 2 ⁇ 2 type matrix on the right side is based on the image signal value when a colored pattern having a known spectral reflectance is photographed with the first sensitivity and the second sensitivity. It is decided.
- the image signal values Ga1 and Ga2 before the removal process are multiplied by the inverse matrix corresponding to the matrix on the right side of FIG. 7 to remove the images.
- the processed image signal values Gb1 and Gb2 can be obtained.
- the image signal values indicated by each of the first image data and the second image data are the image signal values after the removal process is performed, unless otherwise specified.
- the calculation unit 24 calculates the ratio of the image signal value indicated by the first image data to the image signal value indicated by the second image data (hereinafter, simply referred to as a ratio). In the present embodiment, the calculation unit 24 calculates the ratio for each of the plurality of pixels constituting the captured image of the object S, in other words, calculates the ratio of the object S per unit region.
- the unit area is an area corresponding to one unit when the surface of the object S is divided into a number corresponding to the number of pixels.
- the correction unit 25 corrects the calculation result of the ratio by the calculation unit 24 using the first reference data and the second reference data.
- the correction performed by the correction unit 25 is a correction for canceling the influence of the spectral distribution of the illumination L when photographing the object S on the ratio.
- the correction unit 25 calculates the correction value based on the image signal value indicated by the first reference data and the image signal value indicated by the second reference data, and the calculation unit 24 calculates the ratio. It is corrected by the above correction value. The specific content of the correction will be described in detail in the next section.
- the storage unit 26 stores information necessary for pressure measurement (estimation of pressure value) using the object S.
- the information stored in the storage unit 26 includes information on the correspondence between the pressure value and the ratio shown in FIGS. 16A and 16B, specifically, a mathematical formula (approximate formula) or a conversion table showing the correspondence.
- the correspondence between the pressure value and the ratio is specified in advance. For example, a plurality of samples made of the same sheet body as the object S are photographed at each of the first sensitivity and the second sensitivity to acquire image data. It can be specified by doing. Each of the plurality of samples is subjected to different values of pressure, and colors are developed at different color development densities. Moreover, the pressure value of the pressure applied to each sample is known.
- the estimation unit 27 determines the pressure value of the pressure applied to the object S based on the correspondence between the pressure value and the ratio and the calculation result of the ratio (strictly speaking, the ratio corrected by the correction unit 25). presume.
- the estimation unit 27 estimates the pressure value for each pixel, in other words, the pressure value for each unit region on the surface of the object S. To estimate. Thereby, it is possible to grasp the distribution (plane distribution) on the surface of the object S with respect to the pressure value of the pressure applied to the object S.
- the pressure value of the pressure applied to the object S is estimated for each pixel using the ratio of each pixel.
- the image signal value of each pixel when the object S is photographed with the first sensitivity is set to G1 (x, y), and the image signal value of each pixel when the object S is photographed with the second sensitivity.
- G1 x, y
- G2 x, y
- x and y indicate the coordinate positions of the pixels, and specifically, they are two-dimensional coordinates defined with a predetermined position in the captured image as the origin.
- the image signal values G1 (x, y) and G2 (x, y) are represented by the following equations (1) and (2), respectively.
- G1 (x, y) R (x, y, ⁇ 1) * C1 ( ⁇ 1) * SP ( ⁇ 1) * S (x, y) Equation (1)
- G2 (x, y) R (x, y, ⁇ 2) * C2 ( ⁇ 2) * SP ( ⁇ 2) * S (x, y) Equation (2)
- R (x, y, ⁇ ) is the spectral reflectance of the object S
- SP ( ⁇ ) is the spectral distribution of the illumination L
- S (x, y) is the illuminance distribution of the illumination L.
- C1 ( ⁇ 1) represents the first sensitivity
- C2 ( ⁇ 2) represents the second sensitivity.
- ⁇ 1 indicates the wavelength band of the first sensitivity
- ⁇ 2 indicates the wavelength band of the second sensitivity.
- ⁇ 1 and ⁇ 2 will be referred to as a single wavelength in the following.
- the image signal values include the term of the spectral distribution SP ( ⁇ ) of the illumination L and the term of the illuminance distribution S (x, y) of the illumination L. included. That is, the image signal value is affected by the spectral distribution and the illuminance distribution of the illumination L, respectively. Therefore, if the pressure value is estimated using the image signal value indicated by the image data as it is, an accurate estimation result may not be obtained due to the influence of the illuminance distribution. Therefore, in the present embodiment, the ratio G3 (x, y) of the image signal values is calculated by the following equation (3).
- the image signal value when the reference object U is photographed with the first sensitivity is Q1 (x, y)
- the image signal value Q2 (x, y) when the reference object U is photographed with the second sensitivity is calculated by the equation (4).
- T (x, y, ⁇ ) indicates the spectral reflectance of the reference material U, but the reference material U is a member having a known spectral reflectance, and the reference material U is also a reference material.
- the surface color of U is uniform, and each part of the surface is the same color (specifically, the hue, saturation, and lightness are uniform). Therefore, T (x, y) is a constant value (specified value) regardless of the pixel positions x and y.
- the above K can be obtained.
- the area of the reference object U as small as possible when photographing the reference object U, it is possible to suppress the influence of the illuminance distribution of the illumination L on the image signal values Q1 and Q2. Further, in the correction, it is not always necessary to use the spectral reflectance T (x, y) of each part of the reference object U, and in practice, it is practically sufficient to use the average reflectance.
- G4 (x, y) in the equation (7) is a corrected ratio, and as is clear from the equation (7), the influence of the illuminance distribution S (x, y) of the illumination L and the spectrum of the illumination L.
- the effect of the distribution SP ( ⁇ ) is canceled out.
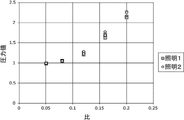
- the corrected ratio G4 (x, y) shows a correlation with respect to the pressure value as shown in FIGS. 16A to 20B, and both have a one-to-one mapping relationship. Based on this relationship, the pressure value can be estimated from the corrected ratio G4 (x, y), and strictly speaking, the ratio can be converted into the pressure value.
- the height of the correlation between the corrected ratio and the pressure value is reflected in the validity of the pressure value estimation result, and the higher the correlation, the more reasonable estimation result can be obtained.
- the height of the correlation depends on the respective wavelength bands of the first sensitivity and the second sensitivity. Therefore, in the present embodiment, more specifically, the pressure value increases or decreases monotonically with respect to the ratio so that a good correlation is established between the ratio (strictly speaking, the corrected ratio) and the pressure value.
- Each of the first sensitivity and the second sensitivity is set so as to do so.
- the method for setting each of the first sensitivity and the second sensitivity is not particularly limited, but for example, the first sensitivity and the second sensitivity are based on the relationship between the pressure value and the spectral reflectance shown in FIGS. 8 and 9.
- Each can be set to a suitable wavelength band.
- the wavelength band in which the spectral reflectance changes significantly with respect to the change in pressure value is the first. It is good to set it to 1 sensitivity. Further, in FIGS.
- a wavelength band in which the spectral reflectance changes with respect to a change in the pressure value and the amount of change becomes smaller than the wavelength band of the first sensitivity (for example, the symbol f2 is added in the figure).
- the range surrounded by the broken line frame) should be set as the second sensitivity.
- the half width of each of the first sensitivity and the second sensitivity affects the accuracy of the estimation result of the pressure value.
- lighting 1 and lighting 2 the verification performed using two lights (hereinafter, lighting 1 and lighting 2) will be described with respect to the influence of the half width on the estimation accuracy of the pressure value.
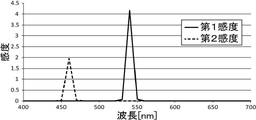
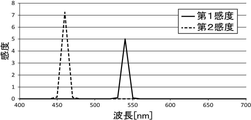
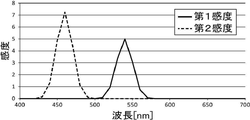
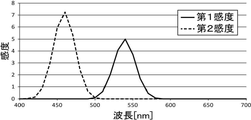
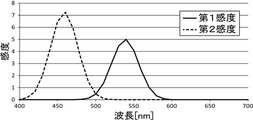
- the spectral distributions of Illumination 1 and Illumination 2 are different from each other as shown in FIG. Further, the center wavelengths of the first sensitivity and the second sensitivity are set by the above-mentioned method. Then, the half widths of each of the first sensitivity and the second sensitivity were changed in the range of 10 nm to 50 nm in increments of 10 nm, and cases 1 to 5 were set. In each case, under each of the above two illuminations, a plurality of the above-mentioned samples are taken with their respective spectral sensitivities, and the correspondence between the above-mentioned ratio (strictly speaking, the corrected ratio) and the pressure value is determined. Identified.
- the first sensitivity and the second sensitivity are set so that the image signal values when the reference object U is photographed under each of the above two illuminations are substantially equal between the first sensitivity and the second sensitivity.
- the magnitude of each of the sensitivities was adjusted.
- FIGS. 11A and 11B show the adjusted first sensitivity and second sensitivity in Case 1 in which the full width at half maximum is set to 10 nm. Note that FIG. 11A shows the spectral sensitivity when the image is taken under the illumination 1, and FIG. 11B shows the spectral sensitivity when the image is taken under the illumination 2.
- FIGS. 12A and 12B show the adjusted first sensitivity and the second sensitivity in the case 2 in which the half width is set to 20 nm.
- FIGS. 13A and 13B show the adjusted first sensitivity and second sensitivity in Case 3 in which the full width at half maximum is set to 30 nm.
- 14A and 14B show the adjusted first sensitivity and second sensitivity in Case 4 in which the full width at half maximum is set to 40 nm.
- FIGS. 15A and 15B show the adjusted first sensitivity and second sensitivity in Case 5 in which the full width at half maximum is set to 50 nm.
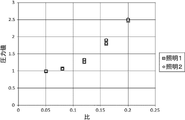
- FIGS. 16A and 16B The correspondence between the ratio specified in Case 1 and the pressure value is shown in FIGS. 16A and 16B.
- FIG. 16A shows a correspondence relationship derived from the data of FIG. 8 (that is, the relationship between the pressure value and the spectral reflectance)
- FIG. 16B shows the correspondence relationship derived from the data of FIG.
- Case 2 the correspondence relationship derived from the data of FIG. 8 is shown in FIG. 17A, and the correspondence relationship derived from the data of FIG. 9 is shown in FIG. 17B.
- case 2 as in case 1, the correlation between the ratio and the pressure value becomes high, and the pressure value clearly increases monotonically with the increase in the ratio. Therefore, based on the correspondence specified in Case 2, the influence of the spectral distribution of the illumination can be excluded and the pressure value can be estimated accurately.
- Case 3 the correspondence relationship derived from the data of FIG. 8 is shown in FIG. 18A, and the correspondence relationship derived from the data of FIG. 9 is shown in FIG. 18B.
- Case 3 unlike Cases 1 and 2, the influence of the spectral distribution of the illumination cannot be completely canceled by the correction.
- the half width of at least one of the first sensitivity and the second sensitivity is preferably 30 nm or less, and more preferably 10 nm or less. More preferably, the half width of each of the first sensitivity and the second sensitivity is 10 nm or less.
- the spectral distribution of illumination may vary in spikes, in which case a smaller full width at half maximum is preferred.
- the first and second sensitivities (specifically, adjusted under Illumination 1 or Illumination 2) having a half width of 10 nm and a central wavelength changed from the central wavelength in Cases 1 to 5 above. 1 sensitivity and 2nd sensitivity) are shown in FIGS. 21A and 21B. Further, the correspondence between the ratio specified under the first sensitivity and the second sensitivity shown in FIGS. 21A and 21B and the pressure value is shown in FIGS. 22A and 22B. 22A shows the correspondence derived from the data of FIG. 8, and FIG. 22B shows the correspondence derived from the data of FIG.
- the center wavelengths of the first sensitivity and the second sensitivity are not set appropriately, the correlation between the ratio and the pressure value, strictly speaking, the ratio.
- the amount of change in the pressure value with respect to the change in is low. Therefore, it is preferable that the center wavelengths of the first sensitivity and the second sensitivity are set so that the amount of change in the pressure value with respect to the change in the ratio becomes as large as possible.
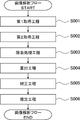
- FIG. 23 is carried out using the image analysis method of the present invention, in other words, each step in the image analysis flow corresponds to each step constituting the image analysis method of the present invention.
- the first acquisition step S001 is carried out.
- the photographing device 12 acquires the first image data obtained by photographing the object S with the first sensitivity. Specifically, in a state where the first filter 113 whose spectral sensitivity is set to the first sensitivity is attached to the photographing apparatus 12 having the color sensor 112, more specifically, the color sensor 112 and the lens 111 in the photographing apparatus 12 The object S is photographed with the first filter 113 arranged between the two. As a result, the first image data is acquired.
- the photographing device 12 acquires the second image data obtained by photographing the object S with the second sensitivity. Specifically, in a state where the photographing apparatus 12 is equipped with the second filter 114 whose spectral sensitivity is set to the second sensitivity, more specifically, in the photographing apparatus 12, the first is between the color sensor 112 and the lens 111. 2 The object S is photographed with the filter 114 arranged. As a result, the second image data is acquired.
- the object S when the object S is photographed with each of the first sensitivity and the second sensitivity, the object S is irradiated with the light from the illumination L.
- the wavelength of the light emitted from the illumination L is not particularly limited, but is set to, for example, 380 nm to 700 nm.
- the type of the lighting L is not particularly limited, and may be a desk light, a stand light or an indoor lighting made of a fluorescent lamp, an LED (Light Emitting Diode) or the like, or may be sunlight.
- the second acquisition step S002 is to be carried out after the first acquisition step S001 in FIG. 23, the first acquisition step S001 may be carried out after the second acquisition step S002 is carried out.
- the removal processing step S003 is carried out.
- the acquired image signal values of the first image data and the second image data specifically, the output signal from the sensor corresponding to each of the first sensitivity and the second sensitivity of the color sensor 112.
- the above-mentioned removal processing is performed for each of the image signal values according to the above.
- the image signal value from which the influence of the interference (that is, crosstalk) between each of the first filter 113 and the second filter 114 and the color sensor 112 is removed is acquired.
- the calculation step S004 was carried out, and in the calculation step S004, the ratio of the image signal value indicated by the first image data to the image signal value indicated by the second image data was calculated, and in detail, the removal process was carried out.
- the ratio is calculated using the later image signal values.
- the above ratio is calculated for each pixel for each of the plurality of pixels constituting the captured image of the object S.
- the correction step S005 is carried out, and in the correction step S005, correction is performed to cancel the influence of the spectral distribution of the illumination L on the ratio calculated for each pixel in the calculation step S004.
- the reference object U is photographed with each of the first sensitivity and the second sensitivity, and the first reference data and the second reference data are acquired.
- the object S and the reference object U are integrated, and more specifically, a white pattern which is the reference object U is formed at a corner portion of the sheet body forming the object S.
- the first image data and the first reference data can be acquired by simultaneously photographing the object S and the reference object U with the first sensitivity.
- the second image data and the second reference data can be acquired by simultaneously photographing the object S and the reference object U with the second sensitivity.
- a part of the correction step specifically, the step of acquiring the first reference data is carried out in the first acquisition step S001, and in the second acquisition step S002.
- a part of the correction step specifically, a step of acquiring the second reference data is carried out.
- the present invention is not limited to this, and the object S and the reference object U are acquired at different timings, and the timing of acquiring the first image data and the second image data is different from the timing of the first reference. Data and second reference data may be acquired.
- the image data of the object S and the image data (reference data) of the reference object U are known from the image data by an edge detection method or the like. It may be extracted by the extraction method of.
- the above-mentioned correction value K is further calculated based on the image signal value indicated by the first reference data and the image signal value indicated by the second reference data. Then, the calculation result of the ratio in the calculation step S004 (specifically, the ratio for each pixel) is corrected by the correction value K according to the above equation (7). As a result, a corrected ratio, that is, a ratio in which the influence of the spectral distribution of the illumination L is canceled out is obtained for each pixel.
- the estimation step S006 is carried out.
- the pressure applied to the object S is based on the correspondence between the pressure value and the ratio and the calculation result of the ratio in the calculation step S004 (strictly speaking, the ratio corrected in the correction step S005). Estimate the pressure value of. Further, in the present embodiment, since the ratio (corrected ratio) is obtained for each pixel, in the estimation step S006, the pressure value is estimated for each pixel based on the ratio for each pixel. This makes it possible to estimate the distribution (plane distribution) of the pressure value on the surface of the object S.
- the image analysis flow of the present embodiment is completed.
- the distribution of the pressure value of the pressure applied to the object S specifically, the pressure value on the surface of the object S, from the color (strictly speaking, the color density) of the developed object S.
- the influence of the illuminance distribution of the illumination L and the influence of the spectral distribution of the illumination L can be more easily eliminated (cancelled).
- the present invention is not limited to this, and for example, an imaging device 12 having a plurality of color sensors 112, such as a so-called multi-eye camera, is used to simultaneously capture an object S with both the first sensitivity and the second sensitivity. You may.
- the correction for canceling the influence of the spectral distribution of the illumination L, but it is not always necessary to carry out the correction.
- the illumination L having a spectral distribution having a uniform intensity at each wavelength is used, the effect of the spectral distribution does not occur, and in that case, the correction may be omitted.
- the entire object S may be photographed in one shooting.
- the image data of the image showing the entire object S is acquired (created). You may.
- the first filter 113 and the second filter 114 are configured by an interference type filter, and the spectral transmittance of the object S is increased according to the incident angle of light. It is effective when it can change.
- the center position of the photographed part is brought close to the center of the shooting angle of view, and the optical path to the color sensor 112 is perpendicular to the surface of the photographed part. It is preferable that the operation is performed in a closed state.
- Image analysis device 11
- Processor 12
- Imaging device 13
- Memory 14
- Storage 15
- Input device 16
- Communication interface 17
- Output device 21
- Image data acquisition unit 22
- Reference data acquisition unit 23
- Removal processing unit 24
- Calculation unit 25
- Correction unit 26
- Estimating unit 111
- Lens 112 Color sensor 113
- First filter 114
- Second filter L Lighting S Object U Reference
Landscapes
- Engineering & Computer Science (AREA)
- Physics & Mathematics (AREA)
- General Physics & Mathematics (AREA)
- Multimedia (AREA)
- Theoretical Computer Science (AREA)
- Spectroscopy & Molecular Physics (AREA)
- Spectrometry And Color Measurement (AREA)
Priority Applications (4)
| Application Number | Priority Date | Filing Date | Title |
|---|---|---|---|
| CN202180067348.0A CN116249876A (zh) | 2020-10-02 | 2021-09-03 | 图像分析方法、图像分析装置、程序及记录媒体 |
| EP21875076.8A EP4224129A4 (en) | 2020-10-02 | 2021-09-03 | Image analysis method, image analysis device, program, and recording medium |
| JP2022553718A JPWO2022070774A1 (https=) | 2020-10-02 | 2021-09-03 | |
| US18/192,155 US20230230345A1 (en) | 2020-10-02 | 2023-03-29 | Image analysis method, image analysis device, program, and recording medium |
Applications Claiming Priority (2)
| Application Number | Priority Date | Filing Date | Title |
|---|---|---|---|
| JP2020-167441 | 2020-10-02 | ||
| JP2020167441 | 2020-10-02 |
Related Child Applications (1)
| Application Number | Title | Priority Date | Filing Date |
|---|---|---|---|
| US18/192,155 Continuation US20230230345A1 (en) | 2020-10-02 | 2023-03-29 | Image analysis method, image analysis device, program, and recording medium |
Publications (1)
| Publication Number | Publication Date |
|---|---|
| WO2022070774A1 true WO2022070774A1 (ja) | 2022-04-07 |
Family
ID=80950214
Family Applications (1)
| Application Number | Title | Priority Date | Filing Date |
|---|---|---|---|
| PCT/JP2021/032477 Ceased WO2022070774A1 (ja) | 2020-10-02 | 2021-09-03 | 画像解析方法、画像解析装置、プログラム、及び記録媒体 |
Country Status (6)
| Country | Link |
|---|---|
| US (1) | US20230230345A1 (https=) |
| EP (1) | EP4224129A4 (https=) |
| JP (1) | JPWO2022070774A1 (https=) |
| CN (1) | CN116249876A (https=) |
| TW (1) | TWI889901B (https=) |
| WO (1) | WO2022070774A1 (https=) |
Cited By (4)
| Publication number | Priority date | Publication date | Assignee | Title |
|---|---|---|---|---|
| WO2023234148A1 (ja) * | 2022-06-03 | 2023-12-07 | 富士フイルム株式会社 | キャリブレーション部材、エネルギー測定装置、エネルギー測定方法、及びエネルギー測定プログラム |
| CN118212307A (zh) * | 2024-05-22 | 2024-06-18 | 四川深山农业科技开发有限公司 | 一种基于图像处理的魔芋糊化检测方法 |
| WO2025052711A1 (ja) * | 2023-09-06 | 2025-03-13 | 富士フイルム株式会社 | 画像処理装置、画像処理方法、及び画像処理プログラム |
| WO2025052713A1 (ja) * | 2023-09-08 | 2025-03-13 | 富士フイルム株式会社 | 画像処理装置、画像処理方法、及び画像処理プログラム |
Citations (7)
| Publication number | Priority date | Publication date | Assignee | Title |
|---|---|---|---|---|
| JPH01180436A (ja) * | 1988-01-12 | 1989-07-18 | Fuji Photo Film Co Ltd | 圧力記録シート用スキャナー |
| JPH05110767A (ja) | 1991-10-21 | 1993-04-30 | Toshiba Corp | カラー原稿読取装置 |
| JP2007279013A (ja) * | 2006-03-13 | 2007-10-25 | Railway Technical Res Inst | 圧力分布測定システム及び校正用測定子 |
| JP2008232665A (ja) | 2007-03-16 | 2008-10-02 | Fujifilm Corp | 圧力解析システム |
| JP2015215291A (ja) * | 2014-05-13 | 2015-12-03 | イーシン インコーポレイテッド | エネルギー測定システム、シートマーカ及び濃度測定システム |
| US20160299018A1 (en) * | 2015-04-08 | 2016-10-13 | Boe Technology Group Co., Ltd. | Pressure sensitive film and manufacturing method thereof |
| JP2020073907A (ja) | 2016-09-29 | 2020-05-14 | 富士フイルム株式会社 | 圧力測定用材料、及び圧力測定用材料セット |
Family Cites Families (8)
| Publication number | Priority date | Publication date | Assignee | Title |
|---|---|---|---|---|
| US6786634B2 (en) * | 2001-10-10 | 2004-09-07 | Noritake Co., Limited | Temperature measuring method and apparatus |
| US6607300B1 (en) * | 2002-09-20 | 2003-08-19 | Marcos Y. Kleinerman | Methods and devices for sensing temperature and oxygen pressure with a single optical probe |
| GB0302489D0 (en) * | 2003-02-04 | 2003-03-05 | Bae Systems Plc | Improvements relating to pressure sensitive paint |
| JP4894489B2 (ja) * | 2006-12-07 | 2012-03-14 | 富士ゼロックス株式会社 | 画像処理装置及び画像読取装置 |
| US8400505B2 (en) * | 2008-05-19 | 2013-03-19 | Panasonic Corporation | Calibration method, calibration device, and calibration system including the device |
| CN101487740B (zh) * | 2009-02-12 | 2011-06-29 | 清华大学 | 一种三ccd温度场测量装置及方法 |
| US10681235B2 (en) * | 2016-03-28 | 2020-06-09 | Konica Minolta, Inc. | Image recording device with a reader and processor for calibrating the reader |
| US11338390B2 (en) * | 2019-02-12 | 2022-05-24 | Lawrence Livermore National Security, Llc | Two-color high speed thermal imaging system for laser-based additive manufacturing process monitoring |
-
2021
- 2021-09-03 JP JP2022553718A patent/JPWO2022070774A1/ja not_active Abandoned
- 2021-09-03 EP EP21875076.8A patent/EP4224129A4/en not_active Withdrawn
- 2021-09-03 CN CN202180067348.0A patent/CN116249876A/zh active Pending
- 2021-09-03 WO PCT/JP2021/032477 patent/WO2022070774A1/ja not_active Ceased
- 2021-09-14 TW TW110134281A patent/TWI889901B/zh active
-
2023
- 2023-03-29 US US18/192,155 patent/US20230230345A1/en not_active Abandoned
Patent Citations (7)
| Publication number | Priority date | Publication date | Assignee | Title |
|---|---|---|---|---|
| JPH01180436A (ja) * | 1988-01-12 | 1989-07-18 | Fuji Photo Film Co Ltd | 圧力記録シート用スキャナー |
| JPH05110767A (ja) | 1991-10-21 | 1993-04-30 | Toshiba Corp | カラー原稿読取装置 |
| JP2007279013A (ja) * | 2006-03-13 | 2007-10-25 | Railway Technical Res Inst | 圧力分布測定システム及び校正用測定子 |
| JP2008232665A (ja) | 2007-03-16 | 2008-10-02 | Fujifilm Corp | 圧力解析システム |
| JP2015215291A (ja) * | 2014-05-13 | 2015-12-03 | イーシン インコーポレイテッド | エネルギー測定システム、シートマーカ及び濃度測定システム |
| US20160299018A1 (en) * | 2015-04-08 | 2016-10-13 | Boe Technology Group Co., Ltd. | Pressure sensitive film and manufacturing method thereof |
| JP2020073907A (ja) | 2016-09-29 | 2020-05-14 | 富士フイルム株式会社 | 圧力測定用材料、及び圧力測定用材料セット |
Cited By (4)
| Publication number | Priority date | Publication date | Assignee | Title |
|---|---|---|---|---|
| WO2023234148A1 (ja) * | 2022-06-03 | 2023-12-07 | 富士フイルム株式会社 | キャリブレーション部材、エネルギー測定装置、エネルギー測定方法、及びエネルギー測定プログラム |
| WO2025052711A1 (ja) * | 2023-09-06 | 2025-03-13 | 富士フイルム株式会社 | 画像処理装置、画像処理方法、及び画像処理プログラム |
| WO2025052713A1 (ja) * | 2023-09-08 | 2025-03-13 | 富士フイルム株式会社 | 画像処理装置、画像処理方法、及び画像処理プログラム |
| CN118212307A (zh) * | 2024-05-22 | 2024-06-18 | 四川深山农业科技开发有限公司 | 一种基于图像处理的魔芋糊化检测方法 |
Also Published As
| Publication number | Publication date |
|---|---|
| CN116249876A (zh) | 2023-06-09 |
| EP4224129A4 (en) | 2024-03-20 |
| US20230230345A1 (en) | 2023-07-20 |
| TW202220427A (zh) | 2022-05-16 |
| TWI889901B (zh) | 2025-07-11 |
| JPWO2022070774A1 (https=) | 2022-04-07 |
| EP4224129A1 (en) | 2023-08-09 |
Similar Documents
| Publication | Publication Date | Title |
|---|---|---|
| WO2022070774A1 (ja) | 画像解析方法、画像解析装置、プログラム、及び記録媒体 | |
| US10168215B2 (en) | Color measurement apparatus and color information processing apparatus | |
| JP6540885B2 (ja) | 色校正装置、色校正システム、色校正用ホログラム、色校正方法及びプログラム | |
| JP2025013472A (ja) | コンピュータ、プログラム、及び方法 | |
| US8346022B2 (en) | System and method for generating an intrinsic image using tone mapping and log chromaticity | |
| JP7687559B2 (ja) | 撮像システム | |
| JP2002303548A (ja) | 平坦な測定対象物の光電測定用装置 | |
| JP2010127739A (ja) | 分光感度特性測定装置および分光感度特性測定方法 | |
| KR20150136977A (ko) | 초분광 이미징 시스템 | |
| TWI843820B (zh) | 使用多種波長之光單色成像的顏色檢查方法 | |
| JP2021185372A (ja) | 形状測定装置及び方法 | |
| JP2014187558A (ja) | 画像色分布検査装置および画像色分布検査方法 | |
| CN115918060A (zh) | 重建图像、特别是精确彩色图像的方法以及相关联的计算机程序、设备和系统 | |
| JP7685514B2 (ja) | 画像解析方法、画像解析装置、プログラム、及び記録媒体 | |
| JP5120936B2 (ja) | 画像処理装置および画像処理方法 | |
| JP7491084B2 (ja) | 校正装置、校正方法、校正プログラム、分光カメラ、及び情報処理装置 | |
| TW202205212A (zh) | 圖像校正裝置、圖像校正方法、程式及記錄媒體 | |
| JP2009182845A (ja) | 画像処理装置および画像処理方法 | |
| JP6668673B2 (ja) | 色変換マトリクス推定方法 | |
| TWI902915B (zh) | 圖像處理裝置、圖像處理方法及記錄媒體 | |
| US12207003B2 (en) | System and method for IR subtraction in an RGB-IR image sensor using FPGA | |
| US12425705B2 (en) | Imaging method and program | |
| JP2003287405A (ja) | 3次元計測方法および装置 | |
| CN119788821A (zh) | 优化投影显示的方法和系统 | |
| WO2016030919A1 (ja) | 画像色分布検査装置および画像色分布検査方法 |
Legal Events
| Date | Code | Title | Description |
|---|---|---|---|
| 121 | Ep: the epo has been informed by wipo that ep was designated in this application |
Ref document number: 21875076 Country of ref document: EP Kind code of ref document: A1 |
|
| ENP | Entry into the national phase |
Ref document number: 2022553718 Country of ref document: JP Kind code of ref document: A |
|
| WWE | Wipo information: entry into national phase |
Ref document number: 202347022587 Country of ref document: IN |
|
| NENP | Non-entry into the national phase |
Ref country code: DE |
|
| ENP | Entry into the national phase |
Ref document number: 2021875076 Country of ref document: EP Effective date: 20230502 |