WO2022065103A1 - 振動解析システム、および振動解析方法 - Google Patents
振動解析システム、および振動解析方法 Download PDFInfo
- Publication number
- WO2022065103A1 WO2022065103A1 PCT/JP2021/033498 JP2021033498W WO2022065103A1 WO 2022065103 A1 WO2022065103 A1 WO 2022065103A1 JP 2021033498 W JP2021033498 W JP 2021033498W WO 2022065103 A1 WO2022065103 A1 WO 2022065103A1
- Authority
- WO
- WIPO (PCT)
- Prior art keywords
- signal
- mahalanobis distance
- calculated
- abnormality
- unit
- Prior art date
- Legal status (The legal status is an assumption and is not a legal conclusion. Google has not performed a legal analysis and makes no representation as to the accuracy of the status listed.)
- Ceased
Links
Images


Classifications
-
- G—PHYSICS
- G01—MEASURING; TESTING
- G01H—MEASUREMENT OF MECHANICAL VIBRATIONS OR ULTRASONIC, SONIC OR INFRASONIC WAVES
- G01H1/00—Measuring characteristics of vibrations in solids by using direct conduction to the detector
- G01H1/12—Measuring characteristics of vibrations in solids by using direct conduction to the detector of longitudinal or not specified vibrations
- G01H1/14—Frequency
-
- F—MECHANICAL ENGINEERING; LIGHTING; HEATING; WEAPONS; BLASTING
- F04—POSITIVE - DISPLACEMENT MACHINES FOR LIQUIDS; PUMPS FOR LIQUIDS OR ELASTIC FLUIDS
- F04B—POSITIVE-DISPLACEMENT MACHINES FOR LIQUIDS; PUMPS
- F04B51/00—Testing machines, pumps, or pumping installations
-
- G—PHYSICS
- G01—MEASURING; TESTING
- G01H—MEASUREMENT OF MECHANICAL VIBRATIONS OR ULTRASONIC, SONIC OR INFRASONIC WAVES
- G01H17/00—Measuring mechanical vibrations or ultrasonic, sonic or infrasonic waves, not provided for in the other groups of this subclass
-
- G—PHYSICS
- G01—MEASURING; TESTING
- G01M—TESTING STATIC OR DYNAMIC BALANCE OF MACHINES OR STRUCTURES; TESTING OF STRUCTURES OR APPARATUS, NOT OTHERWISE PROVIDED FOR
- G01M1/00—Testing static or dynamic balance of machines or structures
- G01M1/12—Static balancing; Determining position of centre of gravity
- G01M1/122—Determining position of centre of gravity
-
- G—PHYSICS
- G01—MEASURING; TESTING
- G01M—TESTING STATIC OR DYNAMIC BALANCE OF MACHINES OR STRUCTURES; TESTING OF STRUCTURES OR APPARATUS, NOT OTHERWISE PROVIDED FOR
- G01M7/00—Vibration-testing of structures; Shock-testing of structures
-
- G—PHYSICS
- G01—MEASURING; TESTING
- G01M—TESTING STATIC OR DYNAMIC BALANCE OF MACHINES OR STRUCTURES; TESTING OF STRUCTURES OR APPARATUS, NOT OTHERWISE PROVIDED FOR
- G01M7/00—Vibration-testing of structures; Shock-testing of structures
- G01M7/02—Vibration-testing by means of a shake table
- G01M7/025—Measuring arrangements
-
- G—PHYSICS
- G01—MEASURING; TESTING
- G01M—TESTING STATIC OR DYNAMIC BALANCE OF MACHINES OR STRUCTURES; TESTING OF STRUCTURES OR APPARATUS, NOT OTHERWISE PROVIDED FOR
- G01M99/00—Subject matter not provided for in other groups of this subclass
-
- G—PHYSICS
- G06—COMPUTING OR CALCULATING; COUNTING
- G06Q—INFORMATION AND COMMUNICATION TECHNOLOGY [ICT] SPECIALLY ADAPTED FOR ADMINISTRATIVE, COMMERCIAL, FINANCIAL, MANAGERIAL OR SUPERVISORY PURPOSES; SYSTEMS OR METHODS SPECIALLY ADAPTED FOR ADMINISTRATIVE, COMMERCIAL, FINANCIAL, MANAGERIAL OR SUPERVISORY PURPOSES, NOT OTHERWISE PROVIDED FOR
- G06Q50/00—Information and communication technology [ICT] specially adapted for implementation of business processes of specific business sectors, e.g. utilities or tourism
- G06Q50/10—Services
-
- G—PHYSICS
- G08—SIGNALLING
- G08B—SIGNALLING SYSTEMS, e.g. PERSONAL CALLING SYSTEMS; ORDER TELEGRAPHS; ALARM SYSTEMS
- G08B21/00—Alarms responsive to a single specified undesired or abnormal condition and not otherwise provided for
- G08B21/18—Status alarms
- G08B21/182—Level alarms, e.g. alarms responsive to variables exceeding a threshold
Definitions
- This disclosure relates to a vibration analysis system and a vibration analysis method.
- Patent Document 1 an abnormality determination based on a predetermined neighbor method for determining whether or not an abnormality is made by calculating an index value indicating the degree of abnormality based on the distance between data.
- the processing is applied to each data of the new analysis result data group to the existing representative data group representing the existing analysis result data group.
- Patent Document 1 considers appropriately selecting representative data to be used for abnormality detection from a large number of data that are the results of status monitoring of the target device. However, no disclosure or suggestion has been made regarding the configuration for predicting the time of abnormality for predictive maintenance of equipment.
- An object in a certain aspect of the present disclosure is to provide a vibration analysis system and a vibration analysis method capable of predicting an abnormality occurrence time of an object by analyzing the vibration state of the object.
- a vibration analysis system has a signal input unit that receives an input of a vibration signal detected by a sensor attached to a moving object, and a plurality of vibration analysis systems by analyzing the vibration signal corresponding to the object.
- a strength calculation unit that calculates a plurality of signal strengths corresponding to each frequency band, and a first maharanobis distance that calculates a first maharanobis distance of a first signal space composed of a plurality of signal strengths with respect to a preset first unit space.
- a center of gravity calculation unit that calculates two-dimensional center of gravity data indicating the positions of the center of gravity of a plurality of signal strengths calculated by the strength calculation unit, and two-dimensional center of gravity data for a preset second unit space.
- An abnormality that predicts the time when an abnormality occurs in an object based on the second distance calculation unit that calculates the second maharanobis distance of the configured second signal space, and the first maharanobis distance and the second maharanobis distance. It has a prediction unit.
- the first unit space is composed of a plurality of signal intensities corresponding to a plurality of frequency bands, which are calculated by analyzing a vibration signal corresponding to an object in a normal state.
- the second unit space is composed of two-dimensional center of gravity data indicating the positions of the centers of gravity of the plurality of signal strengths constituting the first unit space.
- the time of occurrence of the abnormality when the first Mahalanobis distance of the first threshold value or more is calculated is predicted to be in the near future than the time of occurrence of the abnormality when the first Mahalanobis distance of the first threshold value or more is not calculated. Will be done.
- the abnormality prediction unit predicts that an abnormality will occur in the object several days after the first Mahalanobis distance equal to or higher than the first threshold value is calculated.
- the first Mahalanobis distance of the first threshold value or more is calculated and the second Mahalanobis distance of the second threshold value or more is calculated. Moreover, it is predicted that the future will be closer than the time when the abnormality occurs when the second Mahalanobis distance equal to or higher than the second threshold value has not been calculated.
- the abnormality prediction unit predicts that an abnormality will occur in the object several hours after the second Mahalanobis distance equal to or higher than the second threshold value is calculated.
- the first warning information is output, and when the second Mahalanobis distance equal to or higher than the second threshold value is calculated, the warning level is higher than that of the first warning information. Further, an output control unit for outputting a large second warning information is provided.
- the output control unit displays the time-series data of the first Mahalanobis distance and the time-series data of the second Mahalanobis distance on the display.
- a vibration analysis method is a step of accepting an input of a vibration signal detected by a sensor attached to a moving object, and a plurality of frequencies by analyzing the vibration signal corresponding to the object. Calculated as a step to calculate a plurality of signal strengths corresponding to each band and a step to calculate a first Mahalanobis distance of a first signal space composed of a plurality of signal strengths with respect to a preset first unit space.
- the step of calculating the two-dimensional center of gravity data indicating the position of the center of gravity of a plurality of signal strengths, and the second Mahalanobis distance of the second signal space composed of the two-dimensional center of gravity data with respect to the preset second unit space. It includes a step of calculating and a step of predicting an abnormality occurrence time when an abnormality occurs in an object based on a first Mahalanobis distance and a second Mahalanobis distance.
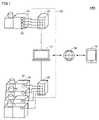
- FIG. 1 is a diagram for explaining an outline of the system 1000.
- the system 1000 detects an abnormality in an object by analyzing a vibration signal generated during the operation of a maintenance object such as a pump (hereinafter, also simply referred to as “object”). It is a system for predicting.
- object is described as being a pump, but the system 1000 can be applied to any object that generates vibration (or sound) during operation without being limited to this.
- the system 1000 can be applied to anomaly prediction of a portion vibrating in response to vibration from a motor or a vibrating body.
- the system 1000 includes a vibration analysis system 100, a plurality of sensors 30, a terminal device 40, a network 50, and a plurality of pumps 70.
- the vibration analysis system 100 executes vibration analysis of the pump 70.
- the vibration analysis system 100 includes an analysis device 10 and a sensor unit 20.
- the sensor unit 20 is electrically connected to a plurality of sensors 30. In the system 1000, two sensor units 20 are connected to the analysis device 10, but three or more sensor units 20 or one sensor unit 20 may be connected to the analysis device 10. Each sensor unit 20 may be electrically connected to one sensor 30.
- Each sensor unit 20 may be electrically connected to a plurality of sensors 30 attached to each of the plurality of pumps 70.
- the sensor 30 is attached to the pump 70 and acquires a detection signal (vibration signal) detected due to the vibration or sound of the pump.
- the analysis device 10 executes vibration analysis of the pump 70 based on the vibration signal input from the sensor 30 via the sensor unit 20.
- the analysis device 10 is configured to be communicable with the terminal device 40 via the network 50.
- the analysis device 10 transmits the vibration analysis result and the like to the terminal device 40.
- the analysis device 10 typically has a structure that follows a general-purpose computer architecture, and the processor executes a pre-installed program to realize various processes described later.
- the analysis device 10 is, for example, a laptop PC (Personal Computer).
- the analysis device 10 may be any device as long as it can execute the functions and processes described below, and may be another device (for example, a desktop PC or a tablet terminal device).
- Network 50 includes various networks such as the Internet.
- the network 50 may adopt a wired communication method, or may adopt another wireless communication method such as a wireless LAN (local area network).
- a wireless LAN local area network
- the terminal device 40 is, for example, a portable tablet terminal device.
- the terminal device 40 is not limited to this, and may be realized by a smartphone, a desktop PC (Personal Computer), or the like.
- the vibration analysis system 100 according to the present embodiment is composed of a separate type device in which the analysis device 10 and the sensor unit 20 are separated, but is composed of an integrated device of the analysis device 10 and the sensor unit 20. It may have been done.
- FIG. 2 is a block diagram showing an example of the overall configuration of the vibration analysis system 100.
- the vibration analysis system 100 includes an analysis device 10 and a sensor unit 20.
- the sensor 30 connected to the sensor unit 20 is a sensor capable of detecting vibration and sound signals, and is composed of, for example, an acceleration sensor using an organic piezoelectric element.
- the sensor 30 may be any sensor that can detect vibration or sound signals, may be composed of an acceleration sensor of another method (for example, a servo type), or may be composed of various other sensors. May be.
- a charge converter is provided between the sensor 30 and the vibration analysis system 100.
- the charge converter converts the charge signal from the sensor 30 into a voltage signal and outputs it to the vibration analysis system 100. If the sensor 30 has a function of converting a charge signal into a voltage signal, the charge converter is unnecessary.
- the sensor unit 20 converts the vibration signal acquired from the sensor 30 (or the charge converter) into a signal that can be processed by the analysis device 10.
- the sensor unit 20 includes a filter 21, an amplifier 22, and an A / D converter 23.
- the filter 21 is an analog filter and removes noise components from the vibration signal output from the sensor 30.
- the filter 21 is composed of a low-pass filter, a high-pass filter, and the like.
- the amplifier 22 amplifies the analog signal output from the filter 21 by a predetermined time, and outputs the amplified signal to the A / D converter 23.
- the A / D converter 23 converts the signal input from the amplifier 22 from an analog signal to a digital signal at a predetermined sampling frequency.
- the A / D converter 23 outputs the digitally converted signal to the analysis device 10.
- FIG. 3 is a block diagram showing an example of the hardware configuration of the analysis device 10.
- the analyzer 10 includes a processor 101, a memory 103, a display 105, an input device 107, a signal input interface (I / F) 109, and a communication interface (I / F) 111. include. Each of these parts is connected to each other so as to be capable of data communication.
- the processor 101 is typically an arithmetic processing unit such as a CPU (Central Processing Unit), an MPU (Multi Processing Unit), or the like.
- the processor 101 controls the operation of each part of the analysis device 10 by reading and executing the program stored in the memory 103. More specifically, the processor 101 realizes each function of the analysis device 10 by executing the program.
- the memory 103 is realized by a RAM (Random Access Memory), a ROM (Read-Only Memory), a flash memory, a hard disk, or the like.
- the memory 103 stores a program or the like executed by the processor 101.
- the display 105 is, for example, a liquid crystal display, an organic EL (Electro Luminescence) display, or the like.
- the display 105 may be configured integrally with the analysis device 10 or may be configured separately from the analysis device 10.
- the input device 107 receives an operation input to the analysis device 10.
- the input device 107 is realized by, for example, a keyboard, a button, a mouse, or the like. Further, the input device 107 may be realized as a touch panel.
- the signal input interface 109 mediates data transmission between the processor 101 and the sensor unit 20.
- the signal input interface (I / F) 109 receives the input of the vibration signal from the sensor 30 via the sensor unit 20. Specifically, the signal input interface 109 receives an input of a digital signal from the A / D converter 23.
- the communication interface 111 mediates data transmission between the processor 101 and the terminal device 40 and the like.
- a wireless communication method using Bluetooth (registered trademark), a wireless LAN (Local Area Network), or the like is used.
- a wired communication method such as USB (Universal Serial Bus) may be used.
- the abnormality prediction method includes a preparation step of preparing reference data and an analysis step of analyzing an abnormality state of the pump 70.
- the vibration state of the pump 70 at the initial stage of operation start is measured. Since the pump 70 at the initial stage of operation is in a new state, the vibration state of the pump 70 at the normal time is measured as a reference. However, instead of the pump 70, a pump of the same type as the pump 70 in a normal state may be separately prepared, and the vibration state of the pump may be measured as a reference.
- FIG. 4 is a flowchart showing an example of the preparation process. Typically, each of the following steps is realized by the processor 101 of the analyzer 10 executing a program stored in the memory 103.
- the processor 101 acquires a vibration signal output from the sensor 30 via the sensor unit 20 (step S10). Specifically, the processor 101 acquires a vibration signal (vibration signal indicating the vibration state of the pump 70) corresponding to the pump 70 in the normal state from the sensor 30.
- a vibration signal vibration signal indicating the vibration state of the pump 70
- the processor 101 performs octave analysis of the vibration signal accumulated for a predetermined time (for example, several tens to several hundreds of seconds) (step S12).
- a predetermined time for example, several tens to several hundreds of seconds
- 1/3 octave analysis is used. Therefore, each vibration signal is separated into 48 bands from, for example, 0.4 Hz to 20 kHz by a 1/3 bandpass filter, and the signal strength (vibration strength) is averaged for each band (that is, frequency band).
- the signal strength averaged in the frequency band is also simply referred to as “frequency band signal strength”.
- the processor 101 For each frequency band, stores the signal strength of the frequency band corresponding to the pump 70 in the normal state in the memory 103 as reference data R (step S14).
- FIG. 5 is a diagram showing an example of a data set of signal strength in each frequency band.
- the data set 310 includes a signal strength L for each frequency band f1 to fn (where n is a natural number, n ⁇ m) for each time T1 to Tm (where m is a natural number).
- n 48.
- the data set 310 includes the signal strengths L1-1_1 to L1_n of each frequency band f1 to fn in the time T1, and the signal strengths Lm_1 to Lm_n of the frequency bands f1 to fn in the time Tm.
- the reference data R includes, for example, the signal strength L of each frequency band f1 to fn of each time T1 to Tn. In this case, the period from time T1 to Tn corresponds to the operation start initial period.
- the processor 101 sets the unit space U1 in the Mahalanobis Taguchi method (MT method) using the reference data R (step S16). Specifically, the processor 101 sets the data of the signal strength L of each frequency band f1 to fn in each time T1 to Tn as the unit space U1.
- the unit space U1 is used in the first abnormality prediction step described later.
- the processor 101 calculates two-dimensional center of gravity data indicating the position of the center of gravity of the signal strength in each frequency band (step S18). Specifically, the processor 101 generates the data set shown in FIG. 6 from the data set 310.
- FIG. 6 is a diagram showing an example of a data set of the position of the center of gravity.
- the data set 320 includes the center of gravity position Gx of the frequency band and the center of gravity position Gy of the signal strength for the time T1 to Tm.
- Two-dimensional center of gravity data (center of gravity position Gx, Gy) is generated for each time T1 to Tm.
- the center of gravity position Gx is represented by the following formula (1)
- the center of gravity position Gy is represented by the following formula (2).
- f i represents the i -th frequency band
- Li represents the signal strength of the i-th frequency band
- S represents the total signal strength of all frequency bands.
- the center-of-gravity positions Gx and Gy at the time T1 are represented by the center-of-gravity positions Gf_1 and GL_1, respectively, and the center-of-gravity positions Gx and Gy at the time Tm are represented by the center-of-gravity positions Gf_m and GL_m, respectively.
- the processor 101 sets the unit space U2 in the MT method using the center of gravity data in the operation start initial period (for example, time T1 to Tn) (step S20). Specifically, the processor 101 sets the two-dimensional center of gravity data (center of gravity position Gx, Gy) of each time T1 to Tn as the unit space U2.
- the unit space U2 is used in the second abnormality prediction step described later.
- the analysis step includes a first and second abnormality prediction step of predicting an abnormality occurrence time of the vibration state of the pump 70, and a trend analysis step of analyzing a future tendency of the vibration state of the pump 70.
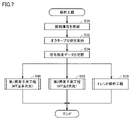
- FIG. 7 is a flowchart showing an example of the analysis process.
- the processor 101 acquires a vibration signal output from the sensor 30 via the sensor unit 20 (step S30). Specifically, the processor 101 acquires a vibration signal corresponding to the pump 70 during a normal period (for example, a period after the end of the operation start initial period) from the sensor 30.
- a normal period for example, a period after the end of the operation start initial period
- the processor 101 performs octave analysis of the vibration signal accumulated for a predetermined time (step S32). For each frequency band, the processor 101 stores the signal strength of the frequency band corresponding to the pump 70 in the memory 103 (step S34). Specifically, the signal strength of each frequency band in the pump 70 at a certain time Ts is stored in the format of the data set 310.
- a series of signal strengths Ls_1 to Ls_n in the frequency bands f1 to fn in the pump 70 at time Ts are also referred to as signal strength data Ps. Since the period from time T1 to Tn corresponds to the initial operation start period, the normal period corresponds to the period from time Tn + 1 to time Tm. Therefore, the time Ts is any one of time Tn + 1 to time Tm.
- the processor 101 executes a first abnormality prediction step (step S40), a second abnormality prediction step (step S60), and a trend analysis step (step S70) using the signal strength data Ps and the data obtained in the reference step. do. Each of these steps may be executed in parallel or sequentially.
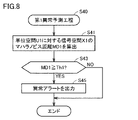
- FIG. 8 is a flowchart showing an example of the first abnormality prediction process.
- a data set 310 composed of multidimensional data is used.
- the processor 101 refers to the Mahalanobis distance MD1 (hereinafter, also simply referred to as “distance MD1”) of the signal space X1s composed of a plurality of signal strengths with respect to the unit space U1 set in step S16 of FIG. ) Is calculated (step S41).
- the signal space X1s is composed of a plurality of signal strengths Ls_1 to Ls_n (that is, signal strength data Ps) at time Ts.
- the processor 101 determines whether or not the distance MD1 is equal to or greater than the threshold value Th1 (for example, 5) (step S43). When the distance MD1 is less than the threshold value Th1 (NO in step S43), the processor 101 ends the first abnormality prediction step. When the distance MD1 is equal to or greater than the threshold value Th1 (YES in step S43), the processor 101 predicts that an abnormality will occur in the pump 70 in the near future, outputs an abnormality alert (step S45), and outputs an abnormality alert (step S45). To finish. Typically, the anomaly alert is displayed on the display 105. The abnormality alert may be configured to be output by voice via a speaker.
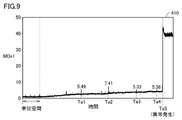
- FIG. 9 is a diagram showing time-series data of Mahalanobis distance based on multidimensional data.
- Graph 410 shows the time series data of the Mahalanobis distance MDx1 in the reference pump of the same type as the pump 70. Therefore, it can be said that the Mahalanobis distance MDx1 in the graph 410 shows the same tendency as the Mahalanobis distance MD1 in the pump 70.
- Th1 the threshold value
- an abnormality occurs in the reference pump.
- the period from time Ta1 to time Ta5 is 4.5 days
- the period from time Ta2 to time Ta5 is 3 days
- the period from time Ta3 to time Ta5 is 1.5 days
- the period up to time Ta5 was 8.5 hours. From this, it is understood that the abnormality occurs several days after the Mahalanobis distance MDx1 exceeds the threshold value Th1 for the first time
- the processor 101 predicts that an abnormality will occur in the pump 70 in the near future.
- the processor 101 may predict that an abnormality will occur in the pump 70 several days after the Mahalanobis distance MD1 having a threshold value Th1 or more is calculated for the first time.
- the processor 101 may output an abnormality alert having a relatively high warning level to notify that an abnormality may occur in the pump 70 after a few days.
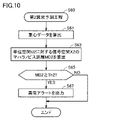
- FIG. 10 is a flowchart showing an example of the second abnormality prediction process.
- the processor 101 calculates two-dimensional center of gravity data indicating the position of the center of gravity of the signal strength in each frequency band (step S61). Specifically, the processor 101 calculates the two-dimensional center of gravity data (that is, the center of gravity position Gx, Gy) from the signal strength data Ps calculated in step S32 using the equations (1) and (2).
- the processor 101 calculates the Mahalanobis distance MD2 (hereinafter, also simply referred to as “distance MD2”) of the signal space X2s composed of the two-dimensional center of gravity data with respect to the unit space U2 set in step S20 of FIG. 4 (step). S63).
- the signal space X2 is composed of the center of gravity positions Gx and Gy (that is, Gf_s and GL_s) at time Ts.
- the processor 101 determines whether or not the distance MD2 is equal to or greater than the threshold value Th2 (for example, 5) (step S65). When the distance MD2 is less than the threshold value Th2 (NO in step S63), the processor 101 ends the second abnormality prediction step. When the distance MD2 is equal to or greater than the threshold value Th2 (YES in step S63), the processor 101 predicts that an abnormality will occur in the pump 70 in the extremely near future, outputs an abnormality alert (step S65), and predicts the second abnormality. End the process.
- the threshold value Th2 for example, 5
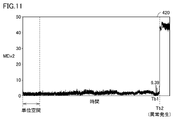
- FIG. 11 is a diagram showing time-series data of Mahalanobis distance based on two-dimensional data.
- Graph 420 shows the time series data of the Mahalanobis distance MDx2 in the reference pump of the same type as the pump 70. Therefore, it can be said that the Mahalanobis distance MDx2 in the graph 420 shows the same tendency as the Mahalanobis distance MD2 in the pump 70.
- the processor 101 predicts that an abnormality will occur in the pump 70 in the extremely near future.
- the processor 101 may predict that an abnormality will occur in the pump 70 several hours after the Mahalanobis distance MD2 having a threshold value Th2 or more is calculated for the first time.
- the processor 101 may output an abnormality alert having a high warning level to notify that the abnormality may occur after several hours.
- FIG. 12 is a flowchart showing an example of the trend analysis process.
- the processor 101 calculates the difference H obtained by subtracting the representative data of the reference data R from the signal strength data Ps (step S71).
- the reference data R is composed of a data group including a signal strength L of each frequency band f1 to fn of each time T1 to Tn.
- the processor 101 extracts the signal intensities Ln_1 to Ln_n of each frequency band f1 to fn of a certain time Tn as representative data from this data group. Then, the processor 101 calculates the difference H obtained by subtracting the representative data from the signal strength data Ps. As a result, the difference H of each frequency band is calculated.
- the representative data may be composed of the average value of the signal strength L of each frequency band f1 to fn of the time T1 to Tn.
- the signal strength L1 of the frequency band f1 included in the representative data is composed of the average value of the signal strengths L1_1 to Ln_1
- the signal strength Ln of the frequency band fn included in the representative data is the signal strength L1_n to Ln_n. Consists of the average value of.
- the processor 101 determines the abnormal level of the vibration state of the pump 70 in each frequency band by comparing the difference H with the plurality of reference values Z1, Z2, Z3 for each frequency band (step S73). For example, when the difference H is 0 or more and less than the reference value Z1 (for example, 3 dB), the abnormality level is “0” and the vibration state is “normal”. When the difference H is equal to or more than the reference value Z1 and less than the reference value Z2 (for example, 6 dB), the abnormality level is "1", and it is recommended to check the state of the pump 70.
- the abnormality level is “2” and maintenance of the pump 70 is recommended.
- the abnormality level is "3", which is a dangerous state in which the pump 70 needs to be replaced.
- the processor 101 outputs an abnormality alert based on the determination result of the abnormality level of the vibration state in the pump 70 (step S75). Specifically, when the abnormality level is "3" (that is, when H ⁇ Z3), the processor 101 outputs an abnormality alert with a high warning level (for example, “danger"), and the abnormality level is set to "3". When “2" (that is, when Z2 ⁇ H ⁇ Z3), an abnormality alert with a relatively high warning level (for example, “maintenance recommended”) is output, and when the abnormality level is "1" (that is, when it is "1”). That is, when Z1 ⁇ H ⁇ Z2), an abnormality alert with a low warning level (for example, “caution”) is output.
- the processor 101 may output that the vibration state of the pump 70 is "normal” when the abnormality level is "0" (that is, when H ⁇ Z1). Subsequently, the processor 101 stores the determination result of the abnormality level (step S77).
- the processor 101 identifies the vibration states of the upper predetermined number (for example, five) having a high abnormality level at the reference time point (for example, the present time) among the vibration states of the pump 70 in each frequency band, and sets the specified vibration state.
- the corresponding frequency band is extracted (step S79).
- the reference time point is configured to be arbitrarily selectable by the user.
- the processor 101 executes a trend prediction process for the vibration state of the extracted frequency band (hereinafter, also referred to as “extracted frequency band”) (step S81). Specifically, the processor 101 predicts the tendency of the future difference H based on the time series data of the existing (past) difference H in the extraction frequency band. For example, the processor 101 approximates the time series data of the difference H past the reference time point by an approximation curve (for example, linear approximation, exponential approximation, etc.) and predicts the difference H future from the reference time point. Further, the processor 101 may acquire a regression line by performing regression analysis on the time series data of the past difference H, and may predict the future difference H based on the slope and intercept of the regression line.
- an approximation curve for example, linear approximation, exponential approximation, etc.
- the processor 101 displays the result of the trend prediction process on the display 105 as a trend graph (step S83).
- the processor 101 stores the data related to the trend graph in the memory 103 (step S85), and ends the trend analysis step.
- the processor 101 stores various data such as an extraction frequency band and a trend graph in the memory 103.
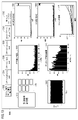
- FIG. 13 is a diagram showing a layout example of the user interface screen 500.
- the user interface screen 500 may have a layout other than that shown in FIG. 13 as long as it has a layout that can realize the functions described later.
- the user interface screen 500 includes display areas 502 to 512, measurement condition and set value display areas 514, various buttons 516, display areas 520 to 540, and graphs 550 to 570.
- the identification number (unit number) of the sensor unit 20, the identification number (sensor number) of the sensor 30, the measurement target name (for example, a pump), and the like are displayed.
- the status based on the distance MD1 calculated by the MT method using multidimensional data is displayed. This status changes according to the calculated value of the distance MD1. For example, when the distance MD1 of the threshold Th1 (for example, 5) or more is calculated, the status "danger" is displayed, and when the distance MD1 less than the threshold Th1 and equal to or more than the threshold Th1a (for example, 4) is calculated.
- the status "maintenance recommended” is displayed, and when the distance MD1 less than the threshold Th1a and the threshold Th1b (for example, 3) or more is calculated, the status "caution” is displayed and the distance MD1 less than the threshold Th1b is calculated. If so, the status "normal” is displayed. In this way, the larger the distance MD1, the higher the warning level of the status.
- Th1a and the threshold Th1b for example, 3
- the status based on the distance MD2 calculated by the MT method using two-dimensional data is displayed.
- This status changes according to the value of the distance MD2. For example, when the distance MD2 of the threshold Th2 (for example, 5) or more is calculated, the status "danger” is displayed, and when the distance MD2 of less than the threshold Th2 and the threshold Th2a (for example, 4) or more is calculated.
- the status "maintenance recommended” is displayed, and when the distance MD2 less than the threshold Th2a and the threshold Th2b (for example, 3) or more is calculated, the status "caution” is displayed and the distance MD2 less than the threshold Th2b is calculated. If so, the status "normal” is displayed. In this way, the larger the distance MD2, the higher the warning level of the status.
- the status based on the trend analysis is displayed in the display area 508.
- This status changes according to the difference H at the reference time point. For example, when the difference H at the reference time is the reference value Z3 (for example, 10 dB) or more, the status "danger” is displayed, and when the difference H is less than the reference value Z3 and the reference value Z2 (for example, 6 dB) or more, the status "danger” is displayed.
- the status "Maintenance recommended” is displayed, the status "Caution” is displayed when the difference H is less than the reference value Z2 and the reference value Z1 (for example, 3 dB) or more, and the status is displayed when the difference H is less than the reference value Z1.
- “Normal” is displayed. In this way, the larger the difference H, the higher the warning level of the status.
- the display area 520 shows the time-series sensor data (raw data) detected by the sensor 30.
- the analysis result frequency spectrum obtained by FFT (fast Fourier transform) analysis of the time-series sensor data is displayed.
- the display area 540 the signal strength data obtained by analyzing the sensor data in the time series by 1/3 octave is displayed as a bar graph.
- Graph 550 shows the time series data of the distance MD1.
- Graph 560 shows the time series data of the distance MD2.
- FIG. 570 is a trend graph obtained by the process of step S83 of FIG.
- the pump 70 As described above, it is predicted that an abnormality will occur in the pump 70 several days after the distance MD1 having a threshold Th1 or more is first calculated, and the pump will be made several hours after the distance MD2 having a threshold Th2 or more is first calculated. It is predicted that an abnormality will occur in 70. Therefore, the user can estimate the time when the abnormality of the pump 70 occurs by checking the graphs 550 and 560.
- the user proceeds with the preparation for maintenance while confirming the state change
- the distance MD2 having the threshold value Th2 or more is confirmed in the graph 560
- the user immediately proceeds. Conservation can be undertaken.
- the timing of equipment maintenance such as inspection, maintenance, and repair of the pump 70 can be accurately predicted, so that equipment maintenance can be carried out systematically.
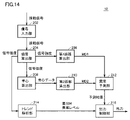
- FIG. 14 is a functional block diagram of the analysis device 10.
- the analysis device 10 has, as main functional configurations, a signal input unit 202, an intensity calculation unit 204, a first distance calculation unit 206, a center of gravity calculation unit 208, and a second distance calculation unit 210. , An abnormality prediction unit 212, a trend analysis unit 214, and an output control unit 216.
- Each of these functions is realized, for example, by the processor 101 of the analysis device 10 executing a program stored in the memory 103. It should be noted that some or all of these functions may be configured to be realized by hardware.
- the signal input unit 202 receives the input of the vibration signal detected by the sensor 30 attached to the operating pump 70. Specifically, the signal input unit 202 receives the vibration signal (digital signal) detected by the sensor 30 via the sensor unit 20.
- the intensity calculation unit 204 calculates a plurality of signal intensities corresponding to a plurality of frequency bands by analyzing the vibration signal received by the signal input unit 202. Specifically, the intensity calculation unit 204 performs octave analysis (for example, 1/3 octave analysis) of the vibration signal corresponding to the pump 70 to obtain the signal intensity of each frequency band (for example, f1 to fm of each frequency band). The signal strength L) is calculated.
- the intensity calculation unit 204 may be configured to calculate the signal intensity of each frequency band by a fast Fourier transform (FFT).
- FFT fast Fourier transform
- the first distance calculation unit 206 uses the MT method to obtain a Mahalanobis distance (for example, signal space X1) of a signal space (for example, signal space X1) composed of a plurality of signal intensities with respect to a preset unit space (for example, unit space U1). For example, the distance MD1) is calculated.
- the unit space U1 is composed of a plurality of signal intensities L corresponding to the plurality of frequency bands f1 to fn, which are calculated by analyzing the vibration signal corresponding to the pump 70 in the normal state.
- the vibration signal corresponding to the pump 70 in the normal state may be, for example, a vibration signal indicating the vibration state of the pump 70 in each time T1 to Tn (that is, the initial operation start period), or may be the same type as the pump 70. It may be a vibration signal indicating the vibration state of the pump in the normal state.
- the center of gravity calculation unit 208 calculates two-dimensional center of gravity data (for example, center of gravity positions Gx, Gy) indicating the positions of the centers of gravity of a plurality of signal strengths calculated by the intensity calculation unit 204.
- the second distance calculation unit 210 uses the MT method to obtain a Mahalanobis distance in a signal space (for example, signal space X2) composed of two-dimensional center of gravity data with respect to a preset unit space (for example, unit space U2).
- a preset unit space for example, unit space U2.
- distance MD2 is calculated.
- the unit space U2 is composed of two-dimensional center of gravity data indicating the positions of the centers of gravity of a plurality of signal strengths L constituting the unit space U1.
- the abnormality prediction unit 212 predicts the time when an abnormality occurs in the pump 70 based on the distance MD1 and the distance MD2. In a certain aspect, the abnormality occurrence time when the distance MD1 having the threshold value Th1 or more is calculated is predicted to be in the near future than the abnormality occurrence time when the distance MD1 having the threshold value Th1 or more is not calculated. Specifically, the abnormality prediction unit 212 predicts that an abnormality will occur in the pump 70 several days after the distance MD1 having the threshold value Th1 or more is calculated. If the distance MD1 having a threshold value Th1 or more is not calculated at the present time, the abnormality prediction unit 212 may predict that it is unlikely that an abnormality will occur in the pump 70 within a few days from the present time.
- the abnormal occurrence time is such that the distance MD1 having the threshold Th1 or more is calculated and the distance MD2 having the threshold Th2 or more is calculated. Is predicted to be in the near future than the time of occurrence of the anomaly when is not calculated. Specifically, the abnormality prediction unit 212 predicts that an abnormality will occur in the pump 70 several hours after the distance MD2 having a threshold value Th2 or more is calculated.
- the abnormality prediction unit 212 causes an abnormality in the pump 70 within several hours from the present time. You may predict that it is unlikely to do so.
- the trend analysis unit 214 calculates the difference H between the signal strength of the frequency band corresponding to the pump 70 and the signal strength of the frequency band corresponding to the reference pump for each of the plurality of frequency bands.
- the trend analysis unit 214 determines the abnormal level of the vibration state of the pump 70 in each frequency band based on the signal strength of each frequency band corresponding to the pump 70 and a predetermined reference value. Specifically, the trend analysis unit 214 compares the difference H in the frequency band with the plurality of reference values Z1 to Z3 for each of the plurality of frequency bands, so that the vibration state of the pump 70 in the frequency band is changed. Determine the anomaly level.
- the trend analysis unit 214 identifies the vibration states of the upper predetermined number (for example, 5) from the vibration state of the pump 70 in each frequency band from the one having the highest abnormality level, and sets the specified vibration state. Extract the corresponding frequency band.
- the trend analysis unit 214 predicts the future difference H of each frequency band based on the time series data of the difference H of each frequency band stored in the memory 103. Specifically, the trend analysis unit 214 predicts the future difference H by performing regression analysis of the time-series data of the difference H past the reference time. Alternatively, the trend analysis unit 214 predicts the future difference H by approximating the time series data of the past difference H with an approximate curve.
- the output control unit 216 outputs various information such as the prediction result of the abnormality prediction unit 212.
- the output control unit 216 when the distance MD1 having a threshold value Th1 or more is calculated, the output control unit 216 outputs the first warning information (for example, information warning the occurrence of an abnormality of the pump 70 in the near future), and the threshold value Th2 or more.
- the second warning information for example, information that warns of the occurrence of an abnormality in the pump 70 in the extremely near future
- the second warning information strongly urging the user to be alert
- the second warning information is a warning level indicating a high degree of urgency. That is, the second warning information has a higher degree of urgency than the first warning information.
- the output control unit 216 emphasizes the display mode of the second warning information rather than the display mode of the first warning information (that is, the second warning information is more conspicuous than the first warning information). It may be displayed on 105.
- the output control unit 216 causes the display 105 to display various information shown on the user interface screen 500. Specifically, the output control unit 216 displays the time-series data of the distance MD1 (for example, the graph 550 in FIG. 13) and the time-series data of the distance MD2 (for example, the graph 560 in FIG. 13) on the display 105. Display. In yet another aspect, the output control unit 216 causes the display 105 to display a future difference H (for example, the trend graph shown in the graph 570) of each predicted frequency band. Further, the output control unit 216 outputs an abnormality alert (for example, displayed on the display 105) based on the determination result of the abnormality level determined by the trend analysis unit 214.
- the output control unit 216 causes the display 105 to display various information shown on the user interface screen 500. Specifically, the output control unit 216 displays the time-series data of the distance MD1 (for example, the graph 550 in FIG. 13) and the time-series data of the distance MD2 (for example, the graph
- ⁇ Advantage> by confirming the distance MD1 and the distance MD2 by the MT method, whether the abnormal occurrence time of the pump 70 is in the near future (for example, several days later) or in the extremely near future (for example, several hours later). ) Can be predicted. Furthermore, the abnormality of the pump 70 can be predicted in advance from various angles by also referring to the tendency by the trend graph. Therefore, equipment maintenance can be carried out systematically.
- the analysis device 10 has described a configuration in which an abnormality is predicted to occur several days after the Mahalanobis distance MD1 having a threshold value Th1 or more is calculated for the first time.
- the Mahalanobis distance MDx1 becomes threshold value Th1 or more at time Ta2, Ta3, and Ta4, and the reference pump has an abnormality at time Ta5. It has occurred. Therefore, it can be said that the more the number of times the Mahalanobis distance MDx1 becomes the threshold value Th1 or more, the closer the time of occurrence of the abnormality is. Therefore, the analysis device 10 (abnormality prediction unit 212) may predict that the abnormality of the pump 70 will occur in the near future as the number of times the distance MD1 having the threshold value Th1 or more is calculated increases.
- the program may be one that calls the necessary modules in a predetermined array at a predetermined timing among the program modules provided as a part of the operating system (OS) of the computer to execute the process.
- OS operating system
- the program itself does not include the above module and the process is executed in cooperation with the OS.
- a program that does not include such a module may also be included in the program according to the present embodiment.
- the program according to the present embodiment may be provided by being incorporated into a part of another program. Even in that case, the program itself does not include the modules included in the above other programs, and the processing is executed in cooperation with the other programs.
- a program incorporated in such another program may also be included in the program according to the present embodiment.
- the configuration exemplified as the above-described embodiment is an example of the configuration of the present invention, can be combined with another known technique, and a part thereof is not deviated from the gist of the present invention. It is also possible to change and configure it, such as by omitting it. Further, in the above-described embodiment, the process or configuration described in the other embodiments may be appropriately adopted and carried out.
- 10 analysis device 20 sensor unit, 21 filter, 22 amplifier, 23 converter, 30 sensor, 40 terminal device, 50 network, 70 pump, 100 vibration analysis system, 101 processor, 103 memory, 105 display, 107 input device, 109 signal Input interface, 111 communication interface, 202 signal input unit, 204 strength calculation unit, 206 first distance calculation unit, 208 center of gravity calculation unit, 210 second distance calculation unit, 212 abnormality prediction unit, 214 trend analysis unit, 216 output control unit , 310, 320 dataset, 500 user interface screen, 1000 system.
Landscapes
- Physics & Mathematics (AREA)
- General Physics & Mathematics (AREA)
- Engineering & Computer Science (AREA)
- Business, Economics & Management (AREA)
- Aviation & Aerospace Engineering (AREA)
- Emergency Management (AREA)
- Mechanical Engineering (AREA)
- General Engineering & Computer Science (AREA)
- Tourism & Hospitality (AREA)
- Economics (AREA)
- Health & Medical Sciences (AREA)
- General Health & Medical Sciences (AREA)
- Human Resources & Organizations (AREA)
- Marketing (AREA)
- Primary Health Care (AREA)
- Strategic Management (AREA)
- General Business, Economics & Management (AREA)
- Theoretical Computer Science (AREA)
- Measurement Of Mechanical Vibrations Or Ultrasonic Waves (AREA)
- Testing Of Devices, Machine Parts, Or Other Structures Thereof (AREA)
- Testing And Monitoring For Control Systems (AREA)
Priority Applications (4)
| Application Number | Priority Date | Filing Date | Title |
|---|---|---|---|
| US18/026,210 US12590863B2 (en) | 2020-09-25 | 2021-09-13 | Vibration analysis system and vibration analysis method |
| CN202180065165.5A CN116209883B (zh) | 2020-09-25 | 2021-09-13 | 振动解析系统和振动解析方法 |
| JP2022551891A JP7594599B2 (ja) | 2020-09-25 | 2021-09-13 | 振動解析システム、および振動解析方法 |
| KR1020237010195A KR20230073210A (ko) | 2020-09-25 | 2021-09-13 | 진동 해석 시스템, 및 진동 해석 방법 |
Applications Claiming Priority (2)
| Application Number | Priority Date | Filing Date | Title |
|---|---|---|---|
| JP2020160910 | 2020-09-25 | ||
| JP2020-160910 | 2020-09-25 |
Publications (1)
| Publication Number | Publication Date |
|---|---|
| WO2022065103A1 true WO2022065103A1 (ja) | 2022-03-31 |
Family
ID=80845354
Family Applications (1)
| Application Number | Title | Priority Date | Filing Date |
|---|---|---|---|
| PCT/JP2021/033498 Ceased WO2022065103A1 (ja) | 2020-09-25 | 2021-09-13 | 振動解析システム、および振動解析方法 |
Country Status (6)
| Country | Link |
|---|---|
| US (1) | US12590863B2 (https=) |
| JP (1) | JP7594599B2 (https=) |
| KR (1) | KR20230073210A (https=) |
| CN (1) | CN116209883B (https=) |
| TW (1) | TWI876094B (https=) |
| WO (1) | WO2022065103A1 (https=) |
Cited By (1)
| Publication number | Priority date | Publication date | Assignee | Title |
|---|---|---|---|---|
| JP7690635B1 (ja) | 2024-03-21 | 2025-06-10 | 株式会社バルカー | 解析システム、および解析方法 |
Families Citing this family (1)
| Publication number | Priority date | Publication date | Assignee | Title |
|---|---|---|---|---|
| EP4109274B1 (en) * | 2021-06-21 | 2024-01-03 | Tata Consultancy Services Limited | Method and system for predictive maintenance of high performance systems (hpc) |
Citations (6)
| Publication number | Priority date | Publication date | Assignee | Title |
|---|---|---|---|---|
| JP2004117253A (ja) * | 2002-09-27 | 2004-04-15 | Toshiba Corp | 製造装置及び回転機の寿命予測方法 |
| JP2005207644A (ja) * | 2004-01-21 | 2005-08-04 | Mitsubishi Electric Corp | 機器診断装置、冷凍サイクル装置、流体回路診断方法、機器監視システム、冷凍サイクル監視システム |
| CN105300692A (zh) * | 2015-08-07 | 2016-02-03 | 浙江工业大学 | 一种基于扩展卡尔曼滤波算法的轴承故障诊断及预测方法 |
| JP2017142153A (ja) * | 2016-02-10 | 2017-08-17 | セイコーエプソン株式会社 | 寿命予測方法、寿命予測装置、および寿命予測システム |
| JP2020134479A (ja) * | 2019-02-26 | 2020-08-31 | 日本電産株式会社 | 異常検出方法および異常検出装置 |
| WO2021090765A1 (ja) * | 2019-11-06 | 2021-05-14 | 株式会社日本製鋼所 | 異常検知装置、異常検知方法及びコンピュータプログラム |
Family Cites Families (16)
| Publication number | Priority date | Publication date | Assignee | Title |
|---|---|---|---|---|
| NL8202418A (nl) * | 1982-06-15 | 1984-01-02 | Philips Nv | Roentgenonderzoekapparaat. |
| JP3108405B2 (ja) | 1998-07-23 | 2000-11-13 | 核燃料サイクル開発機構 | 機器の診断方法 |
| JP2007128190A (ja) | 2005-11-02 | 2007-05-24 | Mitsubishi Electric Corp | 分類基準生成装置および異常判定装置および分類基準生成方法および分類基準生成プログラム |
| JP6359123B2 (ja) | 2015-01-21 | 2018-07-18 | 三菱電機株式会社 | 検査データ処理装置および検査データ処理方法 |
| JP6573838B2 (ja) | 2016-02-10 | 2019-09-11 | 株式会社神戸製鋼所 | 回転機の異常検知システム |
| JP6895816B2 (ja) | 2017-06-15 | 2021-06-30 | 株式会社 日立産業制御ソリューションズ | 異常診断装置、異常診断方法及び異常診断プログラム |
| JP6796562B2 (ja) | 2017-08-10 | 2020-12-09 | 公益財団法人鉄道総合技術研究所 | 代表データ選択装置、機器診断装置、プログラム及び代表データ選択方法 |
| CN111149129A (zh) | 2017-09-21 | 2020-05-12 | 株式会社安德科技术 | 异常检测装置及异常检测方法 |
| JP6887374B2 (ja) | 2017-12-27 | 2021-06-16 | 株式会社バルカー | 振動解析システム、および振動解析方法 |
| US11703845B2 (en) | 2018-07-06 | 2023-07-18 | Panasonic Intellectual Property Management Co., Ltd. | Abnormality predicting system and abnormality predicting method |
| CN108760327B (zh) | 2018-08-02 | 2019-12-13 | 南昌航空大学 | 一种航空发动机转子故障的诊断方法 |
| JP2020052460A (ja) | 2018-09-21 | 2020-04-02 | 東洋製罐グループホールディングス株式会社 | 異常検出システム、及び異常検出プログラム |
| KR102671538B1 (ko) | 2018-10-16 | 2024-05-31 | 주식회사 발카 | 시일 시공의 판정 시스템, 프로그램, 판정 방법 및 학습 시스템 |
| US11334414B2 (en) | 2019-03-04 | 2022-05-17 | Mitsubishi Heavy Industries, Ltd. | Abnormality detecting apparatus, rotating machine, abnormality detection method, and non- transitory computer readable medium |
| CN110542546B (zh) | 2019-08-21 | 2021-02-09 | 中国一拖集团有限公司 | 基于谐波分形分解快速算法的机械故障特征识别方法 |
| CN111259730B (zh) | 2019-12-31 | 2022-08-23 | 杭州安脉盛智能技术有限公司 | 一种基于多变量状态估计的状态监测方法及系统 |
-
2021
- 2021-09-13 CN CN202180065165.5A patent/CN116209883B/zh active Active
- 2021-09-13 JP JP2022551891A patent/JP7594599B2/ja active Active
- 2021-09-13 US US18/026,210 patent/US12590863B2/en active Active
- 2021-09-13 WO PCT/JP2021/033498 patent/WO2022065103A1/ja not_active Ceased
- 2021-09-13 KR KR1020237010195A patent/KR20230073210A/ko active Pending
- 2021-09-24 TW TW110135478A patent/TWI876094B/zh active
Patent Citations (6)
| Publication number | Priority date | Publication date | Assignee | Title |
|---|---|---|---|---|
| JP2004117253A (ja) * | 2002-09-27 | 2004-04-15 | Toshiba Corp | 製造装置及び回転機の寿命予測方法 |
| JP2005207644A (ja) * | 2004-01-21 | 2005-08-04 | Mitsubishi Electric Corp | 機器診断装置、冷凍サイクル装置、流体回路診断方法、機器監視システム、冷凍サイクル監視システム |
| CN105300692A (zh) * | 2015-08-07 | 2016-02-03 | 浙江工业大学 | 一种基于扩展卡尔曼滤波算法的轴承故障诊断及预测方法 |
| JP2017142153A (ja) * | 2016-02-10 | 2017-08-17 | セイコーエプソン株式会社 | 寿命予測方法、寿命予測装置、および寿命予測システム |
| JP2020134479A (ja) * | 2019-02-26 | 2020-08-31 | 日本電産株式会社 | 異常検出方法および異常検出装置 |
| WO2021090765A1 (ja) * | 2019-11-06 | 2021-05-14 | 株式会社日本製鋼所 | 異常検知装置、異常検知方法及びコンピュータプログラム |
Cited By (3)
| Publication number | Priority date | Publication date | Assignee | Title |
|---|---|---|---|---|
| JP7690635B1 (ja) | 2024-03-21 | 2025-06-10 | 株式会社バルカー | 解析システム、および解析方法 |
| WO2025197826A1 (ja) * | 2024-03-21 | 2025-09-25 | 株式会社バルカー | 解析システム、および解析方法 |
| JP2025144960A (ja) * | 2024-03-21 | 2025-10-03 | 株式会社バルカー | 解析システム、および解析方法 |
Also Published As
| Publication number | Publication date |
|---|---|
| JPWO2022065103A1 (https=) | 2022-03-31 |
| US20230332979A1 (en) | 2023-10-19 |
| TW202219470A (zh) | 2022-05-16 |
| JP7594599B2 (ja) | 2024-12-04 |
| TWI876094B (zh) | 2025-03-11 |
| CN116209883B (zh) | 2025-11-25 |
| US12590863B2 (en) | 2026-03-31 |
| KR20230073210A (ko) | 2023-05-25 |
| CN116209883A (zh) | 2023-06-02 |
Similar Documents
| Publication | Publication Date | Title |
|---|---|---|
| US11703845B2 (en) | Abnormality predicting system and abnormality predicting method | |
| US10228994B2 (en) | Information processing system, information processing method, and program | |
| US20170193395A1 (en) | Optimizing performance of event detection by sensor data analytics | |
| US20130148817A1 (en) | Abnormality detection apparatus for periodic driving system, processing apparatus including periodic driving system, abnormality detection method for periodic driving system, and computer program | |
| US8794976B2 (en) | Systems and methods for evaluating neurobehavioural performance from reaction time tests | |
| KR20150113700A (ko) | 진단 시스템 및 방법 | |
| JP7594599B2 (ja) | 振動解析システム、および振動解析方法 | |
| JP6887374B2 (ja) | 振動解析システム、および振動解析方法 | |
| EP2135144B1 (en) | Machine condition monitoring using pattern rules | |
| WO2002103297A1 (en) | Signal recorder with status recognizing function | |
| US8416086B2 (en) | Methods for improved forewarning of condition changes in monitoring physical processes | |
| JP2012002759A (ja) | 官能検査基準設定プログラム及び異音検査基準設定プログラム | |
| US20240369449A1 (en) | Abnormal sound determination apparatus | |
| US12111291B2 (en) | Structure diagnosis apparatus, structure diagnosis method, and computer-readable recording medium | |
| JP7375692B2 (ja) | 情報処理装置、情報処理方法、及び情報処理システム | |
| JP2023030903A (ja) | 環境監視システム | |
| CN119043699A (zh) | 螺丝锁附异常检测方法、装置、设备及存储介质 | |
| CN120417835A (zh) | 测量步态以检测损伤 | |
| JP7690635B1 (ja) | 解析システム、および解析方法 | |
| JP2020009325A (ja) | 異常検知プログラム、異常検知方法及び異常検知装置 | |
| WO2025187768A1 (ja) | 解析装置 | |
| CN121117887A (zh) | 一种设备故障确定方法和装置 | |
| CN119758055A (zh) | 断路器运行寿命监测方法、装置、设备及存储介质 | |
| CN110543505B (zh) | 一种基于时间序列数据的监测系统 | |
| KR20230021077A (ko) | 생체 내 기능 장애 및 이벤트를 예측하기 위한 장치 및 방법 |
Legal Events
| Date | Code | Title | Description |
|---|---|---|---|
| 121 | Ep: the epo has been informed by wipo that ep was designated in this application |
Ref document number: 21872233 Country of ref document: EP Kind code of ref document: A1 |
|
| ENP | Entry into the national phase |
Ref document number: 2022551891 Country of ref document: JP Kind code of ref document: A |
|
| NENP | Non-entry into the national phase |
Ref country code: DE |
|
| 122 | Ep: pct application non-entry in european phase |
Ref document number: 21872233 Country of ref document: EP Kind code of ref document: A1 |
|
| WWG | Wipo information: grant in national office |
Ref document number: 18026210 Country of ref document: US |