WO2022049620A1 - 検量システムおよび方法 - Google Patents
検量システムおよび方法 Download PDFInfo
- Publication number
- WO2022049620A1 WO2022049620A1 PCT/JP2020/033032 JP2020033032W WO2022049620A1 WO 2022049620 A1 WO2022049620 A1 WO 2022049620A1 JP 2020033032 W JP2020033032 W JP 2020033032W WO 2022049620 A1 WO2022049620 A1 WO 2022049620A1
- Authority
- WO
- WIPO (PCT)
- Prior art keywords
- peak
- measurement
- shape data
- spr
- data
- Prior art date
- Legal status (The legal status is an assumption and is not a legal conclusion. Google has not performed a legal analysis and makes no representation as to the accuracy of the status listed.)
- Ceased
Links
Images





Classifications
-
- G—PHYSICS
- G01—MEASURING; TESTING
- G01N—INVESTIGATING OR ANALYSING MATERIALS BY DETERMINING THEIR CHEMICAL OR PHYSICAL PROPERTIES
- G01N21/00—Investigating or analysing materials by the use of optical means, i.e. using sub-millimetre waves, infrared, visible or ultraviolet light
- G01N21/17—Systems in which incident light is modified in accordance with the properties of the material investigated
- G01N21/55—Specular reflectivity
- G01N21/552—Attenuated total reflection
- G01N21/553—Attenuated total reflection and using surface plasmons
-
- G—PHYSICS
- G01—MEASURING; TESTING
- G01N—INVESTIGATING OR ANALYSING MATERIALS BY DETERMINING THEIR CHEMICAL OR PHYSICAL PROPERTIES
- G01N21/00—Investigating or analysing materials by the use of optical means, i.e. using sub-millimetre waves, infrared, visible or ultraviolet light
- G01N21/17—Systems in which incident light is modified in accordance with the properties of the material investigated
- G01N21/25—Colour; Spectral properties, i.e. comparison of effect of material on the light at two or more different wavelengths or wavelength bands
- G01N21/27—Colour; Spectral properties, i.e. comparison of effect of material on the light at two or more different wavelengths or wavelength bands using photo-electric detection ; circuits for computing concentration
- G01N21/274—Calibration, base line adjustment, drift correction
Definitions
- Keiei Kudo "Basics and Methods of Spectroscopy", Ohmsha, published in 1985.
- K. Kurihara et al. "Asymmetric SPR sensor response curve-Rtting equation for theaccurate determination of SPR resonance angle", Sensors and Actuators B, vol. 86, pp. 49-57, 2002.
- K. Johansen et al. "Surface plasmon resonance: instrumental resolution using photodiode arrays", Measurement Science Technology, vol. 11, pp. 1630-1638, 2000.
- noise is mainly defined as noise generated from the imaging device itself.
- the proportion of noise components other than the noise generated by the measuring device itself is high.
- the parameters of the model function are set by optimizing the known model function by the least squares method or the like. You can ask.
- the model function is perfect, the residuals between the model function and the measured value are normally distributed regardless of the shapes that make up the peak.
- Non-Patent Document 1 the change in reflectance is obtained depending on the presence or absence of a substance.
- Non-Patent Document 2 the incident angle dependence of the p-polarized reflectance using the Fresnel multilayer film reflection equation.
- Non-Patent Document 2 a method of approximating using five parameters has been proposed. In either case, it is necessary to perform non-linear optimization, the parameters cannot be uniquely determined, and the parameters to be obtained depend on the calculation method of the optimization.
- Non-Patent Document 3 a method has been proposed in which the estimated section is limited to the vicinity of the peak and the estimated section is moved as the position of the peak moves in time. This method is one of the prior probability settings. However, even in this method, the estimated value may change discontinuously before and after the switching of the estimated interval occurs.
- the movement of the estimated section will process data from light receiving elements with different physical properties.
- the discontinuous change of the parameter becomes remarkable when the change of the peak position is small compared to the width of the estimated interval.
- the state where the change in the peak position is small compared to the width of the estimated interval is when the change in the refractive index is small or the change is slow.
- a method of further reducing the parameters and obtaining the graphic center of gravity In this method, a threshold value below the peak height is determined, and the average of peak positions weighted at the peak portion above the threshold value is calculated. This method ignores information about the height of the peak, but the position of the peak can be uniquely determined by a simple calculation. However, the threshold value needs to be calculated separately empirically in consideration of the noise level of the data and the physical configuration of the device.
- the conventional technique has a problem that in the measurement using the waveform data having a peak showing the characteristics of the measurement target as the measurement result, the measurement with less noise and high time resolution cannot be easily performed.
- the present invention has been made to solve the above problems, and it is easy to perform measurement with less noise and high time resolution in measurement using waveform data having a peak showing the characteristics of the measurement target as a measurement result.
- the purpose is to be able to carry out.
- the calibration system is an acquisition device that acquires peak-like shape data measured by a measurement method that can obtain waveform data having a peak indicating the characteristics of the measurement target as a measurement result, and a carunen leve that obtains the peak-like shape data. It is provided with an arithmetic device for reconstructing peak-like shape data using a part of a plurality of bases obtained by conversion.
- the peak-like shape data is converted into Carunenlebe, there is little noise and the time resolution is high in the measurement using the waveform data having the peak showing the characteristics of the measurement target as the measurement result. Measurement can be carried out easily.
- FIG. 1 is a configuration diagram showing a configuration of a calibration system according to an embodiment of the present invention.
- FIG. 2 is a flowchart for explaining a calibration method according to an embodiment of the present invention.
- FIG. 3 is a cross-sectional view showing the configuration of the measurement chip 200 of the measurement system used in Experiment 1.
- FIG. 4 is a configuration diagram showing the configuration of the measurement system used in Experiment 1.
- FIG. 5A is data showing the p-polarized reflectance at a specific time measured by the measurement system used in Experiment 1.
- FIG. 5B is data showing the reflectance of p-polarization, such as the reflectance of p-polarization at a specific position, measured by the measurement system used in Experiment 1.
- FIG. 5C shows the SPR angle calculated by applying the measurement result by the measurement system used in Experiment 1 to the quadratic curve near the peak position and obtaining the incident angle position giving the extreme value of the fitted quadratic curve.
- FIG. 6 is an explanatory diagram showing an example of an image obtained by the SPR device.
- FIG. 7A is a characteristic diagram showing the results of comparing the time change of the SPR angle by the calculation method by the second-order least squares method, the graphic center of gravity, and the KL transformation.
- FIG. 7B is a characteristic diagram showing the results of comparing the standard deviations of the SPR angles by the second-order least squares method, the graphic center of gravity, and the calculation method by the KL transformation.
- FIG. 6 is an explanatory diagram showing an example of an image obtained by the SPR device.
- FIG. 7A is a characteristic diagram showing the results of comparing the time change of the SPR angle by the calculation method by the second-order least squares method, the graphic center of gravity, and the KL
- FIG. 8 is a characteristic diagram showing the measurement results in Experiment 2 as the result of calculation by the quadratic least squares method and the graphical centroid method and the result calculated by KL transformation.
- FIG. 9 is a perspective view showing the configuration of the flow cell 300 used in Experiment 3.
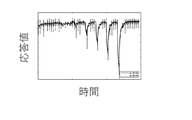
- FIG. 10A is a characteristic diagram showing changes in the response value for each event of liquid feeding in the measurement in Experiment 3.
- FIG. 10B is a characteristic diagram showing changes in the response value for each event of liquid feeding in the measurement in Experiment 3.
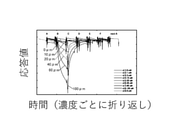
- FIG. 11 is a characteristic diagram showing a change in peak-like shape depending on the concentration, which is extracted from the measurement result in Experiment 3.
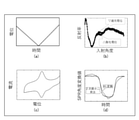
- FIG. 12A is a characteristic diagram showing an example of a complex p-polarized reflectance depending on the redox state of the observed SPR curve in the electrochemical SPR measurement.
- FIG. 12B is an explanatory diagram illustrating the electrochemical SPR measurement in Experiment 4.
- FIG. 13 is an explanatory diagram showing the procedure of electrochemical SPR measurement in Experiment 4.
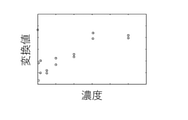
- FIG. 14 is a calibration curve obtained by plotting the time change rate of the glutamic acid concentration and the SPR response value based on the time change rate shown in the SPR response value obtained by the electrochemical SPR measurement in Experiment 4.
- This verification system includes an acquisition device 101 and an arithmetic unit 102.
- the acquisition device 101 acquires peak-like shape data measured by a measurement method that can obtain waveform data having a peak indicating the characteristics of the measurement target as a measurement result.
- the acquisition device 101 is a waveform data having a peak in which at least one of quantitative information (concentration) and qualitative information (physical properties, substance name, etc.) is shown as a feature of the measurement target as a measurement result for quantifying and qualitating the measurement target.
- the peak-like shape data measured by the measurement method obtained by the above is acquired.
- the acquisition device 101 can be a device (analyzer) that carries out the measurement of the measurement target.
- the arithmetic unit 102 reconstructs the peak-like shape data by using a part of the plurality of bases obtained by converting the peak-like shape data into Karunenlebe.
- the arithmetic unit 102 reconstructs the peak-like shape data using the first base, the second base, the third base, and the fourth base obtained by converting the peak-like shape data into Carunenlebe.
- the calibration method according to the embodiment of the present invention will be described with reference to FIG.
- the measurement was performed by a measurement method in which waveform data having a peak showing at least one of quantitative information and qualitative information as a feature of the measurement target can be obtained as a measurement result for quantifying and qualitating the measurement target. Acquire peak-like shape data.
- the peak-like shape data is reconstructed using a part of the plurality of bases obtained by converting the peak-like shape data into Carunenlebe.
- the peak-like shape data is reconstructed using the first base, the second base, the third base, and the fourth base obtained by converting the peak-like shape data into Carunenlebe. From the reconstructed peak-like shape data, for example, the feature amount is obtained from the position of the peak, the size of the peak, and the like, and the analysis of the measurement target is performed.
- the arithmetic unit 102 described above is a computer device including a CPU (Central Processing Unit), a main storage device, an external storage device, a network connection device, and the like.
- the arithmetic unit 102 which is a computer device, realizes the above-mentioned function (second step of the calibration method) by operating the CPU (execution of the program) by the program expanded in the main storage device.
- the above program is a program for a computer to execute the second step of the calibration method shown in the above-described embodiment.
- the network connection device connects to the network.
- the position of the peak shape can be determined from the obtained data without using a model function (Reference 1). ..
- KL Kosambi-Loeve transform
- data on the possible peak shape in the actual measurement system is acquired in advance.
- the data obtained by the measurement system is analyzed, and the weighted averaging of the data is performed so that the signal becomes the largest with respect to noise. This weight is determined from the peak-like shape data acquired in advance.
- the present invention can be a technique suitable for automation of the measurement system.
- the present invention relates to an apparatus comprising a data collection method necessary for measuring a peak-like shape using the KL conversion in this way.
- the refractive index of the liquid sample is obtained from the peak-like shape that appears in the image data of the reflectance with respect to the incident angle.
- data on peak-like shapes that can be taken in advance can be collected, and it can be used for rapid measurement in the measurement of the refractive index of a sample whose refractive index is unknown. It can be applied, has time resolution without time averaging, and can be uniquely calculated with low noise.
- the calculation load for obtaining quantitative information and qualitative information can be reduced, and for storage. The storage capacity of the data can be reduced.
- the measuring chip 200 shown in FIG. 3 was used.
- the measuring chip 200 is composed of a substrate 201 made of BK7 glass, an Au layer 202 having a film thickness of about 50 nm, and a flow path substrate 203.
- the Au layer 202 can be formed by a well-known deposition technique such as a sputtering method.
- the flow path substrate 203 includes a groove portion serving as a micro flow path 204, an introduction port 205, and a discharge port 206.
- the flow path substrate 203 can be formed from polydimethylsiloxane (PDMS). These may be formed, for example, by the well-known biopsy trepan. Further, the substrate 201 and the flow path substrate 203 were manufactured separately, and finally, the measurement chip 200 was assembled so that the microchannel 204 overlaps the measurement region.
- PDMS polydimethylsiloxane
- the bonded surfaces are brought into contact with each other and bonded. By combining them, both were integrated.
- a mini excimer manufactured by Ushio, Inc. was used as the ultraviolet light source.
- the irradiation time of ultraviolet rays was 5 seconds. It should be noted that the above-mentioned bonding can be carried out by using the double-sided tape in which the portion to be the flow path is hollowed out.
- an introduction port 205 for injecting the liquid to be measured (analyzed) was formed by a laser processing device.
- a pump 208 is connected to the discharge port 206 via a fluororesin tube 207, and the liquid in the micro flow path 204 can be towed (sucked) through the discharge port 206.
- a waste liquid tank 209 connected by a tube 207 is provided between the pump 208 and the discharge port 206.
- the pump 208 can be, for example, a Fluient (MFCS-EASY; the pump 208 can maintain a constant pressure below atmospheric pressure in the connected tube 207.
- the pump 208 can be a pump 208.
- the pressure at which the trigger signal from the dispensing device 214 is received and held constant can be changed programmatically.
- matching oil (not shown) having a refractive index equal to that of BK7 glass is applied on the measurement surface formed on the measurement prism of the SPR device 211, and the back surface of the substrate 201 of the measurement chip 200 is placed on the matching oil (not shown). do. Further, the measurement region of the measurement chip 200 is arranged so as to overlap with the optical axis of the light emitted from the light source of the SPR device 211.
- the SPR device 211 is, for example, "Smart SPR SS-100" manufactured by NTT Advanced Technology Corporation.
- the measurement area of the measurement chip 200 is arranged so as to overlap with the optical axis of the light emitted from the light source of the SPR device 211.
- the light emitted from the light source is collected in a line of a predetermined length by a cylindrical lens or the like and incident on the prism, and irradiates the measurement region of the measuring chip 200 in close contact with the measuring surface of the prism.
- An Au layer 202 is formed in the microchannel 204 which is a measurement region of the measurement chip 200, and the back surface of the Au layer 202 is irradiated with the condensed light transmitted through the measurement chip 200.
- the condensed light irradiated in this way is reflected on the back surface of the Au layer 202 in contact with the fluid whose flow velocity is to be measured, and is photoelectrically converted by a sensor consisting of an image pickup element such as a so-called CCD image sensor to increase the intensity (light intensity). Is obtained.
- the change in the refractive index is required by the change in the light intensity obtained in this way.
- the sensor is, for example, a line-type image sensor provided with a light receiving unit of 480 pixels, and enables multipoint refractive index measurement.
- a pipette master manufactured by Musashi Engineering Co., Ltd. was used as the dispensing device 214 for dispensing the liquid.
- the dispensing device 214 dispenses the sample prepared in the 96-well microplate 212 by the pipette 213, and supplies the separated sample to the introduction port 205.
- the dispensing device 214 can output a trigger signal during the dispensing operation of the piston of the pipette 213.
- the pressure by the pump 208 was sequentially changed by a predetermined program.
- the dispensing device 214 and the pump 208 are linked as described above and operate as shown below.
- the pump 208 is set to a negative pressure p5, the liquid in the microchannel 204 is replaced with air, and the inside of the microchannel 204 is dried. This is the initial state.
- the set pressure of the pump 208 is larger than the maximum surface tension (p1) generated at the inlet 205, which is the tip of the capillary tube by the microchannel 204, and the priming water that draws the volume of the liquid to be injected in the next step into the microchannel 204.
- the pressure p2 is set so that the suction time is 1 s or less.
- the dispensing device 214 injects the same volume of water as the volume in the microchannel 204 into the inlet 205. After 1 s of injection, the pressure of pump 208 is set to p1.
- the pressure of the pump 208 is set to p4 and the liquid in the flow path is discharged.
- p4 is the maximum pressure at which air does not get entangled in the microchannel 204 when 10 ⁇ L of water is continuously injected and discharged by the dispensing device 214.
- Water is continuously injected into the microchannel 204 by the dispensing device 214 to wash the microchannel 204. Inject water enough times and send a trigger at the last dispensing to bring the pressure to p5 to a pressure that can be set to the initial state where the microchannel 204 dries.
- P1 can be 750 Pa and p2 can be 3000 Pa.
- the refractive index measured in the measured portion of the SPR device 211 changes from the refractive index of water to the refractive index of the sample, and the data of the changing refractive index is recorded.
- the refractive index of the portion of the microchannel 204 over a length of 4.8 mm in the direction along the flow is measured 150 times per second at intervals of 10 ⁇ m.
- the p-polarized reflectance at a specific time shown in FIG. 5A was obtained as an image.
- the vertical axis is the position in the flow direction
- the horizontal axis is the incident angle
- the p-polarized reflectance is shown by contour lines.
- the reflectance of p-polarization was obtained as an image like the reflectance of p-polarization at a specific position shown in FIG. 5B.
- the vertical axis is the angle of incidence
- the horizontal axis is time
- the p-polarization reflectance is shown by contour lines. 150 pieces of this two-dimensional data can be obtained per second.
- the SPR angle calculated by applying it to a quadratic curve near the peak position and obtaining an incident angle position that gives the extreme value of the fitted quadratic curve is specified in FIG. 5C. It is shown in the p-polarized reflectance at the time and position of.
- the incident angle that becomes the maximum peak point is obtained, and then the incident angle that gives the extreme value of the peak position is obtained by the least squares method using 17 points before and after the obtained angle. Therefore, when the peak maximum point moves by one pixel width or more, data from different light receiving units (pixels) of the image sensor is calculated.
- a threshold value is set for the reflectance, and the SPR angle is calculated by a method of calculating the average position, assuming that the value exceeding the threshold value is heavy for the incident angle showing a reflectance larger than the set threshold value. I asked.
- a value that correlates with the concentration was calculated using the KL conversion. The procedure is as follows.
- the image (FIG. 6) obtained by the SPR device is stored in the array qy of the reflection intensity at the incident angle q and the position y in the flow direction. Further, continuous images every 1/150 second of this image are stored in qyt as an array of time t.
- the array qt is two-dimensional. This two-dimensional array is rearranged in one dimension so that the incident angles are continuous and the repetition is continuous in time, and this is used as the original signal a.
- the original signal a is a one-dimensional array whose length is time x incident angle width.
- the original signal a is KL decomposed.
- singular value decomposition is used.
- b U * V * D.
- U is an orthogonal matrix and the column vector of U is an orthonormal basis.
- V is a diagonal matrix whose singular value is a diagonal component, and D is an orthogonal matrix.
- the array b is a deviation from the average value of the original signal a.
- the singular value decomposition svd can be calculated by a known method described in Reference 2 and the like.
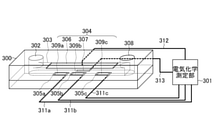
- functional layers 309a, 309b, 309c are formed on the working electrodes 305a, 305b, 305c.
- the functional layer 309b is composed of an enzyme-fixed layer on the side of the working electrode 305b and a mediator layer formed on the enzyme-fixed layer.
- Each functional layer is composed of different enzyme fixation layers and mediator layers.
- the microchannel chip (flow cell) with an electrochemical electrode having a working electrode modified with a polymer having an osmiumbipyridyl (osmiumbipyridine) side chain used in Experiment 4 is the best working. Further, glutamate oxidase was immobilized on the. The concentration of the enzyme substrate (glutamic acid) was measured with this enzyme-modified electrode by a method of reading out by the SPR method.
- the change in potential of the working electrode with respect to the counter electrode in the electrochemical measurement using the working electrode, reference electrode, and counter electrode of the solution to be measured can be measured as the change in the refractive index of the solution by the surface plasmon resonance method. ..
- a potential program is used that makes it easy to estimate the potential start time from the data of the SPR device, such as pulsing the potential or instantly starting the potential control.
- Cyclic voltammetry was performed with a change in potential as in the potential program shown in FIG. 12B (a). As a result, osmium ions having a small peak separation and symmetric with respect to the current axis, which are characteristic of surface reactions as a current response. [(C) of FIG. 12B] cyclic voltammetry showing the redox of the above was obtained. In the SPR measurement measured at the same time, as shown in FIG. 12B (b), the change g2 of the incident angle-reflectance curve was obtained. Since the potential of the working electrode scans both sides of the redox potential of the osmium ion, g2 includes the entire state of the redox state of the osmium ion on the electrode.
- this electrode was charged and discharged at a constant current to quantify the substrate for the enzymatic reaction.
- an experiment was performed by a method of measuring the potential from the incident angle-reflectance data obtained by the SPR device.
- the following program was used so that the refractive index change of the immobilized layer could be properly learned by the KL transformation. ..
- Step 6 the potentiostat is set to the current regulation mode with a current of 3 nA.
- the current from the electrode oxidizes the osmium ions at a constant rate defined by the current, and the electrode potential increases accordingly.
- this potential exceeds 0.3V, it is programmed to invert the positive and negative of the current.
- HRP is oxidized by the reaction of HRP and hydrogen peroxide, this HRP reacts with reduced osmium ions, and the immobilized osmium ions are gradually oxidized. Along with this, the potential rises, and the signal measured by the SPR method also changes to a signal in a redox state.
Landscapes
- Physics & Mathematics (AREA)
- Health & Medical Sciences (AREA)
- Life Sciences & Earth Sciences (AREA)
- Chemical & Material Sciences (AREA)
- Analytical Chemistry (AREA)
- Biochemistry (AREA)
- General Health & Medical Sciences (AREA)
- General Physics & Mathematics (AREA)
- Immunology (AREA)
- Pathology (AREA)
- Engineering & Computer Science (AREA)
- Mathematical Physics (AREA)
- Theoretical Computer Science (AREA)
- Spectroscopy & Molecular Physics (AREA)
- Investigating Or Analysing Materials By Optical Means (AREA)
Priority Applications (3)
| Application Number | Priority Date | Filing Date | Title |
|---|---|---|---|
| PCT/JP2020/033032 WO2022049620A1 (ja) | 2020-09-01 | 2020-09-01 | 検量システムおよび方法 |
| US18/041,050 US20240011905A1 (en) | 2020-09-01 | 2020-09-01 | Calibration System and Method |
| JP2022546738A JPWO2022049620A1 (https=) | 2020-09-01 | 2020-09-01 |
Applications Claiming Priority (1)
| Application Number | Priority Date | Filing Date | Title |
|---|---|---|---|
| PCT/JP2020/033032 WO2022049620A1 (ja) | 2020-09-01 | 2020-09-01 | 検量システムおよび方法 |
Publications (1)
| Publication Number | Publication Date |
|---|---|
| WO2022049620A1 true WO2022049620A1 (ja) | 2022-03-10 |
Family
ID=80491775
Family Applications (1)
| Application Number | Title | Priority Date | Filing Date |
|---|---|---|---|
| PCT/JP2020/033032 Ceased WO2022049620A1 (ja) | 2020-09-01 | 2020-09-01 | 検量システムおよび方法 |
Country Status (3)
| Country | Link |
|---|---|
| US (1) | US20240011905A1 (https=) |
| JP (1) | JPWO2022049620A1 (https=) |
| WO (1) | WO2022049620A1 (https=) |
Citations (3)
| Publication number | Priority date | Publication date | Assignee | Title |
|---|---|---|---|---|
| US4951266A (en) * | 1989-04-28 | 1990-08-21 | Schlumberger Technology Corporation | Method of filtering sonic well logging data |
| JP2001194298A (ja) * | 1999-10-28 | 2001-07-19 | Nippon Telegr & Teleph Corp <Ntt> | 表面プラズモン共鳴酵素センサーおよび表面プラズモン共鳴の測定方法 |
| JP2005024483A (ja) * | 2003-07-01 | 2005-01-27 | Nippon Telegr & Teleph Corp <Ntt> | バイオセンサー |
Family Cites Families (2)
| Publication number | Priority date | Publication date | Assignee | Title |
|---|---|---|---|---|
| US6649361B1 (en) * | 1999-10-28 | 2003-11-18 | Nippon Telegraph And Telephone Corporation | Surface plasmon resonance enzyme sensor |
| US20150011894A1 (en) * | 2011-12-19 | 2015-01-08 | The Regents Of The University Of California | System for and method of quantifying on-body palpitation for improved medical diagnosis |
-
2020
- 2020-09-01 US US18/041,050 patent/US20240011905A1/en not_active Abandoned
- 2020-09-01 JP JP2022546738A patent/JPWO2022049620A1/ja active Pending
- 2020-09-01 WO PCT/JP2020/033032 patent/WO2022049620A1/ja not_active Ceased
Patent Citations (3)
| Publication number | Priority date | Publication date | Assignee | Title |
|---|---|---|---|---|
| US4951266A (en) * | 1989-04-28 | 1990-08-21 | Schlumberger Technology Corporation | Method of filtering sonic well logging data |
| JP2001194298A (ja) * | 1999-10-28 | 2001-07-19 | Nippon Telegr & Teleph Corp <Ntt> | 表面プラズモン共鳴酵素センサーおよび表面プラズモン共鳴の測定方法 |
| JP2005024483A (ja) * | 2003-07-01 | 2005-01-27 | Nippon Telegr & Teleph Corp <Ntt> | バイオセンサー |
Non-Patent Citations (3)
| Title |
|---|
| ISHIKAWA, TOMIHISA: "Clinical application of Karhunen-Loeve unfolding of body surface mapping. Its application to old infarctions of anterior wall and septum, Electrocardiogram", KARHUNEN-LOEVE, vol. 7, no. 1, 1987, pages 57 - 63 * |
| MITSCHANG, L. ; CIESLAR, C. ; HOLAK, T.A. ; OSCHKINAT, H.: "Application of the Karhunen-Loeve transformation to the suppression of undesired resonances in three-dimensional NMR", JOURNAL OF MAGNETIC RESONANCE., ACADEMIC PRESS, LONDON., GB, vol. 92, no. 1, 1 March 1991 (1991-03-01), GB , pages 208 - 217, XP023961331, ISSN: 0022-2364, DOI: 10.1016/0022-2364(91)90264-T * |
| OISHI, SATORU: "Signal processing using Karhunen- Loeve expansion for wafer focus measurement in lithography", JAPANESE JOURNAL OF APPLIED PHYSICS, vol. 50, no. 6S, 30 November 2010 (2010-11-30), JP , pages 06GJ06 - 06GJ06-6, XP009535185, ISSN: 0021-4922, DOI: 10.7567/jjap.50.06gj06 * |
Also Published As
| Publication number | Publication date |
|---|---|
| US20240011905A1 (en) | 2024-01-11 |
| JPWO2022049620A1 (https=) | 2022-03-10 |
Similar Documents
| Publication | Publication Date | Title |
|---|---|---|
| US12007328B2 (en) | Determining extracellular analyte concentration with nanoplasmonic sensors | |
| EP2158474B1 (en) | Method using a grating-based sensor combining label-free binding detection and fluorescence amplification | |
| US6961490B2 (en) | Waveguide plate and process for its production and microtitre plate | |
| US7960170B2 (en) | Grating-based sensor combining label-free binding detection and fluorescence amplification and readout system for sensor | |
| JP4897054B2 (ja) | 流速測定装置、抗原濃度測定装置、流速測定方法、抗原濃度測定方法 | |
| Murugan et al. | Recent advances in grating coupled surface plasmon resonance technology | |
| EP3121587A1 (en) | Device and method for detecting biomarkers | |
| Wang et al. | Ultrafast surface plasmon resonance imaging sensor via the high-precision four-parameter-based spectral curve readjusting method | |
| JP4455362B2 (ja) | 全反射減衰を利用した測定装置 | |
| JP4812393B2 (ja) | 蛍光分子計測システム | |
| Wong et al. | Two-dimensional biosensor arrays based on surface plasmon resonance phase imaging | |
| KR102917159B1 (ko) | 머신러닝 기반의 액상시료 정량 분석 알고리즘을 탑재한 고집속 고감도 형광검출 스캐닝 시스템 | |
| WO2022049620A1 (ja) | 検量システムおよび方法 | |
| CN2758753Y (zh) | 多通道表面等离子共振影像传感器 | |
| US20220317028A1 (en) | Method and device for analysing a sample, implementing a resonant support | |
| KR20230155542A (ko) | 적어도 하나의 기생 화학 종을 함유하는 기체 샘플에 존재하는 분석물의 특성화 방법 | |
| EP3980749B1 (fr) | Procédé et dispositif d'analyse d'un échantillon, mettant en oeuvre un support résonant, illuminé par un rayonnement infra-rouge | |
| Ward et al. | Sensor response-time reduction using long-short term memory network forecasting | |
| KR20250065431A (ko) | 표면 거칠기 및 방사율 결정 | |
| US9791375B2 (en) | Light measuring apparatus employing optical electric field enhancing device | |
| Wang et al. | Optimizing surface plasmon resonance spectral imaging through AOTF-calibrated light sources and image feedback | |
| Rodríguez-Franco et al. | Fabrication of broad area optical nanostructures for high throughput chemical sensing | |
| Sun et al. | Resonance plasmonic gold microwell arrays for high-performance surface plasmon resonance imaging based on polarization contrast modulation | |
| Southall | Development and Evaluation of Multi-Camera Particle Tracking Techniques | |
| LEBYEDYEVA et al. | and COMPUTER TECHNOLOGIES |
Legal Events
| Date | Code | Title | Description |
|---|---|---|---|
| 121 | Ep: the epo has been informed by wipo that ep was designated in this application |
Ref document number: 20952360 Country of ref document: EP Kind code of ref document: A1 |
|
| ENP | Entry into the national phase |
Ref document number: 2022546738 Country of ref document: JP Kind code of ref document: A |
|
| WWE | Wipo information: entry into national phase |
Ref document number: 18041050 Country of ref document: US |
|
| NENP | Non-entry into the national phase |
Ref country code: DE |
|
| 122 | Ep: pct application non-entry in european phase |
Ref document number: 20952360 Country of ref document: EP Kind code of ref document: A1 |